The Characteristics of SMEs Preferring Cooperative Research and Development Support from the Government: The Case of Korea


1
Division of Data Analysis, Korea Institute of Science and Technology Information (KISTI), 66, Hoegi-ro, Dongdaemun-gu, Seoul 02456, Korea
2
Science and Technology Management Policy, University of Science and Technology, 66, Hoegi-ro, Dongdaemun-gu, Seoul 02456, Korea
*
Author to whom correspondence should be addressed.
Sustainability 2018, 10(9), 3048; https://doi.org/10.3390/su10093048
Submission received: 6 July 2018
/
Revised: 9 August 2018
/
Accepted: 23 August 2018
/
Published: 27 August 2018
(This article belongs to the Special Issue Sustainability of Economy, Society, and Environment in the 4th Industrial Revolution)
Abstract
:To find ways to make the government’s cooperative research and development (R&D) support policy for small and medium enterprises (SMEs) more effective, we analyzed the characteristics of SMEs that prefer such support. Through decision tree and discriminant analysis of 3300 Korean SMEs, we derived rules to distinguish between groups that prefer cooperative R&D support and those that do not. Based on the results, the important influencing factors were found to be the time required for R&D planning, prior experience in cooperation, the availability of equipment, the ratio of self-procured R&D funding, the attempts at R&D and the firm’s level of performance. The results suggested that if the policy objective is to encourage more active involvement of SMEs in cooperative R&D support programs, it is desirable to attract SMEs with less cooperative experience and not to give too much weight to past achievements when selecting beneficiaries. Furthermore, we believe that policies offering supports in the R&D planning stage and the joint utilization of equipment could be solutions to reduce the practical difficulties experienced by SMEs related to cooperative R&D.
1. Introduction
Due to the growing emphasis on the importance of technology in the market, firms are engaging in more diversified forms of research and development (R&D). In the past, R&D mainly consisted of in-house R&D within the organization but due to the growing urgency of achieving efficiency and sustainability in innovation, firms now need to engage in technological innovation in collaboration with other external R&D organizations [1]. In-house R&D is strategically advantageous for protecting the firm’s knowhow and although the firm may be required to invest a lot of resources, it will become the exclusive beneficiary of any successful outcomes of in-house R&D [2]. Meanwhile, R&D in collaboration with external parties may have the advantage of lowering the level of resources input into technology development and decrease the risk and uncertainty involved in the investment [3]. Furthermore, various changes in the business environment, such as the development of information technology, globalization, the advancement and increasing convergence of technologies and the shortening of product life spans, have encouraged firms to pursue cooperative R&D to benefit from the influx of innovative ideas and utilize technologies originating from external entities and many studies have empirically demonstrated the positive effects of such collaboration [4,5,6,7,8].
From a macro-economic perspective, such R&D activities by firms have been found to be a strong boost to the national economy and industrial competitiveness [9,10]. In response, many governments have adopted supportive policies to strategically strengthen their national technology competitiveness, in the form of offering firms tax relief or assistive funding and providing firms with information or manpower and these governmental policies have indeed achieved significant results [11]. Such governmental intervention has given practical support to small and medium enterprises (SMEs) or start-up firms in their efforts at innovation, by providing them with the human resources, funding, or technology that are lacking within these firms [12,13]. It has been argued that governmental R&D subsidies are particularly effective for reducing the burden and risks firms experience when venturing into R&D and that the subsidies stimulate the firms’ innovative activities and improves their business performance [14,15]. Furthermore, there have been studies showing that governmental support not only helps firms’ in-house R&D but also boosts their cooperative R&D in relation with external organizations [16,17,18,19].
From the perspective focusing on resources, efficient allocation of resources is critically important to achieve maximum outcomes while utilizing limited resources [20]. Therefore, the efficient allocation of R&D subsidies is critically important to encourage firms and research organizations in one’s country to pursue innovation and ultimately to strengthen national technological competitiveness. If, in the process of allocating R&D subsidies, the government gives support to cooperative R&D rather than in-house R&D, it will benefit a larger number of R&D organizations. Also, it will promote the positive effects that accompany open innovation and thereby enhance the efficiency of governmental support [14,21,22,23]. For this reason, governments have chosen to invest heavily in cooperative R&D support: for example, in the Republic of Korea, more than 30% of the total budget for supporting the R&D of SMEs has been allocated to projects that mandatorily include cooperation with external organizations [24].
However, according to a recent survey of SMEs in the Republic of Korea, SMEs do not perceive a strong need for governmental support policies designed to encourage cooperative R&D through the collaboration of the industry with academia and research sectors [25]. When SMEs were asked whether they would prefer R&D subsidies for in-house R&D or for cooperative R&D, 57.5% of the surveyed firms responded that they would prefer the government to subsidize in-house R&D. The major challenges that the SMEs experienced when conducting in-house R&D included insufficient funding (25.4%), difficulty of securing human resources expert in technology (24.6%), lack of equipment (20.3%) and insufficient access to technological information (15.6%). Cooperative R&D with government-funded research institutes and universities can significantly alleviate the problems of the shortage of human resources, equipment and information. Governmental support designed to stimulate such cooperative R&D can also help the firms secure funding. The fact that, despite these advantages, the majority of firms professed to prefer in-house R&D support is the reason we must reassess the current governmental policies intended to promote cooperative R&D by SMEs.
How can we improve the effectiveness of policies supporting cooperative R&D by SMEs? If the objective is to encourage more SMEs to participate actively in cooperative R&D support programs, what would be the desirable means to induce such participation? To find the answer, it is imperative to understand the conditions that cause SMEs to hesitate from undertaking collaboration with external parties or identify the factors that inversely encourage such collaboration. This analysis will pinpoint the specific conditions that help us identify which firms the government should directly target when establishing a policy to stimulate cooperative R&D by SMEs. It will also present suggestions on how the government’s cooperative R&D support can be more effective. In this study, we profiled the SMEs that prefer cooperative R&D support to determine the characteristics that differentiated them from SMEs that prefer in-house R&D support. In addition, we proposed a discriminating model that distinguishes these two groups. From the results, we derived policy suggestions related to the direction of the cooperative R&D support program and the selection of beneficiaries to enhance the efficiency of the program.
2. Theoretical Background and Preceding Research
2.1. The Effects of Technological Cooperation with External Parties on the Innovative Performance of SMEs
Innovative activities can be classified into internal and external activities based on the source of the knowledge that generates innovation. Internal activities refer to innovations achieved by performing self-initiated R&D activities through in-house R&D, using a firm’s internal resources to perform R&D. By contrast, external innovative activities strategically access and obtain innovation-creating knowledge and these strategies may include licensing, joint ventures, strategic alliances and mergers and acquisitions [2,3]. In fact, most firms adopt an ambidextrous strategy, combining internal and external R&D as needed, to pursue a balanced approach to innovation. In the past, firms mainly focused on internal innovative activities, including in-house R&D, because this approach had strategic advantages for protecting the firm’s internal technologies and when successful, the firms became the exclusive beneficiary of the R&D outcomes. In other words, since the innovations developed by in-house R&D have appropriability, they strongly contributed to sustaining the firm’s competitive advantage. However, in recent years, as technology grew in complexity and competition intensified due to the expansion of the global market, the advantages of in-house R&D have been offset by other issues. Due to the rapid changes in the business environment, the lifespan of products has become shorter, while the cost of technology development has continued to increase, exacerbating the uncertainty of returns on investment. Consequently, firms have seen limited outcomes from internal innovative activities and effectively utilizing innovative ideas and technologies from external sources has become critically important [3], with more and more firms adopting this open approach to innovation.
Most studies about open innovation have focused on analyzing how factors such as the number of channels of cooperation, the types of cooperating partners, the level and frequency of cooperation and the duration of cooperation affect a firm’s technology innovation performance. Of course, most of the firms analyzed were composed of SMEs. Although the reported findings showed contingency effects according to the factors, many empirical studies have concluded that open innovation has positive effects on performance. For example, upon analyzing 3400 firms in Austria, Rogers found that building a network through cooperation with external organization affects the focal firm’s ability to achieve innovation and the author’s analysis showed that this effect was subject to a positive moderation effect based on the size of the firm [4]. Notably, small manufacturing firms demonstrated a positive correlation between using networks and innovation. Faems et al. analyzed Belgian manufacturing firms including SMEs and found evidence of a positive association between inter-organizational collaboration and innovative performance [6]. In addition, the authors concluded that firms that engage in cooperative activities with a variety of institutions tend to have increased sales. Amara and Landry researched Canadian firms and demonstrated that having a wider variety of information sources for innovation had a significant effect on developing innovations considered as premieres [5]. From the analysis results, the authors derived the policy implication that the novelty of innovation could be improved by promoting stronger linkages between firms and government laboratories and universities. Yun et al. also reported that the open innovation of a company had a positive effect on sustainable growth [26,27,28,29,30,31]. Laursen and Salter’s research on 2707 firms including SMEs in the United Kingdom indicated that when the number of external sources of information multiplies and the degree to which they are utilized increases to a certain level, there would be a corresponding improvement in the firm’s technological innovation performance [7]. When these activities exceeded a certain level, however, the researchers found that the innovative performance inversely decreased, which corroborated the results obtained by Katila and Ahuja [32]; their study also claimed that, in the case of radical innovation, the number of external sources of information did not have a large impact on innovative performance. Hottenrott and Lopes-Bento’s study on 2735 firms in Germany found that increasing the share of collaborative R&D is associated with a higher probability of product innovation and with a higher market success of new products [8]. However, when the collaboration intensity rises above a certain threshold, a negative return could be generated, though smaller and resource-constrained firms could benefit from the relatively higher intensities. As for potential drawbacks of collaborative R&D, the authors mentioned the cost of coordination and monitoring, requiring knowledge disclosure and building up trust.
Of course, some have argued that they did not find empirical evidence that cooperation with the external parties had positive effects, or argued that the cooperation has a negative effect. More specific assertions have been made regarding the type of institutions engaged in cooperation. First, many studies have shown that vertical cooperation with suppliers and customers positively affects the development of new products as well as the success of technology commercialization, because it provides a chance to acquire knowledge and applicable know-how of market opportunities as well as the components that make up the product [6,33,34,35]. On the other hand, however, researchers have also found that there are negative or insignificant relationships between the vertical collaborations and innovation performance [36,37,38,39,40,41]. As for collaboration with competitors, researches have shown that such collaboration can create synergies and generate positive effects because firms can solve their common problems together [39,42]. However, other studies found that collaboration with competitors has a negative or insignificant impact on innovation performance [33,35,40]. There were also conflicting research results on collaborations with universities and research institutions [6,33,40,41,43,44,45] and there has also been a claim that firm-related factors such as absorptive capacity should be considered as possible reasons for these contingency effects [46].
2.2. The Factors That Stimulate the Technology Cooperation of SMEs
There have been many studies analyzing the factors that influence how SMEs choose to engage in technology cooperation with external parties. These studies mainly analyzed whether technological factors and firm-related factors affected technological cooperation. First, regarding technological factors, researchers found that there will be more active technological cooperation in cases belonging to high-tech industries, involving complex technology and in cases where the innovation has a high level of significance [35,42,47,48,49]. Also, firms will be induced to participate in technological cooperation when they need basic knowledge or when there is a higher cost or risk involved in the innovation [48]. Firms can share the cost of R&D and resources through such cooperation [35]. Regarding the factors related to characteristics of the firm, studies have found that when a firm is larger in size and has the capacity to conduct its own R&D using its human resources and funding and has a larger absorptive capacity, it is more likely to engage in technological cooperation [35,47,48,50,51]. Prior experience cooperating with external organizations was also found to be a key factor that stimulates technological cooperation [49]. Mukherjee et al. published research showing that environmental uncertainty and knowledge intensity deter SMEs from engaging in cooperative R&D [52]. However, overall trust in the partner lowers the impact of the above factors and encourages collaboration. Researchers have also found that among the various groups of factors, the firm-related factors were the ones that had the greatest impact [35,42]; therefore, firm-related factors have been the subject most often analyzed in preceding studies. On the other hand, support from the public sector, such as governmental support, was found to stimulate the technological cooperation of firms [16,17,18,19,35]; this point will be discussed further in the next subsection.
2.3. The Effects of Governmental Support on the Technology Cooperation of SMEs
From an economic perspective, governmental supports are intended to intervene against the inefficient allocation of resources caused by the incompleteness of the market itself and redress market failure [53]. Since technological innovation activities are accompanied by uncertainty and risk, it is difficult for firms to undertake such investment with a strong initiative. Also, most firms are SMEs that have limited human and material resources compared to large firms and are thus restricted in their ability to invest adequately in R&D [54]. Consequently, if countries rely only on the voluntary investments made by firms, the level of technological innovation attained by these firms will fail to meet market demand and it will be unlikely that there will be innovative activities in fields that involve a high degree of investment uncertainty, such as basic science research. Therefore, it has been argued that the government ought to solve this problem of market failure by supplementing or substituting for the private sector in areas where it is difficult or inefficient for firms to perform the role. While some have counter-argued that government failure may occur because governmental intervention cannot guarantee efficient allocation of resources [55], on the other hand, a theory of system failure has emerged, supporting the claim that the government must intervene in identifying incompleteness in the complex mechanism of the technological innovation system and play a role in redressing the shortcomings of this process [56]. System failure can particularly provide greater additional effects to technological cooperation of SMEs [57,58,59], those are well-connected with innovation systems and it has more to do with public support for cooperative R&D than that for private R&D. In addition, system failure also contribute to the contingency effect of technology collaboration of SMEs on innovation performance, because not all the SMEs are able to be a beneficiary of governmental support.
In this context, governments provide firms with support in the form of tax exemptions and subsidies and supply of information and human resources to help them continue investing in R&D and achieve technological innovations more effectively [11]. Many preceding studies have emphasized assistance in the form of funding and human resources as the leading examples of governmental support for technological innovation by firms and many preceding studies have thus focused on subsidies [60,61,62]. Regarding the effects, there have been many studies showing that governmental R&D subsidies generate an additionality effect, stimulating innovative activities and R&D investments by firms and improving innovation performance [14,15,18,63,64,65]. By contrast, there have been such claims that government support for innovative firms are just used as a substitution for the firms’ own R&D investment and does not induce additional innovative activities; some have even argued that it reduces efficiency in the overall utilization of R&D funding [66,67,68].
However, there are several studies showing that government support has a positive impact in terms of promoting cooperative R&D by firms. Sakakibara and Cho reported that governmental support policies not only stimulate firms’ internal innovative activities but also stimulate cooperative activities with other organizations [16]. Hinloopen reported that governmental support policies spur the formation of a cooperative network among firms [17]. Czarnitzki et al. also reported that governmental subsidies enhance R&D efficiency and reinforce the spillover effect that arises from cooperation among firms [18]. Busom and Fernandez-Ribas reported that governmental support mitigates the factors that inhibit cooperation and multiply opportunities for cooperation [19]. In addition, the authors noted that governmental support increases opportunities for private/public cooperation for firms and the possibility of cooperation with other private firms increases when firms possess tacit knowledge.
On the other hand, there have also been researches on the effect of government support on firms performing collaborative R&D. Links et al. reported that government financial support for firms conducting collaborative research induces additional privately financed research joint ventures through the spillover mechanism [21]. Czarnitzki et al. analyzed the case of Germany and Finland and found that government support promotes cooperative R&D of firms and additional incentives for the cooperative R&D improve innovative performance [14]. Hottenrott et al. reported that public subsidies targeting internationally collaborating firms triggered R&D spending of the firms and the effect is greater for SMEs in particular [23]. Broekel derived subsidies for R&D cooperation of firms as a suitable policy to promote regional innovation efficiency [22]. Schwatz analyzed subsidized R&D cooperation projects and found that projects involving large firms or universities were positively related to outcomes such as patent applications [69]. Recently, Bellucci et al. compared the performance of two subsidy programs in Italy, one supporting SMEs’ individual R&D and the other supporting collaborative R&D between SMEs and universities [70]. Both programs resulted in positive effects on the SMEs’ R&D activity but the effect of support for collaborative R&D was weaker. The authors stated that public funding for collaborative R&D is an important but complex policy and that more careful consideration is needed to promote effective R&D partnership formation. Caloffi et al. also comparatively evaluated public subsidies for collaborative R&D and in-house R&D of SMEs [71]. According to the results, the support policy for cooperative R&D stimulated R&D investment of less innovative SMEs and promoted networking of non-collaborative SMEs. Based on these findings, the authors drew the policy implications that in order to increase the number of SMEs performing R&D, cooperative R&D support should be provided for SMEs with low R & D experience.
3. Materials and Methods
3.1. Analysis Data
For our research, we used the results of the “8th Statistical Survey of the Technologies of Small or Medium Enterprises,” published in 2015, a survey jointly conducted by the Small and Medium Business Administration of the Republic of Korea and the Korea Federation of SMEs (KBIZ). The population of this survey consisted of 43,204 SMEs engaged in technology development, with the number of employees ranging from 5 or more to less than 300 (34,745 of these firms were in manufacturing and 8459 were in non-manufacturing fields). A total sample of 3300 firms was extracted for the first stratification considering the industry and the size of workers and then extracting for second stratification according to the region. Surveyors visited these firms to survey their technology development activities, current organization and human resources, current investments, technological level and competitiveness, available equipment, performance in technology development, conditions of technology protection and so forth. The period covered by the survey was from 1 January 2014 to 31 December 2014, and the survey itself was conducted from June to October in 2015. [25].
According to the survey results, the average number of employees in the surveyed SMEs was 32.1. Analyzed by size, the largest percentage of firms had between 5 and 19 employees (55.1%), followed by firms with between 20 and 49 employees (28.5%) and thus 83.6% of the total consisted of small firms with less than 50 employees. The average years the firms were in business was 12.9 years: as for the distribution based on the number of years in business, the largest percentage consisted of firms that had been in business 5 to 10 years (25.6%), followed by those in business 10 to 15 years (23.9%) and 10 to 20 years (19.5%). [25].
3.2. Analysis Methodology
As the size of economic statistical data grows bigger and the demand for more effective understanding of the complex relationship between variables increases, data mining is attracting more attention as a new technique of econometrics [72]. Machine learning techniques such as decision trees, neural networks, support vector machines and deep learning are advantageous for analyzing more complex and bigger data than conventional statistical techniques such as regression. In particular, these data mining techniques help to derive potential key variables from a wide variety of candidate variables.
The main methods of research used in the study were decision tree analysis and discriminant analysis. Decision tree analysis is one of the forecasting modeling methods used mainly in statistics and data mining: this method predicts the values of dependent variables using a few independent variables. Depending on the characteristics of the dependent variable, the trees can be divided into classification trees and regression trees [73]. Since this study was designed to determine whether a firm prefers cooperative R&D support, we used classification tree analysis. Decision tree analysis is one of the most widely used classification methods in the field of supervised learning; the learning data is repeatedly partitioned using a recursive method, undergoing a process of learning that divides appropriate subsets to determine a classification rule. We can generally determine whether a partition is fitting by assessing the homogeneity of the dependent variables within the subset, which can be measured by the Gini impurity index, information gain and the reduction of variance through statistical verifications [74]. By applying the classification rule to a new case, we can predict the class to which it belongs. One of the great advantages of decision tree analysis is that the results are intuitive to interpret and that all types of data, including categorical data and continuous data, can be used without processing. Discriminant analysis is another method of classification and is widely used to perform profiling to identify the major factors that distinguish groups of categorical dependent variables and to predict the category of a new case. Discriminant analysis has been widely used mainly in the fields of business management and medical studies: main examples are its use in predicting the insolvency or bankruptcy of firms, assessing loans, classifying credit card applicants by risk level and making medical distinctions between alcoholics and non-addicts [75]. Although decision tree analysis can be used with both categorical and continuous data, it is a non-parametric statistical method that does not require presumption of linearity, normality or homoscedasticity [76]. By contrast, discriminant analysis is a parametric method that classifies using only continuous independent variables, along with logistic regression analysis.
This study used the above methods to develop a model that explains the key factors that distinguish the firms that desire in-house R&D support (and thereby also distinguish those that desire cooperative R&D support). To derive this model, we first used decision tree analysis to select, from among the many variables, those that have strong explanatory power, to help profile the firms that prefer in-house R&D support. Once we thus identified the major influencing factors, we performed discriminant analysis to derive a model that predicts the firms that will prefer in-house R&D support. We thus verified the significance of the independent variables recommended through non-parametric machine learning once more, using a parametric statistical method. Whereas existing studies only used conventional statistical methods, our multidimensional approach allowed us to comprehensively assess a wide variety of variables that indicate the characteristics of firms and enabled us to perform statistically significant classifications and build a prediction model.
3.3. Defining Variables and Converting Data
We set up our variables as shown in Table 1, reflecting the purpose of this research and taking account of the findings of preceding studies reviewed in the previous section. First, in keeping with the topic of our research, our dependent variables were defined as the preference that firms have for different types of governmental R&D subsidies, namely whether the firm preferred support for cooperative R&D involving external organizations or whether firms preferred in-house R&D support. All of the 3300 SMEs that responded were asked the same question, “What type of governmental R&D support do you prefer most?” and they were able to choose among four options; in-house R&D support, support for cooperative R&D with research institutes, support for cooperative R&D with universities and support for cooperative R&D with both research institutes and universities at the same time. In this context, the governmental support in the question implies R&D subsidies. R&D subsidies are the largest form of government support for SMEs in Korea [24] and is also the form of government support that is the focus of this study. For the purpose of this study, we translated the answer to the question into the binary of in-house R&D support and cooperative R&D support.
The independent variables mainly reflected the technological factors and firm-related factors. First, some of the key technological factors that affect cooperative R&D include the technology’s innovativeness, complexity and imitability, the industry to which the technology belongs, its life cycle and the resources required for the commercialization of technology [26,42,48,49,77] and therefore these factors were considered as independent variables in our research. Other important influencing factors we considered included the firm’s plans to perform in-house R&D in terms of the firm’s size and years in business, human resources, equipment, funding and R&D activities [47,48,50,52].
We also comprehensively considered various indicators of the performance of the SMEs to be important factors affecting cooperative R&D. These included the firm’s business performance reflected in sales, patent performance, technology commercialization success rate and failure rate [6,14]. Additionally, this study also considered the relative level of the firm’s technology as perceived by the firm itself. Additionally, we placed importance on the firm’s prior experience engaging in technological cooperation with external organizations and variables relevant to other factors impeding innovation [19,35,48,49,52].
Table 2 shows the technology statistics for the categorical variables, which are the results of frequency analysis. Regarding the dependent variable of the firm’s preference regarding governmental support for cooperative R&D, the ratio of the group that prefers cooperative R&D support to the group that does not have this preference was around 42.5:57.5 and therefore no further data balancing process was necessary. The many variables that were included in this research were continuous variables and the technological statistics on these variables are shown in Table 3. Among the continuous variables, it was unlikely that we would find a normal distribution in the cases that were not ratio variables expressed in percentage (%) units, because the skewness and kurtosis were high. Therefore, to perform a discriminant analysis that requires a presumption of normality, the values of some of the variables were converted to their square root. This conversion significantly lowered the skewness and kurtosis.
4. Results
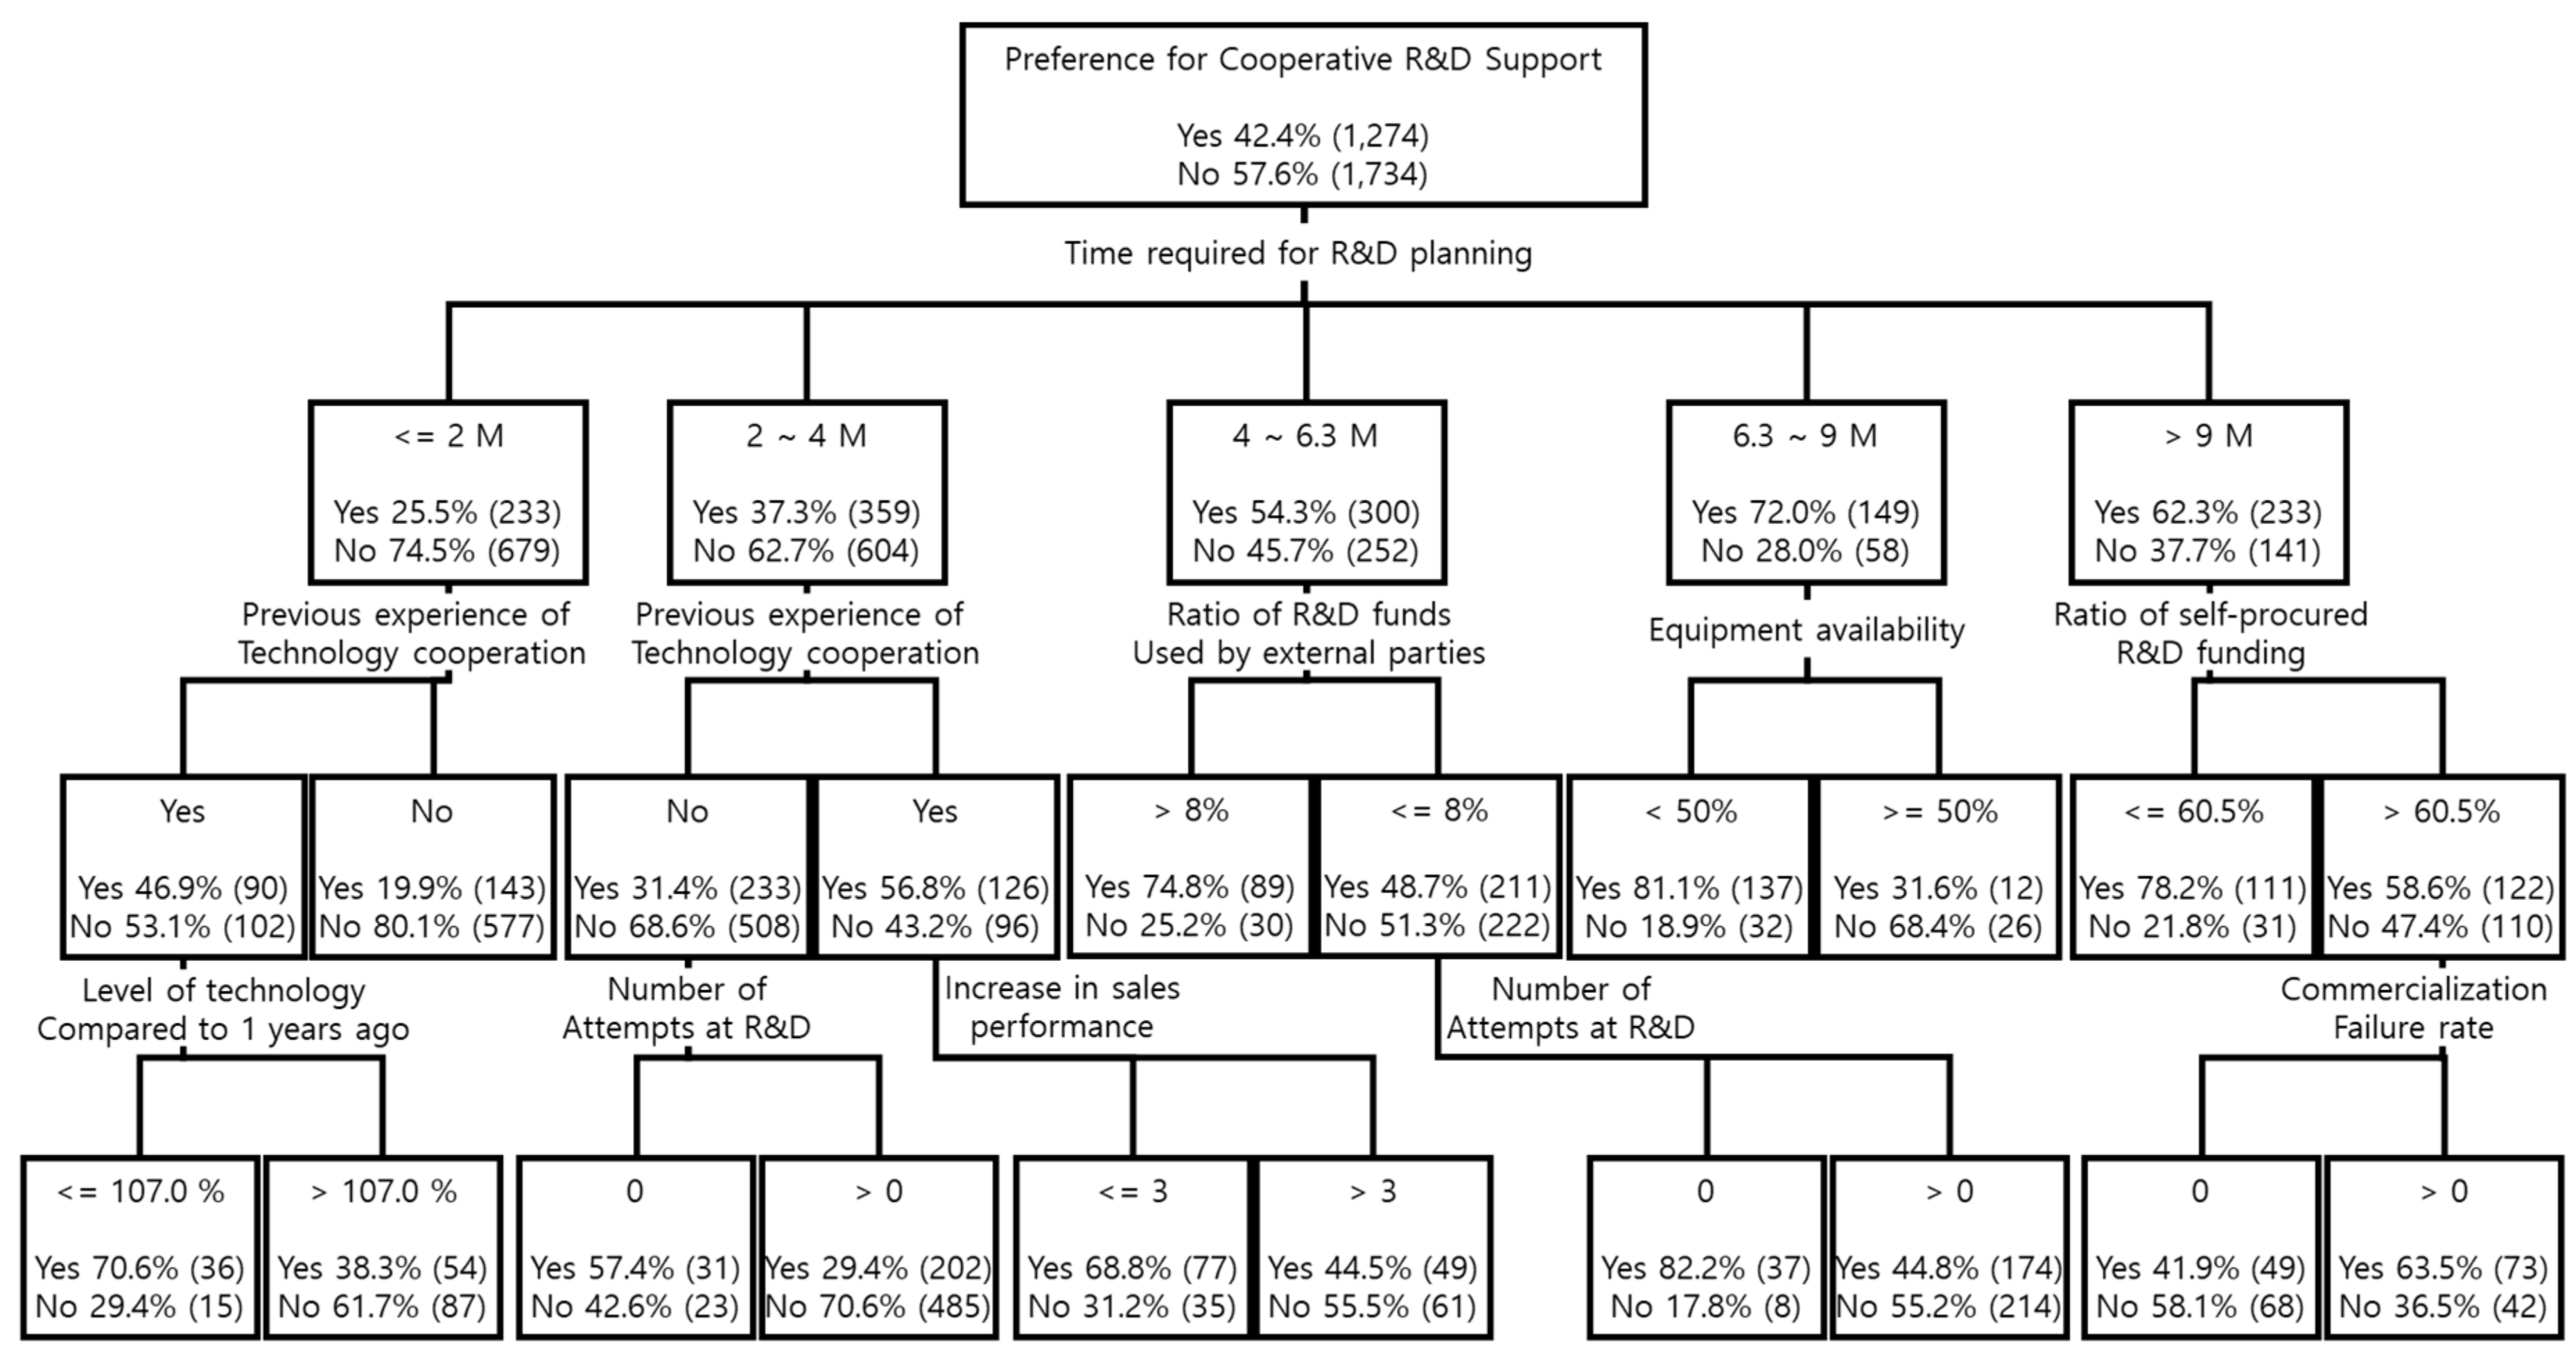
We performed decision tree analysis to profile the firms that prefer governmental support for R&D in cooperation with external organizations. The 31 variables explained above in Table 1 were adopted as the independent variables. The data from the responses of 3300 firms were divided into training data and testing data, at a ratio of 9:1. Although the results varied somewhat depending on the classification of training data and test data, the results remained consistent in the overall frame. Some of the representative results are shown in Figure 1. The results of our analysis of 300 cases, distinguishing the training data and test data, indicated that among the 31 variables, the factors that had an important influence on dependent variables included the time required for R&D planning, previous experience of technological cooperation, increase in sales performance, the ratio of the R&D funds used by external parties, equipment availability, the ratio of self-procured R&D funding, the level of technology compared to 1 year ago, the level of technology relative to the global level, the number of attempts at R&D, the ratio of the shortage of R&D personnel and the ratio of sales to large firms and so forth. The time required for R&D planning exercised the most influence: if the development planning required only a short period of 4 months or less, the firm preferred in-house R&D support, whereas in cases that required mid to long term planning over 4 months or longer, the firm preferred cooperative R&D support. Also, when the firm had prior experience engaging other institutions in technological cooperation, it preferred cooperative R&D support, whereas firms without such experience had a stronger preference for in-house R&D support. Notably, when the time spent on R&D planning was 2 months or less and the firm lacked technological cooperation experience, the ratio of preference for in-house R&D support ranged above 80%. Likewise, when the ratio of the R&D funds invested for use by external parties exceeded 8%, the firm preferred cooperative R&D support but if it was 8% or less, the firm was more likely to prefer in-house R&D support. Firms that had less than 50% of the testing and experimentation equipment it needed for R&D showed a stronger preference for cooperative R&D support than the inverse cases and when the ratio of self-procured R&D funding was smaller, the preference for cooperative R&D support was higher. Also, if a firm was not active in attempting R&D, had a higher failure rate in product commercialization, did not show much improvement in its technology level compared to 1 year ago, or perceived weak performance in terms of the sales driven by R&D, the firm showed strong preference for cooperative R&D support.
The above decision tree was grown using the chi-squared automatic interaction detector (CHAID) method and the maximum tree depth was set to 3. The expansion criterion was set to a significance level of 0.05 and no separate misclassification cost was added. Although we could have increased the depth to enhance the classification accuracy, since the decision tree analysis was performed in this study to select significant variables, the depth was limited to 3. The accuracy of the above decision tree analysis model is shown in Table 4. The overall classification accuracy for the training data and the testing data were respectively 70.1% and 71.9% and since the difference between the two accuracy levels was not large, this confirmed that the classification was stable. The prediction of firms that prefer in-house R&D support, which are the firms that will be targeted when designing policies to stimulate technological cooperation, showed accuracy levels of 87.5% and 87.0% respectively in the training and test processes.
As explained above, we performed discriminant analysis to present a more reliable classification and prediction model through parametric statistical analysis. Although discriminant analysis yields strongly reliable results, it requires us to directly select the appropriate variables. In our discriminant analysis, we used the continuous variables that had been selected as important influencing factors through the preceding decision tree analysis. Fisher’s linear discriminant function was applied in the analysis and Wilks’ Lambda was used as the basis for the step selection. The prior probability was calculated based on the size of the sample, which consisted of 3300 firms in total.
Table 5 shows the results of the test of homogeneity in the group average. The results showed that except for the ratio of shortage in R&D personnel, the remaining 8 variables were statistically significant (p < 0.05) in discriminating whether a firm preferred collaborative R&D support. Among the 8 variables, the time required for R&D planning was found to have the strongest discrimination power, since it had the smallest Wilks’ Lambda value and a large F value. This means that the difference between two groups was largest in the case of the time required for R&D planning.
The nine variables shown in Table 5 were added stepwise based on the Wilks’ Lambda value and the results, as shown in Table 6, allowed us to select six variables, namely the time required for R&D planning, the ratio of the R&D funds used by external parties, equipment availability, the ratio of self-procured R&D funding, the ratio of sales to large firms and the number of attempts at R&D. Table 7 shows the results of the significance test for the discriminant consisting of six variables and indicates that the discriminant distinguishing the two groups was statistically significant (p < 0.05). Also, the discriminant’s canonical correlation coefficient was 0.371.
Table 8 shows the standardized canonical discriminant function coefficient and the unstandardized coefficient. The standardized coefficient had relative importance in discriminating the groups and the absolute value of the coefficient was the largest in the case of the time required for R&D planning, indicating that this factor had the strongest discrimination power.
Also, the structure matrix in Table 9, which shows the correlation between each variable and the standardized canonical discriminant function demonstrates that the time required for R&D planning had the highest correlation to the discriminant function. Observing the discriminant loading, we can see that the time required for R&D planning, the ratio of self-procured R&D funding, the ratio of the R&D funds used by external parties and equipment availability have an absolute value of 0.4 or higher and we can conclude that they are very significant for discriminating the two groups [78]. According to the sign of the discriminant loading, we found that when the time required for R&D planning was longer and the ratio of the R&D funds used by external parties was larger and inversely, when the ratio of self-procured R&D funding and the equipment availability were smaller, the preference for cooperative R&D support tended to be stronger.
Using the canonical discriminant function coefficient in Table 8, the canonical discriminant that distinguishes the two groups can be expressed as shown in Equation (1). The centroids, or the average values of the discriminant scores of the group that prefers cooperative R&D support and the group that does not, were respectively 0.464 and −0.344.
(Canonical) discriminant of the preference for cooperative R&D support = −0.005 (ratio of sales to large firms) + 0.021 (ratio of the R&D funds used by external parties) + 0.978 (time required for R&D planning (square root)) − 0.092 (number of attempts at R&D (square root)) − 0.010 (ratio of self-procured R&D funding) − 0.011(equipment availability) − 0.462
Table 10 shows the coefficient of the classification function, which is the basis for the group classification of new cases. Using this, we can predict what type of support a new firm will prefer. When we input the values of the new firm’s variables into the classification function, we can classify the firm to be the group that yields the larger value. If the time required for R&D planning and the ratio of the R&D funds used by external parties is large while the number of attempts at R&D, the equipment availability, the ratio of self-procured R&D funding and the ratio of sales to large firms are small, we can conclude that the firm prefers cooperative R&D support. The total hit ratio based on this classification function was 67.3%.
5. Discussion
Although relatively recent studies have somewhat skeptical conclusions about government support for SMEs’ collaborative R&D [70], a number of studies have published positive results [14,21,22,23]. In addition, it is difficult to deny definitively the necessity and importance of government support for cooperation R&D of SMEs. The question is how to make government support for collaborative R&D effective. Cooperative R&D support policies are so complex that a more cautious approach is needed to achieve substantial benefits [70]. In this context, this study considered the targeting of beneficiaries in order to effectively implement the cooperative R&D support policy. In contrast to previous studies, which examined the factors that stimulate cooperative R&D, we looked more directly at the characteristics of SMEs that prefer government cooperative R&D support programs. From the results, we discussed policy considerations related to the direction of the program and the selection of beneficiaries for the efficiency of the program.
By performing decision tree analysis and discriminant analysis, we analyzed the characteristics that differentiated the group that prefers cooperative R&D support and the group that does not and furthermore, derived a rule for distinguishing and predicting these two groups. Most determinants were in strong agreement with the factors that we fond to stimulate cooperative R&D of firms as derived from the previous studies. However, some of them have been specifically identified in this study and the time required for R&D planning is representative. The results of the two analysis methodologies both indicated that the time required for R&D planning is the most important variable for distinguishing the two groups. When more time is input into the technology commercialization process, the level of expended resources and the accompanying risk inevitably rises and corresponding to the findings of preceding research, our results indicate that such firms will have a strong tendency to lower the required resources and uncertainty by seeking technological cooperation with external institutions [48,52]. Since SMEs that spend a longer time on R&D planning were found to have a stronger preference for cooperative R&D support, we believe it would be more effective to offer policy-based support to encourage cooperation with external parties beginning from the planning stage, even before firms enter the main development stage. It is expected that this support will help solve existing problems by making it possible for SMEs that have difficulties in the planning state utilize external knowledge. In addition, the lack of equipment needed for R&D was also found to be an important factor influencing a firm’s preference regarding cooperative R&D support. This can be understood as the willingness of SMEs lacking internal resources to secure the necessary resources through collaborative R&D [35]. Therefore, we believe that supportive policies involving the joint utilization of equipment will be effective for enhancing the R&D efficiency of SMEs and stimulating cooperative R&D.
Other key important influencing factors were those related to prior cooperative experience, specifically the firm’s prior experience engaging in technological cooperation and the ratio of R&D funding used by external organizations. SMEs that did not have experience in external cooperation or had a smaller portion dedicated to the participation of external organizations showed a tendency to insist on in-house R&D. By contrast, when a firm had more cooperative experience and, invested a larger portion, the firm was found to be more eager to engage in cooperative R&D. This is consistent with the results of previous studies [49]. Of course, cooperative R&D is not always positive for innovation performance but our results indicate the importance of inducing SMEs to experience cooperating with external organizations at least once. If the policy objective is to encourage active involvement of SMEs in cooperative R & D support programs, it may be effective to strategize how to attract firms that have less experience with cooperative R&D by offering such firms additional points, making these firms the effective target of the policy. Also, firms that are active in attempting R&D, have achieved a high success rate of product commercialization, have a high level of technology and have strong performance in increasing sales tend to be eager to undertake cooperative R&D support, whereas firms that lack these qualities will hesitate more and lack the confidence to engage in cooperative R&D. These firm-related factors have been recognized as important factors promoting the technological cooperation of SMEs [47,48,50,51]. Therefore, governmental support for the former firms will probably be more efficient in terms of managing public resources and will ensure better performance. However, if the policy objective is to induce SMEs to become more active involved in cooperative R&D support programs, the past achievements of the firm should not be weighed excessively when evaluating firms to select the beneficiary of the governmental support.
Lastly, when firms have a smaller ratio of self-procured R&D funding, in other words, when they rely on a higher ratio of externally procured R&D funding from sources such as the government, the firms tend to prefer cooperative R&D support. This can be understood as corroborating preceding research results showing that support from the public sector, including governmental assistance, stimulates cooperative R&D [16,17,18,19]. This means that governmental policies providing subsidies for cooperative R&D may be an important inducement that spurs firms to engage in cooperative R&D; this consideration ought to be of continual interest for policymakers.
This study has the following limitations: First, further discussion is needed if the preference for governmental support for collaborative R&D is the result of the R&D characteristics of SMEs. Among the SMEs that prefer in-house R&D support, R&D characteristics may not match the collaborative R&D but this may be due to lack of research capacity or insufficient experience. Therefore, there may be a limitation establishing a causal relationship between the dependent variable and independent variables. The results of this study identify the profiles of SMEs that prefer to collaborative R&D support but the objective identifications were based on correlation rather than causality. In addition, this study is based on the advantages of big data analysis and it important to take prudent caution against big data hubris [79,80]. Therefore, we recommend adopting an empirical point of view rather than a deterministic approach when attempting to utilize the results of this study. To overcome these limitations and achieve more robust causal research, it will be necessary to perform follow-up studies considering the time delay. In addition, more generalized research results can be obtained by further expanding this study through detailed questionnaires or various case studies. Finally, since the preferences of SMEs on the type of governmental support and the factors affecting them could be different according to the characteristics of their industries, it would be possible to derive more meaningful implications if we perform further analyses for each industry.
Author Contributions
H.S.Y. contributed in preparation of original draft, conceptualization, data collection, selection of methodology, formal analysis, validation and investigation. C.L. contributed in analysis, validation, review and edit the paper. S.-P.J. contributed in conceptualization, data collection, selection of methodology, formal analysis, validation, investigation, review and edit the paper.
Funding
This research was funded by Korea Institute of Science and Technology Information (KISTI).
Conflicts of Interest
The authors declare no conflict of interest.
References
- Sampson, R.C. R&D alliances and firm performance: The impact of technological diversity and alliance organization on innovation. Acad. Manag. J. 2007, 50, 364–386. [Google Scholar]
- Vega-Jurado, J.; Gutiérrez-Gracia, A.; Fernández-de-Lucio, I. Does external knowledge sourcing matter for innovation? Evidence from the Spanish manufacturing industry. Ind. Corp Chang. 2009, 18, 637–670. [Google Scholar] [CrossRef] [Green Version]
- Chesbrough, H.W. Open Innovation: The New Imperative for Creating and Profiting from Technology; Harvard Business Press: Cambridge, MA, USA, 2006. [Google Scholar]
- Rogers, M. Networks, firm size and innovation. Small Bus. Econ. 2004, 22, 141–153. [Google Scholar] [CrossRef]
- Amara, N.; Landry, R. Sources of information as determinants of novelty of innovation in manufacturing firms: Evidence from the 1999 statistics Canada innovation survey. Technovation 2005, 25, 245–259. [Google Scholar] [CrossRef]
- Faems, D.; Van Looy, B.; Debackere, K. Interorganizational collaboration and innovation: Toward a portfolio approach. J. Prod. Innov. Manag. 2005, 22, 238–250. [Google Scholar] [CrossRef]
- Laursen, K.; Salter, A. Open for innovation: The role of openness in explaining innovation performance among UK manufacturing firms. Strateg. Manag. J. 2006, 27, 131–150. [Google Scholar] [CrossRef]
- Hottenrott, H.; Lopes-Bento, C. R&D partnerships and innovation performance: Can there be too much of a good thing? J. Prod. Innov. Manag. 2016, 33, 773–794. [Google Scholar]
- Schumpeter, J.A. Business Cycles; McGraw-Hill: New York, NY, USA, 1939. [Google Scholar]
- Baumol, W.J. The Free-Market Innovation Machine: Analyzing the Growth Miracle of Capitalism; Princeton University Press: Princeton, NJ, USA, 2002. [Google Scholar]
- Mortensen, P.S.; Bloch, C.W. Oslo Manual-Guidelines for Collecting and Interpreting Innovation Data: Proposed Guidelines for Collecting and Interpreting Innovation Data, 3rd ed.; Organisation for Economic Cooporation and Development: Paris, France, 2005. [Google Scholar]
- Kang, K.; Park, H. Influence of Government R&D Support and Inter-firm Collaborations on Innovation in Korea Biotechnology SMEs. Technovation 2012, 32, 68–78. [Google Scholar]
- Wallsten, S.J. The effects of government-industry R&D programs on private R&D: The case of the Small Business Innovation Research program. RAND J. Econ. 2000, 31, 82–100. [Google Scholar]
- Audretsch, D.B.; Link, A.N.; Scott, J.T. Public/private technology partnerships: Evaluating SBIR-supported research. Res. Policy 2002, 31, 145–158. [Google Scholar] [CrossRef]
- Hall, B.H. The Financing of Research and Development. Oxf. Rev. Econ. Policy 2002, 18, 35–51. [Google Scholar] [CrossRef] [Green Version]
- Sakakibara, M.; Cho, D.S. Cooperative R&D in Japan and Korea: A comparison of industrial policy. Res. Policy 2002, 31, 673–692. [Google Scholar]
- Hinloopen, J. Strategic R&D co-operatives. Res. Econ. 2000, 54, 153–185. [Google Scholar]
- Czarnitzki, D.; Ebersberger, B.; Fier, A. The relationship between R&D collaboration, subsidies and R&D performance: Empirical evidence from Finland and Germany. J. Appl. Econ. 2007, 22, 1347–1366. [Google Scholar]
- Busom, I.; Fernandez-Ribas, A. The impact of firm participation in R&D programs on R&D partnerships. Res. Policy 2008, 37, 240–257. [Google Scholar]
- Wernerfelt, B. A Resource-Based View of the Firm. Strateg. Manag. J. 1984, 5, 171–180. [Google Scholar] [CrossRef]
- Link, A.N.; Paton, D.; Siegel, D.S. An analysis of policy initiatives to promote strategic research partnerships. Res. Policy 2002, 31, 1459–1466. [Google Scholar] [CrossRef]
- Broekel, T. Do cooperative research and development (R&D) subsidies stimulate regional innovation efficiency? Evidence from Germany. Reg. Stud. 2015, 49, 1087–1110. [Google Scholar]
- Hottenrott, H.; Lopes-Bento, C. (International) R&D collaboration and SMEs: The effectiveness of targeted public R&D support schemes. Res. Policy 2014, 43, 1055–1066. [Google Scholar] [Green Version]
- Ministry of SMEs and Startups. Announcement of 2018 SMEs Technology Development Support Project; Ministry of SMEs and Startups: Daejeon, Korea, 2017.
- Ministry of SMEs and Startups. Kbiz 8th Survey on the Technology of SMEs; Ministry of SMEs and Startups: Seoul, Korea, 2015.
- Yun, J.J.; Jeong, E.; Lee, Y.; Kim, K. The Effect of Open Innovation on Technology Value and Technology Transfer: A Comparative Analysis of the Automotive, Robotics, and Aviation Industries of Korea. Sustainability 2018, 10, 2459. [Google Scholar] [CrossRef]
- Yun, J.J.; Jung, K.; Yigitcanlar, T. Open Innovation of James Watt and Steve Jobs: Insights for Sustainability of Economic Growth. Sustainability 2018, 10, 1553. [Google Scholar] [CrossRef] [Green Version]
- Yun, J.J. How do we conquer the growth limits of capitalism? Schumpeterian Dynamics of Open Innovation. J. Open Innov. Technol. Mark. Complex 2015, 1, 17. [Google Scholar] [CrossRef]
- Yun, J.J.; Won, D.; Park, K. Dynamics from open innovation to evolutionary change. J. Open Innov. Technol. Mark. Complex 2016, 2, 7. [Google Scholar] [CrossRef]
- Lee, M.; Yun, J.J.; Pyka, A.; Won, D.; Kodama, F.; Schiuma, G.; Yan, M.R. How to Respond to the Fourth Industrial Revolution, or the Second Information Technology Revolution? Dynamic New Combinations between Technology, Market, and Society through Open Innovation. J. Open Innov. Technol. Mark. Complex 2018, 4, 21. [Google Scholar] [CrossRef]
- Yun, J.J.; Jeon, J.H.; Park, K.B.; Zhao, X. Benefits and Costs of Closed Innovation Strategy: Analysis of Samsung’s Galaxy Note 7 Explosion and Withdrawal Scandal. J. Open Innov. Technol. Mark. Complex 2018, 4, 20. [Google Scholar] [CrossRef]
- Katila, R.; Ahuja, G. Something old, something new: A longitudinal study of search behavior and new product introduction. Acad. Manag. J. 2002, 45, 1183–1194. [Google Scholar]
- Nieto, M.J.; Santamaría, L. The importance of diverse collaborative networks for the novelty of product innovation. Technovation 2007, 27, 367–377. [Google Scholar] [CrossRef] [Green Version]
- Freel, M.S. Sectoral patterns of small firm innovation, networking and proximity. Res. Policy 2003, 32, 751–770. [Google Scholar] [CrossRef]
- Miotti, L.; Sachwald, F. Co-operative R&D: Why and with whom?: An integrated framework of analysis. Res. Policy 2003, 32, 1481–1499. [Google Scholar]
- Sánchez, A.M.; Pérez, M.P. Cooperation and the ability to minimize the time and cost of new product development within the Spanish automotive supplier industry. J. Prod. Innov. Manag. 2003, 20, 57–69. [Google Scholar] [CrossRef]
- Danneels, E. Tight-loose coupling with customers: The enactment of customer orientation. Strateg. Manag. J. 2003, 24, 559–576. [Google Scholar] [CrossRef]
- Ledwith, A.; Coughlan, P. Splendid isolation: Does networking really increase new product success? Creat. Innov. Manag. 2005, 14, 366–373. [Google Scholar] [CrossRef]
- Lööf, H.; Heshmati, A. Knowledge capital and performance: A new firm level innovation study. Int. J. Prod. Econ. 2002, 76, 61–85. [Google Scholar] [CrossRef]
- Monjon, S.; Waelbroeck, P. Assessing spillovers from universities to firms: Evidence from French firm-level data. Int. J. Ind. Organ. 2003, 21, 1255–1270. [Google Scholar] [CrossRef]
- Belderbos, R.; Carree, M.; Lokshin, B. Cooperative R&D and firm performance. Res. Policy 2004, 33, 1477–1492. [Google Scholar] [Green Version]
- Tether, B.S. Who co-operates for innovation, and why: An empirical analysis. Res. Policy 2002, 31, 947–967. [Google Scholar] [CrossRef]
- Bozeman, B. Technology transfer and public policy: A review of research and theory. Res. Policy 2000, 29, 627–655. [Google Scholar] [CrossRef]
- Vuola, O.; Hameri, A.P. Mutually benefiting joint innovation process between industry and big-science. Technovation 2006, 26, 3–12. [Google Scholar] [CrossRef]
- Arza, V.; López, A. Firms’ linkages with public research organisations in Argentina: Drivers, perceptions and behaviours. Technovation 2011, 31, 384–400. [Google Scholar] [CrossRef]
- Tsai, K.H. Collaborative networks and product innovation performance: Toward a contingency perspective. Res. Policy 2009, 38, 765–778. [Google Scholar] [CrossRef]
- Arranz, N.; de Arroyabe, J.C.F. The choice of partners in R&D cooperation: An empirical analysis of Spanish firms. Technovation 2008, 28, 88–100. [Google Scholar]
- Bayona, C.; Garcı́a-Marco, T.; Huerta, E. Firms’ motivations for cooperative R&D: An empirical analysis of Spanish firms. Res. Policy 2001, 30, 1289–1307. [Google Scholar]
- Segarra-Blasco, A.; Arauzo-Carod, J.M. Sources of innovation and industry-university interaction: Evidence from Spanish firms. Res. Policy 2008, 37, 1283–1295. [Google Scholar] [CrossRef]
- De Faria, P.; Lima, F.; Santos, R. Cooperation in innovation activities: The importance of partners. Res. Policy 2010, 39, 1082–1092. [Google Scholar] [CrossRef]
- Cohen, W.; Levinthal, D. Absorptive Capacity: A New Perspective on Learning and Innovation. Adm. Sci. Q. 1990, 35, 128–152. [Google Scholar] [CrossRef]
- Mukherjee, D.; Gaur, A.S.; Gaur, S.S.; Schmid, F. External and internal influences on R&D alliance formation: Evidence from German SMEs. J. Bus. Res. 2013, 66, 2178–2185. [Google Scholar] [Green Version]
- Baumol, W.J. Welfare Economics and the Theory of the State. In The Encyclopedia of Public Choice; Springer: Boston, MA, USA, 2004; pp. 937–940. [Google Scholar]
- Cohen, W.M.; Klepper, S. The anatomy of industry R&D intensity distributions. Am. Econ. Rev. 1992, 82, 773–799. [Google Scholar]
- Le Grand, J. The theory of government failure. Br. J. Political Sci. 1991, 21, 423–442. [Google Scholar] [CrossRef]
- Woolthuis, R.K.; Lankhuizen, M.; Gilsing, V. A system failure framework for innovation policy design. Technovation 2005, 25, 609–619. [Google Scholar] [CrossRef]
- Busom, I.; Corchuelo, B.; Martınez-Ros, E. Tax incentives… or subsidies for business R&D? Small Bus. Econ. 2014, 43, 571–596. [Google Scholar]
- Romero-Jordan, D.; Delgado-Rodrıguez, M.J.; Alvarez-Ayuso, I.; de Lucas-Santos, S. Assessment of the public tools used to promote R&D investment in Spanish SMEs. Small Bus. Econ. 2014, 43, 959–976. [Google Scholar]
- Bronzini, R.; Piselli, P. The impact of R&D subsidies on firm innovation. Res. Policy 2016, 44, 442–457. [Google Scholar]
- Radas, S.; Anić, I.D.; Tafro, A.; Wagner, V. The effects of public support schemes on small and medium enterprises. Technovation 2015, 38, 15–30. [Google Scholar] [CrossRef]
- Keizer, J.A.; Dijkstra, L.; Halman, J.I. Explaining innovative efforts of SMEs: An exploratory survey among SMEs in the mechanical and electrical engineering sector in The Netherlands. Technovation 2002, 22, 1–13. [Google Scholar] [CrossRef]
- Shefer, D.; Frenkel, A. R&D, firm size and innovation: An empirical analysis. Technovation 2005, 25, 25–32. [Google Scholar]
- Guellec, D.; Potterie, B. The Impact of Public R&D Expenditure on Business R&D. Econ. Innov. New Technol. 2003, 12, 225–243. [Google Scholar]
- Hall, B.; Van Reenen, J. How effective are fiscal incentives for R&D? A review of the evidence. Res. Policy 2000, 29, 449–469. [Google Scholar]
- Almus, M.; Czarnitzki, D. The effects of public R&D subsidies on firms’ innovation activities: The case of Eastern Germany. J. Bus. Econ. Stat. 2003, 21, 226–236. [Google Scholar]
- David, P.A.; Hall, B.H.; Toole, A.A. Is public R&D a complement or substitute for private R&D? A review of the econometric evidence. Res. Policy 2000, 29, 497–529. [Google Scholar] [Green Version]
- Lach, S. Do R&D Subsidies Stimulate or Displace Private R&D? Evidence from Israel. J. Ind. Econ. 2002, 50, 369–390. [Google Scholar]
- Busom, I. An empirical evaluation of the effects of R&D subsidies. Econ. Innov. New Technol. 2000, 9, 111–148. [Google Scholar]
- Schwartz, M.; Peglow, F.; Fritsch, M.; Günther, J. What drives innovation output from subsidized R&D cooperation? Project-level evidence from Germany. Technovation 2012, 32, 358–369. [Google Scholar]
- Bellucci, A.; Pennacchio, L.; Zazzaro, A. Public R&D subsidies: Collaborative versus individual place-based programs for SMEs. Small Bus. Econ. 2018, 51, 1–28. [Google Scholar] [CrossRef]
- Caloffi, A.; Mariani, M.; Rossi, F.; Russo, M. A comparative evaluation of regional subsidies for collaborative and individual R&D in small and medium-sized enterprises. Res. Policy 2018, 47, 1437–1447. [Google Scholar]
- Varian, H.R. Big data: New tricks for econometrics. J. Econ. Perspect. 2014, 28, 3–28. [Google Scholar] [CrossRef]
- Breiman, L.; Friedman, J.; Stone, C.J.; Olshen, R.A. Classification and Regression Trees; CRC Press: Boca Raton, FL, USA, 1984. [Google Scholar]
- Quinlan, J.R. C4. 5: Programs for Machine Learning; Elsevier: New York, NY, USA, 2014. [Google Scholar]
- Shmueli, G.; Patel, N.R.; Bruce, P.C. Data Mining for Business Intelligence: Concepts, Techniques, and Applications in Microsoft Office Excel with XLMiner; John Wiley and Sons: Hoboken, NJ, USA, 2011. [Google Scholar]
- Choi, J.; Kang, H.; Kim, E.; Lee, S.; Han, S.; Kim, M. Prediction and Excess of Data Mining Using Decision Tree Analysis; SPSS Academy: Seoul, Korea, 2002. [Google Scholar]
- Jun, S.P.; Kim, S.G.; Park, H.W. The mismatch between demand and beneficiaries of R&D support programs for SMEs: Evidence from Korean R&D planning programs. Technol. Forecast. Soc. 2017, 116, 286–298. [Google Scholar]
- Hair, J.F.; Black, W.C.; Babin, B.J.; Anderson, R.E.; Tatham, R.L. Multivariate Data Analysis; Prentice Hall: Bergen County, NJ, USA, 1998; Volume 5, pp. 207–219. [Google Scholar]
- Jun, S.P.; Yoo, H.S.; Choi, S. Ten years of research change using Google Trends: From the perspective of big data utilizations and applications. Technol. Forecast. Soc. 2018, 130, 69–87. [Google Scholar] [CrossRef]
- Jun, S.P.; Yoo, H.S.; Kim, J.H. A study on the effects of the CAFE standard on consumers. Energy Policy 2016, 91, 148–160. [Google Scholar] [CrossRef]
Figure 1.
Decision making tree analysis results for the group that prefers cooperative research and development (R&D) support (testing data).
Figure 1.
Decision making tree analysis results for the group that prefers cooperative research and development (R&D) support (testing data).


Table 1.
Variable names and explanation.
| Variables | Explanation |
|---|---|
| Dependent Variable | |
| Preference for cooperative R&D support | The form of governmental R&D support preferred by the firm |
| Independent Variables | |
| Classification of industry | Industrial classification to which the technology belongs |
| Technological innovativeness 2 | Level of innovation demonstrated in the technology |
| Time required for imitation 2 | The time required for an external party to imitate the main technology |
| Product life cycle | Product life-cycle of the main product |
| Time required for R&D planning | The average time required for the R&D planning stage |
| Time required for implementing R&D | The average time required for the stage of implementing R&D |
| Time required for commercialization | The average time required for the stage of commercializing outcome |
| Years in business | Years in business since founding, as of 2015 |
| Number of employees | Total number of employees, as of 2015 |
| Ratio of R&D personnel | The ratio of R&D personnel, out of the total number of employees |
| Ratio of the shortage of R&D personnel 2 | The ratio of the shortage in R&D personal |
| Equipment availability 2 | The level of testing and experimental equipment required for R&D currently available at the firm |
| Ratio of R&D funding 1 | The ratio of R&D investment in relation to the total sales |
| Ratio of self-procured R&D funding 1 | The ratio of self-procured funding out of the total R&D investment |
| Number of attempts at R&D 1 | Number of attempts at R&D |
| Previous year sales 1 | Total sales |
| Ratio of sales to large firms 1 | Ratio of sales to large firms out of the total sales |
| Increase in sales performance 1,2 | The degree of increase in sales due to R&D |
| Ordinary profit 1 | Ordinary profit |
| R&D success rate 1 | Ratio of successful R&D out of the total attempted |
| R&D failure rate 1 | Ratio of failed R&D out of the total attempted |
| Commercialization success rate 1 | Ratio of successful commercialization out of the successful R&D |
| Commercialization failure rate 1 | Ratio of failed commercialization out of the successful R&D |
| Number of patents held | Number of patents held at the time of the survey |
| Number of patent applications | Number of patent applications at the time of the survey |
| Level of technology relative to the global level 2 | Level of the firm’s technology compared to the most globally advanced level |
| Level of technology compared to 1 year ago 2 | Level of the firm’s technology compared to 1 year ago |
| Ratio of the R&D funds used by external parties 1 | Ratio of the R&D funds used by external parties out of the total R&D investment |
| Previous experience of technological cooperation 1 | Experience engaging in technological cooperation with external institutions |
| Factors causing difficulties in in-house R&D | Factors causing difficulties perceived during in-house R&D |
| Factors causing difficulties in cooperative R&D | Factors causing difficulties perceived during cooperative R&D |
1 in the previous year, 2 as perceived by the firm.
Table 2.
Descriptive statistics of categorical variables.
| Variables | Category | Frequency (Number) | Percentage (%) |
|---|---|---|---|
| Preference for cooperative R&D support | Cooperative R&D support | 1404 | 42.5 |
| In-house R&D support | 1896 | 57.5 | |
| Classification of industry | Machinery & Materials | 922 | 27.9 |
| Electric & Electronic | 375 | 11.4 | |
| Information & Communication | 349 | 10.6 | |
| Chemical & Ceramics | 796 | 24.1 | |
| Bio & Medical | 239 | 7.2 | |
| Energy & Resources | 234 | 7.1 | |
| Knowledge Services | 385 | 11.7 | |
| Technological innovativeness | High technology | 457 | 13.8 |
| Medium technology | 1987 | 60.2 | |
| Low technology | 856 | 25.9 | |
| Time required for imitation | <6 Months | 923 | 28.0 |
| ≥6 Months, <1 Year | 1145 | 34.7 | |
| ≥1 Year, <2 Years | 969 | 29.4 | |
| ≥2 Years | 263 | 8.0 | |
| Product life cycle | <2 Years | 860 | 26.1 |
| ≥2 Years, <5 Years | 1033 | 31.3 | |
| ≥5 Years, <10 Years | 971 | 29.4 | |
| ≥10 Years | 436 | 13.2 | |
| Previous experience of technological cooperation | Yes | 400 | 12.1 |
| No | 2900 | 87.9 | |
| Factors causing difficulties in in-house R&D | Insufficient funding | 838 | 25.4 |
| Securing human resources | 810 | 24.5 | |
| Lack of equipment | 671 | 20.3 | |
| Insufficient information | 515 | 15.6 | |
| Others | 326 | 9.9 | |
| No response | 140 | 4.2 | |
| Factors causing difficulties in cooperative R&D | High R&D expenditure | 276 | 8.4 |
| Prolonged R&D period | 159 | 4.8 | |
| Communicating with partners | 139 | 4.2 | |
| Lack of appropriate partners | 109 | 3.3 | |
| Others | 102 | 3.1 | |
| No response | 2521 | 76.4 |
Table 3.
Descriptive statistics of continuous variables.
| Variables | Units | Minimum Value | Maximum Value | Average | Standard Deviation |
|---|---|---|---|---|---|
| Ratio of R&D funding | % | 0.0 | 1.9 | 0.1 | 0.1 |
| Ratio of self-procured R&D funding | % | 0.0 | 100.0 | 85.0 | 26.8 |
| Ratio of R&D personnel | % | 0.4 | 100.0 | 21.0 | 19.8 |
| Ratio of the shortage of R&D personnel | % | 0.0 | 66.7 | 1.3 | 5.2 |
| Equipment availability | % | 0.0 | 100.0 | 48.3 | 30.1 |
| Time required for R&D planning 1 | Months | 0.0 | 6.0 | 2.0 | 0.7 |
| Time required for implementing R&D 1 | Months | 0.0 | 6.9 | 2.4 | 0.8 |
| Time required for commercialization 1 | Months | 0.0 | 6.9 | 2.3 | 0.7 |
| Number of attempts at R&D 1 | Cases | 0.0 | 9.1 | 1.7 | 0.9 |
| R&D success rate | % | 0.0 | 100.0 | 42.8 | 36.5 |
| R&D failure rate | % | 0.0 | 100.0 | 8.4 | 18.7 |
| Commercialization success rate | % | 0.0 | 100.0 | 59.4 | 42.4 |
| Commercialization failure rate | % | 0.0 | 100.0 | 3.8 | 15.8 |
| Number of patents held1 | Cases | 0.0 | 25.5 | 1.4 | 1.6 |
| Number of patent applications 1 | Cases | 0.0 | 14.8 | 0.4 | 0.9 |
| Increase in sales performance | None | 0.0 | 5.0 | 2.7 | 1.7 |
| Level of technology relative to the global level | % | 30.0 | 100.0 | 78.0 | 10.0 |
| Level of technology compared to 1 year ago | % | 40.0 | 200.0 | 110.5 | 15.8 |
| Previous year sales 1 | 1000 $ | 15.8 | 434.8 | 95.5 | 67.7 |
| Ordinary profit 1 | 1000 $ | 1.0 | 223.9 | 21.8 | 20.3 |
| Ratio of sales to large firms | % | 0.0 | 100.0 | 30.7 | 36.8 |
| Ratio of the R&D funds used by external parties | % | 0.0 | 100.0 | 9.4 | 22.9 |
| Years in business | years | 3.0 | 74.0 | 15.1 | 9.4 |
| Number of employees | Persons | 5.0 | 299.0 | 47.1 | 54.5 |
1 converted to their square root.
Table 4.
Classification accuracy of the decision tree model.
| Sample | Monitored | Forecasting | ||
|---|---|---|---|---|
| Preference of Cooperative R&D Support | Preference of In-House R&D Support | Accuracy | ||
| Training | Preference of Cooperative R&D support | 591 | 683 | 46.4% |
| Preference of in-house R&D support | 216 | 1518 | 87.5% | |
| Total percent | 26.8% | 73.2% | 70.1% | |
| Testing | Preference of Cooperative R&D support | 69 | 61 | 53.1% |
| Preference of in-house R&D support | 21 | 141 | 87.0% | |
| Total percent | 30.8% | 69.2% | 71.9% | |
Table 5.
Testing the homogeneity of the group average.
| Variables | Wilks’ Lambda | F | Degree of Freedom 1 | Degree of Freedom 2 | p |
|---|---|---|---|---|---|
| Ratio of sales to large firms | 0.995 | 18.161 | 1 | 3298 | 0.000 |
| Ratio of the R&D funds used by external parties | 0.972 | 94.675 | 1 | 3298 | 0.000 |
| Level of technology relative to the global level | 0.996 | 12.341 | 1 | 3298 | 0.000 |
| Level of technology compared to 1 year ago | 0.998 | 6.621 | 1 | 3298 | 0.010 |
| Time required for R&D planning | 0.919 | 290.378 | 1 | 3298 | 0.000 |
| Number of attempts at R&D | 0.998 | 5.318 | 1 | 3298 | 0.021 |
| Ratio of self-procured R&D funding | 0.968 | 107.933 | 1 | 3298 | 0.000 |
| Ratio of the shortage of R&D personnel | 1.000 | 0.091 | 1 | 3298 | 0.762 |
| Equipment availability | 0.975 | 84.672 | 1 | 3298 | 0.000 |
Table 6.
Discriminant analysis results by stage.
| Step | Entered Variables | Wilks’ Lambda | |||||||
|---|---|---|---|---|---|---|---|---|---|
| Statistics | 1DoF1 | 1DoF2 | 1DoF3 | Accurate F | |||||
| Statistics | 1DoF1 | 1DoF2 | p | ||||||
| 1 | Time required for R&D planning | 0.919 | 1 | 1 | 3298 | 290.378 | 1 | 3298 | 0.000 |
| 2 | Ratio of the R&D funds used by external parties | 0.892 | 2 | 1 | 3298 | 200.506 | 2 | 3297 | 0.000 |
| 3 | Equipment availability | 0.877 | 3 | 1 | 3298 | 154.533 | 3 | 3296 | 0.000 |
| 4 | Ratio of self-procured R&D funding | 0.868 | 4 | 1 | 3298 | 125.348 | 4 | 3295 | 0.000 |
| 5 | Ratio of sales to large firms | 0.863 | 5 | 1 | 3298 | 104.148 | 5 | 3294 | 0.000 |
| 6 | Number of attempts at R&D | 0.862 | 6 | 1 | 3298 | 87.631 | 6 | 3293 | 0.000 |
1 DoF: Degree of freedom.
Table 7.
Wilk’ Lambda.
| Function Test | Wilks’ Lambda | Chi-Square | Degree of Freedom | p |
|---|---|---|---|---|
| 1 | 0.862 | 488.102 | 6 | 0.000 |
Table 8.
Standardized canonical discriminant coefficient and canonical discriminant coefficient.
| Standardized Canonical Discriminant Function Coefficient | Canonical Discriminant Function Coefficient | |
|---|---|---|
| Ratio of sales to large firms | −0.199 | −0.005 |
| Ratio of the R&D funds used by external parties | 0.470 | 0.021 |
| Time required for R&D planning | 0.679 | 0.978 |
| Number of attempts at R&D | −0.101 | −0.092 |
| Ratio of self-procured R&D funding | −0.272 | −0.010 |
| Equipment availability | −0.315 | −0.011 |
| (Constant) | −0.462 |
Table 9.
Structure matrix.
| Discriminant Loading | |
|---|---|
| Time required for R&D planning | 0.743 |
| Ratio of self-procured R&D funding | −0.453 |
| Ratio of the R&D funds used by external parties | 0.424 |
| Equipment availability | −0.401 |
| Ratio of sales to large firms | −0.186 |
| Level of technology relative to the global level | −0.116 |
| Number of attempts at R&D | −0.100 |
| Ratio of the shortage of R&D personnel | 0.051 |
| Level of technology compared to 1 year ago | −0.027 |
Table 10.
Classification function coefficient.
| Preference for R&D Support | ||
|---|---|---|
| Preference for In-House R&D Support | Preference for Cooperative R&D Support | |
| Ratio of sales to large firms | 0.017 | 0.013 |
| Ratio of the R&D funds used by external parties | 0.033 | 0.050 |
| Time required for R&D planning | 5.142 | 5.932 |
| Number of attempts at R&D | 1.636 | 1.562 |
| Ratio of self-procured R&D funding | 0.158 | 0.150 |
| Equipment availability | 0.056 | 0.047 |
| (Constant) | −15.745 | −16.167 |
© 2018 by the authors. Licensee MDPI, Basel, Switzerland. This article is an open access article distributed under the terms and conditions of the Creative Commons Attribution (CC BY) license (http://creativecommons.org/licenses/by/4.0/).
Share and Cite
MDPI and ACS Style
Yoo, H.S.; Lee, C.; Jun, S.-P. The Characteristics of SMEs Preferring Cooperative Research and Development Support from the Government: The Case of Korea. Sustainability 2018, 10, 3048. https://doi.org/10.3390/su10093048
AMA Style
Yoo HS, Lee C, Jun S-P. The Characteristics of SMEs Preferring Cooperative Research and Development Support from the Government: The Case of Korea. Sustainability. 2018; 10(9):3048. https://doi.org/10.3390/su10093048
Chicago/Turabian StyleYoo, Hyoung Sun, Chul Lee, and Seung-Pyo Jun. 2018. "The Characteristics of SMEs Preferring Cooperative Research and Development Support from the Government: The Case of Korea" Sustainability 10, no. 9: 3048. https://doi.org/10.3390/su10093048
Note that from the first issue of 2016, this journal uses article numbers instead of page numbers. See further details here.