The Optimization of Visual Comfort and Energy Consumption Induced by Natural Light Based on PSO


1
School of Information Science and Technology, Fudan University, Shanghai 200433, China
2
Shanghai Institute of Intelligent Electronics & Systems, Shanghai 200433, China
3
OnePlus Technology (Shenzhen) Co., Ltd., Shenzhen 518040, China
*
Author to whom correspondence should be addressed.
Sustainability 2019, 11(1), 49; https://doi.org/10.3390/su11010049
Submission received: 9 December 2018
/
Revised: 18 December 2018
/
Accepted: 19 December 2018
/
Published: 21 December 2018
(This article belongs to the Special Issue Advanced Innovative Solutions for Final Design in Terms of Energy Sustainability of Nearly/Net Zero Energy Buildings (nZEB))
Abstract
:This paper presents the “model construction method”, an optimization method and industrial internet of things (IIoT) technology that is proposed for nearly zero energy buildings (nZEB), providing a comfortable visual environment by only utilizing natural light while improving its induced indoor air conditioner energy consumption (ACEC). The incident light is sampled by light sensors, and this data is sent to the cloud server. The visual comfort and indoor ACEC, both of which are induced by incident light, are combined as the optimization objective, and the area of windows covered by curtains is used as the optimal parameter in the particle swarm optimization (PSO). The visual comfort and indoor ACEC induced by incident light are modeled, and the construction method is independent of the geographical location. Five modes are defined for applications with different purposes, the performance of which are investigated and compared carefully. The result shows that natural light could provide comfortable visual comfort, while the ACEC induced by it could be reduced effectively.
1. Introduction
Nearly zero energy buildings (nZEB) have attracted lots of interests and work over the last decade, as building energy consumption plays an import role in total energy consumption [1]; about 40% of total energy in developed countries [2], and about 25% in China [3]. As a result, developing nZEB technology could improve total energy consumption effectively, which is valuable for global sustainability.
Building energy efficiency improvement and natural energy, like solar radiation and wind, are two important technologies for realizing nZEB. Building energy consumption forecast methods have been developed to improve building design and equipment setting [4]. In [5], an approach used in designing building envelopes is developed, which ensures conditions of thermal, visual, and acoustic comfort with a minimum of energy consumption. In a building that is well designed thermally, the electricity consumption of the lighting system is the dominant source of consumption [6,7]. In [8], the required visual comfort for every single user by utilizing visual comfort zones is provided, while more than 60% energy savings could be achieved. In [9], a smart energy efficient lighting system is developed based on the presence of occupancy and occupancy localization information.
Natural light could also be utilized in nZEB. In [10], energy saving (<25%) by using natural light and artificial light is realized, which is controlled by a self-adaptive integrated system. Another study [11] finds that creating a luminance contrast of between 11:1 and 12:1 on the window wall with a 45% window-to-exterior-wall ratio using a supplementary LED system could improve energy consumption, because it will diminish the likelihood of users turning on the ceiling lights. However, the incident solar radiation will increase the energy consumption of the air conditioner. In [12], shading devices installed on windows are designed to reduce energy consumption, while artificial light is used.
Furthermore, smart controlling systems plays a key role in nZEBs [13,14,15,16,17,18]. In [13], an efficient home energy management controller (EHEMC) based on genetic harmony search algorithm (GHSA) is proposed to reduce electricity expense, peak to average ratio (PAR), and maximize user comfort. For multiple homes, modes of operation for the appliances, according to their energy consumption, with varying operation time slots are classified, and the constrained optimization problem is solved using heuristic algorithms. In [14], the hybrid gray wolf differential evolution (HGWDE) is proposed for jointly optimizing electricity costs and user preferences. When the electricity tariff is in peak periods, the load is shifted into the slots with low price. Similar works are reported in [15] and [16], which employ the binary multiple knapsack problem formulation technique and finite state machine, respectively. In [17,18], energy saving is achieved based on a Multi-Agent architecture, which is the representative architecture in this field. In these works, the visual comfort is not taken into account.
In this paper, an IIoT-based smart controlling system and the corresponding models, model construction method and optimization method, are proposed for providing a comfortable visual environment by utilizing only natural light, while improving its induced ACEC effectively. In the proposed system, the incident light is sampled by light sensors, and the cloud-based service analyzes this data by employing the proposed model and PSO, then the corresponding order is sent to drive automatic curtains. A framework of the smart controlling system is proposed for conducting experiments, and the cloud-based IIoT technology makes the system low cost, easy to deploy, and usable for large-scale deployment [19]. The curtains could stop the incident light, and influence the occupants’ visual comfort and ACEC significantly. Therefore, the area of windows covered by curtains is used as the optimal parameter in the PSO [20]. A model combining visual comfort with indoor ACEC is proposed, in which there are several windows in different situations. Five modes are defined for different applications by setting the model coefficients a and b with different values: (a) mode 1 (a = 1 and b = 0), only energy consumption is concerned; (b) mode 2 (a = 0 and b = 1), only visual comfort is concerned; (c) mode 3 (a = 2 and b = 1), energy consumption has priority; (d) mode 4 (a = 1 and b = 2), visual comfort has priority; and (e) mode 5 (a = 1 and b = 1), the moderate policy. The performance of 5 modes is investigated carefully. Compared with mode 2, which has the best visual comfort, mode 3 reduces air conditioner power about 117 w (24.5%), while the visual comfort is nearly the same. These results show that it is practicable to provide good visual comfort by utilizing only natural light, while the ACEC caused by natural light could be reduced effectively.
2. Framework of IIoT-based Smart Controlling System
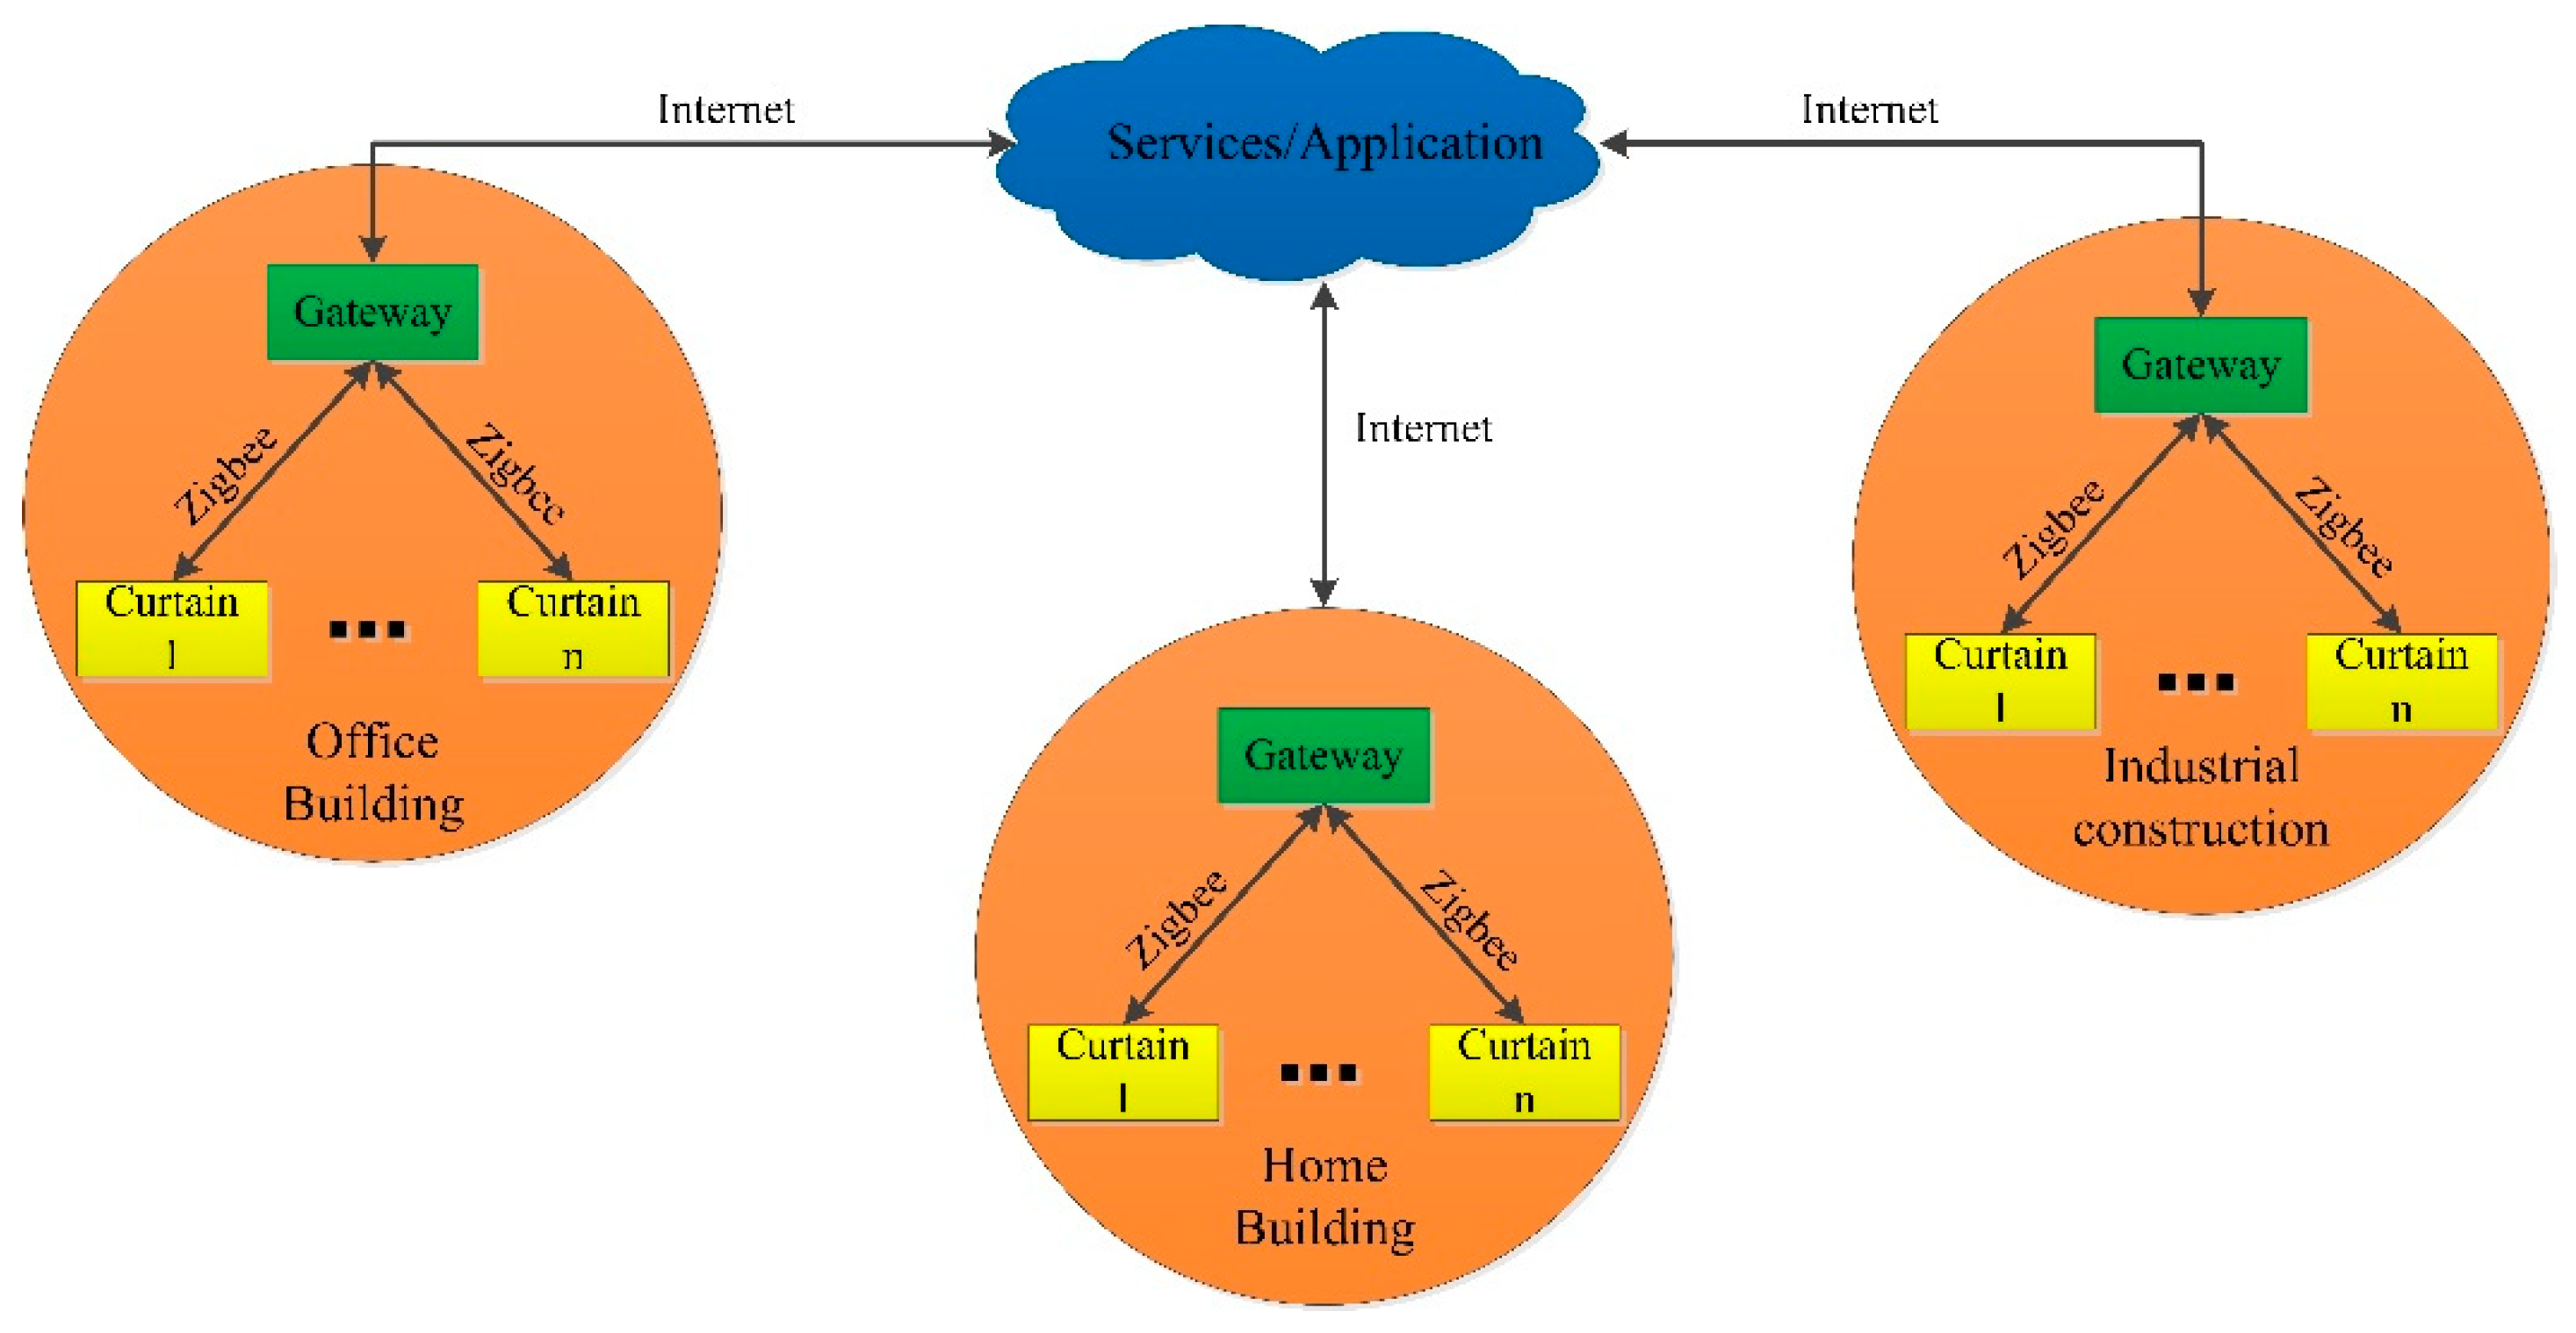
The framework of the proposed IIoT-based smart controlling system is shown in Figure 1. The proposed IIoT-based smart controlling system is composed of cloud-based services, smart gateways, and automatic curtains with light sensors. Automatic curtains are connected to gateways wirelessly (In Figure 1, it is via Zigbee wireless network), and gateways submit the data to cloud-based services via the Internet.
Light sensors sample the incident light and periodically submit the information to services on the cloud through gateways, which implement protocol conversions between Zigbee and Internet. Though one curtain includes one or more light sensors in Figure 1, it is obvious that curtains could share these sensors.
The service on the cloud periodically analyzes this data from gateways by employing the proposed model and PSO, and sends the corresponding order to drive automatic curtains through gateways. The model depends on the building, and five modes are defined for different applications, by setting the model coefficients a and b with different values, which will be discussed in detailed in Section 3.
The proposed framework could be deployed in home buildings, office buildings, and industrial constructions. The cloud-based IIoT technology makes it low cost, easy to deploy, and usable for large-scale deployment. Furthermore, PSO is suitable for multi-variable optimization, therefore the proposed system will have superiority in complex architecture.
In our work, the comfortable visual environment of the home building in Shanghai is provided by natural light, and the ACEC that is induced by natural light is improved.
3. Model and Particle Swarm Optimization
This section introduces the model, the model construction method, and function and optimization method that was researched and used in this paper, including the model of energy consumption induced by incident light, the fit function of natural light levels induced by incident light, the fit function of indoor visual comfort, and the particle swarm optimization. Strong sunshine is required to make this model work effectively, and that’s the reason why 12:00 on July 15 in Shanghai is chosen in this work. The model construction method is independent of the geographical location, though the house in this work is in Shanghai, China.
3.1. Model of Energy Consumption Induced by Incident Light
As shown in Figure 2, the dimensions of the house are 6 × 4 × 2.8 m3, and there are two windows on the south wall and east wall, the sizes of which are 6 × 2 m3 and 4 × 2 m3, respectively. The vertical distance between the ground and the center of the window is 1.6 m. There is another house with the same dimensions and structure on the east of the research area, and the distance between the two houses is 4 m.
Curtains on the south wall and east wall are used to stop incident light, as shown in Figure 2b,c. The visible transmittance of windows (single glass) is 0.737, and it is assumed that the curtain could stop incident light completely (100%). Then the incident light power could be expressed as:
where x1 is the ratio of none curtain-covered area of the south window to the whole area of the south wall, and x2 is the ratio of none curtain-covered area of the east window to the whole area of the east wall. The range of x1 and x2 are both from 0 to 0.7. Pu1 and Pu2 are the incident light power per square meter on the south and east wall, respectively, which could be obtained by light sensors or employing simulation tools such as Autodesk Ecotect Analysis.
P = Pu1 × W2 × H2 + Pu2 × W3 × H4
= Pu1 × L1 × H1 × x1 + Pu2 × W1 × H1 × x2
= Pu1 × L1 × H1 × x1 + Pu2 × W1 × H1 × x2
The incident light provides indoor visual comfort, and also increases the room temperature, which should be removed by air conditioner to keep the room temperature constant. The energy efficiency ratio (EER) of the air conditioner is supposed to be 3.4, namely it is a product of China energy efficiency index (EEI) 2. Then the air conditioner power induced by incident light is:
Pac = P/3.4
The Pac at 12:00 am on 15 July is listed in Table 1.
The fit function of Pac is:
where their root mean squared errors (RMSE) are 20.7 and 4.0, respectively.
Pac = Pac1 + Pac2
= 646.7 × x1 +18.6 + 360.1 × x2 + 3.3
= 646.7 × x1 + 360.1 × x2 + 21.9
= 646.7 × x1 +18.6 + 360.1 × x2 + 3.3
= 646.7 × x1 + 360.1 × x2 + 21.9
3.2. Model of Energy Consumption Induced by Incident Light
The indoor natural light level (LL) provided by incident light is sampled at position A at 12:00 am on July 15. The coordinate of A is (3, 2, 0.8), and the origin of the coordinate is shown in Figure 2a. The light level at position A is used to calculate the indoor visual comfort at 12:00 am on July 15, and the data is obtained by employing Autodesk Ecotect Analysis, as shown in Table 2.
The fit function of indoor light level is:
where the RMSE is 27.0.
LL = −1206 × x12 + 1719 × x1 + 460.3 × x2 + 63.93 × x1 × x2 + 17.23
3.3. Fit Function of Indoor Visual Comfort
The curtain could change the incident light and light level in the room dramatically, therefore the occupants’ visual comfort [21,22] is significantly influenced by it. In [22], the acceptable light levels are examined in an office environment by interviewing 293 occupants, the data of which is used for fitting visual comfort function, as listed in Table 3. The occupants’ acceptability of light level is defined as the ratio of the number of acceptance to the sample number (293), and is used to represent visual comfort (VC).
The fit function of visual comfort is:
where the RMSE is 0.03. Substituting (4) into (5), then we have:
VC = −1.73 × 10⁻⁶ × x2 + 2.5 × 10⁻³ × x + 0.0531
VC = −1.73 × 10⁻⁶ × (−1206 × x12 + 1719 × x1 + 460.3 × x2 + 63.93 × x1 × x2 + 17.23)2
+ 2.5 × 10⁻³ × (−1206 × x12 + 1719 × x1 + 460.3 × x2 + 63.93 × x1 × x2 + 17.23) + 0.0531
+ 2.5 × 10⁻³ × (−1206 × x12 + 1719 × x1 + 460.3 × x2 + 63.93 × x1 × x2 + 17.23) + 0.0531
3.4. Particle Swarm Optimization
- Initiate the positions pn and velocities vn of n particles.
- Evaluate the value of the PSO fitness function for each particle.
- Compare and update each particle’s own best position pbestn.
- Compare and update n particles’ global best position gbest.
- Update the positions and velocities:vn = w × vn + c1× random × (pbestn − pn) + c2 × random × (gbest − pn)pn = pn + vn
- After N iterations, stop the program.
Both c1 and c2 are chosen to be 2 [20], inertia weight W is 0.8, and the fitness function is:
F = a × 0.2 × lg (646.7 × x1 + 360.1 × x2 + 21.9) − b × [−1.73 × 10⁻⁶ × (−1206 × x12 + 1719 × x1 + 460.3 × x2 + 63.93 × x1 × x2 + 17.23)2 + 2.5 × 10⁻³ × (−1206 × x12 + 1719 × x1 + 460.3 × x2 + 63.93 × x1 × x2 + 17.23) + 0.0531]
The coefficients a and b, used to define different modes, represent the weight of air conditioner energy consumption and visual comfort, respectively.
4. Analysis and Results
The incident light increases the room temperature. Therefore, the air conditioner should work to remove it from the room to keep the room temperature unchanged. The incident light could be reduced by the curtain, which also influences occupants’ visual comfort. PSO is used to optimize the curtain-covered area of windows, and five modes are investigated for different applications, which are defined as below:
- (a)
- mode 1: a = 1 and b = 0, indicates that only energy consumption is concerned.
- (b)
- mode 2: a = 0 and b = 1, indicates that only visual comfort is concerned.
- (c)
- mode 3: a = 2 and b = 1, indicates that energy consumption has priority.
- (d)
- mode 4: a = 1 and b = 2, indicates that visual comfort has priority.
- (e)
- mode 5: a = 1 and b = 1, indicates the moderate policy.
The optimal solutions of 5 modes are listed in Table 4.
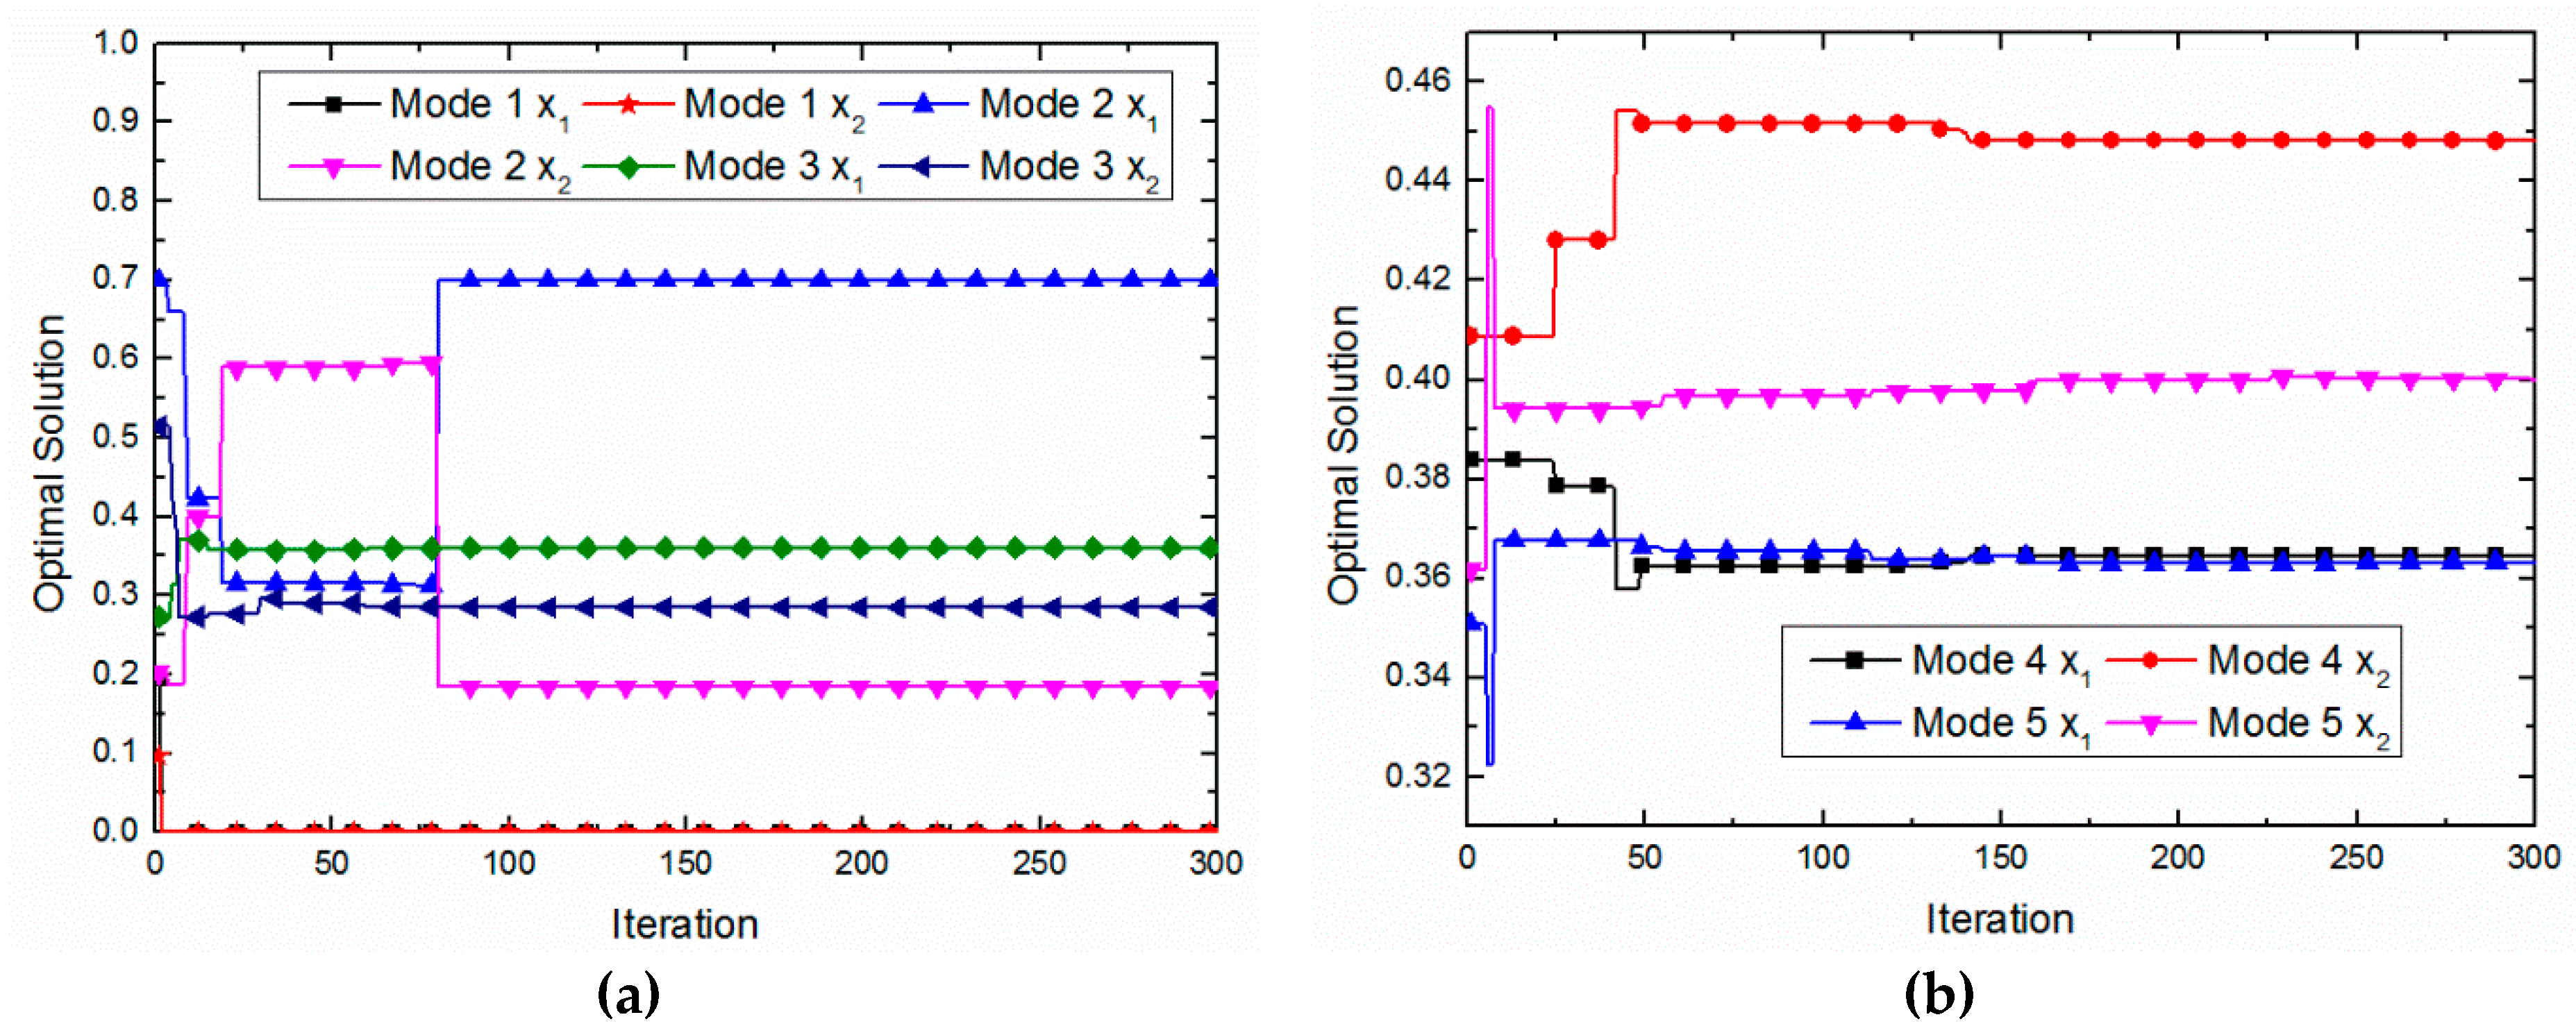
Figure 3a,b shows the complexity of PSO applied in this work. It is found that the optimal solution is obtained after 300 iterations for most cases, as shown in Figure 3, therefore N is set to be 300.
4.1. Mode 1 (a = 1, b = 0)
As shown in Table 4, the optimal solution is x1 = 0 and x2 = 0, which indicates the entire windows are covered by curtains, and no solar radiation could enter the room. Therefore the air conditioner energy consumption induced by the incident light is 0, while occupants’ visual comfort is the worst.
4.2. Mode 2 (a = 0, b = 1)
The optimal solution is x1 = 0.7 and x2 = 0.18, as shown in Table 4. Substituting this solution into (6), the corresponding visual comfort (occupants’ acceptability) is 0.96, which indicates that the natural light level is the best. The corresponding air conditioner power is 477 W.
4.3. Mode 3 (a = 2, b = 1)
The optimal solution is x1 = 0.36 and x2 = 0.29, as shown in Table 4. The corresponding visual comfort (occupants’ acceptability) is 0.94, and the corresponding air conditioner power is 360 W. Compared with mode 2, mode 3 achieves nearly the same visual comfort, while the air conditioner energy consumption is reduced by 24.5%.
4.4. Mode 4 (a = 1, b = 2)
The optimal solution is x1 = 0.36 and x2 = 0.45, as shown in Table 4. The corresponding visual comfort (occupants’ acceptability) is 0.96, and the corresponding air conditioner power is 417 W. Compared with mode 3, mode 4 has nearly the same visual comfort, but the air conditioner energy consumption increases dramatically. It is observed that it is the east window not the south window that is adjusted to improve the visual comfort, which could explain the stronger incident light on the south window.
4.5. Mode 5 (a = 1, b = 1)
The optimal solution is x1 = 0.36 and x2 = 0.4, as shown in Table 4. The corresponding visual comfort (occupants’ acceptability) is 0.95, and the corresponding air conditioner power is 399 W. Compared with mode 3, mode 5 has nearly the same visual comfort and larger air conditioner energy consumption.
By investigating the performance of all modes, it is found that mode 3 has the best performance. Compared with mode 2 which has the best visual comfort, mode 3 could reduce the air conditioner power about 117 w (25%), while the visual comfort is nearly the same.
5. Conclusions
The visual comfort and indoor AECE, both of which are induced by natural light at noon during summer in Shanghai, are optimized by employing the proposed model and optimization method. A fitness function measuring the visual comfort and the corresponding ACEC in the building was constructed, and the area of windows covered by curtains was used as the optimal parameter in the PSO. Five modes were defined and investigated for different applications, and mode 3 achieved nearly the best visual comfort with energy consumption reduced by 24.5%. The results verify that the proposed model and optimization method could work effectively to provide a good visual environment by utilizing natural light while reducing the ACEC of buildings.
Author Contributions
Conceptualization, Y.Z. (Yonggang Zhang) and Y.Z. (Yongwei Zhong); Methodology, Y.Z. (Yonggang Zhang); Writing—Original Draft Preparation, Y.Z. (Yonggang Zhang); Writing—Review & Editing, Y.Z. (Yongwei Zhong) and Y.G.; Supervision, L.Z.; Project Administration, Y.Z. (Yongwei Zhong).
Funding
This research was funded by the National Natural Science Foundation of China under grant number [61571135].
Acknowledgments
This work is supported by the National Natural Science Foundation of China under Grant No.61571135. The authors would like to thank the anonymous reviewers for their constructive comments.
Conflicts of Interest
The authors declare no conflict of interest.
Appendix A. Pseudocode of the Proposed Optimization
%Main function
%%%%%%%%%%%%%%%%%%%%
[xm,fv,C]=PSO(@fitness,20,2,2,0.8,300,2,0,0.7);% call PSO function
xxx2(:,1)=C(1,:);
xxx2(:,2)=C(2,:);
plot(xxx2) %plot optimal solution
xlabel(’Iteration’);
ylabel(’Optimal solution’)
%Fitness function
%%%%%%%%%%%%%%%%%%%%
function f=fitness(a,b)
f=A*0.2*log10(646.7*a+18.6+360.1*b+3.3)-B*(-1.73e-6*(17.23+1719*a+460.3*b-1206*a2+63.93*a*b)2+2.5e−3*(17.23+1719*a+460.3*b-1206*a2+63.93*a*b)+0.0531);
end
%PSO function
%%%%%%%%%%%%%%%%%%%%
function[xm,fv,C]=PSO(fitness,N,c1,c2,w,M,D,lb,ub)
% N-particle number, c1, c2-acceleration constants, w-inertia weight, M-iterations, D-particle dimension
%initialization:
x(i,j)=rand()*(ub-lb)+lb; %initialize position
v(i,j)=rand(); %initialize speed
%initialize fitness
p(i)=fitness(x(i,1),x(i,2));
y(i,:)=x(i,:);
%initialize local and global extremum
gbest=[x(1,1),x(1,2)];
for i=2:N
if fitness(x(i,1),x(i,2))<fitness(gbest(1),gbest(2))
gbest=x(i,:);
end
end
% iterations
C = zeros(2,M);
for t=1:M
for i=1:N
v(i,1)=w*v(i,1)+c1*rand*(y(i,1)-x(i,1))+c2*rand*(gbest(1)-x(i,1));
v(i,2)=w*v(i,2)+c1*rand*(y(i,2)-x(i,2))+c2*rand*(gbest(2)-x(i,2));
x(i,:)=x(i,:)+v(i,:);
for j = 1:D
if x(i,j)<lb
x(i,j) =lb;
end
if x(i,j)>ub
x(i,j) =ub;
end
end
if fitness(x(i,1),x(i,2))<p(i)
p(i)=fitness(x(i,1),x(i,2));
y(i,:)=x(i,:);
end
if p(i)<fitness(gbest(1),gbest(2))
gbest=y(i,:);
end
end
C(1,t) = gbest(1);
C(2,t) = gbest(2);
end
xm=gbest’;%optimal solution
fv=fitness(gbest(1),gbest(2));
References
- Xu, Z.; Jia, Q.; Guan, X.; Xie, X. A new method to solve large-scale building energy management for energy saving. In Proceedings of the 2014 IEEE International Conference on Automation Science and Engineering (CASE), Taipei, Taiwan, 18–22 August 2014; pp. 940–945. [Google Scholar]
- Gouda, M.M.; Danaher, S.; Underwood, C.P. Building thermal model reduction using nonlinear constrained optimization. Build. Environ. 2002, 37, 1255–1265. [Google Scholar] [CrossRef]
- Jiang, P.; Tovey, K. Overcoming barriers to implementation of carbon reduction strategies in large commercial buildings in China. Build. Environ. 2010, 45, 856–864. [Google Scholar] [CrossRef]
- Deb, C.; Zhang, F.; Yang, J.; Lee, L.S.; Shah, K.W. A review on time series forecasting techniques for building energy. Renew. Sustain. Energy Rev. 2017, 74, 902–924. [Google Scholar] [CrossRef]
- Oral, G.K.; Yener, A.K.; Bayazit, N.T. Building envelope design with the objective to ensure thermal, visual and acoustic comfort conditions. Build. Environ. 2004, 39, 281–287. [Google Scholar] [CrossRef]
- Muhamad, W.N.W.; Zain, M.Y.M.; Wahab, N.; Aziz, N.H.A.; Kadir, R.A. Energy efficient lighting system design for building. In Proceedings of the International Conference on Intelligent Systems, Modelling and Simulation, Liverpool, UK, 27–29 January 2010; pp. 282–286. [Google Scholar]
- Meredith, S. Beyond Light Bulbs: Lighting the Way to Smarter Energy Management; Emerald Book: Austin, TX, USA, 2008; ISBN 9781934572078. [Google Scholar]
- Lee, W.; Immadi, P.; Song, K.; Cho, H. A light control technique for energy-efficient buildings in visual comfort constrained environment. In Proceedings of the 2017 2nd International Multidisciplinary Conference on Computer and Energy Science (SpliTech), Split, Croatia, 12–14 July 2017; pp. 1–5. [Google Scholar]
- Basnayake, B.A.; Amarasinghe, Y.W.; Attalage, R.A.; Jayasekara, A.G. Occupancy identification based energy efficient Illuminance controller with improved visual comfort in buildings. In Proceedings of the 2017 Moratuwa Engineering Research Conference (MERCon), Moratuwa, Sri Lanka, 30–31 May 2017; pp. 304–309. [Google Scholar]
- Guillemin, A.; Morel, N. An innovative lighting controller integrated in a self-adaptive building control system. Energy Build. 2001, 33, 477–487. [Google Scholar] [CrossRef]
- Amirkhani, M.; Garcia-Hansen, V.; Isoardi, G.; Allan, A. An energy efficient lighting design strategy to enhance visual comfort in offices with windows. Energies 2017, 10, 1126. [Google Scholar] [CrossRef]
- Touma, A.A.; Ouahrani, D. Shading and day-lighting controls energy savings in offices with fully-Glazed facades in hot climates. Energy Build. 2017, 151, 263–274. [Google Scholar] [CrossRef]
- Hussain, H.M.; Javaid, N.; Iqbal, S.; Hasan, Q.U.; Aurangzeb, K.; Alhussein, M. An efficient demand side management system with a new optimized home energy management controller in smart grid. Energies 2018, 11, 190. [Google Scholar] [CrossRef]
- Naz, M.; Iqbal, Z.; Javaid, N.; Khan, Z.A.; Abdul, W.; Almogren, A.; Alamri, A. Efficient power scheduling in smart homes using hybrid grey wolf differential evolution optimization technique with real time and critical peak pricing schemes. Energies 2018, 11, 3155. [Google Scholar] [CrossRef]
- Rasheed, M.B.; Javaid, N.; Ahmad, A.; Jamil, M.; Khan, Z.A.; Qasim, U.; Alrajeh, N. Energy optimization in smart homes using customer preference and dynamic pricing. Energies 2016, 9, 503. [Google Scholar] [CrossRef]
- Piccolo, A.P.S.; Graditi, G.; Atrigna, M. Designing and testing decision support and energy management systems for smart homes. J. Ambient Intell. Hum. Comput. 2013, 4, 651–661. [Google Scholar]
- González-Briones, A.; Chamoso, P.; De La Prieta, F.; Demazeau, Y.; Corchado, J.M. Agreement technologies for energy optimization at home. Sensors 2018, 18, 1633. [Google Scholar] [CrossRef] [PubMed]
- González-Briones, A.; Prieto, J.; De La Prieta, F.; Herrera-Viedma, E.; Corchado, J.M. Energy optimization using a case-based reasoning strategy. Sensors 2018, 18, 365. [Google Scholar] [CrossRef] [PubMed]
- Al-Ali, A.R.; Zualkernan, I.A.; Rashid, M.; Gupta, R.; AliKarar, M. A smart home energy management system using IoT and big data analytics approach. IEEE Trans. Consum. Electron. 2017, 63, 426–434. [Google Scholar] [CrossRef]
- Kennedy, J.; Eberhart, R. Particle swarm optimization. In Proceedings of the IEEE International Conference on Neural Networks 6, Perth, WA, Australia, 27 November–1 December 1995; pp. 1942–1948. [Google Scholar]
- Wymelenberg, K.G. Visual comfort, discomfort glare, and occupant fenestration control: Developing a research agenda. LEUKOS 2014, 10, 207–221. [Google Scholar] [CrossRef]
- Mui, K.W.; Wong, L.T. Acceptable illumination levels for office occupants. Archit. Sci. Rev. 2006, 49, 116–119. [Google Scholar] [CrossRef]
- Si, W.; Ogai, H.; Hirai, K.; Takahashi, H.; Ogawa, M. An improved PSO method for energy saving system of office lighting. In Proceedings of the Sice Annual Conference (SICE), Tokyo, Japan, 13–18 September 2011; pp. 1533–1536. [Google Scholar]
Figure 1.
The framework of the proposed IIoT-based smart controlling system.

Figure 2.
The dimension and structure of the proposed model. (a) L1 = 6, W1 = 4, H = 2.8, L2 = 4. (b) The dimension of the south wall (m): L1 = 6, H1 = 2.8, H3 = 0.6, L3 = 5.88, H2 = 2, 0 ≤ W3 ≤ 5.88. (c) The dimension of the east wall (m): W1 = 4, H1 = 2.8, H3 = 0.6, L4 = 3.92, H4 = 2, 0 ≤ W3 ≤ 3.92.

Figure 3.
The optimal solution after 300 iterations. (a) Mode 1, 2, and 3. (b) Mode 4 and 5.


Table 1.
Pac at 12:00 am on 15 July.
| Pac (W) | x1 | x2 | Pac (W) | x1 | x2 |
|---|---|---|---|---|---|
| 70.8 | 0.1 | 0 | 37.0 | 0 | 0.1 |
| 141.5 | 0.2 | 0 | 74.0 | 0 | 0.2 |
| 218.0 | 0.3 | 0 | 111.0 | 0 | 0.3 |
| 283.0 | 0.4 | 0 | 153.0 | 0 | 0.4 |
| 372.9 | 0.5 | 0 | 184.8 | 0 | 0.5 |
| 413.0 | 0.6 | 0 | 221.8 | 0 | 0.6 |
| 441.7 | 0.7 | 0 | 249.9 | 0 | 0.7 |
Table 2.
Light level at position A at 12:00 am on 15 July.
| LL (Lux) | x1 | x2 | LL (Lux) | x1 | x2 | LL (Lux) | x1 | x2 |
|---|---|---|---|---|---|---|---|---|
| 201.3 | 0.1 | 0 | 282.9 | 0 | 0.6 | 531.4 | 0.1 | 0.7 |
| 311.3 | 0.2 | 0 | 321.9 | 0 | 0.7 | 655.3 | 0.2 | 0.7 |
| 413.1 | 0.3 | 0 | 261.6 | 0.1 | 0.1 | 894.8 | 0.5 | 0.7 |
| 474.1 | 0.4 | 0 | 426.5 | 0.2 | 0.2 | 490.2 | 0.3 | 0.1 |
| 536.7 | 0.5 | 0 | 582.3 | 0.3 | 0.3 | 680.8 | 0.3 | 0.5 |
| 582.5 | 0.6 | 0 | 709.0 | 0.4 | 0.4 | 762.1 | 0.3 | 0.7 |
| 629.1 | 0.7 | 0 | 814 | 0.5 | 0.5 | |||
| 52.2 | 0 | 0.1 | 916.6 | 0.6 | 0.6 | |||
| 91.4 | 0 | 0.2 | 1003.2 | 0.7 | 0.7 | |||
| 140.7 | 0 | 0.3 | 728.5 | 0.7 | 0.1 | |||
| 198.9 | 0 | 0.4 | 777.1 | 0.7 | 0.2 | |||
| 240.8 | 0 | 0.5 | 824.5 | 0.7 | 0.5 |
Table 3.
Occupants’ responses towards local visual environment [22].
Table 3.
Occupants’ responses towards local visual environment [22].
| VC | LL (Lux) | VC | LL (Lux) |
|---|---|---|---|
| 0.59 | 250 | 0.95 | 750 |
| 0.67 | 350 | 0.92 | 850 |
| 0.85 | 450 | 0.85 | 950 |
| 0.9 | 550 | 0.78 | 1050 |
| 0.97 | 650 |
Table 4.
Optimal solutions of 5 modes.
| x1 | x2 | ACEC (W) | |
|---|---|---|---|
| mode 1 | 0 | 0 | 0 |
| mode 2 | 0.7 | 0.18 | 477 |
| mode 3 | 0.36 | 0.29 | 360 |
| mode 4 | 0.36 | 0.45 | 417 |
| mode 5 | 0.36 | 0.4 | 319 |
© 2018 by the authors. Licensee MDPI, Basel, Switzerland. This article is an open access article distributed under the terms and conditions of the Creative Commons Attribution (CC BY) license (http://creativecommons.org/licenses/by/4.0/).
Share and Cite
MDPI and ACS Style
Zhang, Y.; Zhong, Y.; Gong, Y.; Zheng, L. The Optimization of Visual Comfort and Energy Consumption Induced by Natural Light Based on PSO. Sustainability 2019, 11, 49. https://doi.org/10.3390/su11010049
AMA Style
Zhang Y, Zhong Y, Gong Y, Zheng L. The Optimization of Visual Comfort and Energy Consumption Induced by Natural Light Based on PSO. Sustainability. 2019; 11(1):49. https://doi.org/10.3390/su11010049
Chicago/Turabian StyleZhang, Yonggang, Yongwei Zhong, Yingda Gong, and Lirong Zheng. 2019. "The Optimization of Visual Comfort and Energy Consumption Induced by Natural Light Based on PSO" Sustainability 11, no. 1: 49. https://doi.org/10.3390/su11010049
Note that from the first issue of 2016, this journal uses article numbers instead of page numbers. See further details here.