Article

Experimental Confirmation of the Reliability of Fanger’s Thermal Comfort Model—Case Study of a Near-Zero Energy Building (NZEB) Office Building

by
Michał Piasecki
1,
Małgorzata Fedorczak-Cisak
2,*,
Marcin Furtak
2 and
Jacek Biskupski
3
1
Building Research Institute, 00-611 Warsaw, Poland
2
Faculty of Civil Engineering, Cracow University of Technology, 31-155 Cracow, Poland
3
Faculty of Energy and Fuels, AGH University of Science and Technology in Cracow, 30-059 Cracow, Poland
*
Author to whom correspondence should be addressed.
Sustainability 2019, 11(9), 2461; https://doi.org/10.3390/su11092461
Submission received: 27 February 2019 / Revised: 15 April 2019 / Accepted: 22 April 2019 / Published: 26 April 2019

Abstract

:
Designing and constructing near zero energy buildings (NZEBs) is a challenge not only from a structural point of view, but also from the point of view of ensuring appropriate climate comfort for users. The standards describing how to ensure comfort were created in times when the challenges of building ZEB/NZEB were not yet explored and energy issues were not as important as they are today. Therefore, the assessment of the thermal and climatic comfort of people living and working in such buildings requires a new or revised approach to the methodology of thermal comfort assessment. In this article, the authors present the results of a thermal comfort study based on measurements and thermal sensory tests. Testing was carried out in an experimental office building (passive standard). The main goal of the experiment was to compare the thermal comfort measurement method based on the ISO-Fanger model with the actual comfort results obtained by the panellists in the model office condition. The tests allowed the lowest operating temperature providing thermal comfort (predicted mean vote (PMV) = 0 and −0.5) to be determined. Sensory tests were conducted using three types of questions. The results were compared to the other researchers’ findings. It was noted that the panellists showed better thermal comfort sensation at lower temperatures than would result from the traditional Fanger distribution, so the authors proposed the experimental function of percentage of dissatisfied (PPD) = f(PMV). The authors hope that it contributed to the actual state of knowledge as a “small and specific scale” validation of the existing thermal comfort model. The results also revealed that the method of heating has an influence on the subjective thermal sensation.

1. Introduction

The issue of human thermal comfort in buildings already has over 50 years of history [1] and was practically standardized by ISO, CEN, and ASHRAE in both hemispheres [2,3]. However, in the actual opinion of scientists [4,5,6,7,8,9,10,11,12,13,14,15,16,17,18,19], the subject of comfort, including the thermal satisfaction of building users in relation to technical building systems, still creates a potential field for research and several new questions have arisen in recent years. First, because the construction methods that focus on building energy efficiency and users’ wellbeing have changed significantly since the time Fanger published his research and the first international standards in this area were introduced. Changes in the perception of comfort in buildings are partially responsible for ASHRAE revising its standard on thermal environmental conditions for human occupancy [3] in 2017, while CEN currently applies standard prEN 16798-1 to indoor environmental input parameters for the design and assessment of energy performance of buildings, which also addresses thermal comfort [20] and replaces standard EN 15251 [21]. Changes in construction have led to a large difference between comfort in Naturally-Ventilated (NV) buildings [22] and those where mechanical ventilation (HVAC) is used [23]. Studies conducted in recent decades indicate new parameters determining important factors in user comfort, with more parameters having a significant impact on the comfort, wellbeing and even health of people living and spending time in enclosed spaces [24]. The number of parameters that affect comfort increased from the four basic parameters indicated by Fanger to as many as ten that are cited nowadays, in particular for NZEB buildings promoted by the European Energy Directive [25]. As a result, the simple definition drafted 50 years ago, which states that thermal comfort “is that condition of mind, which expresses satisfaction with the thermal environment" [1], no longer meets the current expectations of investors and building residents. A large population of researchers agrees that “indoor comfort” should be considered in a much broader context [26]. Some scientists have gone ahead with defining the building users comfort indicator based on users’ predicted satisfaction. Over the last few years, there has been wide discussion in the literature [27,28,29,30] on whether the linear model was designed for assessing the Indoor Environmental Quality (IEQindex). This index was designed taking into consideration standard EN15251:2007 [21], mainly for calculating the percentage of people satisfied with indoor environmental quality as a function of the four parameters: air quality and user perception of thermal, acoustic and visual comfort. In fact, the characteristics of the IEQ model should also contain the synergy effect of environmental parameters included in sub-components and their sensory perception, as suggested by ASHRAE Guideline 10 [31] and the effect of measurement accuracy on the IEQ sub-component parameters [32]. The overall assessment index values of perceived IEQ vary on a scale from 0 to 100%, and may provide the basis for classification of the indoor environmental quality of a building. IEQ sub-models use the more or less accepted empirical dependencies that determine the impact of individual aspects on the user’s satisfaction, as is the case in the case of thermal impacts and their impact on thermal influence on user satisfaction. However, these models evolve over time as more and more data are collected by scientists in the various analysed cases of modern buildings [33,34,35]. As part of their research work on IEQ [32,36], the authors have identified the need to also focus and review the thermal comfort model used for IEQindex calculation and validate the thermal model in practice on the energy-efficient building. In the case of modern buildings with integrated HVACR systems, as in our research case study, there is more scope for influencing additional comfort parameters (apart from temperature and humidity, which are still widely used worldwide to assess thermal comfort). It is important that by using Building Management Systems (BMS) it is not only possible to measure the comfort-related factors but also to adjust them. Therefore, it should be possible to discuss the climatic comfort as IEQ and the actual number of satisfied users instead of physical parameters only or thermal comfort alone. And also taking into consideration the justified questions arising from the correlation of the Predicted Percentage of Dissatisfied (PPD) and Predicted Mean Vote (PMV) based on the standards in comparison to the actual satisfaction of users and whether the current sensory responses of users coincide with values based on the thermal model. This was one of the research challenges that has been discussed in the article. In the authors’ opinion, thermal measurements based on the ISO 7730 [2] standard alone are not perfect for reflecting the wide spectrum of climate sensations. It seems that the best solution is to compare the measurement results and user responses within strictly defined experimental conditions. In practice, modern HVACR systems offer new possibilities not seen in the times of Fanger, such as individually adjusted climate comfort parameters or on-demand ventilation (VOD) controlled, e.g., by the actual concentration of CO2 in the air. Control of these parameters allows climatic comfort to be designed and even corrected during the use of the rooms. Other authors also point to the possibility of using a modern heating system to control climate comfort while increasing energy efficiency [37]. The authors therefore believe that PMV and PPD parameters can nowadays not only be measured but also corrected in real time. Another interesting subject is the issue of summer comfort (mainly related to the need for room cooling) vs. winter comfort, as well as linking the differentiation of comfort results with the geographical location, even within Europe [24]. For countries located in “colder parts” of the Earth (e.g., northern or central European countries), to which our country belongs and where these studies were conducted, ensuring full climatic comfort in winter poses a greater challenge than in summer, i.e., in a completely different way than in Australia [38]. The literature also increasingly distinguishes important comfort parameters for residential buildings from buildings such as schools or hospitals [39,40,41]. In practice, due to the size and the most important parameters determining the comfort of these rooms, one can actually speak of completely different standards of climatic comfort for a hospital [42] and for a single-family house. Which is why it seems so important to define both the region and the type of building in which the research is carried out, even for research using Fanger’s methodology. It is worth remembering that the Fanger model was based on results obtained from surveys [7,43] and supported by Nevins questionnaire results [44], but the raw study was based on sixty-four student answers for only 13 temperatures (18.9 °C–32.2 °C) and only one humidity (50%), where it was assumed that the radiation temperature is equal to the measured actual temperature. Despite numerous listed tests to which the ISO 7730 standard refers [45] carried out on various types of objects, in various climatic states and on differently aged populations, the thermal model has not changed to this day. Basically speaking, neutral thermal comfort is established when the heat released by the human body is in equilibrium/balance with its heat production. There are major recognized parameters that affect thermal sensation results. These parameters can be grouped into two categories. One related to the building itself, the so-called “technical parameters of the indoor environment”, including: air temperature, the temperature of the surrounding surfaces (so-called radiant temperature), air speed and turbulence, relative air humidity and the parameters of the space tested and parameter gradients. There is a wide range of combinations of these factors where the level of comfort may be satisfactory, which may be called the “comfort zone”. The comfort zone is mainly determined by provisions provided in standard ISO 7730. According to a normative approach, it was essential for the authors to include them in the presented research, taking into consideration that: the sultriness limit in relation to the air humidity should not be exceeded; the air speed has to be within closely defined limits (for speeds under 0.1 m/s, the number of dissatisfied occupants due to draughts is less than 6%); the difference between radiant temperature and air temperature should remain small during the test; the difference in the radiant temperature in various directions should remain negligible (less than 5 °C, known as the “radiation temperature asymmetry”); the indoor air temperature stratification has to be less than 2 °C between the head and ankles of a seated person; and the perceived temperatures in the laboratory room should change by no more than 1 °C at different spheres. Bearing these requirements in mind, the authors introduced them to the laboratory office under examination. It is commonly accepted knowledge that the more irregular the thermal field in a room, the greater the expected number of dissatisfied people. As the result of the sensitivity analysis of the effects of physical parameters on the measurable results of PMV and PPD (pre-test activity) the authors knew that the biggest influence on thermal sensation would be the actual temperature, then the temperature of radiation and the humidity followed by the air flow associated with the installation and the number of air exchanges. The second group of parameters affecting the assessment of thermal comfort is the so-called “human factors” group and this group includes parameters related to the panellists, such as: population size; population quality; ethnicity; age; gender; weight; height; body surface area; body mass index; activities; clothing; adaptability to temperature changes; daily and monthly cycle; metabolism; and current nutrition. Authors made the justified assumptions and simplifications for these factors in the provided research and present details of these assumptions in the Method section of this paper. For the authors, academics, the main target group for panel research is students. Students spend more than 40% of their time in classrooms, and climate comfort has a particular impact on the effects of their work and learning – and even on their health. It is also a very open and flexible group, and willing in practice to take part in thermal tests. However, it is also a group which, as shown by [46], may have a specific greater adaptability, achieving subjective comfort earlier than the average adult group. Some authors explicitly indicate that adolescents may feel thermal comfort in a greater range of temperatures than adults [47], which may have a significant impact on the PMV determination. According to Fanger, the sensation of thermal comfort for older people and students should not show statistically representative significant differences. The research presented in our paper was conducted on a group of 50 students similar to Fanger’s panellists and the results refer to the whole group without distinction by gender. Numerous authors, including Fanger himself, have shown that the difference between the results obtained by women and men is not statistically significant (confidence level of 5%). Our opinion is rather similar; currently, it is recognized that the differences in thermal sensation between a woman and a man don’t depend on gender itself but on the anthropometric parameters like body mass index (BMI), speed of metabolism, the length of hair and the way of dressing it, the thermal resistance of clothing used and muscle mass.
Another research aspect discussed in the paper is that almost all energy-efficient buildings operate at lower heating temperatures. In our opinion, these temperatures might not usually provide high classes of thermal comfort in accordance with [48]. The authors believe that it is important to validate whether the proposed or designed room temperatures provide comfort to users who have to perform certain activities in the rooms, taking into account the various systems’ inertia, temperature changes, thermal inertia of partitions, thermal radiation and temperature gradients. The hypothesis is that the use of simple thermal comfort measurements may not fully reflect the actual thermal sensation of the users. Achieving a high level of energy efficiency while providing adequate climate comfort for each type of building is becoming a challenge for the future in which scientists and the authors have already started work. In this context, the definition of the limits of sensory comfort takes on a new meaning. The research currently underway in the experimental office enables PMV tests to be carried out over a shorter period of time on a much larger number of participants, while at the same time observing the impact of the way this comfort is achieved, depending on the extensive set of parameters of the HVACR system. Lowering the temperature of the heating medium, for example, may affect the feeling of climate comfort, especially in rooms with underfloor heating. The experimental office rooms used for such tests were prepared in the energy efficient building of the Małopolska Laboratory of Energy Saving (MLBE) of the Cracow University of Technology. This building was designed and erected as an experimental laboratory building, where both educational classes and advanced climate comfort tests were conducted (see detailed description of room tested in the methodology section). The research conducted made it possible to apply several methods of space heating at the same time, e.g., underfloor and air heating, which in turn enabled quick regulation of climate comfort parameters over a range of temperature and humidity, as well as CO2 and TVOC concentration (a separate material and article). The study in MLBE also allowed a significant number of people (up to 30) to be examined, assessing comfort in a “right-here-right-now” questionnaire, within a designated period of time. They were tested regardless of the prevailing outdoor temperatures, as opposed to studies conducted throughout the year [48], where the influence of the outdoor temperature on the examined people may prove to be important. One of them turns out to be the differences (e.g., vertical gradient) of floor temperature (usually changing its temperature relatively slowly), in relation to the temperature of the air (supplied), which may cause the additional discomfort noted and described in the literature, e.g., in the standard [21]. The tests in the MLBE laboratory gave the authors the possibility of preparing a spectrum of climatic conditions, and the data to compare with the standardized thermal model and the assessment methodology.
During the thermal sensory output assessment, the authors also discovered that the way of asking a question about actual sensory thermal comfort in the office may affect the final results. The conducted research shows that the question about actual thermal comfort for office work and general thermal comfort gives slightly different results. The results coincide with Fanger’s results and constitute a basis for discussing the issue of thermal comfort in almost zero energy buildings.

2. Materials and Methods

2.1. Goals of the Experiment

The main goal of the experiment was to compare the thermal comfort measurement method based on the Fanger/ISO 7730 model with the sensory comfort results obtained by the panellists in the experimental model office. Other aims of the study are:
-
conducting an experiment to determine the lowest operating temperature giving thermal comfort (PMV = 0 and −0.5) in the experimental space of the MLBE building by way of physical measurements and sensory questionnaire surveys of a statistically representative panellist group (the size of the test group is 50),
-
comparing the results of sensory tests obtained by means of three types of questionnaire questions with environmental measurement results and resulting from the Fanger-ISO 7730 comfort thermal model,
-
determining the impact of three question types on the results (seven-scale question, 0–100% scale question, yes/no question),
-
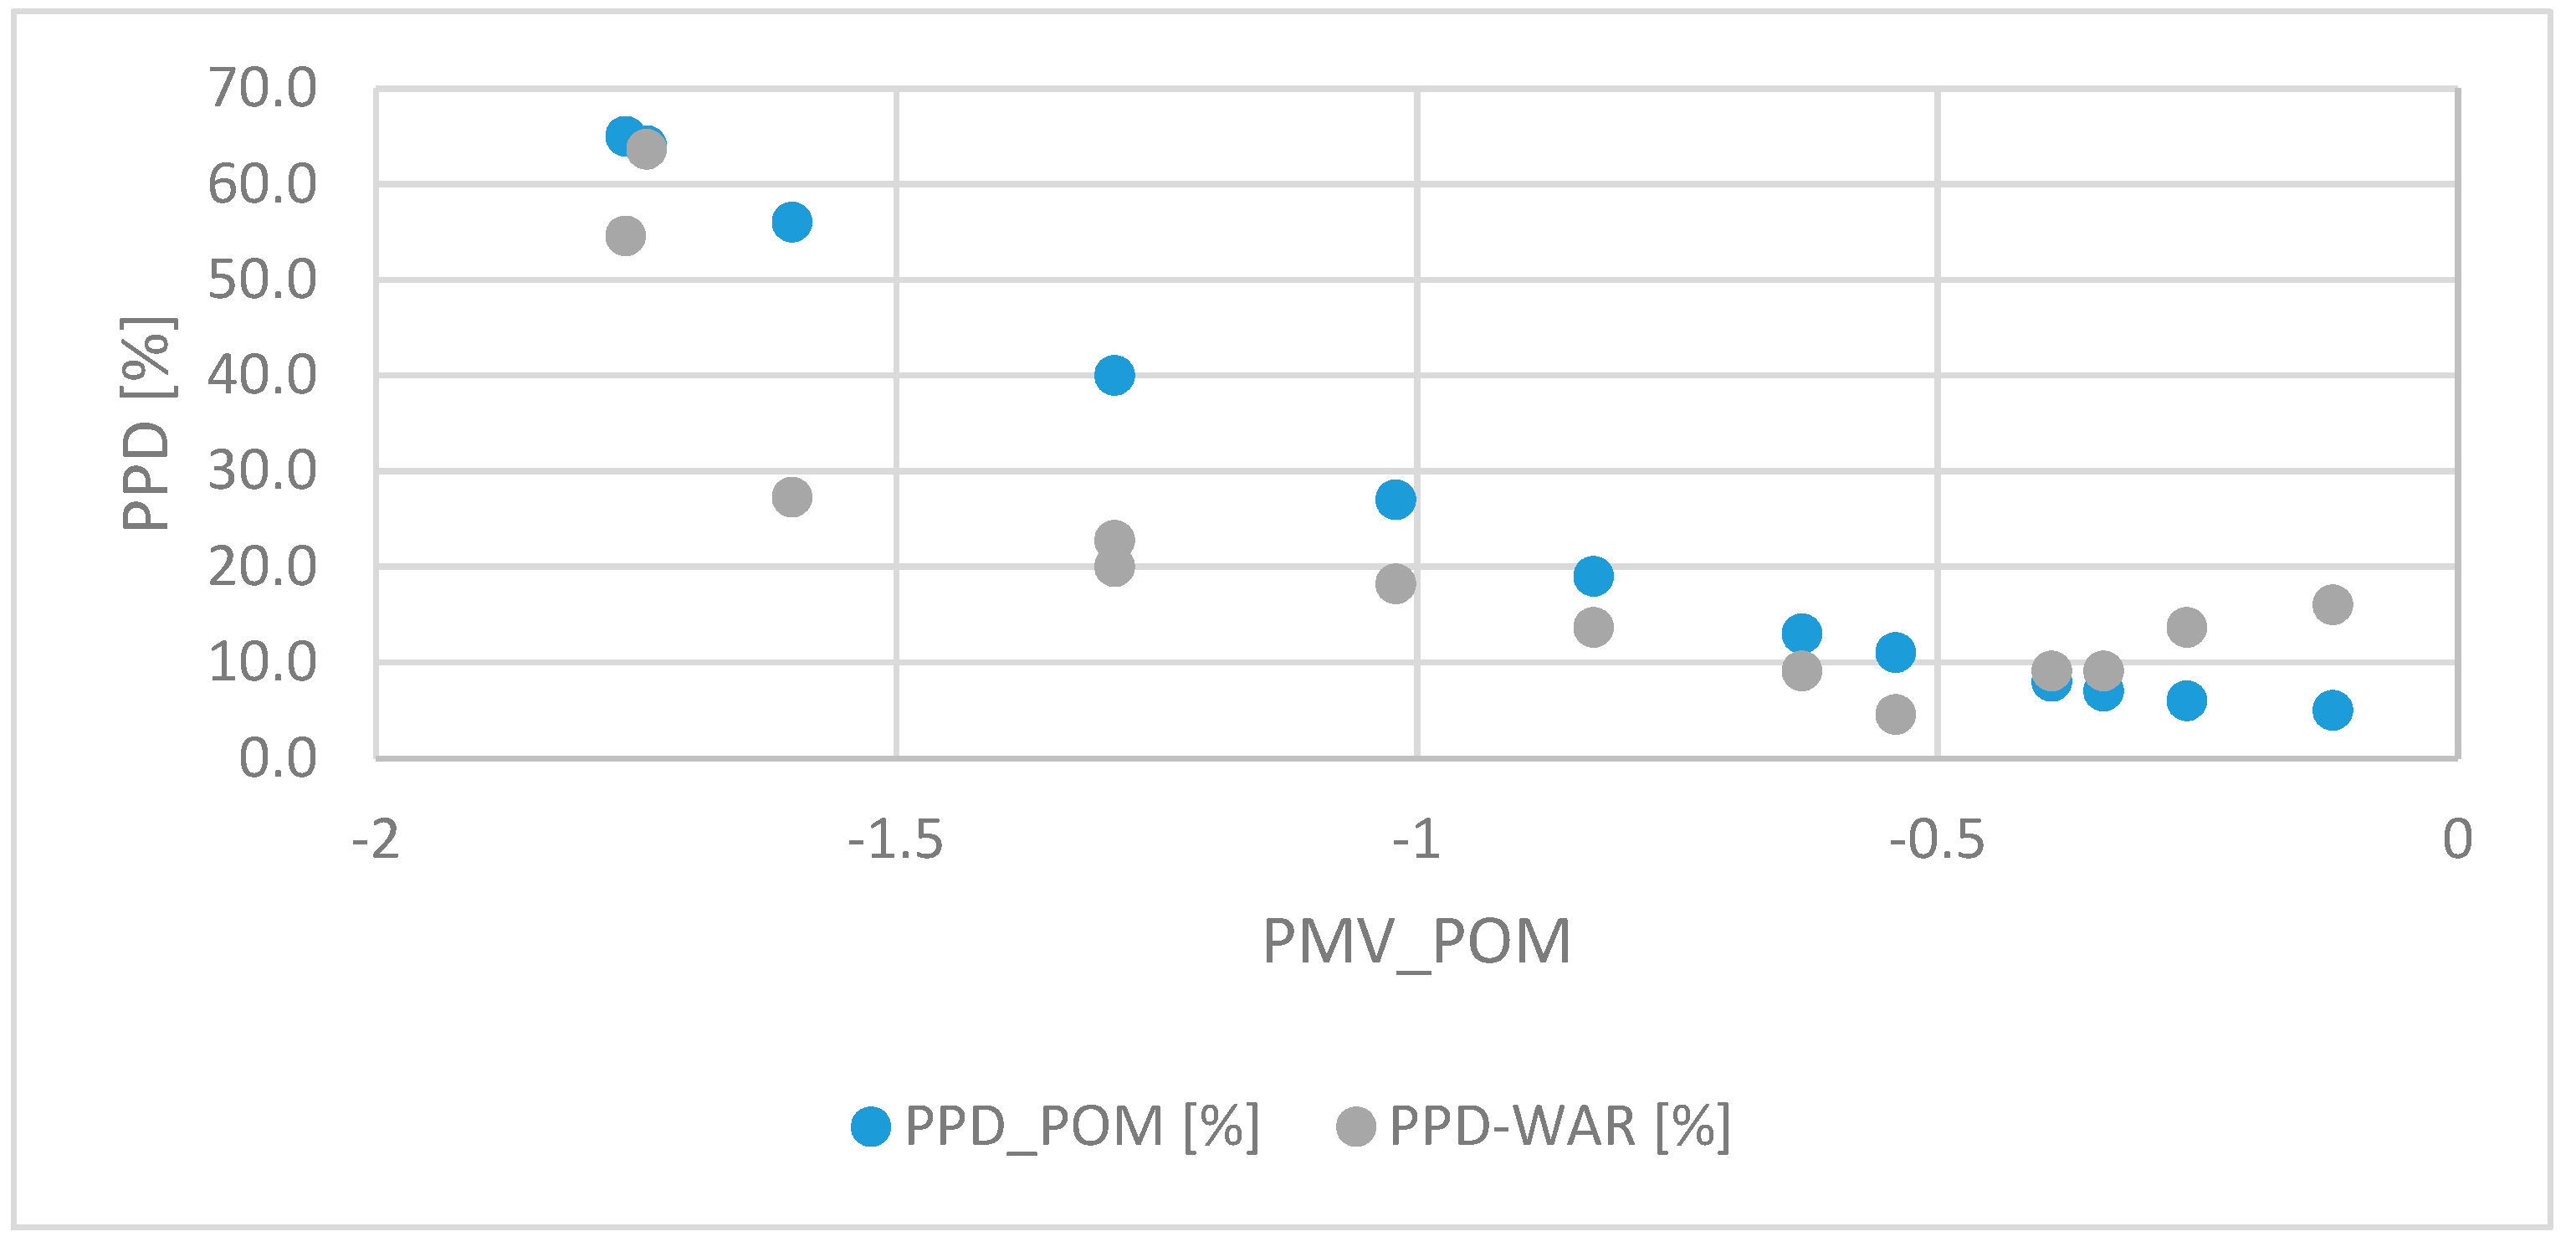
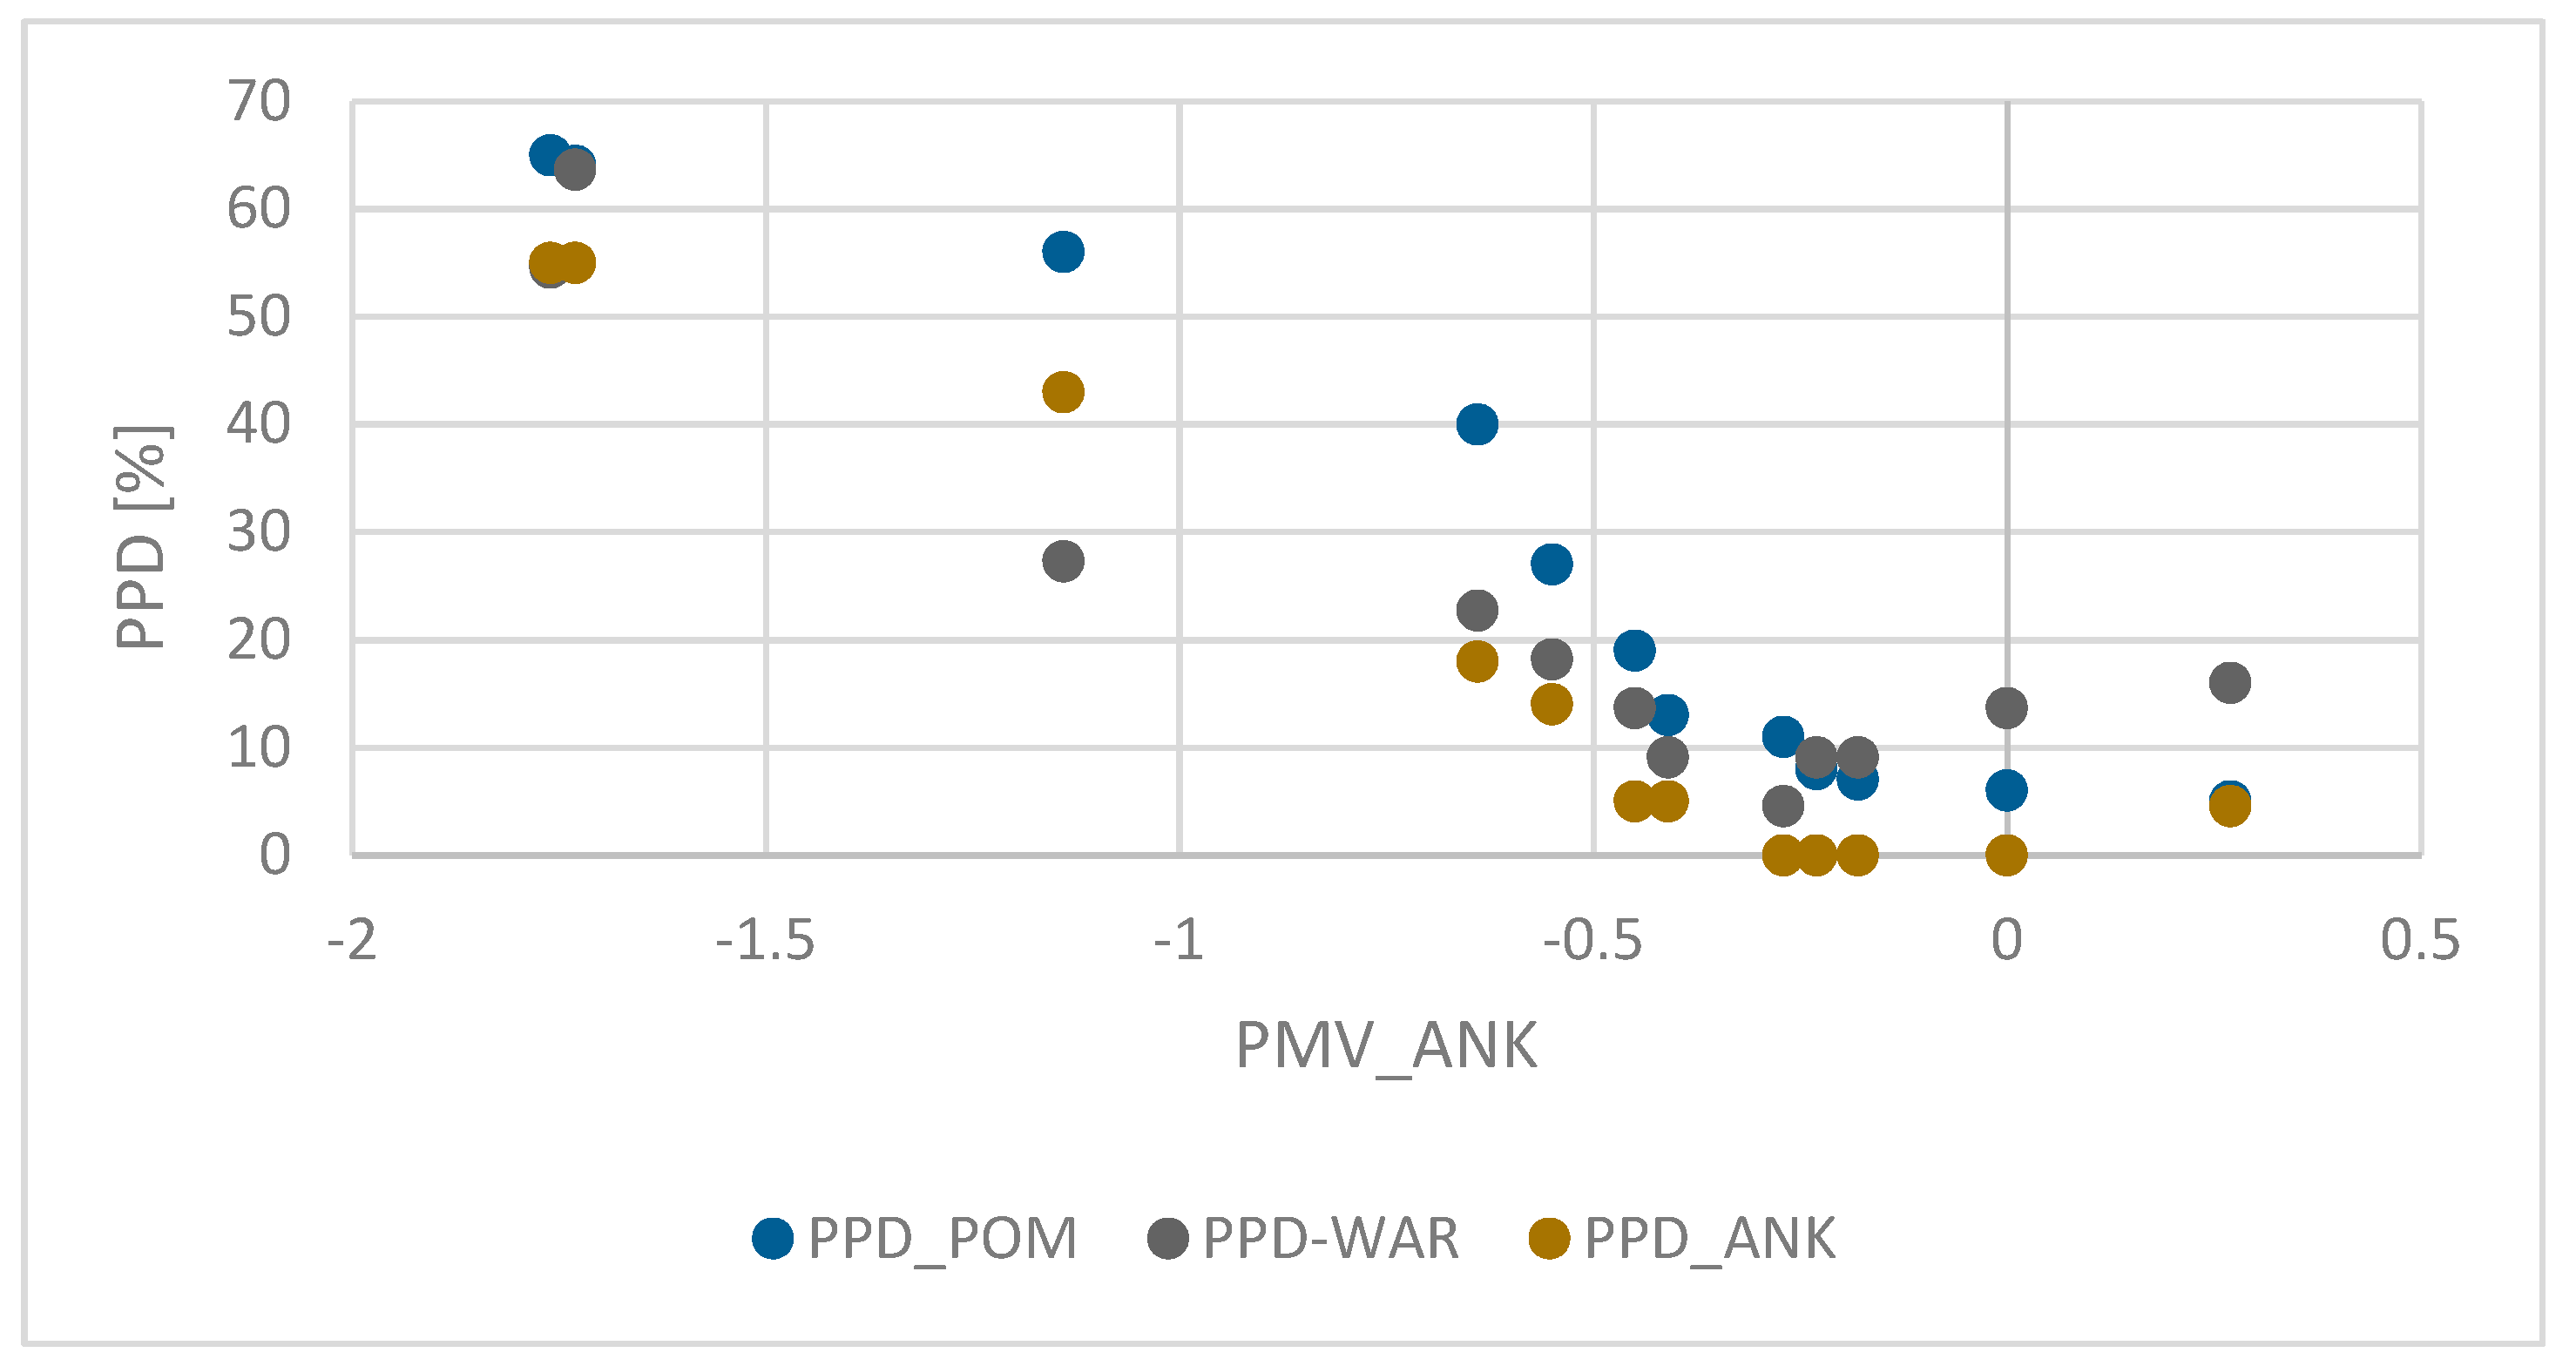
comparison and discussion of results obtained by measuring method and results of surveys (PPD = f(PMV),
-
comparing the raw results of surveys (PPD) obtained by other researchers with the authors’ own survey results,
-
proposing an equation for the experimental thermal comfort curve for given boundary conditions on the basis of the obtained results—a “limited scale” validation of the existing thermal comfort model
A graph showing the assumptions and steps of the experiments is presented in Figure 1.
One of the intentions of the experiments was to establish a comparative scale for previously conducted studies (American and Danish) in the context of the practical use of the Fanger equation (and ISO 7730) for nZEB buildings and for the provided boundary conditions. The results obtained by the authors are of an illustrative nature for a specific nZEB building case study —not generalizing the issue of thermal comfort for other building user populations. The authors’ intention was not to validate the thermal comfort model for different populations that Fanger did and was not to create a compendium of knowledge about the whole issue of thermal comfort assessment taking into consideration all challenges related to specific human reaction aspects (grouping results due to the parameters of the people being tested). Experiments of this type are very labour-intensive, which is why authors conducted them using the limits and simplifications provided as boundary conditions. In the most recent studies, usually one person or a very small group was tested in the research chamber. The intention of the authors was not to directly copy experiments. It was decided to carry out an experiment involving number of panellists at the same time in the laboratory office. The number of panellists corresponded to the assumed number of employees in the office, so the result obtained at one time reflects the average thermal comfort of employees. This approach, in our opinion, may be practical within the context of determining operational temperatures for the NZEB offices where a thermal sensory survey can be more appropriate than widely accepted tests using “the measurement” operating on the ISO 7730 algorithm.

2.2. Thermal Comfort Model

The model for assessing the thermal comfort of an indoor office area is based on the assessment of the indoor environment’s physical parameters. For the case-study building equipped with heating and cooling systems, the indicator predicted mean vote (PMV) is determined in accordance to ISO 7730 [2]. PMV is a reference parameter for thermal environmental assessment as provided in the standards EN 15251 [21], draft of FprEN 16798-1 and [20]. PMV is a seven-point scale of thermal sensation in a function of measured physical parameters as presented:
PMV = f (ta, tmr, va, pv, M, Icl)
where ta is the air temperature [°C], tmr is the mean radiant temperature [°C], va is the relative air velocity [m/s], pv is the water vapour partial pressure [Pa], M is the metabolic rate [W/m2] and Icl is the clothing insulation [m2K/W].
The measurement methodology is based on standard methodology [49]. PMV is required to determine the predicted percentage of dissatisfaction which is calculated by the following formula:
PPD = 100−95·exp (−0.03353·PMV4 – 0.2179·PMV2)
In practice, the values of PMV and PPD are determined by measurement equipment or can be calculated by the web-tool located at http://comfort.cbe.berkeley.edu/EN of the Center for the Built Environment, University of California, Berkeley.

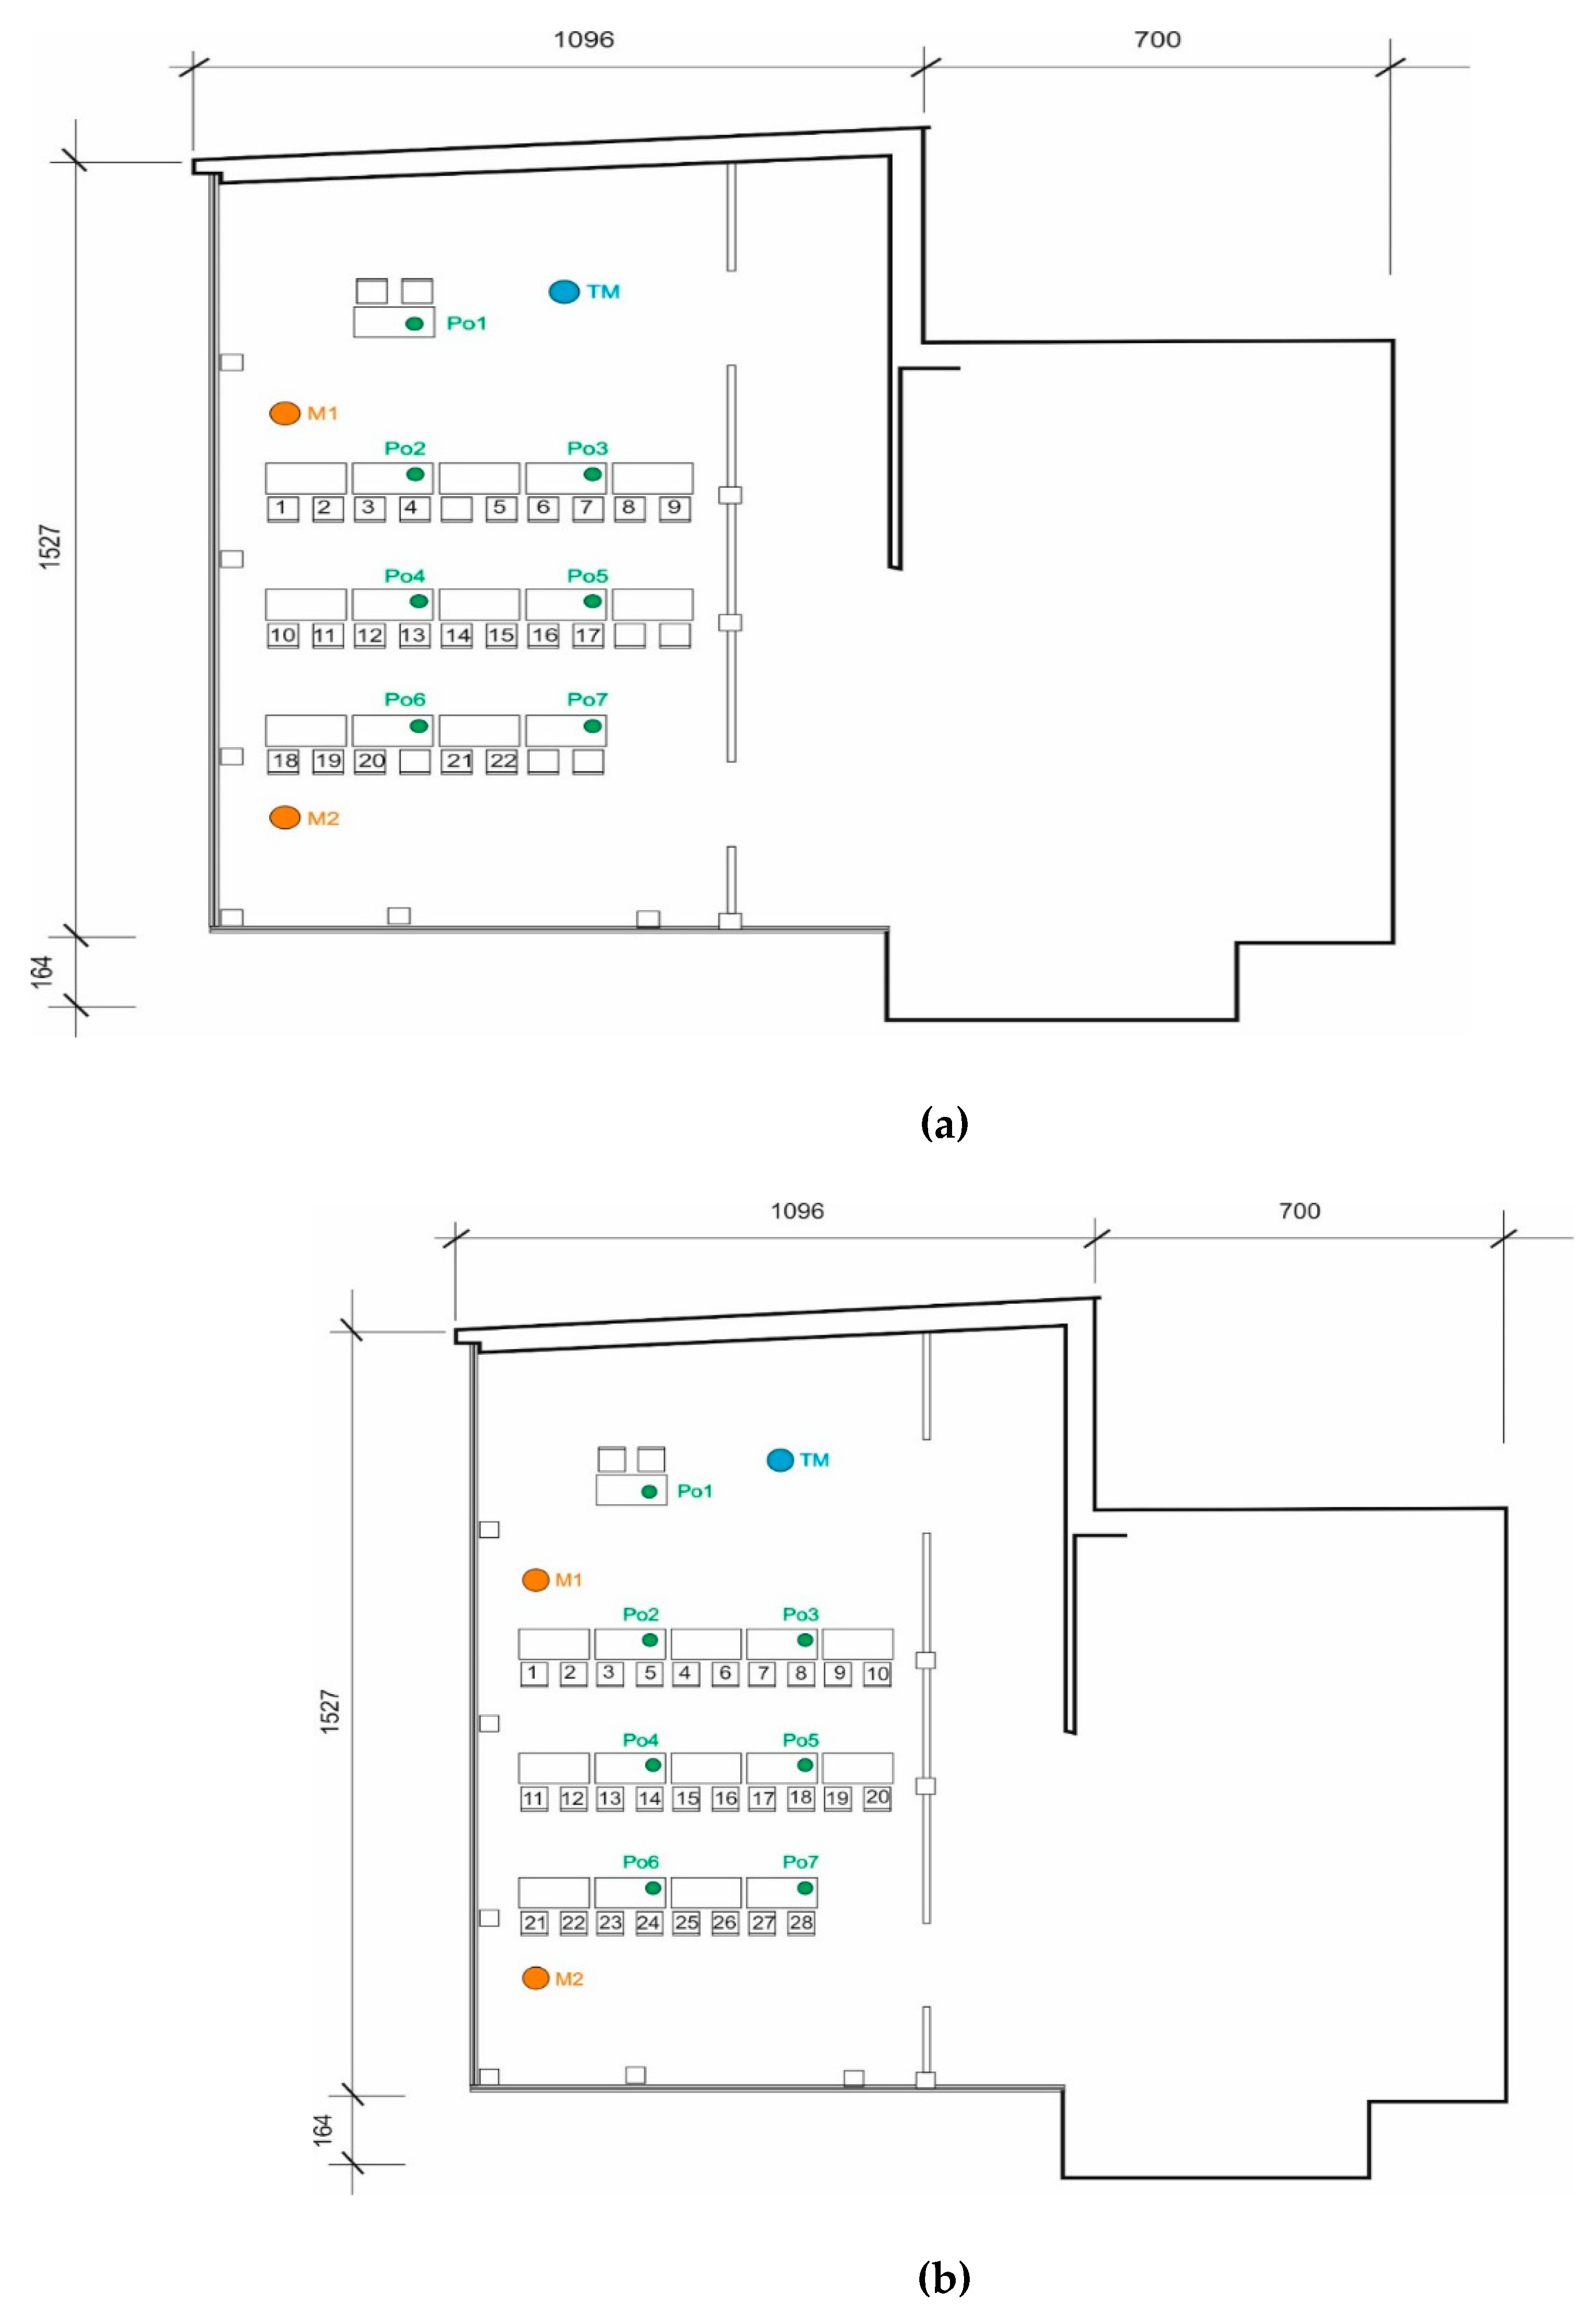
2.3. Case Study Object and Boundary Conditions

The test on PMV/PPD and the sensory thermal comfort of the NZEB building users was carried out in the experimental building of the Małopolska Laboratory of Energy Efficient Building (MLBE) (Figure 2a), in the lecture/office hall on the third floor. The national plan equates to a “nearly zero energy building” with a “low-energy building” and gives its definition: “A building with low energy consumption” should be understood as a building that meets the requirements related to energy saving and thermal insulation included in the technical regulations-construction, referred to in Article 7 of the Act of 7 July 1994—Construction Law, in particular, Section X and Annex 2 to the Regulation of the Minister of Infrastructure of 12 April 2002 on the conditions technical requirements that should be met by buildings and their location, effective from 1 January 2021, and for buildings occupied by public authorities and owned by them—from 1 January 2019. MLBE building has a high level energy supply systems for the building including: tri-generation system (simultaneous generation of thermal and cooling energy and electric)—powered by natural gas—consists of a co-generation unit (CHP) and an absorption refrigerating device, compressor reversible heat pump type glycol/hot water from the ground—3 vertical probes, 99 m deep each, ground heat exchanger heating in the winter and cooling in the summer part of the ventilation, ventilation heat recovery units with moisture recovery with efficiency greater than 80%, photovoltaic cells placed on sunblinds, and on the roof of the building; the links on the blinds have a system of automatic orientation towards the sun, flat and vacuum solar collectors supporting the hot water preparation system. All energy supply systems for the building are combined into one an adaptive and smart control system with a purpose function related to the minimization of primary energy consumption (USAD system). Internal installations are: supply and exhaust mechanical ventilation system taking into account the periodicity of operation and the regulation of the fresh air stream with the use of CO2 sensors, exhaust ventilation system operating periodically connected with automatically tilting windows that allows using the building’s accumulation capacity for cooling (“night storage cooling” combined with building materials containing variable-phase components), underfloor heating and air heating system depending on the thermal zones of the building. U-values of building elements are: the external walls-ventilated 0.1 W/(m2K), roofs and floor on the ground 0.1 W/(m2K), glass facades and doors 0.7 W/(m2K). The end use energy is at passive house standard EK = 11.6 kWh/(m2 year). The tests were performed on 19 and 20 December 2018. Figure 2b shows the view of the places on which the respondents were asked about thermal comfort. MLBE is located in Cracow, designed to conduct building physics research under “in situ” conditions.
Figure 3a,b show the floor section and location of testing devices, as well as the panellists’ location (numbers) in the two day study (M1, M2 are main measurement devices for indoor parameters, Po1-Po7 secondary, see section on measurement devices).
During the tests blinds on the glass facades were lowered, the respondents answered questions in artificial light (range 450–500 lux). The test room was cooled to +17.0 °C as to be the initial temperature for the first thermal comfort test. The initial conditions were maintained for 24 hours before the beginning of the task. The humidity level (RH) was set at the range of 25–35%. The ventilation system used the standard exchange settings of 1.2 changes per hour. The locations of the air vents are shown in Figure 4a. After the respondents took their positions, the heating function was activated to slowly and continuously warm up to +24 °C where the thermal neutral sensation (PMV = 0) was expected. The change in temperature from very cold to neutral level was planned over 2 hours. Two full temperature sessions were done (first and second day). Fan coil units (air heating) located in accordance with Figure 4b were used to heat the room.
The measured CO2 level did not exceed 1000 ppm during the 2 days test, which authors assume did not affect the thermal index results.

2.4. Panel Group

The survey involved: 22 students of AGH University of Science and Technology in Krakow on 19 December 2018 and 28 students of Cracow University of Technology on 20 December 2018. The panellist group was ethnically homogenous—a white human variation, type Caucasian. Participants declared a healthy state before. All necessary anthropometric data characterizing the panel group is provided in Table 1. Table 1 also compares the panel group with the group used in Fanger’s research (including standard deviations).
The group of panellists admitted for research meets the parameters given for the group accepted for research by Fanger so the authors’ focus is on a parametrically comparable group. According to Fanger’s research, it was assumed that the sensation of thermal comfort for older people and academic youth panellists should not show statistically representative significant differences, so the authors decided not to assess any other age group under this research. The group of panellists reflects the potential employees of the academic nZEB office building, where young people are the dominant faction. The average age of panellists was twenty-two, and this value is only 2.5% lower than for Fanger’s panellists. The average height was 5% lower, and the body mass index (BMI) was higher by 6%. BMI was developed almost 200 years ago by Adolf Quetelet and is currently used by research centres dealing with health, including thermal comfort. All panellists surveyed had an average BMI of 24.16 at the limit of normal body weight, i.e., 18.5 < BMI < 24.9, similar to that of Fanger where his panellists’ index was 22.16. This value is 7% higher. The value of BMI for the group may slightly affect the result. It is common knowledge that people with a higher fat content in body weight may be more tolerant of lower temperatures. The authors do not take into consideration that the slightly higher BMI index from Fanger’s panellists could affect the obtained results, because the BMI difference from Fanger is statistically low. The authors have the prodigiousness of other various human factors that may affect the result of thermal comfort test results, including: psycho-physical condition, physiological circadian (day rhythm), ethnicity and nutrition before tests. Fanger stated that the difference between the results obtained by women and men is not statistically significant (confidence level of 5%). Taking this simplification into account, the authors did not focus on the differences in results obtained by men and women, instead analysing the results averaged for the studied group as a whole. The authors acquired the results with a gender distinction so they may be used as part of another publication. The value of clothes’ thermal resistance (clo) between women and men was also averaged and calculated despite the fact that some women have long hair and wear extra underwear (e.g., bra). Panellists were wearing long trousers, short-sleeved shirts and shoes, which corresponds to the insulation of Iclo clothes at 0.7 [clo] (calculated by the authors) and performed a physical activity at the level of 1.1 [met] (semi-active sitting/working in a sitting position; typing, reading, task solving (cooperation), conversation). The menstrual cycle (as this is a question not recommended ethically for technical assessment studies) was not taken into account in the studies. Currently, it is assumed in the known studies of thermal comfort that the influence of menstruation is statistically insignificant.
The group didn’t consume meals up to two hours before the study or during the study. During the test, students were allowed to drink water to supplement the possible needs related to the secretion of sweat.
Physiological circadian rhythm was not included in the research. Research was carried out during the daytime around the time between breakfast and lunch. In our opinion, this factor did not affect the results by disturbing the general results and conclusions.
During the test, there were no effects of sudden change in temperature and other parameters. Both groups remained air-conditioned for 30 minutes in neutral conditions before the tests (at PMV = −0,2; ta = 23.5 °C, RH = 35%).

2.5. Thermal Sensory Tests—Votes

The respondents evaluated their sensory thermal comfort in writing (three types of questions). The students taking part in the survey answered questionnaire questions at intervals of 5 or 10 minutes when new thermal conditions were established (17 °C –25 °C). The temperature increased on average by 0.3 degrees in the interval of 5 minutes. Experiment schedule was two hours of testing with change of temperature and summary 3 hours considering the neutral thermal buffer before main stage of testing. In total, temperature increased by 7 degrees in about two hours.
The surveys were divided into three types of questions as presented;
  • The first of them is: Determine the feeling of thermal sensation on a 7-degree scale, where the value −3 was marked as very cold, −2 as cold., −1 as quite cold, 0—neutral (comfortable), +1 quite warm, +2 warm, +3 hot (Fanger approach-based).
  • The second of them is: Determine using a two-degree scale whether the prevailing conditions are comfortable for work (yes/no).
  • The third of them is: Determine in what percentage the conditions are suitable for work (from 0% [absolutely not suitable] to 100% [the conditions are comfortable/neutral]).

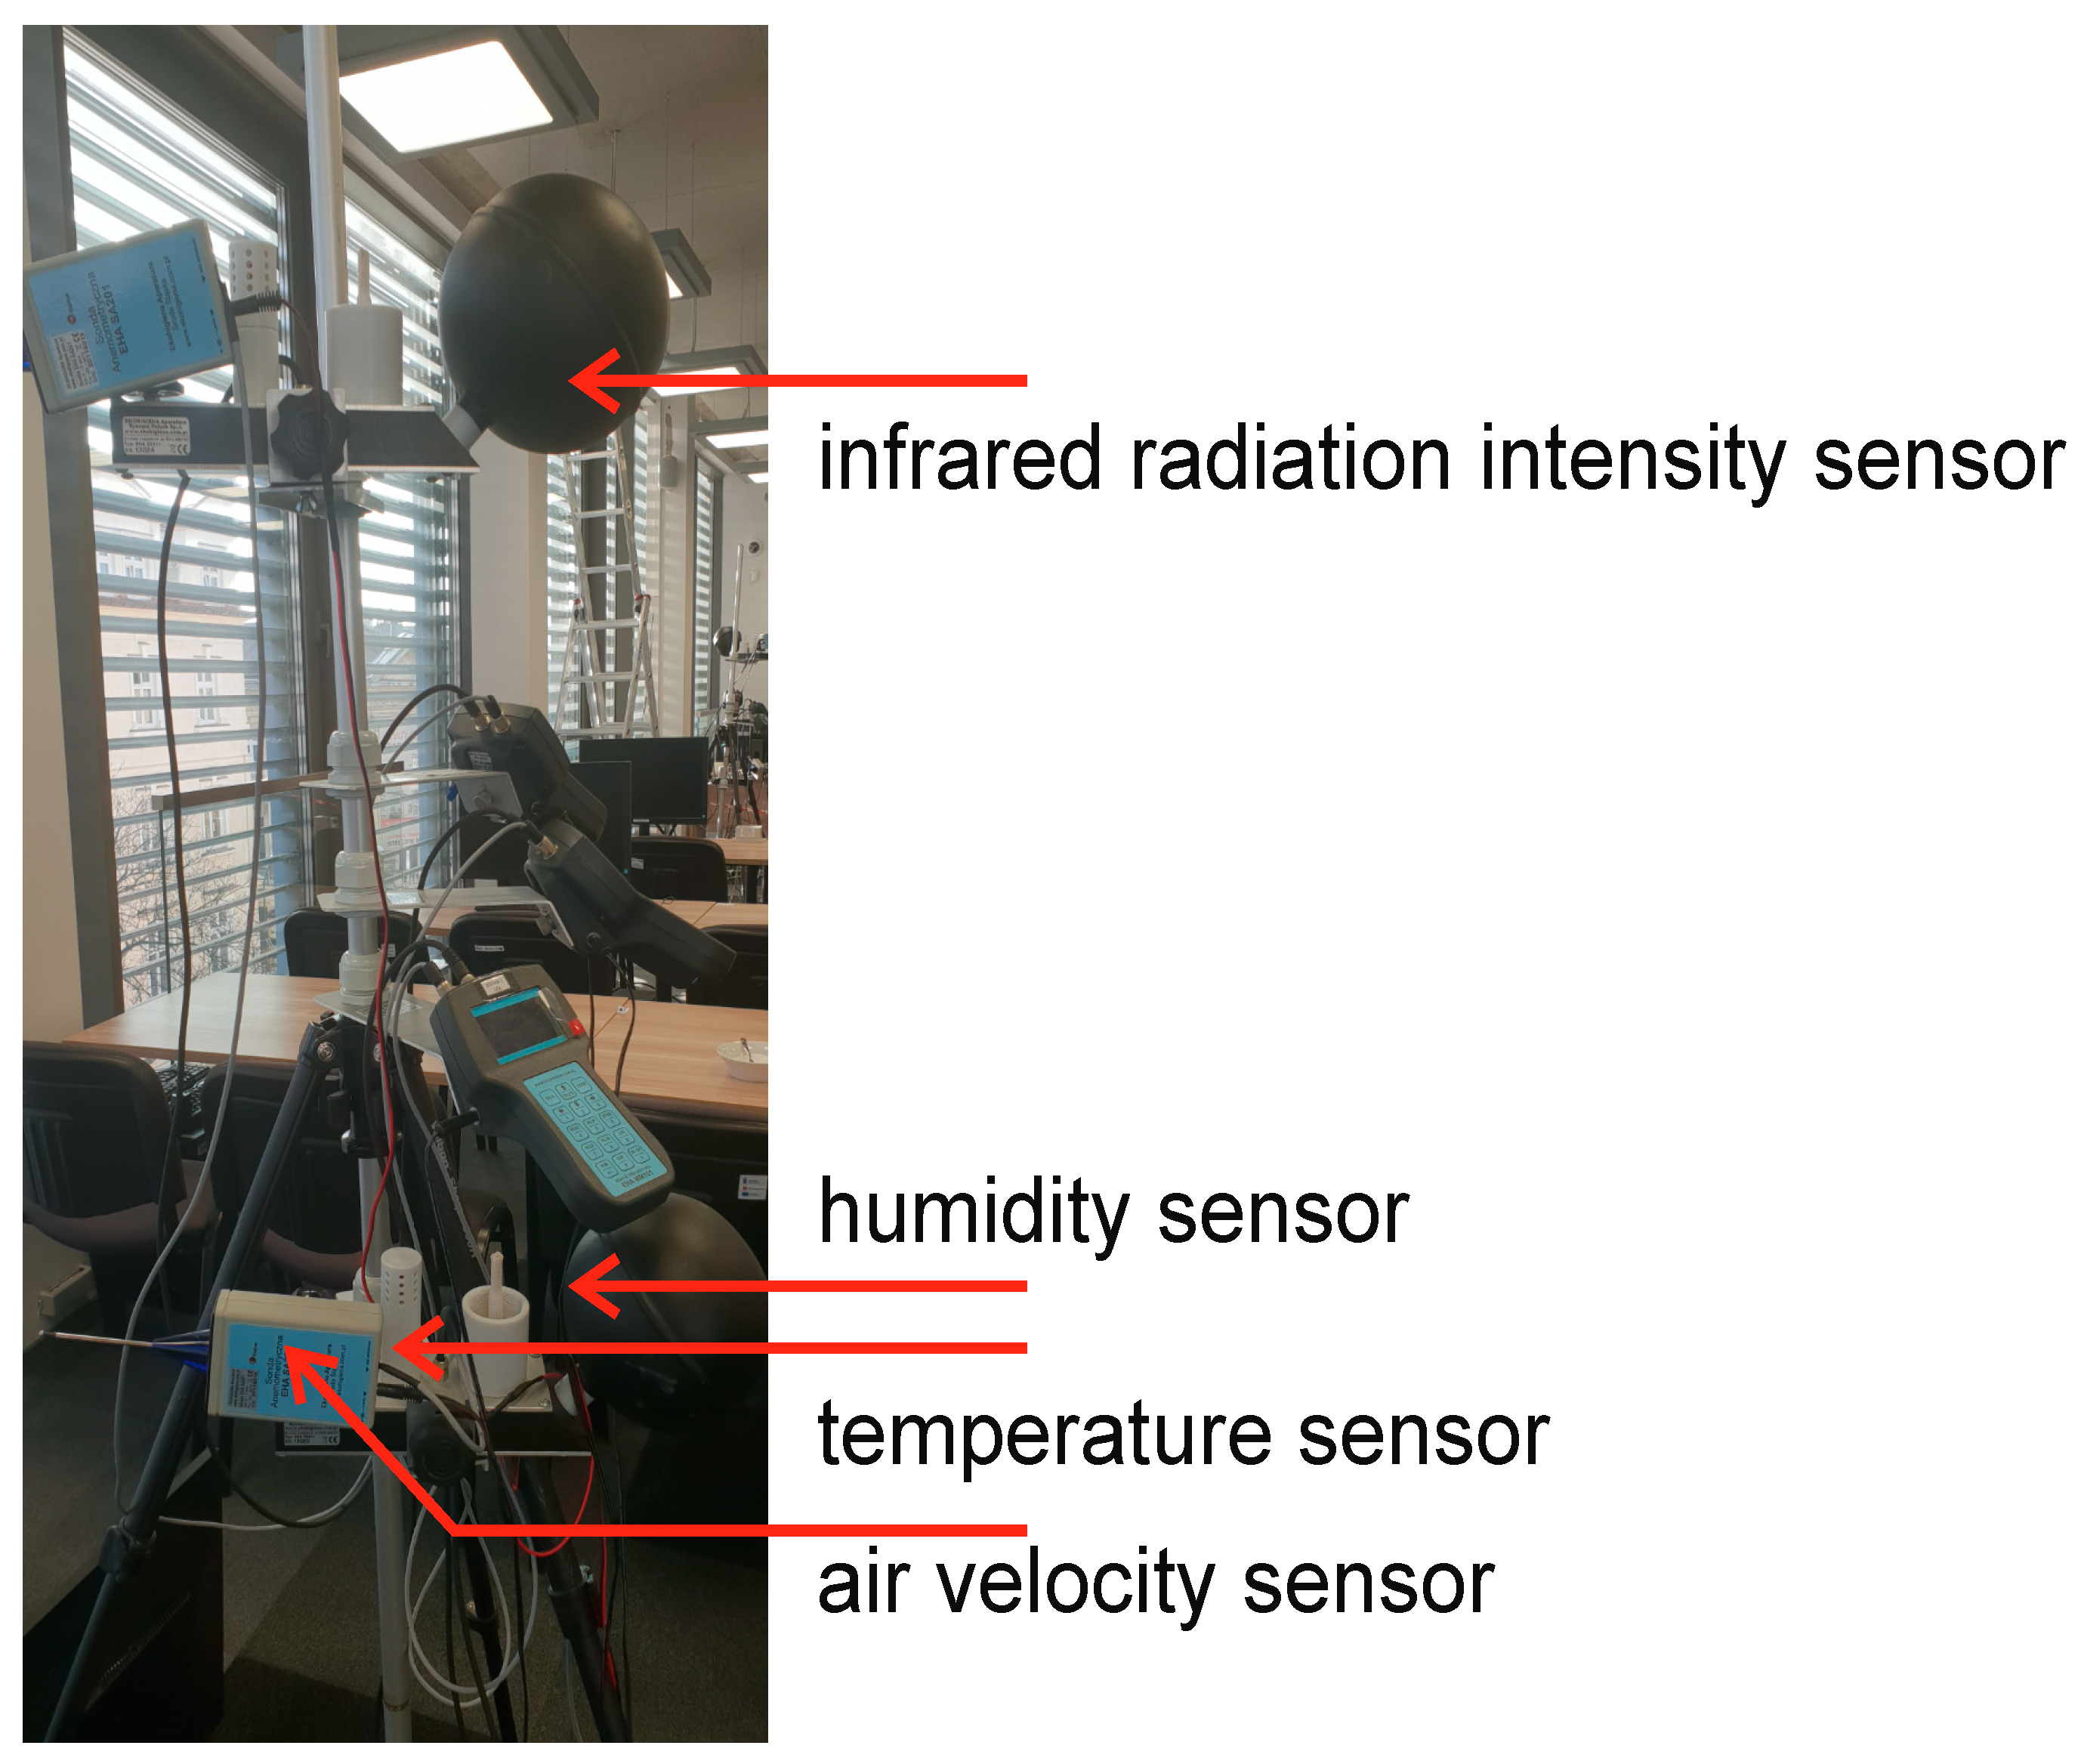
2.6. The Measuring Equipment

Non-dependent on surveys, the following equipment was used for independent testing of indoor air parameters. Thermal comfort meters, marked in Figure 2a,b as M1 and M2. The meters were located at the front and the end of the test area. Figure 5 shows the sensors in the device for measuring thermal comfort (M1, M2). The measured parameters were:
-
ta—actual air temperature measurement,
-
tg—temperature of blackened sphere (heat radiation meter), 15 cm in diameter,
-
tnw—natural wet-bulb temperature measurement,
-
RH—measurement of relative air humidity,
-
va—measurement of air flow speed.
Measurements of the physical parameters necessary to determine PMV and PPD were carried out at three heights: 5 cm, 100 cm and 160 cm above floor level in parallel, but only measurements at the panellists’ chest level (100 cm) of sitting participants were taken for further analysis. Measurement at three heights allows a possible negative gradient of vertical temperature to be determined, which would disturb the sensory responses of the panellists. The frequency of data collection was every 10 min. The technical data and sensor resolution are presented in Table 2.
In addition (for additional verification purposes), temperature and humidity sensors were also placed on each panellist’s measurement table (6 places) in order to verify if the temperatures are within the standard deviation (uncertainty) of the basic/main devices (M1 and M2) used for the tests. An example of this device is shown in Figure 6. and the location of Po2–Po7 devices is presented in Figure 3a,b. The accuracy of these measurements was:
-
CO2 measurement range 0–5000 ppm CO2 accuracy 50 ppm +3% of the measured value
-
Measurement RH [%] range 0–100 %RH accuracy 3% (30–70%RH) /5%(70–90%RH)
-
Measurement t [°C] range −5–55 °C accuracy 0.3 °C (−5–20 °C)/0.4 oC (20–55 °C)
The other assumptions for assessment methodology for determining thermal comfort were based on EN ISO 7730 [2].
On the basis of the measurements obtained, thermal comfort parameters were calculated in accordance with ISO 7730 and Fanger’s thermal model. The designated parameters were: PMV—average thermal comfort rating [-] and PPD—percentage of dissatisfied people [%].
On the basis of the thermal sensation answers (vote), the thermal comfort parameters were calculated. The designated parameters were: PMV—average thermal comfort rating [-] and PPD—percentage of dissatisfied people [%].

2.7. Measurement Uncertainty

The “overall systematic uncertainty” (or combined) is calculated by adding (in quadrature) all the calculated measurement uncertainties (A-class) and other like panel test uncertainty (B-class). The uncertainty approach is based on the international reference document JCGM 100:2008 Evaluation of measurement data—Guide to the expression of uncertainty in measurement published by BIPM, Sevres 2010. The overall uncertainty is the experimenter’s best estimate of how far an experimental thermal result might be from the “true value”. The realistic uncertainty were calculated according to EN-ISO 7730 with the PMV measurement uncertainty taking into account the uncertainty designated by Alfano A, Palella BI., Riccio in a paper titled The role of measurement accuracy on the thermal environment assessment by means of PMV index presented in Building and Environment no46:1361-1369., providing the measurement uncertainty of the parameters: ta, tmr and va, pa. The estimate does not include the effect of two hard-to-measure PMV parameters known as the thermal resistance of clothing Icl in units clo, and the level of metabolic activity of humans Met. The combined standard uncertainty is taking into account the readings from PMV tables compiled according to ISO 7730, with readability U = 0.1 PMV and the standard deviation of the PPD(PMV) model. Author’s estimation was confirmed using the uncertainty budget of PMV calculated for a similar example by Ekici Can in Measurement Uncertainty Budget of the PMV Thermal Comfort Equation. As a part of the test, the uncertainty of measurement for all measuring elements was determined. On this basis, the uncertainty of the determination of the measured PMV coefficient was determined and then the PPD coefficient was adjusted as presented in Table 3. PPD_POM is the dissatisfaction percentage resulting from the measurement of physical values based on the Fanger model and the ISO 7730 standard. The uncertainty of measuring the temperature in the indoor environments is recommended by a measurement producer as 0.5 °C and is consistent with the literature.
The realistic measurement uncertainty of PPD determination using the measurement method was assessed as SDreal(PPD) = 3.2% (Table 3).
The uncertainty of thermal sensory vote was determined for each PMV calculated for each of the temperature conditions, i.e., measurements. Thermal Sensation Index calculated as a weighted average response of sensory results from a seven-point scale is PMV_ANK. Standard deviations for PMV_ANK ranged from 0.5 to 0.8 PMV. The calculated standard deviation of panel ‘votes’ was calculated as 11.9%. In comparison, ‘vote’ standard deviation SDvotePPD values for corresponding tests known from the literature [32,50,51] are 4–20%. The specified extended uncertainty of PPD assessment for the provided survey is 24.6%. Table 4 schows overall uncertainty Uoverall of PPD based on realistic measurement uncertainties SDrealPPD and vote standard deviation (k = 2, a level of confidence 95 %).

2.8. Other Assumptions and Boundary Conditions

Special boundary conditions regarding temperature measurements are required to test the field of temperature in a case study room. The purpose of using several temperature sensors was to check what the temperature distribution was in the room heated by floor and Split AC unit in heating mode. Measurements of temperature at points M1 (front of panellists) and M2 (rear of panellists) at a height of 1 metre showed similar values within the range of standard deviation, i.e., not more than 0.5 °C for the entire measurement series. Therefore, it was assumed that the analysis will take readings from the meters located to the front of the panellists, i.e., M1. Additional measurements on stations at a height of 1 metre also did not show significant anomalies in the horizontal temperature distribution at 1 m height. Simultaneously, the authors assume the existence of homogeneous thermal conditions at a height of 1 m in the area occupied by the panellists.
While conducting the experiment, the authors kept in mind the level of energy of users related to metabolism, i.e., the demand for food (so authors decided on 2 hours). A longer experiment could cause disturbances in the concentration of young people, and they were supposed to maintain activity at the same level for 2 hours (office work at sitting position).
The authors are aware that an additional factor of uncertainty which may affect the results of the users’ thermal comfort is the use of an upper (just below the ceiling) fan-coil heating system, as this causes additional air recirculation. Some authors claim that the mere fact of using such a means of heat distribution may disrupt climate comfort. The authors did not consider this fact as an additional factor in the boundary conditions for the experiment.
The reason we tested from cold to neutral was our focus on looking for the lowest operative temperature at which neutral comfort (PMV = 0) will appear (not the lowest one from the warm side at which comfort will disappear). This approach was in our understanding natural for our climatic zone. In most cases when people enter the office, the room warms up to the reference temperature and does not cool down from being too warm.

3. Results

As part of the experiment, the thermal physical parameters of the laboratory office room were measured to determine PMV (later measured PMV is named PMV_POM). For each measurement of PMV_POM, the thermal satisfaction/dissatisfaction of the panellists (PPD) was determined simultaneously by means of three surveys;
-
PPD_ANK, a seven-point thermal sensation scale (−3 to 3),
-
PPD_WAR, a two-point thermal sensation scale (yes/no), a conditional question on whether you are satisfied with the thermal conditions,
-
PPD_ZAD_ANK, percentage scale (0–100%), a conditional question on what is the percentage of your satisfaction with the thermal conditions.
The results of key measured parameters and the results of surveys are presented in Table 5.
The percentage distribution of thermal sensation answers for each thermal condition is presented in Table 6. The obtained results were used for further analysis of thermal comfort (Figure 1, Figure 2, Figure 3, Figure 4 and Figure 5).
Figure 7 shows the distribution of dissatisfaction (PPD) resulting from the measurement of physical air parameters based on the Fanger model and the ISO 7730 standard (PPD_POM) as well as dissatisfaction resulting from the surveys (PPD_ANK) for PMV_POM. Similar to Fanger’s study, the number of dissatisfied was counted, including those who answered −3 or −2 as unsatisfied in the survey. This condition was also used by Fanger in 1973 [1].
Figure 8 shows the distribution of dissatisfaction (PPD) resulting from the measurement of physical values based on the Fanger model and the ISO 7730 standard (PPD_POM) as well as dissatisfaction based on “yes/no” surveys.
Figure 9 shows the distribution of dissatisfaction resulting from the measurement of thermal physical values as well as dissatisfaction resulting from the surveys carried out—“what is the percentage of your satisfaction with the thermal conditions, scale 0−100%”, (PPD_ZAD_ANK).
The PMV was also calculated (additionally to measured PMV) from the survey results as the weighted average response of panellists on a seven-degree scale (later as PMV_ANK). Figure 10 presents the distribution of dissatisfied measurements and questionnaires for the PMV_ANK based on the questionnaires, similar to the calculation PMV in the previous figures. Thermal comfort is achieved slightly earlier than in the result of the theoretical Fanger model.

4. Discussion

4.1. Comparison of Results with the Fanger Model

A comparison of the thermal comfort measurement results based on physical parameters in accordance with ISO 7730 [2] to the results obtained by the survey method using a seven-degree comfort scale indicates that: thermal comfort for our respondents has been achieved slightly better (on the colder side) than as presented by the ISO 7730 model. This is an important observation due to the potential space needed to reduce the energy demand for the comfort of the office rooms. For PMV = −0.5 to 0, i.e., in the area of thermal comfort, satisfaction results ranged from 0% to 20% satisfied. The indication of “slightly better adaptation” of the surveyed panellists to the measurement conditions of PMV may be due to their natural adaptive ability resulting from living in a “cooler climate” or actual winter time. The authors of the publication noted [52] a similar phenomenon, but in relation to secondary school students in a warm and tropical climate, observing that they were “better than would result from calculations”.
As part of the PMV experiment, a seven-level questionnaire was also calculated as the mean of the number of satisfied for a given scale response. This is PMV_POM, which was taken from measurements and also PMV_ANK from questionnaires. It was shown that these results are similar and the trend line of the comfort model is preserved.
Bearing in mind the wide acceptability of the Fanger model, the results obtained from the conducted surveys were compared with the results of the Fanger and Nevins questionnaires [1,44]. Fanger’s theoretical model was created over 50 years ago in a study of 64 students for 13 temperatures (18.9–32.2) and 50% humidity, assuming clo = 0.6, met = 1 and ta = tmr). The results of the comparison of our raw results with the Fanger results are presented in Figure 11. Where F_PPD_ANK is the predicted percentage of dissatisfied – raw results taken from Fanger experiment and PPD_ANK_EXP is the predicted percentage of dissatisfied as a new model based on experimental results.
After analysing the distribution of thermal sensation results obtained from the surveys, Fanger proposed his famous curve presented in Figure 11 (F_PPD_ANK&PPD_ISO). The results presented in our paper obtained from this study’s questionnaires are correlated with the Fanger comfort curve with one difference. In the vicinity of thermal comfort, i.e., PMV = 0, as a part of the experiment, there were a larger number of satisfied panellists, i.e., people filling the seven-level questionnaire as −1, 0 or 1. In the context of the obtained results, an experimental curve is proposed. Curve weights were also slightly corrected by the least-squares method and regression gave the experimental dependence expressed by the formula (PPD_ANK_EXP in Figure 11):
PPD = 100 − 99.9·exp (−0.0355·PMV4 − 0.242·PMV2) [%]
As provided, the obtained function does not deviate from Fanger’s chart by more than 5% for −1< PMV < 0. Differences that appear in relation to the Fanger model appear for the results of surveys and sensory tests. In our opinion, the differences (though insignificant) result from a few reasons. The first one is that the Fanger curve is the result of statistical processing and simplification. The significant weakness was the counting of sensory results “−1 PMV to 1” as satisfied. Fanger in the vicinity of PMV = zero due to the research of single panellists had a larger spread of results (this was roughly 2.5 PMV, the width of the entire distribution of results). In our case, due to the compact group, this dispersion was less than 2 PMV. This means that using Fanger’s counting method for PMV = −1 to 0 authors got 100% result counted as satisfied. One would have to admit that the whole group was satisfied; with Fanger, several people fell out, which gave him 95% satisfied for PMV = 0. Another issue is that Fanger did not attempt to show a statistical analysis of his results, but this is partly understandable because the test group was relatively small. Fanger also did not specify the uncertainty of his results, which was probably at a level comparable to ours, i.e., 15–25%. Research proves that “the truth” is somewhere near the Fanger equation—with some probability (uncertainty).
If, for the assumed boundary conditions and the parameters tested, significant compliance with the universal Fanger equation was proven, then this should not be automatically expected for other parameters; with another population or other gender distribution or other mass/BMI of panellists, this compliance will not be observed. This requires additional research.

4.2. Obtained Results in the Context of NZEB Buildings

In the context of seeking an optimal and cost-justified operating temperature ensuring thermal comfort in the office area, the measurement results indicate that at 30% RH humidity, PMV = −0.5 and PPD = 10% thermal comfort was obtained for approx. 22.8 °C and full comfort PMV = 0 at 24.7 °C. In accordance with the thermal standard of ASHRAE 55-2017 [3], this is the minimal operative temperature allowing for users’ comfort (red dot in Figure 12). These temperatures are rather economically unjustified for any nearly zero-energy buildings and in almost every known case study the BMS system works on lower temperatures.
It is promising, therefore, that actual thermal comfort as proven on sensory tests can be satisfied by users at slightly lower temperatures, i.e., only 10% dissatisfied at 20.5 °C degrees and, for example, 5% at 21.3 °C degrees (blue dot in the Figure 12). These temperatures don’t comply with ASHRAE 55 and EN 15251. In this context, one would consider whether it wouldn’t be justified to carry out similar verifications to the office facilities in the context of building energy saving management plan development. Perhaps higher operative temperatures should be used for design purposes in accordance with the standards and then verified for the actual thermal comfort of users in order to obtain maximum energy savings. Table 7 shows the thermal comfort classes for offices based on the recommended ISO 7730 values and shows the operative temperatures at which this class was achieved in the MLBE case-study case for the ISO 7730 measurements (ta_pom) and resulting from the seven-level questionnaire (ta_ank). ta_ANK is taken from the real measured air temperature (°C) and it relates to the thermal comfort class. Index ANK relates to the temperature at which thermal comfort is achieved by panel group based on the results of votes on a 7-point scale. From the table of test panel results, authors read the first measurement temperature ta for which PPD is at minimum 6% (A class) or minimum 15% (C class building).
In MLBE building there are large possibilities to control environmental conditions. The experiment showed that the building is able to bring the building to a state of comfort felt by people in a short time without disturbing the temperature gradients (air+floor heating). It seems that rooms with wider environmental condition control, such as our laboratory office (NZEB), may be more comfortable then offices with lower controllability. Our results showed a higher level of satisfaction in cooler PMV levels. There are a few other studies on students showing that students in rooms with full air conditioning (HVAC) showed a faster feeling of climate comfort than in the case of gravity ventilation (NV). This may also lead to the conclusion that the BMS system is not so much a desirable as it is a necessary requirement of low energy lecture halls/offices.

4.3. Results in the Context of the Impact of the Question Type on PMV

An interesting result of the conducted experiment is the clear influence of the type of questionnaire question about thermal comfort on the results. As part of the experiment, three questions were asked by the interviewers. One of them concerned the determination of thermal comfort on a seven-degree scale; the second was a two-degree one using a yes/no answer as to whether there was thermal comfort; while the third was an assessment using the question of whether these conditions are good enough (thermal comfort wise) to perform office work (on a scale of 0–100%). The most similar results to those obtained by other researchers, [53], of course, came from the seven-degree scale (PPD_ANK). The “yes/no survey” gave the shape of a somewhat mangled comfort curve. In our opinion, this is due to the fact that the panellists were better able (quicker) to say that it was already warm enough as such. Both surveys, however, gave shapes similar to the PPD_ISO / PPD_POM model curve slightly shifted to the left (lower temperatures). The survey on thermal comfort using a scale of user satisfaction from 1 to 100%, gave different results from the previous two. A higher number of dissatisfied users was found in the area of thermal comfort as were in Fanger’s [1]. There are even 20–25% dissatisfied around PMV = 0. In our opinion this should be explained by the fact that the respondents had the chance to claim that they were satisfied in only 80% or 90% of the comfort conditions, leaving a psychological buffer for the expected “better” conditions with the next experiment temperature set, which usually doesn’t give 100%. The influence of the scale affects the quantification of results. For example, in the case of the measured PMV = −1.25 we can obtained the following survey/panel test results: on a “2-point scale yes/no” (YES, i.e., PMV from −1 to 1), on a scale of 100% (50%, i.e., so PMV = −1.5), on a 7-degree scale (PMV = −2, or −1). The problem concerns a subjective capture to a certain scale of thermal sensation. Another example is the area of the measured PMV = 0: on the scale yes/no (NO, so PMV from −2 to −3), on a scale of 100% (80%, i.e., so PMV = −1), on a 7-degree scale (PMV = 0). Authors take the position that it is best to use a 7-point scale (in practice it is a 5-point scale) partly just because other researchers follow the same way (so all can compare each other). We do not recommend using a two-step scale or, in particular, a 100% scale.

4.4. Other

The authors believe that the influence of panellist age on the results requires comment. This question was also raised in other scientists’ research [47,54]: whether Fanger’s model is an equally suitable model for adults as regards adolescents or youngsters. Current comfort standards, such as ISO 7730, and ASHRAE’s Standard 55 determine indoor design values for operative temperatures indoors based on the heat-balance and adaptive thermal comfort models. There is no assurance that results obtained from field studies in offices or universities, or experiments conducted in climate chambers, will accurately reflect the thermal sensations and preferences of office users (in our case students). Furthermore, researchers [55] revealed that young people’s thermal preferences were cooler than those predicted by the adaptive standard in EN 15251 [14,56,57]. However, this indicates a certain need to take age into account in the evaluation of room comfort keeping in mind the intended use of the rooms (further research).
All results of thermal comfort tests on test panels enrich our basic knowledge but still, there are open more detailed questions. The next research focus authors consider as necessary is the impact of the combination of existing installations and smart BMS actions on the thermal comfort of users including in details: location of the exhaust mechanical ventilation system (gradients), ventilation operating connected with automatically tilting windows that allows using the building’s accumulation capacity for cooling (“night storage cooling” combined with building materials containing phase-changing components), variables of sets of underfloor heating and air heating system modes (time reactions).
Validating the model on the warm side is also interesting. There are voices that the model is not symmetrical on the warm side. For example [57] noted that the thermal comfort of healthcare occupants in a tropical region is slightly warmer than the neutral temperature.

5. Conclusions

The authors believe, as was shown in the article, that comfort measurement/assessment in new NEZB buildings should also be supported by a survey of users and employees. The actual thermal sensory test is much more reliable because the real function of the building is to achieve the users’ thermal comfort, not the set of parameters theoretically related to comfort. In cold climatic conditions, effective heating of NZEBs, especially lecture halls in winter, is a great challenge. Therefore, the rooms are often heated periodically, for example, by means of heat pumps operating by a warm air supply—exactly as in the experiment. In our experiments, from the energy side, the authors found that this kind of heating may not affect the perceived thermal comfort. Thermal comfort tests carried out in an experimental office area of a low-energy building MLBE on a sample of 50 students gave some interesting results that offer some new views on the subjective preferences of the thermal comfort of office users. The results presented based on sensory assessment positively validate the existing Fanger model and ISO 7730 approach for NZEB building. In our case, the overall results’ deviation from the Fanger function was no significant. A comparison of the thermal comfort measurement results based on physical parameters in accordance with ISO 7730 to the results obtained by the survey method using a seven-degree comfort scale indicates that: thermal comfort was obtained slightly faster (on the cold side) than appears from the ISO model. This is important information due to the worldwide trend to reduce building energy demand. The experimental dependence expression of PPD = f(PMV) for a presented case study was proposed and it can be a good reference for future studies. The test results create the basis for further analyses concerning determination of optimal overall comfort IEQ of low-energy buildings where thermal comfort satisfaction TCindex is one of the main sub-components.

Author Contributions

The conceptualization. M.P., methodology M.P., J.B., M.F.-C.; formal analysis. M.P.; investigation. J.B., M.F.-C.; resources. M.P., M.F.-C.; data curation. M.F.-C., M.P.; writing—original draft preparation. M.P.; writing—review and editing. J.B., M.F.-C., M.F.; visualization. M.F.-C., M.P.; project administration. M.F.; funding acquisition. M.P., M.F.

Funding

No external funding for this research.

Acknowledgments

We would like to thank Krystyna Kostyrko for an inspiration and consultancy.

Conflicts of Interest

The authors declare no conflict of interest.

References

  1. Fanger, P.O. Assessment of man’s thermal comfort in practice. Occup. Environ. Med. 1973, 30, 313–324. [Google Scholar] [CrossRef]
  2. BSI. ISO 7730: Ergonomics of the Thermal Environment Analytical Determination and Interpretation of Thermal Comfort Using Calculation of the PMV and PPD Indices and Local Thermal Comfort Criteria; ISO: Geneva, Switzerland, 2005. [Google Scholar]
  3. ANSI/ASHRAE Standard 55-2017, Thermal Environmental Conditions for Human Occupancy; ANSI: Piscataway, NJ, USA, 2017.
  4. Nagashima, K.; Tokizawa, K.; Marui, S. Thermal comfort. In Handbook of Clinical Neurology; Elsevier: Amsterdam, The Netherlands, 2018. [Google Scholar]
  5. Djongyang, N.; Tchinda, R.; Njomo, D. Thermal comfort: A review paper. Renew. Sustain. Energy Rev. 2010, 14, 2626–2640. [Google Scholar] [CrossRef]
  6. Taleghani, M.; Tenpierik, M.; Kurvers, S.; van den Dobbelsteen, A. A review into thermal comfort in buildings. Renew. Sustain. Energy Rev. 2013, 26, 201–215. [Google Scholar] [CrossRef]
  7. van Hoof, J. Forty years of Fanger’s model of thermal comfort: Comfort for all? Indoor Air 2008, 18, 182–201. [Google Scholar] [CrossRef] [PubMed]
  8. Rupp, R.F.; Vásquez, N.G.; Lamberts, R. A review of human thermal comfort in the built environment. Energy Build. 2015, 105, 178–205. [Google Scholar] [CrossRef]
  9. Peeters, L.; de Dear, R.; Hensen, J.; D’haeseleer, W. Thermal comfort in residential buildings: Comfort values and scales for building energy simulation. Appl. Energy 2009, 86, 772–780. [Google Scholar] [CrossRef] [Green Version]
  10. Frontczak, M.; Wargocki, P. Literature survey on how different factors influence human comfort in indoor environments. Build. Environ. 2011, 46, 922–937. [Google Scholar] [CrossRef]
  11. van Hoof, J. Thermal comfort: Research and practice. Front. Biosci. 2010, 15, 765–788. [Google Scholar] [CrossRef]
  12. Cheng, Y.; Niu, J.; Gao, N. Thermal comfort models: A review and numerical investigation. Build. Environ. 2012, 47, 13–22. [Google Scholar] [CrossRef]
  13. de Dear, R.J.; Akimoto, T.; Arens, E.A.; Brager, G.; Candido, C.; Cheong, K.W.D.; Li, B.; Nishihara, N.; Sekhar, S.C.; Tanabe, S.; et al. Progress in thermal comfort research over the last twenty years. Indoor Air 2013, 23, 442–461. [Google Scholar] [CrossRef]
  14. Mors, S.T.; Hensen, J.L.M.; Loomans, M.G.L.C.; Boerstra, A.C. Adaptive thermal comfort in primary school classrooms: Creating and validating PMV-based comfort charts. Build. Environ. 2011, 46, 2454–2461. [Google Scholar] [CrossRef] [Green Version]
  15. Halawa, E.; van Hoof, J. The adaptive approach to thermal comfort: A critical overview. Energy Build. 2012, 51, 101–110. [Google Scholar] [CrossRef]
  16. Enescu, D. A review of thermal comfort models and indicators for indoor environments. Renew. Sustain. Energy Rev. 2017, 79, 1353–1379. [Google Scholar] [CrossRef]
  17. Nicol, J.F.; Roaf, S. Rethinking thermal comfort. Build. Res. Inf. 2017, 45, 711–716. [Google Scholar] [CrossRef] [Green Version]
  18. Yao, R.; Li, B.; Liu, J. A theoretical adaptive model of thermal comfort—Adaptive Predicted Mean Vote (aPMV). Build. Environ. 2009, 44, 2089–2096. [Google Scholar] [CrossRef]
  19. Mora, R.; Bean, R. Thermal comfort: Designing for people. Ashrae J. 2018, 60, 2. [Google Scholar]
  20. Final draft EN 16798-1, Energy performance of buildings—Ventilation of buildings—Part 1: Indoor environmental input parameters for design and assessment of energy performance of buildings addressing indoor air quality, thermal environment, lighting and acoustics (Module M1–6). 2018. Available online: https://www.cibse.org/getmedia/bb1c34b1-19fe-4199-a44f-acb981077ab0/Draft-BS-EN-16798-1-Energy-performance-of-buildings.pdf.aspx (accessed on 24 April 2019).
  21. ISO 15251, Indoor Environmental Input Parameters for Design and Assessment of Energy Performance of Buildings Addressing Indoor Air Quality, Thermal Environment, Lighting and Acoustics; ISO: Geneva, Switzerland, 2007.
  22. de Dear, R. Thermal comfort in practice. Indoor Air. 2004, (Suppl. 7), 32–39. [Google Scholar] [CrossRef]
  23. Charles, K.E. Fanger’s Thermal Comfort and Draught Models; National Research Council Canada: Halifax, NS, Canada, 2003.
  24. Ormandy, D.; Ezratty, V. Health and thermal comfort: From WHO guidance to housing strategies. Energy Policy 2012, 49, 116–121. [Google Scholar] [CrossRef] [Green Version]
  25. Directive 2010/31/EU of the European Parliament and of the Council of 19 May 2010 on the energy performance of buildings; Official Journal of the European Union: Brussels, Belgum, 2010.
  26. Fedorczak-Cisak, M.; Furtak, M.; Gintowt, J.; Kowalska-Koczwara, A.; Pachla, F.; Stypuła, K.; Tatara, T. Thermal and vibration comfort analysis of a nearly zero-energy building in Poland. Sustainability 2018, 10, 3774. [Google Scholar] [CrossRef]
  27. Fassio, F.; Fanchiotti, A.; Vollaro, R.D. Linear, non-linear and alternative algorithms in the correlation of IEQ factors with global comfort: A case study. Sustainability 2014, 6, 8113–8127. [Google Scholar] [CrossRef]
  28. Ncube, M. The Development of a Methodology for a Tool for Rapid Assessment of Indoor Environment Quality in Office Buildings in the UK; University of Nottingham: Nottingham, UK, 2012. [Google Scholar]
  29. Heinzerling, D. Commercial Building Indoor Environmental Quality Evaluation: Methods and Tools; UC Berkeley: Berkeley, CA, USA, 2012. [Google Scholar]
  30. Piasecki, M.; Kozicki, M. The Approach of Including TVOCs Concentration in the Indoor Environmental Quality Model (IEQ)—Case Studies of BREEAM Certified Office Buildings. Sustainability 2018, 10, 3902. [Google Scholar] [CrossRef]
  31. Interactions Affecting the Achievement of Acceptable Indoor Environments; ASHRAE Standard: Atlanta, GA, USA, 2011.
  32. Piasecki, M.; Kostyrko, K.B. Indoor environmental quality assessment, part 2: Model reliability analysis. J. Build. Phys. 2018, 5, 288–315. [Google Scholar] [CrossRef]
  33. Liang, H.H.; Chen, C.P.; Hwang, R.L.; Shih, W.M.; Lo, S.C.; Liao, H.Y. Satisfaction of occupants toward indoor environment quality of certified green office buildings in Taiwan. Build. Environ. 2014, 72, 232–242. [Google Scholar] [CrossRef]
  34. Mihai, T.; Iordache, V. Determining the Indoor Environment Quality for an Educational Building. Energy Procedia 2016, 85, 566–574. [Google Scholar] [CrossRef] [Green Version]
  35. Pei, Z.; Lin, B.; Liu, Y.; Zhu, Y. Comparative study on the indoor environment quality of green office buildings in China with a long-term field measurement and investigation. Build. Environ. 2015, 84, 80–88. [Google Scholar] [CrossRef]
  36. Piasecki, M.; Kostyrko, K.; Pykacz, S. Indoor environmental quality assessment: Part 1: Choice of the indoor environmental quality sub-component models. J. Build. Phys. 2017, 41, 264–289. [Google Scholar] [CrossRef]
  37. Freire, R.Z.; Oliveira, G.H.C.; Mendes, N. Predictive controllers for thermal comfort optimization and energy savings. Energy Build. 2008, 40, 1353–1365. [Google Scholar] [CrossRef]
  38. Spagnolo, J.; de Dear, R. A field study of thermal comfort in outdoor and semi-outdoor environments in subtropical Sydney Australia. Build. Environ. 2003, 38, 721–738. [Google Scholar] [CrossRef] [Green Version]
  39. Zomorodian, Z.S.; Tahsildoost, M.; Hafezi, M. Thermal comfort in educational buildings: A review article. Renew. Sustain. Energy Rev. 2016, 59, 895–906. [Google Scholar] [CrossRef]
  40. Trebilcock, M.; Soto-Muñoz, J.; Yañez, M.; Martin, R.F. The right to comfort: A field study on adaptive thermal comfort in free-running primary schools in Chile. Build. Environ. 2017, 114, 455–469. [Google Scholar] [CrossRef]
  41. Zeiler, W.; Boxem, G. Effects of thermal activated building systems in schools on thermal comfort in winter. Build. Environ. 2009, 44, 2308–2317. [Google Scholar] [CrossRef]
  42. Khodakarami, J.; Nasrollahi, N. Thermal comfort in hospitals—A literature review. Renew. Sustain. Energy Rev. 2012, 16, 4071–4077. [Google Scholar] [CrossRef]
  43. Fanger, P.O. Assessment of thermal comfort practice. Br. J. Ind. Med. 1973, 30, 313–324. [Google Scholar]
  44. Rohles, F.; Nevins, G.R. Nature of thermal comfort for sedentary man. ASHRAE Trans. 1971, 77, 239–246. [Google Scholar]
  45. Alfano, F.R.D.; Ianniello, E.; Palella, B.I.; Riccio, G. Thermal comfort design in indoor environments: A comparison between EU and USA approaches. In Proceedings of the HB 2006—Healthy Buildings: Creating a Healthy Indoor Environment for People, Lisboa, Portugal, 4–8 June 2006. [Google Scholar]
  46. de Dear, R.J.; Brager, G.S. Thermal comfort in naturally ventilated buildings: Revisions to ASHRAE Standard 55. Energy Build. 2002, 34, 549–561. [Google Scholar] [CrossRef]
  47. de Dear, R.; Kim, J.; Candido, C.; Deuble, M. Adaptive thermal comfort in australian school classrooms. Build. Res. Inf. 2015, 43, 383–398. [Google Scholar] [CrossRef]
  48. Olesen, B.W. Revision of EN 15251: Indoor Environmental Criteria. Rehva J. 2012, 49, 6–12. [Google Scholar]
  49. BSI. Ergonomics of the Thermal Environment—Instruments for Measuring Physical Quantities; Bs En Iso 77262001; ISO: Geneva, Switzerland, 2002. [Google Scholar]
  50. Alfano, F.R.D.A.; Palella, B.I.; Riccio, G. Notes on the Calculation of the PMV Index by Means of Apps. Energy Procedia 2016, 101, 249–256. [Google Scholar] [CrossRef]
  51. Wang, J.; Wang, Z.; de Dear, R.; Luo, M.; Ghahramani, A.; Lin, B. The uncertainty of subjective thermal comfort measurement. Energy Build. 2018, 181, 38–49. [Google Scholar] [CrossRef]
  52. Kim, J.; de Dear, R. Thermal comfort expectations and adaptive behavioural characteristics of primary and secondary school students. Build. Environ. 2018, 127, 13–22. [Google Scholar] [CrossRef]
  53. Buratti, C.; Ricciardi, P. Adaptive analysis of thermal comfort in university classrooms: Correlation between experimental data and mathematical models. Build. Environ. 2009, 44, 674–687. [Google Scholar] [CrossRef]
  54. Carlucci, S.; Bai, L.; de Dear, R.; Yang, L. Review of adaptive thermal comfort models in built environmental regulatory documents. Build. Environ. 2018, 137, 73–89. [Google Scholar] [CrossRef]
  55. Teli, D.; Jentsch, M.F.; James, P.A.B. Naturally ventilated classrooms: An assessment of existing comfort models for predicting the thermal sensation and preference of primary school children. Energy Build. 2012, 53, 166–182. [Google Scholar] [CrossRef]
  56. Haddad, S.; King, S.; Osmond, P. Enhancing thermal comfort in school buildings. Proc. Heal. Build. 2012. Available online: https://www.isiaq.org/docs/PDF%20Docs%20for%20Proceedings/7F.2.pdf (accessed on 24 April 2019).
  57. Sattayakorn, S.; Ichinose, M.; Sasaki, R. Clarifying thermal comfort of healthcare occupants in tropical region: A case of indoor environment in Thai hospitals. Energy Build. 2017, 149, 45–57. [Google Scholar] [CrossRef]
Figure 1. Scheme of the thermal comfort assessment experiment.
Sustainability 11 02461 g001
Figure 2. Małopolska Laboratory of Energy Efficient Building—view of the building (a). The office room in which the tests were carried out (b).
Sustainability 11 02461 g002
Figure 3. Location (a) of the people participating in the research and the research equipment on 19 December 2018 (28 panellists), location (b) of the people participating in the research and the research equipment on 20 December 2018 (22 panellists).
Sustainability 11 02461 g003
Figure 4. (a) Location of vents (W1–W4) and fan coil units (FCUs) (K1–K3). Marking in (b): F2—fan coil with brushless EC (Energy Efficient Variable Speed EC Motor Fan Coil Unit Solutions) motor FCU, two-pipe.
Sustainability 11 02461 g004
Figure 5. The sensors connected to the testing device EHA-MM101 dedicated to thermal comfort measurements (M1).
Sustainability 11 02461 g005
Figure 6. Additional test equipment for t [°C], humidity level (RH) [%] and CO2 [ppm] measurements.
Sustainability 11 02461 g006
Figure 7. Distribution of dissatisfaction on the basis of measurements ISO 7730) and panellists’ responses on a seven-point scale (where PPD_POM is dissatisfaction percentage resulting from the measurement of physical values based on the Fanger model and the ISO 7730 standard and PPD_ANK is dissatisfaction percentage resulting from experimental thermal sensory surveys for a seven-point scale, the number of dissatisfied was counted, including those who answered −3 or −2 as dissatisfied in the survey).
Sustainability 11 02461 g007
Figure 8. Distribution of dissatisfaction resulting from thermal measurements and resulting from experimental surveys as a yes/no question on actual thermal comfort (where PPD_POM is dissatisfaction percentage resulting from the measurement of physical values based on the Fanger model and the ISO 7730 standard and PPD_WAR- dissatisfied percentage resulting from the surveys with a question “Are you satisfied with thermal comfort yes/no”).
Sustainability 11 02461 g008
Figure 9. Distribution of dissatisfaction resulting from thermal measurements and resulting from experimental surveys (what is the percentage of your satisfaction with the thermal conditions, scale 0–100%). (where PPD_POM is dissatisfaction percentage resulting from the measurement of physical values based on the Fanger model and the ISO 7730 standard and PPD_ZAD_ANK dissatisfaction PPD resulting from experiment surveys (How would you rate the level of your thermal comfort on a scale of 0–100%).
Sustainability 11 02461 g009
Figure 10. Distribution of dissatisfaction resulting from three experimental surveys for PMV_ANK resulting/calculated from a seven-point survey results scale. (where PMV_ANK is Thermal Sensation Index calculated as a weighted average response of sensory sensations from a seven-point scale, PPD_ANK is dissatisfaction percentage resulting from experimental thermal sensory surveys for a seven-point scale, the number of dissatisfied was counted, including those who answered −3 or −2 as dissatisfied in the survey, PPD_WAR- dissatisfied percentage resulting from the surveys with a question “Are you satisfied with thermal comfort yes/no”).
Sustainability 11 02461 g010
Figure 11. Comparison of the results of surveys reported by Fanger and the results of the surveys.
Sustainability 11 02461 g011
Figure 12. Thermal comfort chart on the function of operative temperature and humidity. Minimum operative temperature for this case-study office for thermal comfort by ASHRAE 55-2017 (PPD = 10%, red-dot) and minimum operative temperature for case-study office for thermal comfort based on sensory answers of users (blue-dot).
Sustainability 11 02461 g012
Table 1. Anthropometric data of the tested panel groups (Authors’ data and Fanger’s data) with expanded uncertainty at the confidence level of 1—α = 0.95.
GroupGenderGroup SizeAge [Years]Height [cm]Body Weight [kg]Skin Surface “DuBois” [m2]Body Mass IndexClo [m2 K/W]
Academic youth- Author’s testMan1223 ± 2.4175 ± 8.074 ± 13.01.8 ± 0.2524.2 ± 3.00.7 ± 0.05
Woman3822 ± 2.0162 ± 6.058 ± 15.01.6 ± 0.2222.1 ± 2.40.7 ± 0.05
Mean5022 ± 2.2165 ± 16.062 ± 18.41.6 ± 0.2321.2 ± 2.40.7 ± 0.05
Academic youth- Fanger’s testMan6424 ± 4.6180 ± 12.071 ± 13.01.9 ± 0.2422.2 ± 3.00.6 ± 0.05
Woman6423 ± 2.4168 ± 7.057 ± 14.81.6 ± 0.2420.2 ± 2.20.6 ± 0.05
Mean12823 ± 4.4174 ± 16.064 ± 21.01.8 ± 0.3421.2 ± 2.60.6 ± 0.05
Table 2. Sensors’ technical data.
Type of SensorMeasurement RangeScaleProducer Accuracy
Temperature sensors–20 °C –50 °C0.01 °C0.5 °C
Humidity sensors0–100%0.1% RH 1%
Air speed0.01–10 m/s0.01 m/s2%
Radiant temp. measurement 0–50 °C0.01 °C2%
Table 3. Realistic measurement uncertainty of PPD_POM assessment (±SDreal(PPD)) taking into consideration the provisions of ISO 7726.
ParameterStandard Deviation%Range
Air temperature ta °C0.5 °C ⇒ 0.08 PMV
⇒ 0.6% PPD
−20 °C–50 °C
Radiant temperature tmr °C2 °C ⇒ 0.28 PMV
⇒ 3% PPD
0–50 °C
Relative humidity RH %5% RH ⇒ 0.07 PMV
⇒ 0.5% PPD
0–90%
Relative air velocity va m/s|0.01 + 0.01va|m/s ⇒ 0.03 PMV
⇒0.2%PPD
0.01–10 m/s
PPD- table error 0.1 PMV
⇒ 0.73% PPD
SDreal(PPD) = (0.36+9+0.25+0.04+ 0.54)0.5 = 3.2%
Table 4. Overall uncertainty Uoverall of PPD based on realistic measurement uncertainties SDrealPPD and vote standard deviation (k = 2, a level of confidence 95 %).
ParametersSDrealPPD%SDvotePPD%Uoverall%
PPD(PMV)3.211.92·(10.24 + 141.6)0.5=24.6
Table 5. Thermal assessment of office space based on three questionnaires (−3 to 3 scale as PPD_ANK, yes/no scale as PPD_WAR, 0–100% scale as PPD_ZAD_ANK).
tatmrRHvametcloPMV_POMPPD_POMPPD_ZAD_ANKPPD-WARPPD_ANK
[°C][°C][%][m/s][met][clo][-][%][%][%][%]
17.216.830.80.011.20.7−1.865575555
17.416.632.10.021.20.7−1.764556455
18.017.232,30.021.20.7−1.656442743
19.517.933.70.081.20.7−1.340262318
20.419.133.70.011.20.7−1.027251814
21.419.631.20.011.20.7−0.81923145
22.220.232.10.011.20.7−0.6132195
22.720.431.60.011.20.7−0.5111950.0
23.221.131.50.011.20.7−0.481890.0
23.720.931.30.021.20.7−0.371790.0
24.121.230.90.021.20.7−0.2619130.0
24.621.731.10.011.20.7−0.1523164
Table 6. Results of the thermal sensation answers of panellists for exemplary thermal conditions.
TAPMV_POMThermal Sensation Answers-Sensory Result [%]PPD_ANK
[°C][-]−3−2−10123[%]
17.2−1.89.145.545.5000055
17.4−1.718.236.445.5000055
17.9−1.64.538.243.613.600043
19.5−1.34.513.622.759.100018
20.4−1.04.59.122.763.600014
21.4−0.804.531.863.60005
22.2−0.604.540.9504.5005
22.7−0.50031.863.64.5000
23.2−0.40031.859.19.1000
23.7−0.30031.854.513.6000
24.1−0.30031.836.431.8000
24.6−0.10022.731.840.94.505
Table 7. Room categories depending on the PMV indicator (cold side of sensation, PMV < 0).
Room CategoryCoefficients:
PMV [-]PPD [%]ta_pomta_ank
Best (A)−0.2 < PMV<624.2 °C22.2 °C
Min. (C)−0.7 < PMV <1521.6 °C20.4 °C

