Competition and Sustainability Development of a Multi-Airport Region: A Case Study of the Guangdong–Hong Kong–Macao Greater Bay Area


School of Geography and Planning, Sun Yat-Sen University, Guangzhou 510275, China
*
Author to whom correspondence should be addressed.
Sustainability 2019, 11(10), 2958; https://doi.org/10.3390/su11102958
Submission received: 3 April 2019
/
Revised: 14 April 2019
/
Accepted: 21 May 2019
/
Published: 24 May 2019
(This article belongs to the Special Issue Sustainable Urban Logistics)
Abstract
:A new era in the development of multi-airport regions (MARs) has been in China, especially in the construction of global urban areas such as the Guangdong–Hong Kong–Macao Greater Bay Area (GBA). In order to better understand competition and provide significant advice to support sustainable development of Chinese MARs, this paper takes the GBA-MAR as an example, and then explores the competition between airports in this multi-airport region based on route level and its impact on passenger airport choice using three liner models. According to our findings, competition is concentrated on a few air routes in the Northeast–East Coastal region and the Asia-Pacific region, in which all three airports operate. Although the domestic market of the GBA-MAR has been relatively mature, the international air transport market is still left with considerable room, which is also reflected in connections to the world’s cities and tourist destinations. In addition, the research also found that different airport brands created by route type significantly affected passenger airport choice. Overall, the study revealed that whether from a supply or demand aspect, competition between airports in a multi-airport region—not just airline competition in a single airport—is an important topic.
1. Introduction
Multi-airport regions have gradually become the sustainable development mode of air transport under the constraints of land use and noise: The expansion of large hub airports is gradually restricted, especially in global city regions [1,2,3]. Since reform and opening up, China’s air transportation has maintained rapid growth and has been the largest air transport market in the Asia-Pacific region [4,5]. Substantial air traffic volume and rapid integration in urban regions have catalyzed the emergence and development of the three most famous world multi-airport regions in China, which include Beijing, Shanghai, and Hong Kong [6].
The Hong Kong multi-airport region, also known as the Guangdong–Hong Kong–Macao Greater Bay Area multi-airport region (GBA-MAR), is important infrastructure in the development and implementation of the “Belt and Road”, which also has been recognized by the Chinese government, and an official plan is being formulated to promote the cooperative development of this multi-airport region. As a new national strategy, the GBA is an area of 55,904 km2 in South China. Administratively, it consists of 11 municipalities, as shown in Figure 1. They are Guangzhou, Shenzhen, Foshan, Dongguan, Huizhou, Zhongshan, Jiangmen, Zhuhai, and Shiuhing in Mainland China (called the Pearl River Delta—PRD) and the Hong Kong and Macau Special Administrative Region (SAR) [7]. As listed in the Table 1, there were already seven airports in this region by 2017 (a total of 20,122.3 million passengers), but only Hong Kong International Airport (HKG), Guangzhou Baiyun International Airport (CAN), and Shenzhen Bao’an International Airport (SZX) reached the “First Class Civilian Airport Standard” of the Civil Aviation Administration of China (CAAC), and the market share of all of these three airports was over 20%, for which they could be classified as the major airports in this multi-airport region [2,8,9]. Therefore, in terms of comparability, what we consider in the following are only the three major airports in the GBA, which can almost indicate the competition situation in this MAR. Furthermore, according to driving times and distances between airports, HKG–SZX is more compact than SZX–CAN or CAN–HKG. With the opening of the Hong Kong–Zhuhai–Macau Bridge in 2018, the links between two SARs and the mainland were further strengthened, which also improved surface accessibility between the three airports and intensified their competition. Thus, local government, airport, and airline authorities have a strong interest in seeking a cooperative and sustainable development path for the GBA-MAR.
However, how to coordinate airports within a MAR has always been a common dilemma from either the supply or demand perspective. From the perspective of supply, a range of research by geographers has focused on airline competition, especially after aviation liberalization implementation in Europe and America. This began with Taaffe (1958), who first analyzed airline competition in the U.S and its changes, along with the era of aviation liberalization [10]. Henceforth, the process of air deregulation and its impacts on airline competition, service, and pricing have raised the interest of many researchers [11,12,13,14]. Besides, competitive strategies, economies of traffic, and institutions are also considered when measuring air transport competition [15,16,17]. In addition to economic studies on the subject, geographers have taken considerable interest in connectivity, accessibility, and network complexity as ways to measure air transport competition [18,19,20,21,22,23,24]. Most of the time, the results have been spatially aggregated. A few research works, such as Van Geenhuizen et al. (2007) and Dobruszkes (2009), have made an effort to study competition at the city pairs level in Europe [25,26]. However, what was focused on in these studies were several airlines in one airport, but this did not automatically mean that the carriers operated the same air routes. Furthermore, competition at the city pairs level, especially for airports with overlapping hinterland and air routes, have largely been ignored in the geography of air transportation.
In terms of passenger demand for air transport, relative competition and services at airports within a MAR have greatly impacted overall connectivity, as well as passenger air travel behavior [5]. Research studying passengers’ choice of multi-airport areas has been a popular topic since the 1970s, when the phenomenon of regional multiple airports attracted wide attention. The most comprehensive way to conduct travel behavior of passengers in multi-airport areas is to analyze travel times, cost, and other factors, but competition at the city pairs level in multiple airports with the same air routes in a MAR is not always included [27,28,29,30,31,32].
In brief, some studies may have investigated the aggregated level of competition, but few of them have been based on the air route level, not to mention consideration from both the supply and demand aspects. Moreover, as a special place in China, Hong Kong and Macau have always been neglected when researchers study Chinese airline competition and connectivity [33,34,35,36,37,38,39,40]. This paper summarizes the advanced mode of the competition of multi-airport regions and contributes by combining both the supply and demand perspective to systematically reveal the competition and substitution of airports in MARs. Taking the GBA-MAR as a case study, this paper highlights how much air transport markets have overlapped, how competitive these air transport markets have been, and implications for the substitution of airports from the passenger’s point of view.
The rest of the article is divided into four parts. In the first, we address the methodology and data used. This is followed by a quantitative estimate of the level of competition using two different methods. Next, the geography of competition is presented according to region, air route, and nodal city. Third, we take the competition index as a factor and use aggregated data of passenger airport choice to analyze the functional differentiation of three airports. Finally, we try to provide some competition and coordination advice to regional authorities.
2. Materials and Methods
As explained in Section 1, we explore both supply and demand aspects. From the supply perspective, this paper first recognizes the overlapping markets from the air route level and classifies these markets according to the number of operational airports. Then, the number of competitors and a market concentration index are used as measures to evaluate competition in three air transport market types. As a next step, the market concentration index is taken as a factor, along with fare, flights, airport access time, etc., to build three linear models, each for comparing the same routes in the overlapping air transport markets.
2.1. Measuring the Levels of Competition
In the existing measurements of competition on a route level, the number and the market share of competitors are two basic aspects [10,39,40]. In detail, the number of airlines and the Herfindahl–Hirschman Index (HHI) are the most commonly used, despite other indicators, such as different combinations of full-service airlines and low-cost airlines, the share of the biggest airline, entropy, etc. [26,41,42,43,44]. In order to measure competition comprehensively and avoid using indicators expressing similar information, two classic indexes are used here to evaluate the competition in the GBA-MAR.
2.1.1. Market Competition Index
The market competition index in each airport route is defined as the number of airlines operating there, which is written
where when an airline operates any flight on air route out of the three major airports in the GBA-MAR and otherwise; is the number of airlines on air route ; and is the sum of on air route and reflects how many airlines operate in this market (Appendix C). This means that the higher the index is, the more competitive the market is. Meanwhile, for the sake of classification, we divided the values into four categories, i.e., , each representing a different level of competition [40].
2.1.2. Market Concentration Index
As an index of competition, the number of airlines overlooks the problem caused by potentially unequal distribution of air transport market shares among operators. To complement it, the Herfindahl–Hirschman Index (HHI) was used as the other comprehensive competition index indicating the concentration of a market. It is written
where is the total flight volume on air route ; is the flight volume of airline on air route , here evaluated by flights; and is the market share of airline on air route within the three major airports in the GBA-MAR. On air route , the index ranges from 0 to 1, which can be divided into six categories at intervals of 0.2 to represent different levels of competition. If it equals 1, this means that only one airline serves this air route, representing a monopoly market (Appendix C). The other five intervals (i.e., 0.8–1, 0.6–0.8, 0.4–0.6, 0.2–0.4, and 0–0.2) respectively represent monopolistic competition, low competition, medium competition, high competition, and perfect competition [40,41,44].
2.2. Functional Differentiation of Airports
Airports in MARs should not only have geographic relationships, but should also have a consistent “functional” system [5,45]. Some academics have studied the possible impact of price changes at “airport a” on “airport b” when they have similar air transport markets, which can be used to partially demonstrate the correlations between airports in MARs [46,47,48]. Based on that, Fuellhart et al. (2013) extended the price model and used it to provide evidence that the relative number of passengers between two airports in a MAR varies in relation to variables associated with consumer air travel behavior [45]. Following those leads, here we developed three line models to assess the functional differentiation and possibility of substitution between airports with data of departures from the three major airports (the models were constructed for three combinations, i.e., HKG–CAN, HKG–SZX, and CAN–SZX). According to existing studies on air travel behavior, fares, frequency, airport access times, and flight times are the dominant factors in passenger airport choices [27,28,29,30,31,32]. Thus, the models were constructed with relative levels of those factors and the HHI: Relative fares and flights per route for each airport combination (e.g., the fare on the route from origin HKG to destination PEK vs. the fare on the route from origin CAN to destination PEK), relative airport ground accessibility per route (e.g., the ratio between car driving time from the center of the GBA-MAR to HKG and the flight time on the route from origin HKG to destination PEK vs. the ratio between car driving time from the center of the GBA-MAR to CAN and the flight time on the route from origin CAN to destination PEK), relative level of competition (e.g., the HHI index on the route from origin HKG to destination PEK vs. the HHI index on the route from origin CAN to destination PEK), and route type (an indicator if the route is a domestic short-haul, domestic long-haul, international short-haul, or international long-haul route). The model was constructed and is stated as follows:
where and are airports within the GBA-MAR, and the rest are the following:
- = the natural log of the ratio of passengers on air route to or from airports and in 2017;
- = the natural log of the ratio of average fares on air route to or from airports and in 2017;
- = the natural log of the ratio of flights on air route to or from airports and in 2017;
- = the natural log of the ratio of on air route to or from airports and in 2017;
- = the natural log of the ratio of airport access time to flight time on air route to or from airports and , where airport access time is measured as the car driving time from the GBA-MAR center to airport or airport , which was extracted from the “OpenStreetMap” on the first Monday in December 2017;
- = indicator variable coded “1” if air route is a domestic short-haul route;
- = indicator variable coded “1” if air route is a domestic long-haul route;
- = indicator variable coded “1” if air route is an international short-haul route; and
- = indicator variable coded “1” if air route is an international long-haul route.
The goal of the models was to assess the relationship between competition and relative numbers of passengers on the same route so that we could detect potential substitution from the results of passengers’ airport choices. It is important to stress that those variables are the dimensions commonly used to characterize functions in airports and are calculated as ratios.
2.3. Data Processing
2.3.1. Official Aviation Guide (OAG) Flight Schedule
Our analyses of the supply of air services were carried out with the aid of OAG’s databases, which included regularly scheduled services from or to the three airports in the GBA-MAR for each month in 2017. For each flight, the service on offer is described exhaustively, indicating origin, destination, the operating airline, code sharing, stopovers, flight time, flight distance, flights, number of seats, etc. All of the stopover air routes are split into two segments, and the data for cities with more than one airport are combined, finally involving 119 airlines, 1.1 million frequencies, and 221.2 million available seats in 294 directed markets.
2.3.2. Marketing Information Data (MIDT)
Data available from the MIDT were used to provide a broad assessment of the spatial associations of the airports within the GBA-MAR and to examine the extent to which they have geographic relationships consistent with a “functional” multi-airport region [5,45].
The original sources of information for the MIDT dataset were Global Distributions Systems (GDS), except for regular dimensions such as operation airline, origin, destination, distance, etc. The metrics, which are edited monthly, also include the number of passengers, cabins, average fare of total passengers, and total revenue. As the flight is an important factor influencing passenger choice, the provider of our data (OAG Traffic Analyzer) combined this dataset with monthly scheduled air services and added flights. However, there were still some limitations with the MIDT dataset that should be acknowledged. The overall level of traffic is edited monthly, so what the dataset indicated was the average level of passenger airport choice results, which contained 215,534 different itineraries and 71.1 million passengers departing from the GBA-MAR (referring to the three major airports).
3. The Supply Perspective: The Levels of Competition
3.1. Overlapping Air Transport Markets in the GBA-MAR
The overlapping air transport markets here mean that more than one of the three major airports within the GBA-MAR provide flights to the same city. Table 2 provides the details of the domestic and international overlapping air transport markets.
We observed that in the GBA-MAR, the overlapping markets account for a high proportion both in the domestic and international air transport market, especially in the tripoly market. For the domestic market, there are 148 direct air routes in these airports: 60 air routes are operated in two airports (11.3% of flights), and more than 90% of them are operated both in CAN and SZX. Although the number of air routes in the tripoly market is less than in the duopoly market, the flights account for about 90%. In the international air transport market, the first element to highlight is that although just 24 air routes are operated by the three airports, the percentage of flights is over 60%. Meanwhile, there are 37 air routes operated by two airports (26.5% of flights), mainly in CAN and HKG. However, the picture is very different in the domestic market when it comes to a monopoly market. Over 50% of air routes are operated by just one airport, and they occupy about 10% of flights. HKG has an absolute advantage in this market.
In view of the above, although the three airports all play a role as hubs, CAN and HKG are respectively dominant in the domestic market and international market. Both the domestic and international tripoly markets are concentrated on a small number of air routes, especially the international market, with 24 air routes accounting for only 16.4%. Moreover, we found that SZX is already developed as a strong competitor in the domestic market, with the air route ratio between SZX and CAN at just 1.3. Correspondingly, CAN is in a similar position to SZX when it concerns the international market: The air route ratio between HKG and CAN in this market is 1.5, which indicates that there is a big gap that exists in international air transportation between HKG and CAN. This gives SZX a chance to develop its own distinct international market.
3.2. Airline Competition in Overlapping Markets
Table 3 describes in detail different types of airline competition in the domestic market. An air transport market operated by more airports always means that more airlines compete in these markets, but this does not mean an equally increasing ratio. Airline competition in the duopoly market is still not obvious, for of the 60 air routes of this type, over 80% of flights are operated by one or two airlines. On the contrary, in the tripoly airport operations market, 37 air routes are under the control of four airlines or more, which accounts for 83.6% of total domestic flights.
For the three largest base airlines in the domestic market, the position of the airport almost represents the position of the base airline in this airport, while China Southern Airlines is more than that. Over 55% of domestic flights are controlled by China Southern Airlines, Shenzhen Airlines, or Cathay Dragon. China Southern Airlines accounts for 35% of flights, mainly because China Southern Airlines is not only the largest base airline in CAN but also the second largest airline in SZX, representing the oligopolistic power of China Southern Airlines as one of the national airlines of China.
When we considered low-cost airlines, the largest market for low-cost airlines still belongs to the tripoly airport operation market, with four airlines or more. About 90% of air routes of this type of market were with low-cost airlines, but the corresponding market share was only 4.9%. This means that although low-cost airlines already participate in domestic competition in many air transport markets, it is only at a small scale, which is very different from the situation in the U.S. and Europe [49,50,51,52,53].
Table 4 describes airline competition in the international market. Most air routes in the tripoly airport operation market are at a high level of competition, but a number of air routes lack effective competition.
A few airlines can monopolize the market operated by the three airports, which is different from the domestic market. About 90% of the air routes in this market are operated by four airlines or more, which accounts for 60.6% of flights. The shares of the flights in the other markets classified are all less than 5%.
For the largest base airlines and low-cost airlines, the performance is similar to the domestic market, but the dominant position of China Southern Airlines changes to Cathay Pacific Airways Limited (with less monopolizing power): 40.2% of flights are operated by China Southern Airlines or Cathay Pacific Airways Limited, and Shenzhen Airlines only participates in the operation of nine routes, accounting for 2.0% of flights. The market for low-cost airlines is also mainly in the overlapping markets operated by more than two airports: 15 low-cost air routes (11.2% of flights) are in the tripoly airport operation market, and the second biggest market for low-cost airlines (7 air routes, 2.1% of flights) is in the duopoly airport operation market. All of them are in a competitive environment (operation by four airlines or more), which is much larger compared to the market share of low-cost airlines in the domestic market.
3.3. Spatial Competition
3.3.1. According to Region
Based on Liu (2005), Table 5 provides disaggregated results for each of the three Chinese regions in 2017 (the Northeast and East Coastal region, the Middle and Near-Reach-West region, and the Far-Reach-West region) [54].
It was no surprise that the most competitive market is the tripoly airport operation market in the Northeast and East Coastal region. But a higher market share does not mean a higher level of competition, which is shown both in the Northeast and East Coastal region market and the Far-Reach-West region market. No matter the share of flights or the average number of airlines, the tripoly airport operation market occupies 87% of domestic flights and about six carriers operate per route, which is more outstanding than the duopoly airport operation market. Moreover, in the tripoly airport operation market, 59 air routes (61% of domestic flights) are to the Northeast and East Coastal region, followed by the Middle and Near-Reach-West region (77 air routes and 36% of domestic flights). The flight shares of both of these two regions are 10 times higher than in the Far-Reach-West region.
From a competition aspect, the Northeast and East Coastal region is the most competitive market, with average values of 0.621 on the HHI and four airlines, but this was not consistent with the regional results of the duopoly airport operation market and tripoly airport operation market. In the duopoly market, the Middle and Near-Reach-West region is the largest market, with 34 air routes and 6% of flights, but the average HHI is higher than the index of the other two regions, especially compared to the small market of the Far-Reach-West region (only 6.2% of domestic flights). Similarly, in the tripoly airport operation market, two air routes (1% of domestic flights) are the most competitive market (with a 0.278 HHI), but not in the Northeast and East Coastal region market (26 air routes and 57% of domestic flights). These results suggest that there are a few air routes in the west, but most of them are operated by three airlines, and their level of competition is relatively balanced. Correspondingly, although many air routes and flights are from GBA-MAR to the other two regions, most of the markets are still under the control of big airlines such as China Southern Airlines and Shenzhen Airlines.
Table 6 reveals the breakdown of the results for worldwide regions in 2017. Compared to the domestic market, the shares of the international market are distributed in a more average way, and the level of competition is relatively higher in all airport operation types. At present, Asia-Pacific is the major area for development and competition, which may be because of economic exchanges and tourism. In the top three biggest regional markets, i.e., Asia-Pacific, Europe, and North America, the tripoly airport operation type is at the highest competitive level, with an HHI of 0.284, 0.309, and 0.408. Although it as an important region for the implementation of the “Belt and Road” strategy, the flights between the GBA-MAR and the Middle East account for just 4% of flights (with 15 air routes), and the market is controlled by several airlines. Moreover, this also shows that Latin America is an empty space for the three airports connected to the world.
3.3.2. According to Route
In order to further analyze the competition level based on route, Figure 2 and Figure 3 highlight the connections that are operated by at least four airlines and characterized by an HHI less than the average value of the domestic or international market.
Among the remaining 39 air routes above a medium level, it is no surprise that MAR–Shanghai is the most competitive air route, with the smallest HHI (operated by 12 airlines) (Figure 2). Besides, one interesting result was that as a trunk air route at a large scale, MAR–Beijing is less competitive than seven air routes, even including MAR–Chongqing and MAR–Chengdu in the Middle and Near-Reach-West region. Meanwhile, at a high level of competition, except for connections between the MAR and domestic major cities, tourist destinations such as Lijiang, Kunming, Haikou, and Xiamen are also in a significant environment. In contrast, as a famous travel city, the air route MAR–Sanya is one of the least competitive of these 39 air routes. One reason may be that because of increasing competition between air transport and the high-speed rail, this has led to the loss of passengers from civil aviation to high-speed rail, especially for a short-haul distance [55,56].
Just like the phenomenon in domestic air routes, we found that most of the air routes are at a high level of competition (Figure 3). All of the seven perfect competitive air routes are for the Asia-Pacific market, except one air route to Singapore, and the rest of the six air routes at this level of competition are all for Thailand, Korea, and Japan. Among these, the top three are MAR–Bangkok, MAR–Seoul, and MAR–Tokyo. This not only suggests intense economic and trade exchanges between China and these three cities, but also tells us the importance of these airports as transfer hubs for GBA–MAR when it develops world air transport networks. Meanwhile, in the less competitive markets (with an HHI from 0.2 to 0.6), air routes to various Asian cities such as Hanoi, Taipei, and Manila have begun to appear. Meanwhile, air routes to cities in Europe and North America, such as Frankfurt, Paris, San Francisco, Amsterdam, and Vancouver, have also become popular choices that airlines in these three airports are interested in.
Overall, for most air transport markets, the more airports that open routes, the more competitive these markets are. On that basis, two types of air routes dominate the map: On the one hand, connections between major urban regions, and on the other, tourist destinations. With limited time resources and airspace, these destinations have become the major targets for airports and airlines in the GBA-MAR.
3.3.3. According to Nodal Cities
As analyzed in Section 3.3.2, the major urban cities and tourist cities are the most competitive destinations for air transport in the GBA-MAR. In order to further explore connections in the GBA-MAR, we tried to find out the nodal cities that may influence future development and competition.
Generally speaking, the air transport connections between the GBA-MAR and nodal cities in the domestic market are much more complete than between the GBA-MAR and nodal cities in the international market (Figure 4 and Figure 5). Meanwhile, competition in the domestic connections is more intense than in the international market, especially for air routes to short-haul cities.
In domestic air transport nodal cities, based on Wu et al. (2014) we selected 90 provincial nodal cities (or above this status) with civil airports [57]. Combined with the top 60 main tourist cities in 2017, 96 relatively important nodal cities with airports were concerned [58]. Figure 4 describes connections of the GBA-MAR with nodal cities in the domestic market. As is shown, the GBA-MAR already overall controls the key nodal cities in China’s mainland. Of the 90 nodal cities (excluding cities within the GBA), 83 cities are connected with the MAR, and airports in the rest of the 7 cities all have a small capacity. Besides, 42 destinations are operated by the three airports, and most of these cities are in the Northeast and East Coastal region and the Middle and Near-Reach-West region, while Hohhot and Xining are the only two Far-Reach-West region nodal cities. Among the 27 cities with competition from two airports, 26 operate through CAN and SZX. We can also see the dominant status of CAN in the 14 cities operating through one airport. Furthermore, when we concern cities with both properties, 80% of them are competed for by three airports, and the rest of the 8 cities (Datong, Huangshan, Lianyungang, Nantong, Qinhuangdao, Weihai, Urumqi, and Yinchuan) also have air routes to or from two airports in the GBA-MAR.
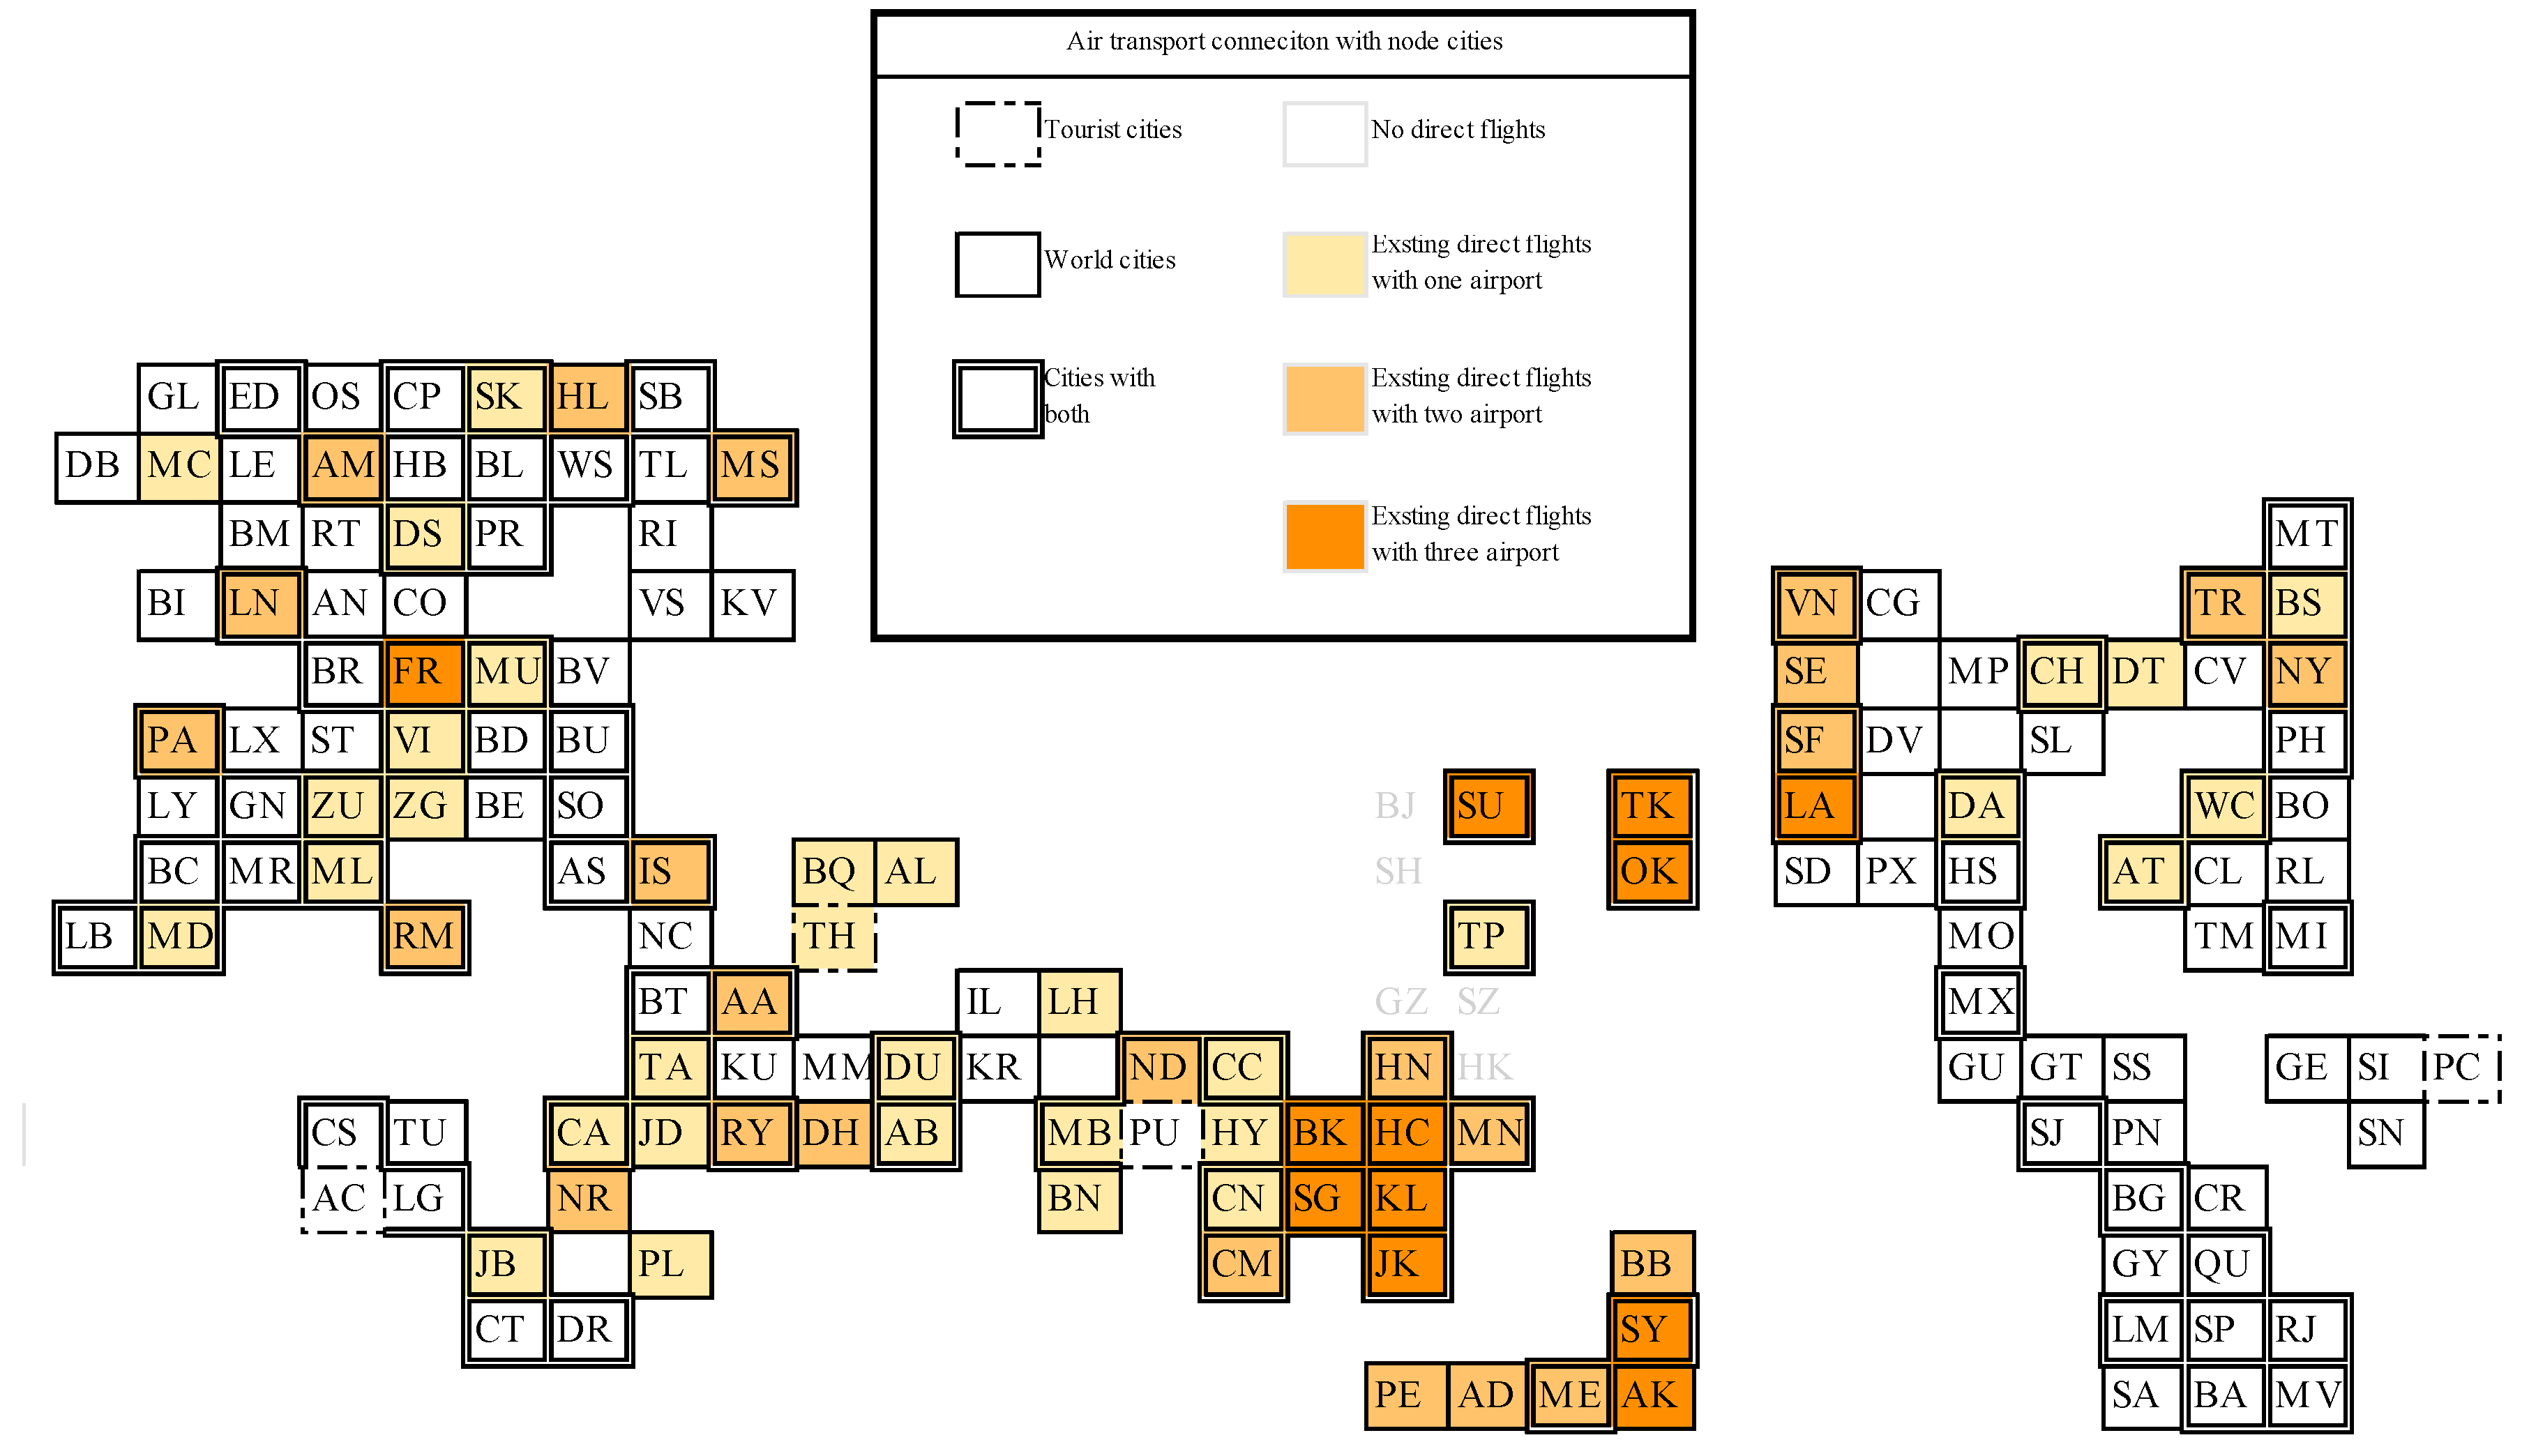
For the international air transport nodal cities, based on Taylor and Derudder (2016), there are 152 world cities out of 526 cities, and combined with the top 200 tourist cities from the report of global destination cities index by Mastercard in 2017, there are 151 relatively important nodal cities with airports that are concerned, except for Hong Kong and 4 world cities on the Chinese mainland [59,60]. Figure 5 describes the connections of the GBA-MAR with these world nodal cities in the international market.
Although over half of the 151 important nodal cities (including Taipei) have direct flights to the GBA-MAR, only 14 cities are connected to three airports. For the rest of the 54 cities, the connections with most cities are under the control of one airport. That connection performance becomes much worse when we focus on the 84 cities considered to be both world cities and travel destinations, where only 50 cities have direct flights to the GBA-MAR and over 40% of them are only connected to HKG. This means that these three airports depend heavily on other cities to connect to over 50% of the important nodal cities in the international market, especially CAN and SZX.
A number of world nodal cities have established air transport connections to GBA-MAR, but they are lacking in competition for the air routes to long-haul nodal cities. Nodal cities such as Bangkok, Ho Chi Minh City, Seoul, Tokyo, Osaka, Kuala Lumpur, Jakarta, Singapore, Sydney, Auckland, Taipei, etc., all have direct flights to three airports in the GBA-MAR. Other cities such as Hanoi, Manila, Brisbane, etc., also have existing direct air transport connections to two airports. However, many important nodal cities considered to be both world cities and tourist cities (short-haul) still only have direct air transport connections to one airport, such as Calcutta, Chennai, Mumbai, Abu Dhabi, etc. Abu Dhabi is a city that can also be a perfect transfer hub (like Dubai), but only HKG has established direct routes to it. In terms of cities farther away from the GBA-MAR, such as Beirut, Athens, Durban, Sofia, and Bucharest, none of them have a direct connection to the MAR.
4. The Demand Perspective: The Functional Differentiation of Airports
The model results for the GBA-MAR were varied (Table 7). Due to the lack of long-haul flight data in the domestic market, the dummy variable for domestic long-hauls was excluded. We found substantial relationships in passenger ratios between CAN–HKG (adjusted R2 = 0.827) and SZX–HKG (adjusted R2 = 0.888), but the adjusted regression for the model of SZX–CAN was much lower.
In the models focusing on the same air routes in three different combinations, positive coefficients of flights were always significant, indicating a positive relationship between the relative level of traffic and the flight ratio. Besides, for the CAN–HKG model, both the fare ratio and the HHI of the air routes were significant. That is, as the relative fare on a route rises at CAN compared to HKG, the relative air route passenger traffic on that route drops at CAN (as we expected). At the same time, the smaller the HHI compared to HKG for air routes is, the higher the relative route passenger traffic from CAN is. This suggests that a higher level of competition at CAN attracts more passengers. Meanwhile, in the SZX–HKG model, except for the dominant effect of the flight ratio, we could see a significant negative effect in the type of long-haul international route, which suggested that if a passenger is on an international long-haul flight, he or she would rather choose HKG. Interestingly, we also found that type of route effect in the SZX–CAN model. The model showed a large negative effect on types of short-haul domestic routes, so this highlights the disadvantage of SZX when it competes with CAN in the short-haul domestic market. In addition, we found a significant effect for the access time ratio of car driving time, but this had no meaning, as the coefficient was counterfactual: This may be because the data used were not the actual access times of each passenger, but only the average access time from the regional center [7].
5. Discussion and Avenues for Further Research
This article aimed at gaining the first sight into air transport competition in the GBA-MAR, which is the first and most mature MAR in China. Considering the MAR as a whole, we focused on “geographically constant” competition at the air route level from the supply perspective, then discussed the functional differentiation of three combinations from the demand perspective. The study’s main results are as follows:
- Most of the air transport markets are operated simultaneously by these three airports, which obviously improves the competition level. Meanwhile, among the three airports in the MAR, CAN is the dominant one in the domestic market, and HKG is the dominant one in the international market. This has been recognized by passengers and significantly influences their choices regarding SZX;
- When it comes to spatial competition, for the tripoly airport operation market, the Northeast and East Coastal region and the Asia-Pacific region are retrospectively the biggest markets for domestic air transport and international air transport in the GBA-MAR. Competition still affects only a limited number of air routes in these two regions. Moreover, as a significant factor in passenger choice, competition is an important topic for CAN in the future, especially compared to HKG;
- Looking at connections between the GAB-MAR and major urban cities or tourist destinations, we found that the air transport network has been relatively perfect, while the international air transport market of the MAR is still left with a lot of room. The main competition in the future will most probably come from the international market. Meanwhile, with newly built or expanded airports in Aksu, Chaoyang, Chengde, Chifeng, Dongying, Hengyang, and Xiangyang, future airport construction plans may stimulate more competition.
Based on the discussions above, and considering the sustainable development of MARs, some policy suggestions are provided:
- For the domestic market, Datong, Huangshan, Lianyungang, Nantong, Qinhuangdao, Weihai, Urumqi, and Yinchuan are destinations with low competition but important positions in the air transport network: They can be nodal cities in improving domestic air transport networks. Besides, since there are limits for low-cost airlines, the airlines established as the result of cooperation between big airlines and local governments may be more likely ways to improve competition in CAN and SZX than low-cost airlines in domestic markets because of government policies;
- Meanwhile, for international markets, we should break the predicament of relying on a few airports as transfer hubs and expand the reachable boundaries of the direct air routes of the GBA-MAR. Developing long-haul routes to European and American cities can be a way to solve competition concentrated only in the Asia-Pacific region. This is more important for SZX because of the “Framework Agreement on Strategic Cooperation for Promoting the High-Quality Development of Guangdong Civil Aviation”, which was published by the Civil Aviation Administration of China (CAAC). Besides, combined with the “Belt and Road”, the Middle East should also be included in the future development of the GBA-MAR.
In general, the model results are noteworthy and provide a good foundation to explore competition at the route level in airports in a MAR and its impact on passenger airport choice.
However, in term of using aggregated data, there were still some limitations to the analysis from a demand perspective: Lots of individual attributes, such as gender, age, occupation, income, and travel purpose, were not included. Average levels of airport access time and airfare were considered in the model, but not actual access time and the airfare for each person. Therefore, a detailed investigation considering both route level competition and other personal attributes can be explored in future research, which could help in understanding the effect of airport competition on heterogeneous people, so that local authorities, airports, and airlines can formulate more elaborate strategies to coordinate competition on various air routes and achieve the goal of sustainable development.
Author Contributions
Conceptualization, W.L. and X.C.; data curation, W.L.; formal analysis, S.L.; funding acquisition, X.C.; investigation, W.L.; methodology, W.L.; project administration, X.C.; resources, X.C.; software, W.L.; supervision, X.C. and S.L.; validation, W.L. and X.C.; visualization, W.L. and S.L.; writing—original draft, W.L.; writing—review and editing, X.C.
Funding
This research was funded by the National Natural Science Foundation of China, No. 41831284.
Acknowledgments
We gratefully thank Andrew R. Goetz at University of Denver, Xingchuan Gao and Tao Li at Shaanxi Normal University for useful discussions and constructive recommendations.
Conflicts of Interest
The authors declare no conflicts of interest.
Appendix A

Table A1.
List of domestic air transport nodal cities as world cities or tourist destinations with airports.
Table A1.
List of domestic air transport nodal cities as world cities or tourist destinations with airports.
| Name | Code | Name | Code | Name | Code | Name | Code |
|---|---|---|---|---|---|---|---|
| Aksu | AK | Haikou | HA | Nanchang | NC | Weihai | WE |
| Anshan | AS | Hailar | HL | Nanchong | NA | Wenzhou | WZ |
| Baotou | BT | Handan | HD | Nanjing | NJ | Wuhan | WH |
| Beihai | BH | Hangzhou | HZ | Nanning | NN | WuXi | WX |
| Beijing | BJ | Harbin | HB | Nantong | NT | Xiamen | XM |
| Changchun | CC | Hefei | HF | Nanyang | NY | Xi’an | XA |
| Changde | CA | Hengyang | HY | Ningbo | NB | Xiangyang | XY |
| Changsha | CS | Hohhot | HH | Ordos | OD | Xining | XN |
| Changzhi | CZ | Hong Kong | HK | Panzhihua | PH | Xinzhou | XZ |
| Changzhou | CO | Huangshan | HS | Qingdao | QD | Xuzhou | XU |
| Chaoyang | CY | Huizhou | HU | Qinhuangdao | QH | Yan’an | YA |
| Chengdu | CD | Jiamusi | JM | Qiqihar | Yanbian | YB | |
| Chifeng | CF | Jiayuguang | JY | Quanzhou | QZ | Yancheng | YC |
| Chongqing | CQ | Jinan | JA | Sanya | SY | Yangzhou | YZ |
| Dalian | DL | Jining | JN | Shanghai | SH | Yantai | YT |
| Daqing | DQ | Kunming | KM | Shenyang | SE | Yichang | YG |
| Datong | DT | Lanzhou | LZ | Shenzhen | SZ | Yinchuang | YI |
| Dongying | DY | Lasa | LS | Shijiazhuang | SJ | Yulin | YL |
| Foshan | FS | Lianyungang | LG | Taiyuan | TY | Yuncheng | YU |
| Fuzhou | FZ | Linfen | LF | Taizhou | TZ | Zhangjiakou | ZK |
| Ganzhou | GA | Linyi | LY | Tangshan | TS | Zhanjiang | ZJ |
| Guangzhou | GZ | Luliang | LL | Tianjin | TJ | Zhengzhou | ZZ |
| Guilin | GL | Luoyang | LU | Urumqi | UQ | Zhuhai | ZU |
| Guiyang | GY | Macau | MC | Weifang | WF | Zunyi | ZY |
Appendix B
Table A2.
List of international air transport nodal cities as world cities or tourist destinations with airports.
Table A2.
List of international air transport nodal cities as world cities or tourist destinations with airports.
| Name | Code | Name | Code | Name | Code | Name | Code |
|---|---|---|---|---|---|---|---|
| Amman | AA | Cologne | CO | Lima | LM | Riga | RI |
| Abu Dhabi | AB | Cape Town | CT | London | LN | St Petersburg | SB |
| Adelaide | AD | Dallas | DA | Mumbai | MB | San Francisco | SF |
| Almaty | AL | Dublin | DB | Luxembourg | LX | Singapore | SG |
| Amsterdam | AM | Denver | DV | Lyon | LY | Rotterdam | RT |
| Athens | AS | Detroit | DT | Madrid | MD | San Diego | SD |
| Antwerp | AN | Doha | DH | Manama | MM | San Jose | SJ |
| Atlanta | AT | Durban | DR | Manchester | MC | Stockholm | SK |
| Buenos Aires | BA | Düsseldorf | DS | Melbourne | ME | San Juan | SN |
| Auckland | AK | Dubai | DU | Marseille | MR | San Salvador | SS |
| Baku | BQ | Edinburgh | ED | Miami | MI | Santiago | SA |
| Baltimore | BO | Frankfurt | FR | Milan | ML | Santo Domingo | SI |
| Barcelona | BC | Geneva | GN | Manila | MN | Sofia | SO |
| Budapest | BD | Hamburg | HB | Moscow | MS | Seattle | SE |
| Bogota | BG | Georgetown | GE | Minneapolis | MP | Sao Paulo | SP |
| Bangkok | BK | Glasgow | GL | Monterrey | MO | Seoul | SU |
| Belgrade | BE | Guadalajara | GU | Montreal | MT | Sydney | SY |
| Berlin | BL | Guatemala | GT | Munich | MU | Tel Aviv-Yafo | TA |
| Birmingham | BM | Guayaquil | GY | Montevideo | MV | St. Louis | SL |
| Bangalore | BN | Ho Chi Minh City | HC | Mexico City | MX | Tokyo | TK |
| Brussels | BR | Hanoi | HN | New Delhi | ND | Stuttgart | ST |
| Bratislava | BV | Helsinki | HL | Nairobi | NR | Taipei | TP |
| Brisbane | BB | Houston | HS | New York | NY | Toronto | TR |
| Bristol | BI | Istanbul | IS | Osaka | OK | Tallinn | TL |
| Boston | BS | Hyderabad | HY | Nicosia | NC | Tampa | TM |
| Beirut | BT | Islamabad | IL | Paris | PA | Vienna | VI |
| Bucharest | BU | Johannesburg | JB | Oslo | OS | Vancouver | VN |
| Cairo | CA | Jakarta | JK | Panama City | PN | Washington | WC |
| Calcutta | CC | Jeddah | JD | Philadelphia | PH | Warsaw | WS |
| Chicago | CH | Kuala Lumpur | KL | Perth | PE | Tunis | TU |
| Calgary | CG | Karachi | KR | Prague | PR | Zurich | ZU |
| Colombo | CM | Kiev | KV | Phoenix | PX | Accra | AC |
| Caracas | CR | Los Angeles | LA | Port Moresby | PL | Vilnius | VS |
| Chennai | CN | Kuwait City | KU | Quito | QU | Pune | PU |
| Charlotte | CL | Lisbon | LB | Rio Janeiro | RJ | Punta Cana | PC |
| Copenhagen | CP | Lahore | LH | Rome | RM | Zagreb | ZG |
| Casablanca | CS | Leeds (North Carolina) | LE | Riyadh | RY | Tehran | TH |
| Cleveland | CV | Lagos | LG | Raleigh | RL |
Appendix C
Table A3.
List of notations.
| Variable | Description |
|---|---|
| Air route | |
| Service airline | |
| Set of airlines in the GBA-MAR | |
| Dichotomous variable that takes “1” when the airline operates any flight on air route out of the three major airports in the GBA-MAR, and otherwise, it takes “0” | |
| The number of airlines operating on air route | |
| The Herfindahl–Hirschman Index () of air route | |
| Total flight volume on air route | |
| Flight volume of airline on air route | |
| Market share of airline on air route within the three major airports in the GBA-MAR | |
| Independent variable, the natural log of the ratio of passengers on air route to or from airports and | |
| Natural log of the ratio of flights on air route to or from airports and | |
| Natural log of the ratio of average fares on air route to or from airports and | |
| Natural log of the ratio of airport access time to flight time on air route to or from airports and , and the airport access time is measured as the car driving time from the regional center to airports or | |
| Natural log of the ratio of the on air route to or from airports and | |
| Dummy variable for air route for a domestic long-haul route type, coded “1” if air route is a domestic long-haul route | |
| Dummy variable for air route for an international long-haul route type, coded “1” if air route is an international long-haul route | |
| Dummy variable for air route for a domestic short-haul route type, coded “1” if air route is a domestic short-haul route | |
| Dummy variable for air route for an international short-haul route type, coded “1” if air route is an international short-haul route |
References
- De Neufville, R. Management of multi-airport systems: A development strategy. J. Air Transp. Manag. 1995, 2, 99–110. [Google Scholar] [CrossRef]
- Bonnefoy, P.A.; De Neufville, R.; Hansman, R.J. Evolution and Development of Multi-Airport Systems: A Worldwide Perspective. J. Transp. Eng. 2010, 136, 1021–1029. [Google Scholar] [CrossRef]
- Fasone, V.; Giuffrè, T.; Maggiore, P. Multi-airport system as a way of sustainability for airport development: Evidence from an Italian case study. Procedia-Soc. Behav. Sci. 2012, 53, 96–105. [Google Scholar] [CrossRef]
- Wang, J.E.; Mo, H.H.; Jin, F.J. Spatial pattern of the worldwide airports and its enlightenment. World Reg. Stud. 2008, 17, 8–18. [Google Scholar]
- O’Connor, K.; Fuellhart, K. Airports and regional air transport markets: A new perspective. J. Transp. Geogr. 2016, 53, 78–82. [Google Scholar] [CrossRef]
- Zhang, L.; Gao, C.; Hu, H.Q. Comparison and suggestions on the coordinated development of three biggest airport groups and city groups of China. Compr. Transp. 2015, 9, 4–10. [Google Scholar]
- Loo, B.P.Y. Passengers’ airport choice within multi-airport regions (MARs): Some insights from a stated preference survey at Hong Kong International Airport. J. Transp. Geogr. 2008, 16, 117–125. [Google Scholar] [CrossRef]
- Loo, B.P.Y.; Ho, H.W.; Wong, S.C. An application of the continuous equilibrium modelling approach in understanding the geography of air passenger flows in a multi-airport region. Appl. Geogr. 2005, 25, 169–199. [Google Scholar] [CrossRef]
- Bonnefoy, P.A.; Hansman, R.J. Scalability of the Air Transportation System and Development of Multi-Airport Systems: A Worldwide Perspectiv; MIT International Center for Air Transportation (ICAT): Cambridge, MA, USA, 2008; pp. 72–75. [Google Scholar]
- Taaffe, J. A map analysis of United States airline competition. J. Air Low Commer. 1958, 25, 121–147. [Google Scholar]
- McHardy, J.; Trotter, S. Competition and deregulation: Do air passengers get the benefits? Transp. Res. Part A Policy Pract. 2006, 40, 74–93. [Google Scholar] [CrossRef]
- Goetz, A.R.; Vowles, T. The good, the bad and the ugly: 30 years of US airline deregulation. J. Transp. Geogr. 2009, 17, 259–263. [Google Scholar] [CrossRef]
- Alderighi, M.; Cento, A.; Nijkamp, P.; Rietveld, P. Competition in the European aviation market: The entry of low-cost airlines. J. Transp. Geogr. 2012, 24, 223–233. [Google Scholar] [CrossRef]
- Frédéric, D.; Graham, A. Air transport liberalisation and airline network dynamics: Investigating the complex relationships. J. Transp. Geogr. 2016, 50, 1–3. [Google Scholar]
- Tracey, P.; Clark, G.L. Alliances, Networks and Competitive Strategy: Rethinking Clusters of Innovation. Growth Chang. 2010, 34, 1–16. [Google Scholar] [CrossRef]
- Dobruszkes, F.; Lennert, M.; Hamme, G.V. An analysis of the determinants of air traffic volume for European metropolitan areas. J. Transp. Geogr. 2011, 19, 755–762. [Google Scholar] [CrossRef]
- Bubalo, B.; Gaggero, A.A. Low-cost carrier competition and airline service quality in Europe. Transp. Policy 2015, 43, 23–31. [Google Scholar] [CrossRef]
- Alderighi, M.; Cento, A.; Nijkamp, P.; Rietveld, P. Assessment of New Hub-and-Spoke and Point-to-Point Airline Network Configurations. Transp. Rev. 2007, 27, 529–549. [Google Scholar] [CrossRef]
- Xu, Z.W.; Harriss, R. Exploring the structure of the U.S. intercity passenger air transportation network: A weighted complex network approach. GeoJournal 2008, 73, 87–102. [Google Scholar] [CrossRef]
- Burghouwt, G.; De Wit, J.; Veldhuis, J.; Matsumoto, H. Air network performance and hub competitive position: Evaluation of primary airports in East and South-East Asia. Airpt. Manag. 2009, 4, 384–400. [Google Scholar]
- Bryan, D.L.; O’Kelly, M.E. Hub-and-Spoke Networks in Air Transportation: An Analytical Review. J. Reg. Sci. 2010, 39, 275–295. [Google Scholar] [CrossRef]
- Burghouwt, G.; Redondi, R. Connectivity in air transport networks: An assessment of models and applications. J. Transp. Econ. Policy 2013, 47, 35–53. [Google Scholar]
- Zanin, M.; Lillo, F. Modelling the air transport with complex networks: A short review. Eur. Phys. J. Spec. Top. 2013, 215, 5–21. [Google Scholar] [CrossRef] [Green Version]
- O’Kelly, M.E. Global Airline Networks: Comparative Nodal Access Measures. Spat. Econ. Anal. 2016, 11, 253–275. [Google Scholar] [CrossRef]
- Van Geenhuizen, M.; Reggiani, A.; Rietveld, P. Policy Analysis of Transport Networks, 1st ed.; Ashgate: Aldershot, UK, 2007; pp. 235–256. [Google Scholar]
- Dobruszkes, F. Does liberalisation of air transport imply increasing competition? Lessons from the European case. Transp. Policy 2009, 16, 29–39. [Google Scholar] [CrossRef]
- Harvey, G. Airport choice in a multiple airport region. Transp. Res. Part A Gen. 1987, 21, 439–449. [Google Scholar] [CrossRef]
- Pels, E.; Nijkamp, P.; Rietveld, P. Access to and competition between airports: A case study for the San Francisco Bay area. Transp. Res. Part A Policy Pract. 2003, 37, 71–83. [Google Scholar] [CrossRef]
- Hess, S.; Polak, J.W. Exploring the potential for cross-nesting structures in airport-choice analysis: A case-study of the Greater London area. Transp. Res. Part E Logist. Transp. Rev. 2006, 42, 63–81. [Google Scholar] [CrossRef] [Green Version]
- Lian, J.I.; Ronnevik, J. Airport competition—Regional airports losing ground to main airports. J. Transp. Geogr. 2011, 19, 85–92. [Google Scholar] [CrossRef]
- Yang, C.W.; Lu, J.L.; Hsu, C.Y. Modeling joint airport and route choice behavior for international and metropolitan airports. J. Air Transp. Manag. 2014, 39, 89–95. [Google Scholar] [CrossRef]
- Kim, A.M.; Ryerson, M.S. A long drive: Interregional airport passenger “leakage” in the U.S. Tour. Manag. 2018, 65, 237–244. [Google Scholar] [CrossRef]
- Jin, F.J. A study on network of domestic air passenger flow in China. Geogr. Res. 2001, 20, 31–39. [Google Scholar]
- Shaw, S.L.; Feng, L.; Chen, J.; Zhou, C. China’s airline consolidation and its effects on domestic airline networks and competition. J. Transp. Geogr. 2009, 17, 293–305. [Google Scholar] [CrossRef]
- Chang, Y.C.; Hsu, C.J.; Lin, J.R. A historic move—The opening of direct flights between Taiwan and China. J. Transp. Geogr. 2011, 19, 255–264. [Google Scholar] [CrossRef]
- Lin, J. Network analysis of China’s aviation system, statistical and spatial structure. J. Transp. Geogr. 2012, 22, 109–117. [Google Scholar] [CrossRef]
- Wang, J.E.; Mo, H.H.; Wang, F.H. Evolution of air transport network of China 1930–2012. J. Transp. Geogr. 2014, 40, 145–158. [Google Scholar] [CrossRef]
- Zhang, Q.; Yang, H.J.; Wang, Q.; Zhang, A.M. Market power and its determinants in the Chinese airline industry. Transp. Res. Part A Policy Pract. 2014, 64, 1–13. [Google Scholar] [CrossRef]
- Wang, J.E.; Wang, H.; Jiao, J.Y. China’s international aviation transport to the Belt and Road Initiative area. Prog. Geogr. 2015, 34, 554–562. [Google Scholar]
- Wang, J.E.; Bonilla, D.; Banister, D. Air deregulation in China and its impact on airline competition 1994–2012. J. Transp. Geogr. 2016, 50, 12–23. [Google Scholar] [CrossRef]
- Miller, R.A. Herfindahl–Hirschman Index as a market structure variable: An exposition for antitrust practitioners. Antitrust Bull 1982, 27, 593–618. [Google Scholar]
- Frenken, K.; Van Terwisga, S.; Verburg, T.; Burghouwt, G. Airline competition at European airports. Tijdschr. Voor Econ. En Soc. Geogr. 2004, 95, 233–242. [Google Scholar] [CrossRef]
- Frenken, K. Entropy statistics and information theory. In The Elgar Companion to Neo-Schumpeterian Economics, 1st ed.; Hanusch, H., Pyka, A., Eds.; Edward Elgar: Cheltenham, UK, 2007; Volume 1, pp. 544–556. [Google Scholar]
- Du, C.; Wang, J.E. Spatial pattern of China Southern Airlines’ network and its market coverage. Geogr. Res. 2015, 34, 1319–1330. [Google Scholar]
- Fuellhart, K.; O’Connor, K.; Woltemade, C. Route-level passenger variation within three multi-airport regions in the USA. J. Transp. Geogr. 2013, 31, 171–180. [Google Scholar] [CrossRef]
- Suzuki, Y.; Audino, M.J. The effect of airfares on airport leakage in single airport regions. Transp. J. 2003, 42, 31–41. [Google Scholar]
- Suzuki, Y.; Crum, M.R.; Audino, M.J. Airport leakage and airline pricing strategy in single-airport regions. Transp. Res. Part E Logist. Transp. Rev. 2004, 40, 19–37. [Google Scholar] [CrossRef]
- Brueckner, J.K.; Lee, D.; Singer, E.S. Airline competition and domestic US airfares: A comprehensive reappraisal. Econ. Transp. 2013, 2, 1–17. [Google Scholar] [CrossRef]
- Francis, G.; Fidato, A.; Humphreys, I. Airport–airline interaction: The impact of low-cost carriers on two European airports. J. Air Transp. Manag. 2003, 9, 267–273. [Google Scholar] [CrossRef]
- Dobruszkes, F. An analysis of European low-cost airlines and their networks. J. Transp. Geogr. 2006, 14, 249–264. [Google Scholar] [CrossRef]
- Pels, E.; Njegovan, N.; Behrens, C. Low-cost airlines and airport competition. Transp. Res. Part E Logist. Transp. Rev. 2009, 45, 335–344. [Google Scholar] [CrossRef]
- Suau-Sanchez, P.; Voltes Dorta, A. The role of London airports in providing connectivity for the UK: Regional dependence on foreign hubs. J. Transp. Geogr. 2016, 50, 94–104. [Google Scholar] [CrossRef]
- Dobruszkes, F.; Givoni, M.; Vowles, T. Hello major airports, goodbye regional airports? Recent changes in European and US low-cost airline airport choice. J. Air Transp. Manag. 2017, 59, 50–62. [Google Scholar] [CrossRef]
- Liu, Y. A study on zoning “new three macro-regional development zones” of regional economy of China. Acta Geogr. Sin. 2005, 60, 361–370. [Google Scholar]
- Chen, Z.H. Impacts of high-speed rail on domestic air transportation in China. J. Transp. Geogr. 2017, 62, 184–196. [Google Scholar] [CrossRef]
- Min, S.; Wei, X.L.; Liu, Y.Y.; Rui, Z.; Zhen, C.Z. Sustainability Development of High-Speed Rail and Airline—Understanding Passengers’ Preferences: A Case Study of the Beijing–Shanghai Corridor. Sustainability 2019, 11, 1352. [Google Scholar]
- Wu, J.S.; Liu, H.; Peng, J.; Ma, L. Hierarchical structure and spatial pattern of China’s urban system: Evidence from DMSP/OLS nightlight data. Acta Geogr. Sin. 2014, 69, 760–770. [Google Scholar]
- China National Tourism Administration (CNTA). The Yearbook of China Tourism Statistics (in Chinese); China Travel & Tourism Press: Beijing, China, 2018.
- Taylor, P.J.; Derudder, B. World City Network: A Global Urban Analysis, 2nd ed.; Routledge: New York, NY, USA, 2016; pp. 62–64. [Google Scholar]
- Wong, Y.H.; Choong, D. Global Destination Cities Index by MasterCard; MasterCard: New York, NY, USA, 2018; pp. 62–63. [Google Scholar]
Figure 1.
The Guangdong–Hong Kong–Macao Greater Bay Area multi-airport region (GBA-MAR).

Figure 2.
Domestic competitive air routes ().
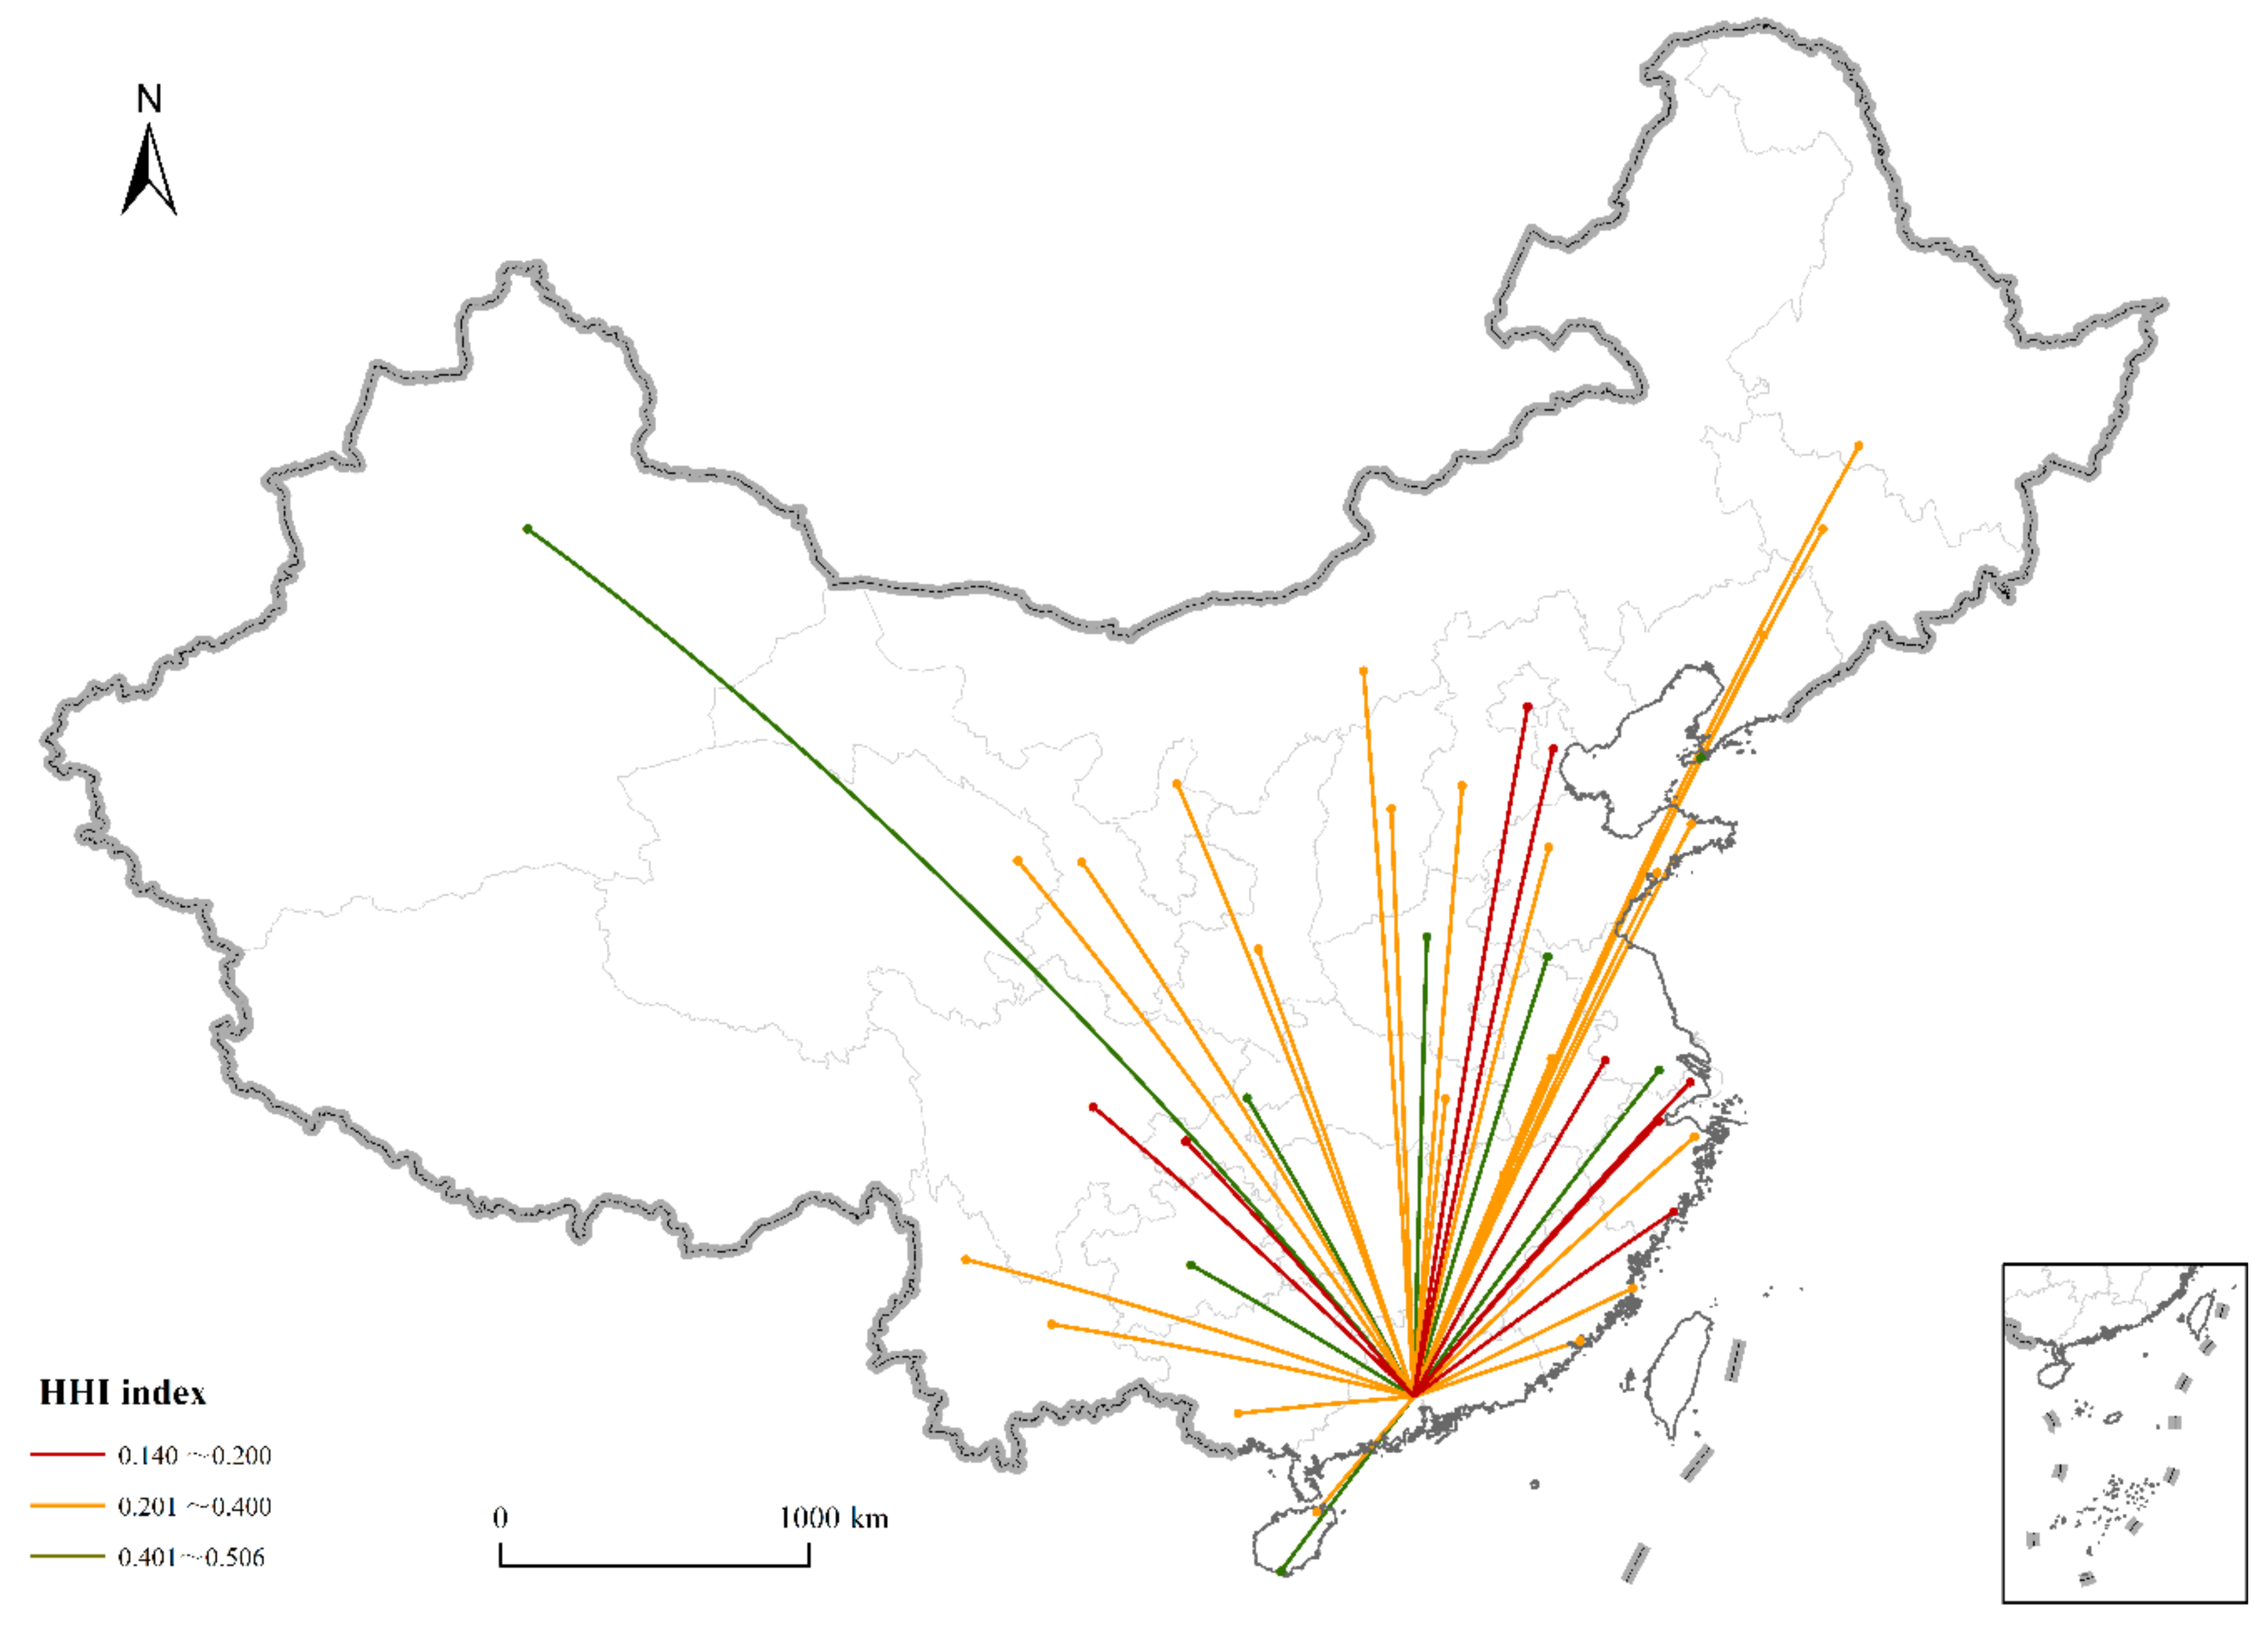
Figure 3.
International competitive air routes ().
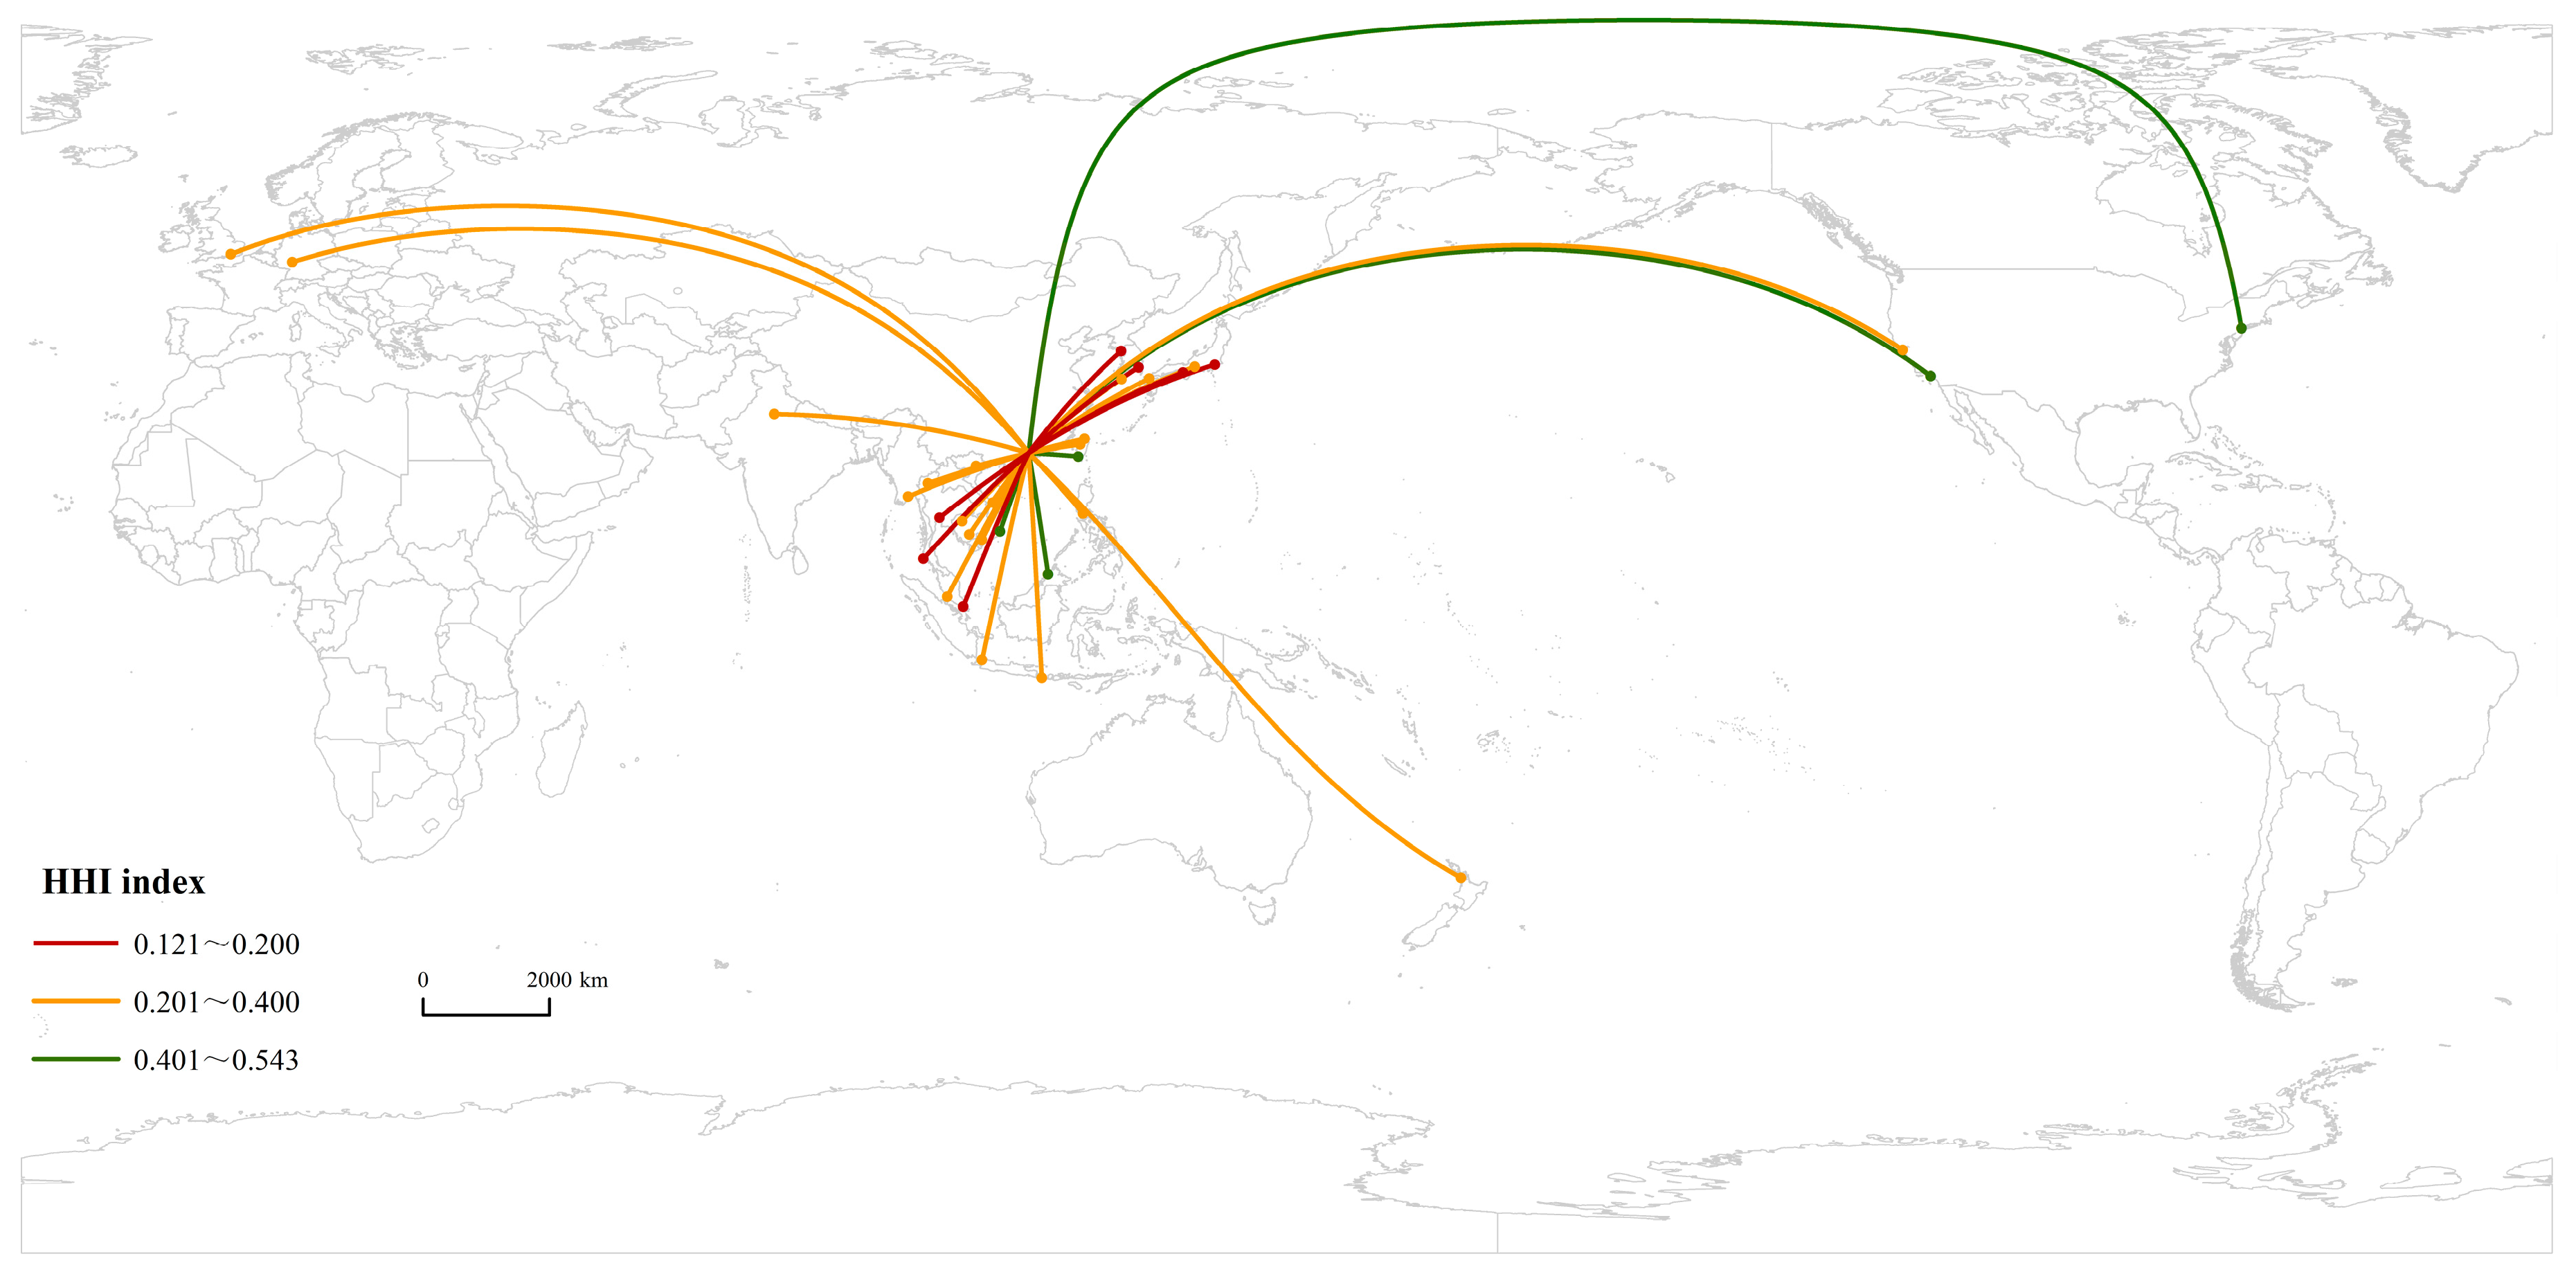
Figure 4.
Connections with important nodal cities in the domestic market of the GBA-MAR. Note: Codes for cities are in Appendix A.
Figure 4.
Connections with important nodal cities in the domestic market of the GBA-MAR. Note: Codes for cities are in Appendix A.
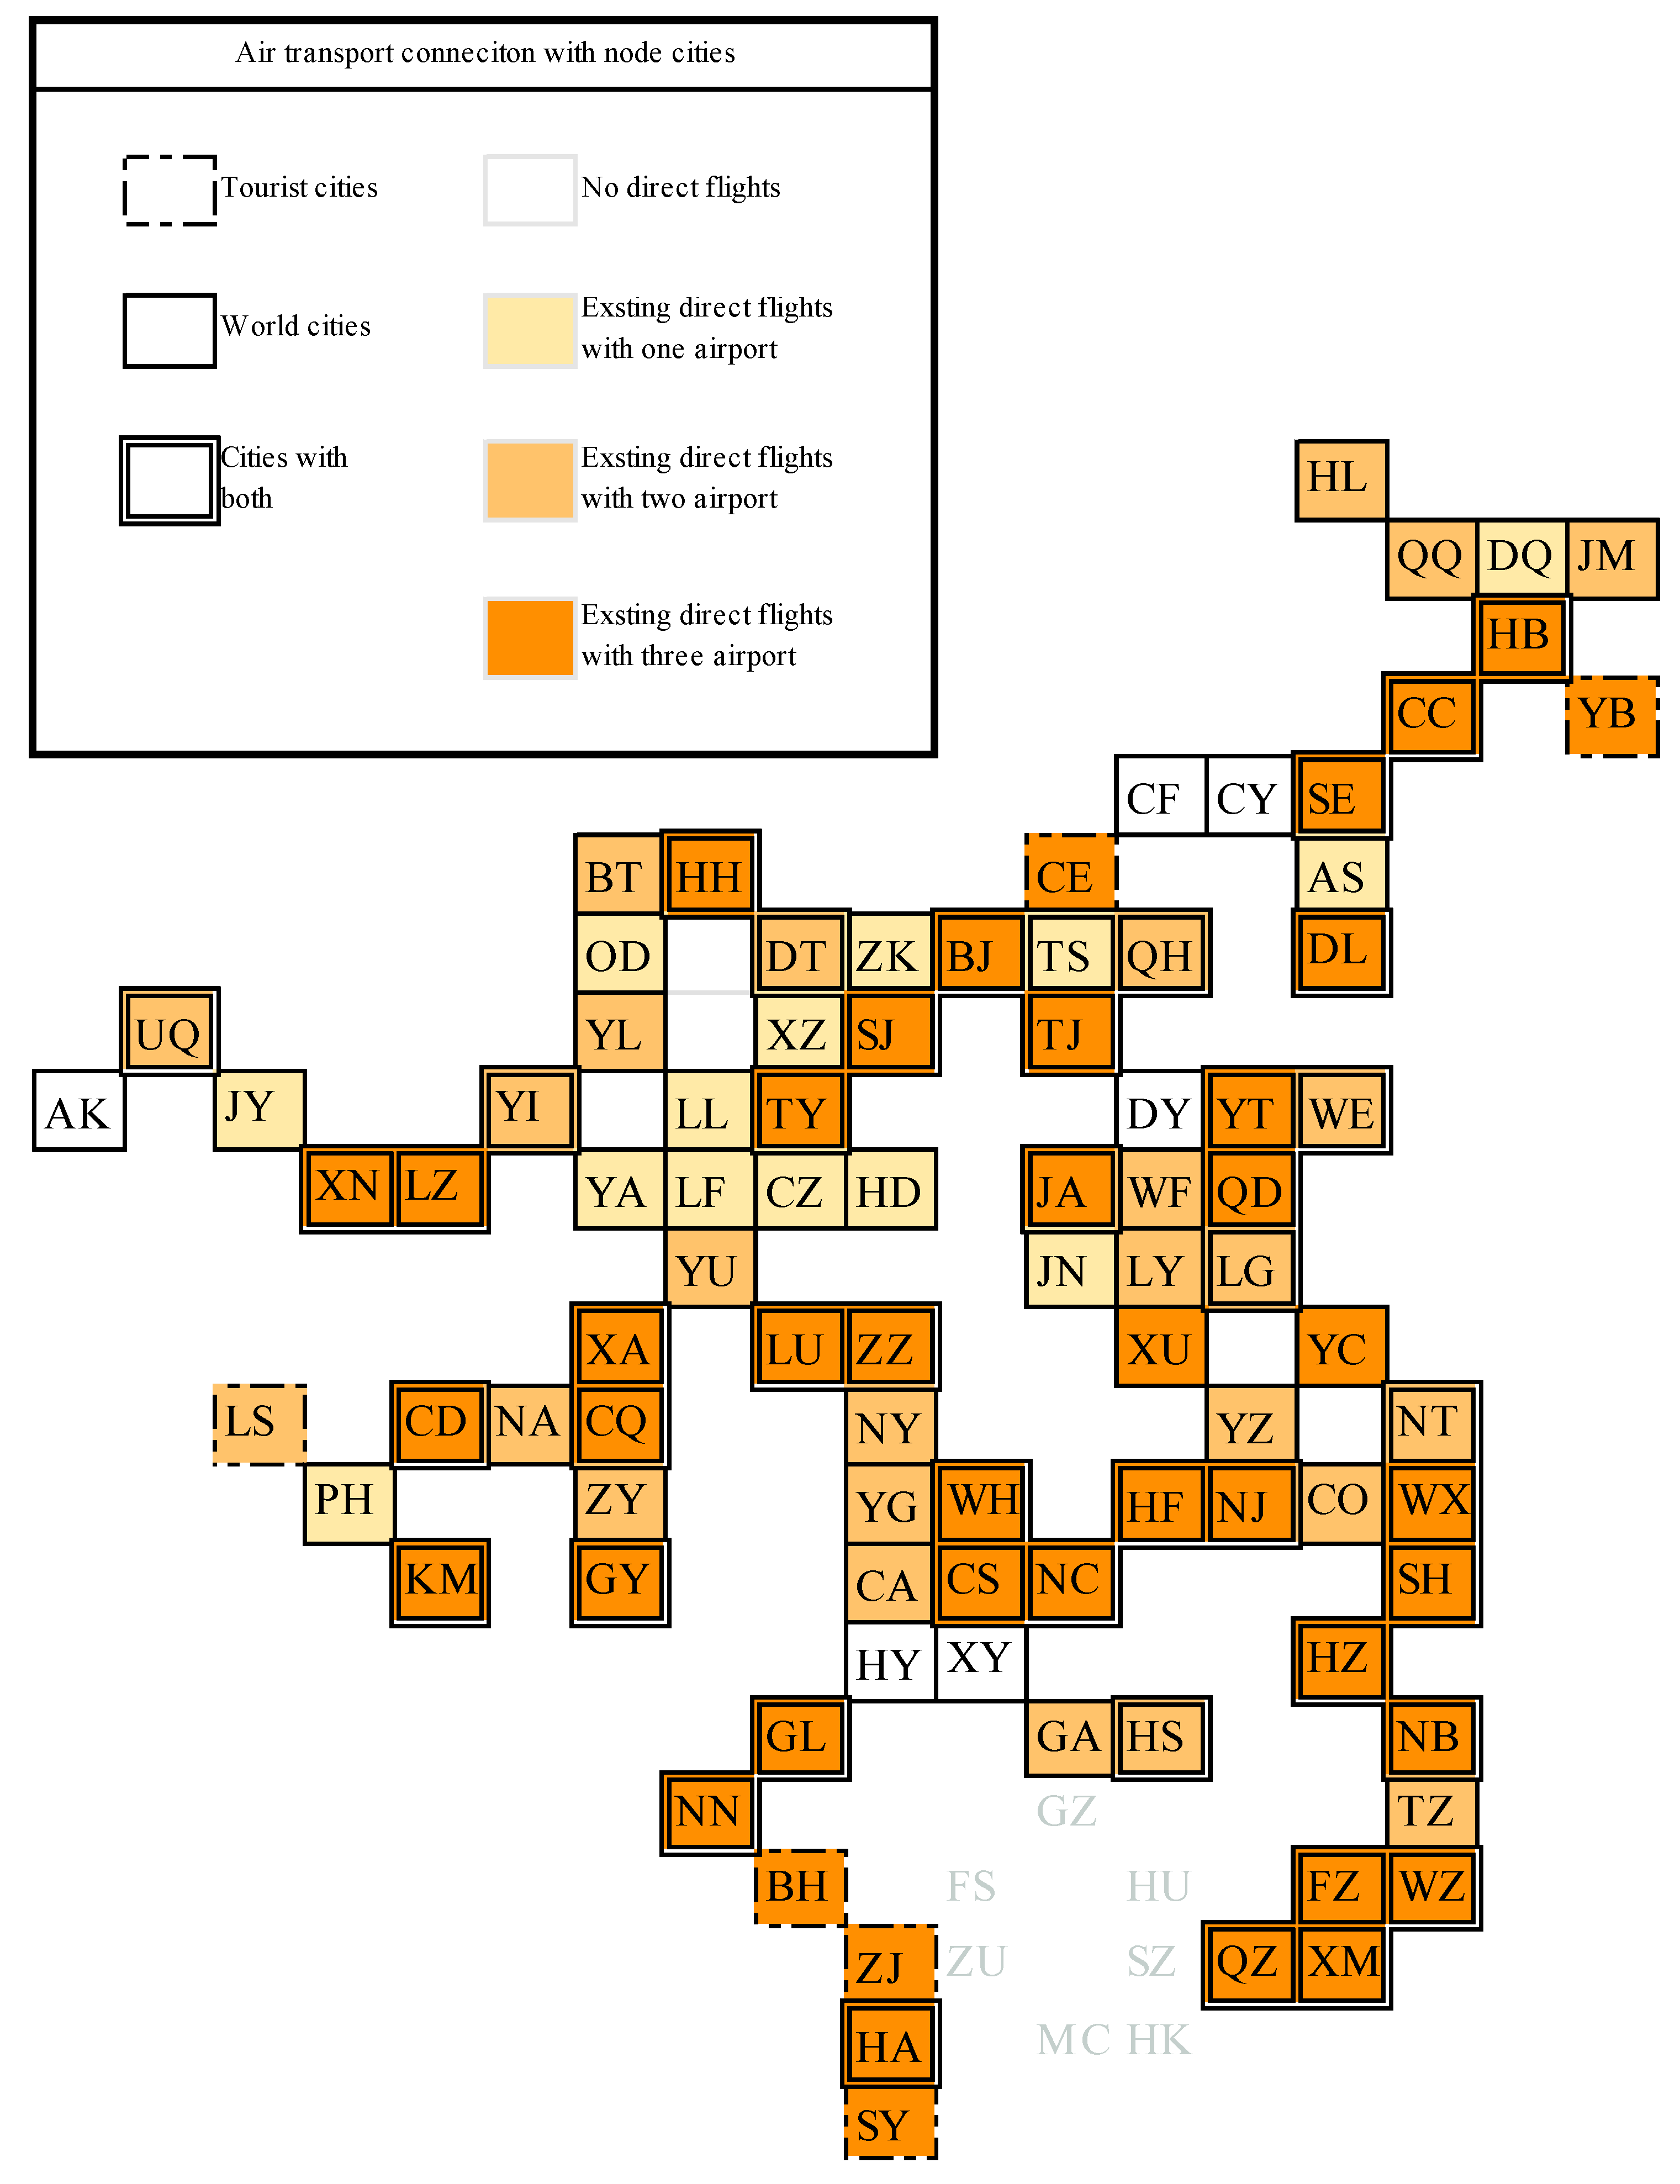
Figure 5.
Connections with important nodal cities in the international market of the GBA-MAR. Note: Codes for cities are in Appendix B.
Figure 5.
Connections with important nodal cities in the international market of the GBA-MAR. Note: Codes for cities are in Appendix B.

Table 1.
Distribution and traffic volume in the GBA-MAR in 2017.
| Airport | Passenger Enplanement (Millions) | Market Share Within | Distances (km) and Driving Times (min) | ||
|---|---|---|---|---|---|
| HKG | CAN | SZX | |||
| HKG | 72.0 | 35.8% | 195.2 km/151 min | 75.7 km/93 min | |
| CAN | 65.8 | 32.7% | 195.2 km/151 min | 131.3 km/100 min | |
| SZX | 45.6 | 22.7% | 75.7 km/93 min | 131.3 km/100 min | |
| Other airports | 17.8 | 8.8% | |||
| Total | 20,122.3 | 100% | |||
Note: HKG is the code for the Hong Kong International Airport, CAN is the code for the Guangzhou Baiyun International Airport, and SZX is the code for the Shenzhen Bao’an International Airport.
Table 2.
The overlapping air transport markets of the GBA-MAR in 2017.
| Type | Domestic Market | International Market | ||
|---|---|---|---|---|
| Routes | Flight | Routes | Flight | |
| Monopoly | 42 | 1.9% | 85 | 9.7% |
| HKG | 61 | 8.7% | ||
| CAN | 33 | 1.5% | 22 | 1.0% |
| SZX | 9 | 0.4% | 2 | 0.0% |
| Duopoly | 60 | 11.3% | 37 | 26.5% |
| CAN–HKG | 5 | 1.0% | 36 | 26.3% |
| SZX–HKG | 1 | 0.2% | ||
| CAN–SZX | 55 | 10.4% | ||
| Tripoly | 46 | 86.8% | 24 | 63.8% |
| Total | 148 | 100.0% | 146 | 100.0% |
Note: The codes for the airports are in Table 1.
Table 3.
Airline competition for the domestic air transport market in the GBA-MAR in 2017.
| Type | Monopoly Airport Operation | Duopoly Airport Operation | Tripoly Airport Operation | Total | ||||
|---|---|---|---|---|---|---|---|---|
| Routes | Flights | Routes | Flights | Routes | Flights | Routes | Flights | |
| One airline | 40 | 1.8% | 22 | 3.7% | 1 | 0.5% | 63 | 6.0% |
| CZ | 19 | 0.9% | 15 | 2.8% | 1 | 0.5% | 35 | 4.2% |
| KA | ||||||||
| ZH | 3 | 0.2% | 2 | 0.2% | 5 | 0.4% | ||
| LCC | 1 | 0.0% | 1 | 0.0% | ||||
| Two airlines | 2 | 0.1% | 33 | 4.9% | 2 | 0.7% | 37 | 5.7% |
| CZ | 2 | 0.0% | 22 | 1.7% | 1 | 0.1% | 25 | 1.8% |
| KA | 1 | 0.1% | 1 | 0.1% | ||||
| ZH | 12 | 1.6% | 1 | 0.3% | 13 | 1.9% | ||
| LCC | 6 | 0.3% | 6 | 0.3% | ||||
| Three airlines | 3 | 0.9% | 6 | 1.9% | 9 | 2.8% | ||
| CZ | 3 | 0.3% | 5 | 1.2% | 8 | 1.5% | ||
| KA | 1 | 0.1% | 1 | 0.1% | ||||
| ZH | 3 | 0.4% | 2 | 0.1% | 5 | 0.5% | ||
| LCC | 2 | 0.1% | 2 | 0.1% | ||||
| More than three airlines | 2 | 1.8% | 37 | 83.6% | 39 | 85.4% | ||
| CZ | 2 | 1.0% | 36 | 26.6% | 38 | 27.6% | ||
| KA | 17 | 4.2% | 17 | 4.2% | ||||
| ZH | 2 | 0.2% | 35 | 12.7% | 37 | 12.9% | ||
| LCC | 1 | 0.1% | 33 | 3.9% | 34 | 4.0% | ||
| Total | 42 | 1.9% | 60 | 11.3% | 46 | 86.8% | 148 | 100.0% |
| CZ | 21 | 0.9% | 42 | 5.8% | 43 | 28.4% | 106 | 35.1% |
| KA | 0 | 0.0% | 0 | 0.0% | 19 | 4.4% | 19 | 4.4% |
| ZH | 3 | 0.2% | 19 | 2.4% | 38 | 13.1% | 60 | 15.7% |
| LCC | 1 | 0.0% | 7 | 0.4% | 35 | 4.0% | 43 | 4.4% |
Note: CZ is the code for China Southern Airlines, ZH is the code for Shenzhen Airlines, and KA is the code for Cathay Dragon; LCC represents low-cost airlines.
Table 4.
Airline competition in the international air transport market in the GBA-MAR in 2017.
| Type | One Airport | Two Airports | Three Airports | Total | ||||
|---|---|---|---|---|---|---|---|---|
| Routes | Flights | Routes | Flights | Routes | Flights | Routes | Flights | |
| One airline | 67 | 5.1% | 5 | 1.2% | 72 | 6.4% | ||
| CX | 9 | 1.3% | 9 | 1.3% | ||||
| CZ | 5 | 0.2% | 5 | 0.2% | ||||
| ZH | 1 | 0.0% | 1 | 0.0% | ||||
| LCC | 10 | 0.4% | 10 | 0.4% | ||||
| 0 | 0.0% | |||||||
| Two airlines | 14 | 2.7% | 11 | 3.4% | 25 | 6.1% | ||
| CX | 5 | 1.0% | 6 | 0.9% | 11 | 1.9% | ||
| CZ | 6 | 0.7% | 6 | 0.7% | ||||
| ZH | 0 | 0.0% | ||||||
| LCC | 6 | 0.6% | 6 | 0.6% | ||||
| 0 | 0.0% | |||||||
| Three airlines | 4 | 1.9% | 10 | 6.1% | 2 | 3.2% | 16 | 11.1% |
| CX | 2 | 0.5% | 6 | 2.2% | 2 | 1.2% | 10 | 3.9% |
| CZ | 9 | 1.6% | 2 | 0.8% | 11 | 2.4% | ||
| ZH | 0 | 0.0% | ||||||
| LCC | 2 | 0.1% | 1 | 0.2% | 3 | 0.3% | ||
| 0 | 0.0% | |||||||
| More than three airlines | 11 | 15.8% | 22 | 60.6% | 33 | 76.4% | ||
| CX | 7 | 4.9% | 13 | 13.7% | 20 | 18.6% | ||
| CZ | 11 | 3.0% | 19 | 8.2% | 30 | 11.2% | ||
| ZH | 9 | 2.0% | 9 | 2.0% | ||||
| LCC | 7 | 2.1% | 15 | 11.2% | 22 | 13.3% | ||
| 0 | 0.0% | |||||||
| Total | 85 | 9.7% | 37 | 26.5% | 24 | 63.8% | 146 | 100.0% |
| CX | 16 | 2.8% | 19 | 8.0% | 15 | 14.9% | 50 | 25.7% |
| CZ | 5 | 0.2% | 26 | 5.3% | 21 | 9.0% | 52 | 14.5% |
| ZH | 1 | 0.0% | 0 | 0.0% | 9 | 2.0% | 10 | 2.0% |
| LCC | 18 | 1.1% | 8 | 2.3% | 15 | 11.2% | 41 | 14.6% |
Note: CX is the code for Cathay Pacific Airways Limited, which is the largest base airline in HKG for the international market. Note: The codes for other airlines are in Table 3.
Table 5.
Competition for the domestic air transport market of the GBA-MAR to/from three Chinese regions in 2017. HHI: the Herfindahl–Hirschman Index.
Table 5.
Competition for the domestic air transport market of the GBA-MAR to/from three Chinese regions in 2017. HHI: the Herfindahl–Hirschman Index.
| Airport Operation Type | Northeast and East Coastal Region | Middle and Near-Reach-West Region | Far-Reach-West Region | Total | ||||||||
|---|---|---|---|---|---|---|---|---|---|---|---|---|
| Flights (Routes) | Avg. Carrier | Avg. HHI | Flights (Routes) | Avg. Carrier | Avg. HHI | Flights (Routes) | Avg. Carrier | Avg. HHI | Flights (Routes) | Avg. Carrier | Avg. HHI | |
| Monopoly | 0.8% (13) | 1 | 1.000 | 1.0% (25) | 1 | 0.974 | 0.1% (4) | 1 | 1.000 | 1.9% (42) | 1 | 0.984 |
| Duopoly | 3.5% (20) | 2 | 0.735 | 6.2% (34) | 2 | 0.765 | 1.7% (6) | 3 | 0.510 | 11.3% (60) | 2 | 0.729 |
| Tripoly | 57.0% (26) | 6 | 0.345 | 28.6% (18) | 6 | 0.332 | 1.2% (2) | 5 | 0.278 | 86.8% (46) | 6 | 0.337 |
| Total | 61.2% (59) | 4 | 0.621 | 35.8% (77) | 3 | 0.732 | 3.0% (26) | 3 | 0.635 | 100.0% (148) | 3 | 0.680 |
Table 6.
Competition for the international air transport market of the GBA-MAR to/from worldwide regions in 2017.
Table 6.
Competition for the international air transport market of the GBA-MAR to/from worldwide regions in 2017.
| Airport Operation Type | North America | Africa | Europe | Asia-Pacific | Middle East | Total | ||||||||||||
|---|---|---|---|---|---|---|---|---|---|---|---|---|---|---|---|---|---|---|
| Flights (Routes) | Avg. Carrier | Avg. HHI | Flights (Routes) | Avg. Carrier | Avg. HHI | Flights (Routes) | Avg. Carrier | Avg. HHI | Flights (Routes) | Avg. Carrier | Avg. HHI | Flights (Routes) | Avg. Carrier | Avg. HHI | Flights (Routes) | Avg. Carrier | Avg. HHI | |
| Monopoly | 0.9% (6) | 1 | 0.917 | 0.4% (3) | 1 | 0.833 | 1.4% (13) | 1 | 0.924 | 6.1% (53) | 1 | 0.914 | 1.0% (10) | 1 | 0.951 | 9.7% (85) | 1 | 0.917 |
| Duopoly | 4.1% (5) | 3 | 0.474 | 0.8% (3) | 1 | 0.893 | 4.3% (6) | 3 | 0.525 | 16.1% (19) | 4 | 0.408 | 1.3% (4) | 2 | 0.857 | 26.5% (37) | 3 | 0.524 |
| Tripoly | 1.3% (1) | 4 | 0.408 | 0.5% (1) | 4 | 0.309 | 60.4% (21) | 7 | 0.284 | 1.5% (2) | 3 | 0.409 | 63.8% (24) | 6 | 0.295 | |||
| Total | 6.3% (12) | 2 | 0.690 | 1.2% (6) | 1 | 0.863 | 6.1% (20) | 2 | 0.774 | 82.6% (93) | 3 | 0.669 | 3.8% (15) | 1 | 0.890 | 100.0% (146) | 3 | 0.715 |
Table 7.
Regression results for route level passenger ratios at airports in the PRD region.
| Effect | CAN–HKG | SZX–CAN | SZX–HKG | |||
|---|---|---|---|---|---|---|
| Coefficient (t) | Coefficient (t) | Coefficient (t) | ||||
| Avg. fare | −0.620 | (−2.897) | −0.182 | (−0.649) | −0.216 | (−0.791) |
| HHI | −0.417 | (−1.679) *** | −0.154 | (−0.496) | −0.386 | (−1.419) |
| Car driving time | −0.455 | (−1.307) * | −1.247 | (−2.147) * | −0.086 | (−0.358) |
| Flights | 0.807 | (9.638) *** | 0.553 | (3.895) *** | 0.696 | (8.407) *** |
| Dummy GND | −0.096 | (−0.345) | −0.691 | (−2.062) ** | −0.197 | (−0.635) |
| Dummy GJD | −0.180 | (−0.458) | 0.317 | (0.776) | −0.194 | (−0.380) |
| Dummy GJC | −0.288 | (−0.887) | 0.121 | (0.354) | −0.632 | (−1.719) |
| Constant | 1.409 | (1.255) | 3.582 | (1.901) ** | 0.534 | (0.307) * |
| Number of observations | 83 | 51 | 49 | |||
| Adjusted R2 | 0.827 | 0.445 | 0.888 | |||
*** Significance levels of 1%; ** significance levels of 5%; * significance levels of 10%.
© 2019 by the authors. Licensee MDPI, Basel, Switzerland. This article is an open access article distributed under the terms and conditions of the Creative Commons Attribution (CC BY) license (http://creativecommons.org/licenses/by/4.0/).
Share and Cite
MDPI and ACS Style
Liao, W.; Cao, X.; Li, S. Competition and Sustainability Development of a Multi-Airport Region: A Case Study of the Guangdong–Hong Kong–Macao Greater Bay Area. Sustainability 2019, 11, 2958. https://doi.org/10.3390/su11102958
AMA Style
Liao W, Cao X, Li S. Competition and Sustainability Development of a Multi-Airport Region: A Case Study of the Guangdong–Hong Kong–Macao Greater Bay Area. Sustainability. 2019; 11(10):2958. https://doi.org/10.3390/su11102958
Chicago/Turabian StyleLiao, Wang, Xiaoshu Cao, and Shengchao Li. 2019. "Competition and Sustainability Development of a Multi-Airport Region: A Case Study of the Guangdong–Hong Kong–Macao Greater Bay Area" Sustainability 11, no. 10: 2958. https://doi.org/10.3390/su11102958
Note that from the first issue of 2016, this journal uses article numbers instead of page numbers. See further details here.