The Effects of Plants on Pollutant Removal, Clogging, and Bacterial Community Structure in Palm Mulch-Based Vertical Flow Constructed Wetlands

 ,
,
Abstract
:1. Introduction
2. Material and Methods
2.1. Location of Constructed Wetland and Sampling
2.2. Analytical Methods
2.2.1. Water Analysis
2.2.2. Molecular Method
DNA Isolation
T-RFLP Analysis
2.3. Statistics
2.3.1. Chemical and Microbiological Analysis
2.3.2. T-RFLP Analysis
3. Results and Discussion
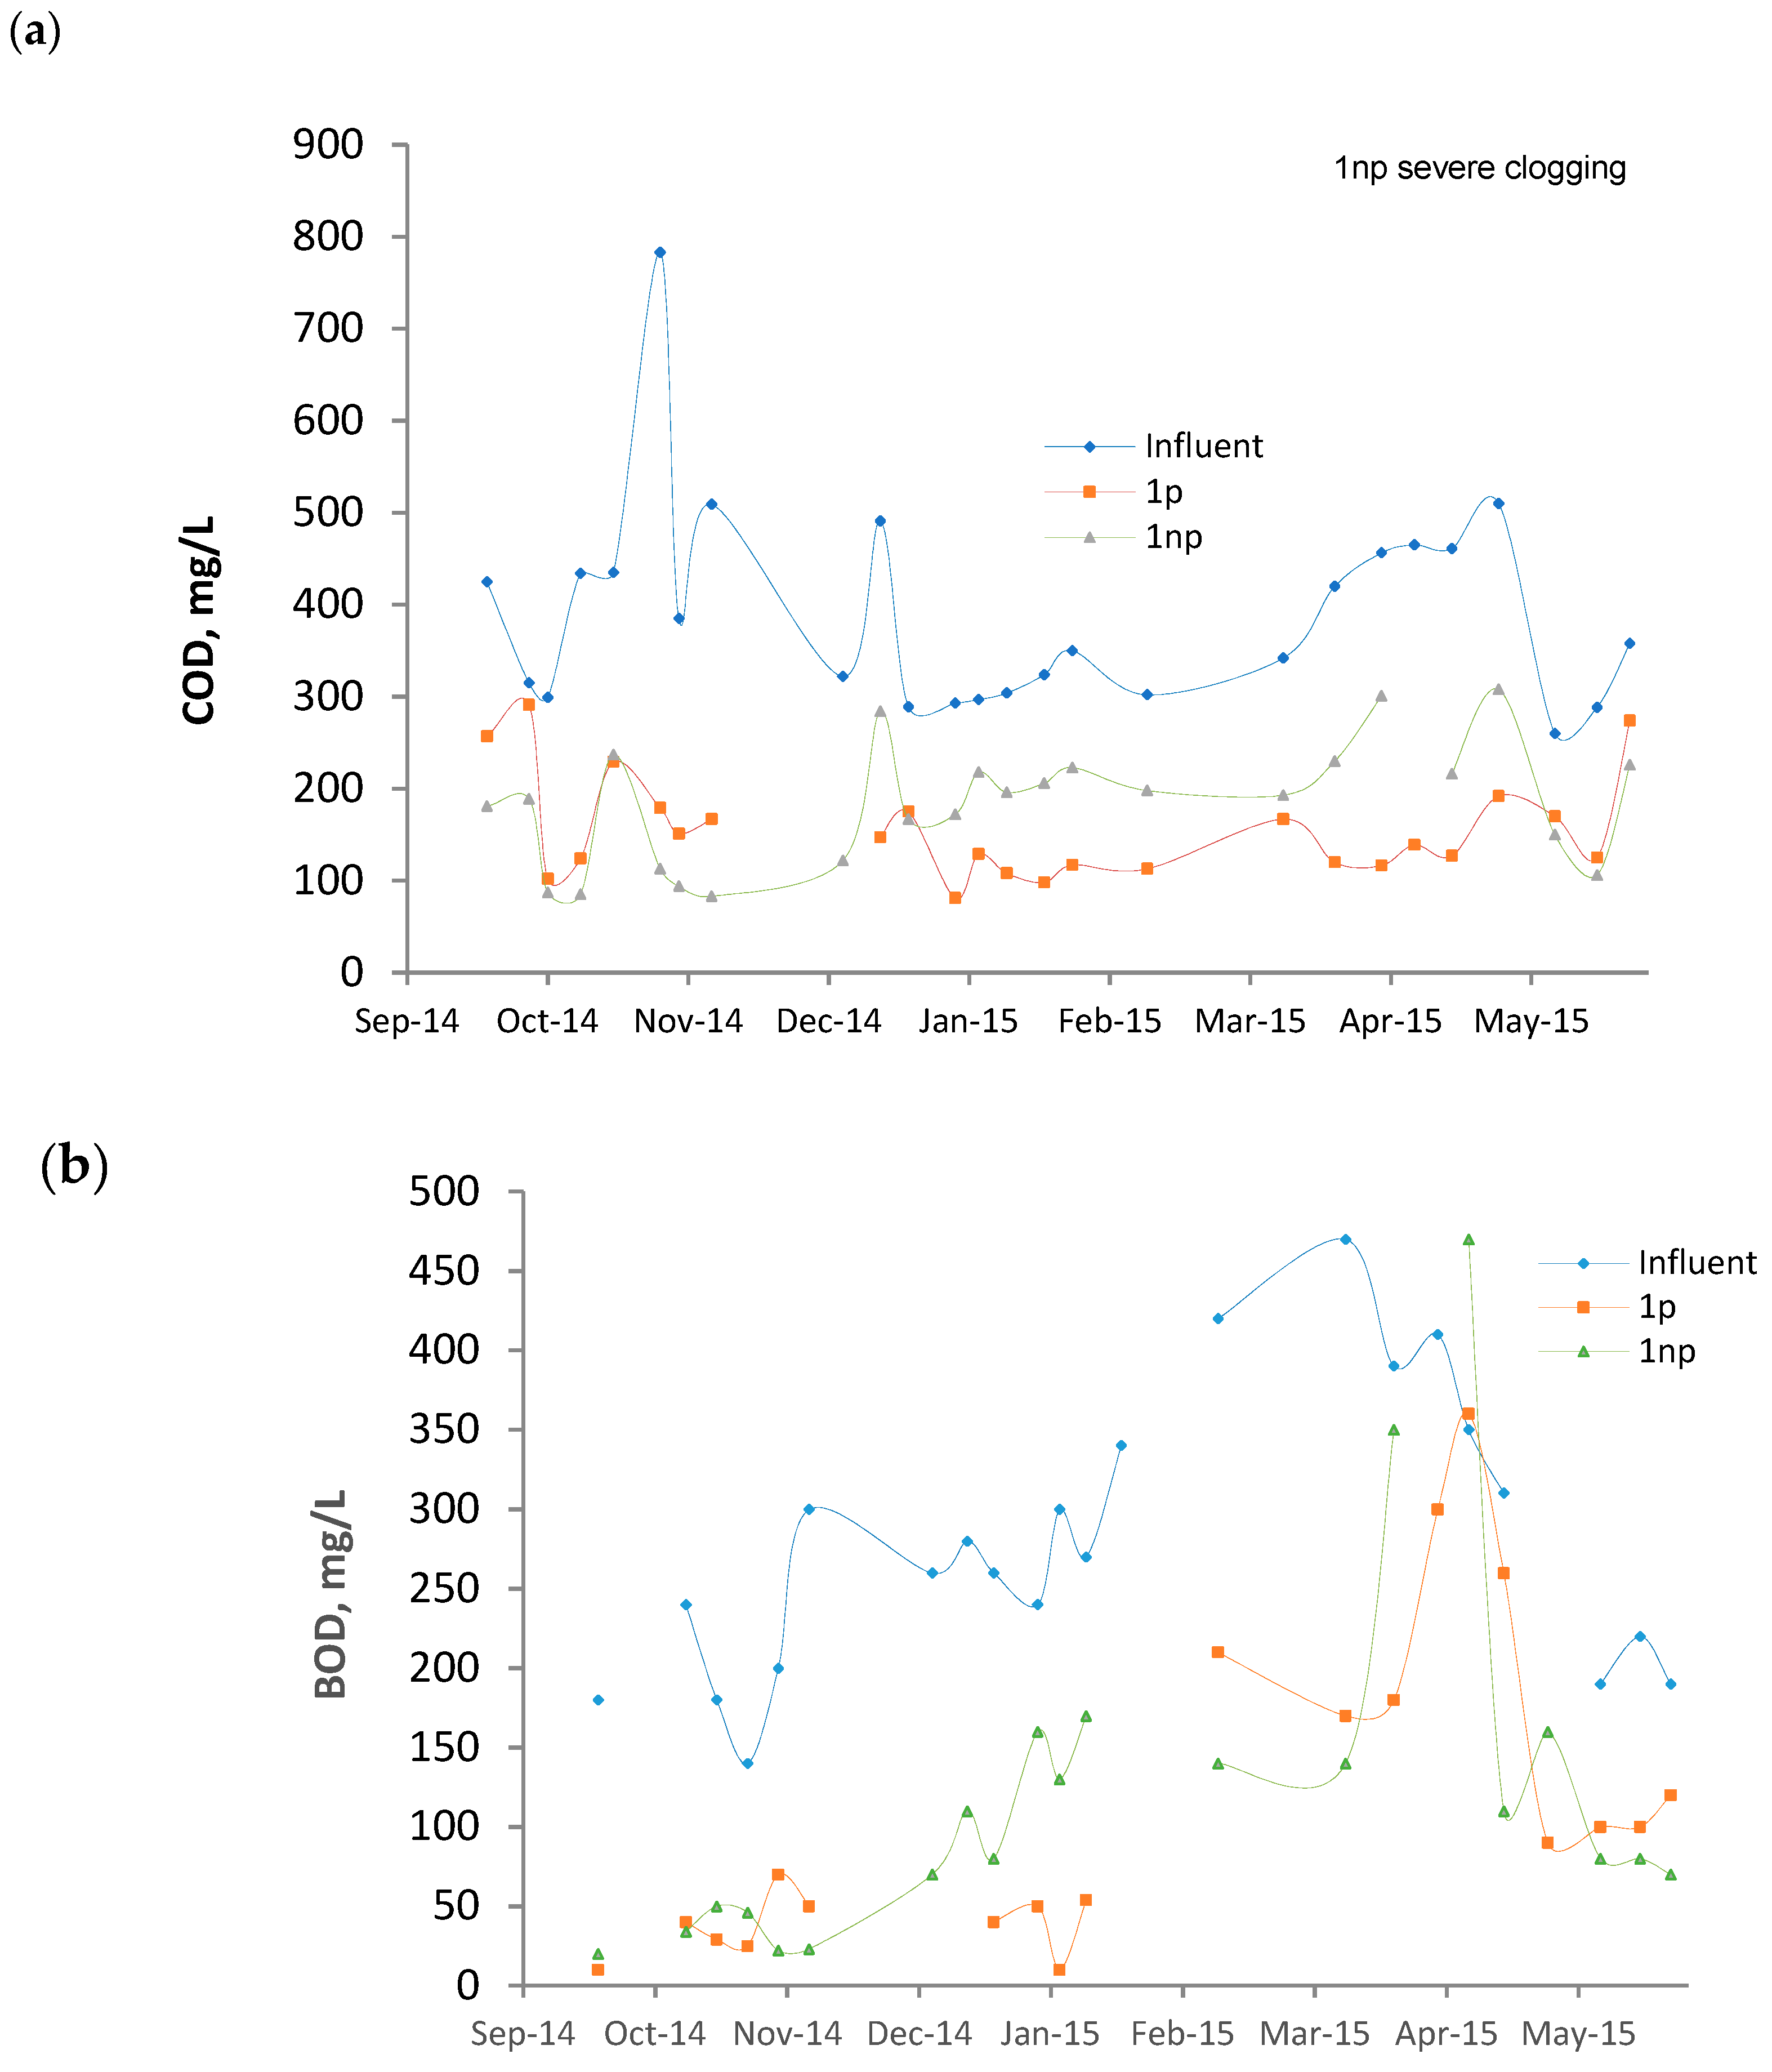
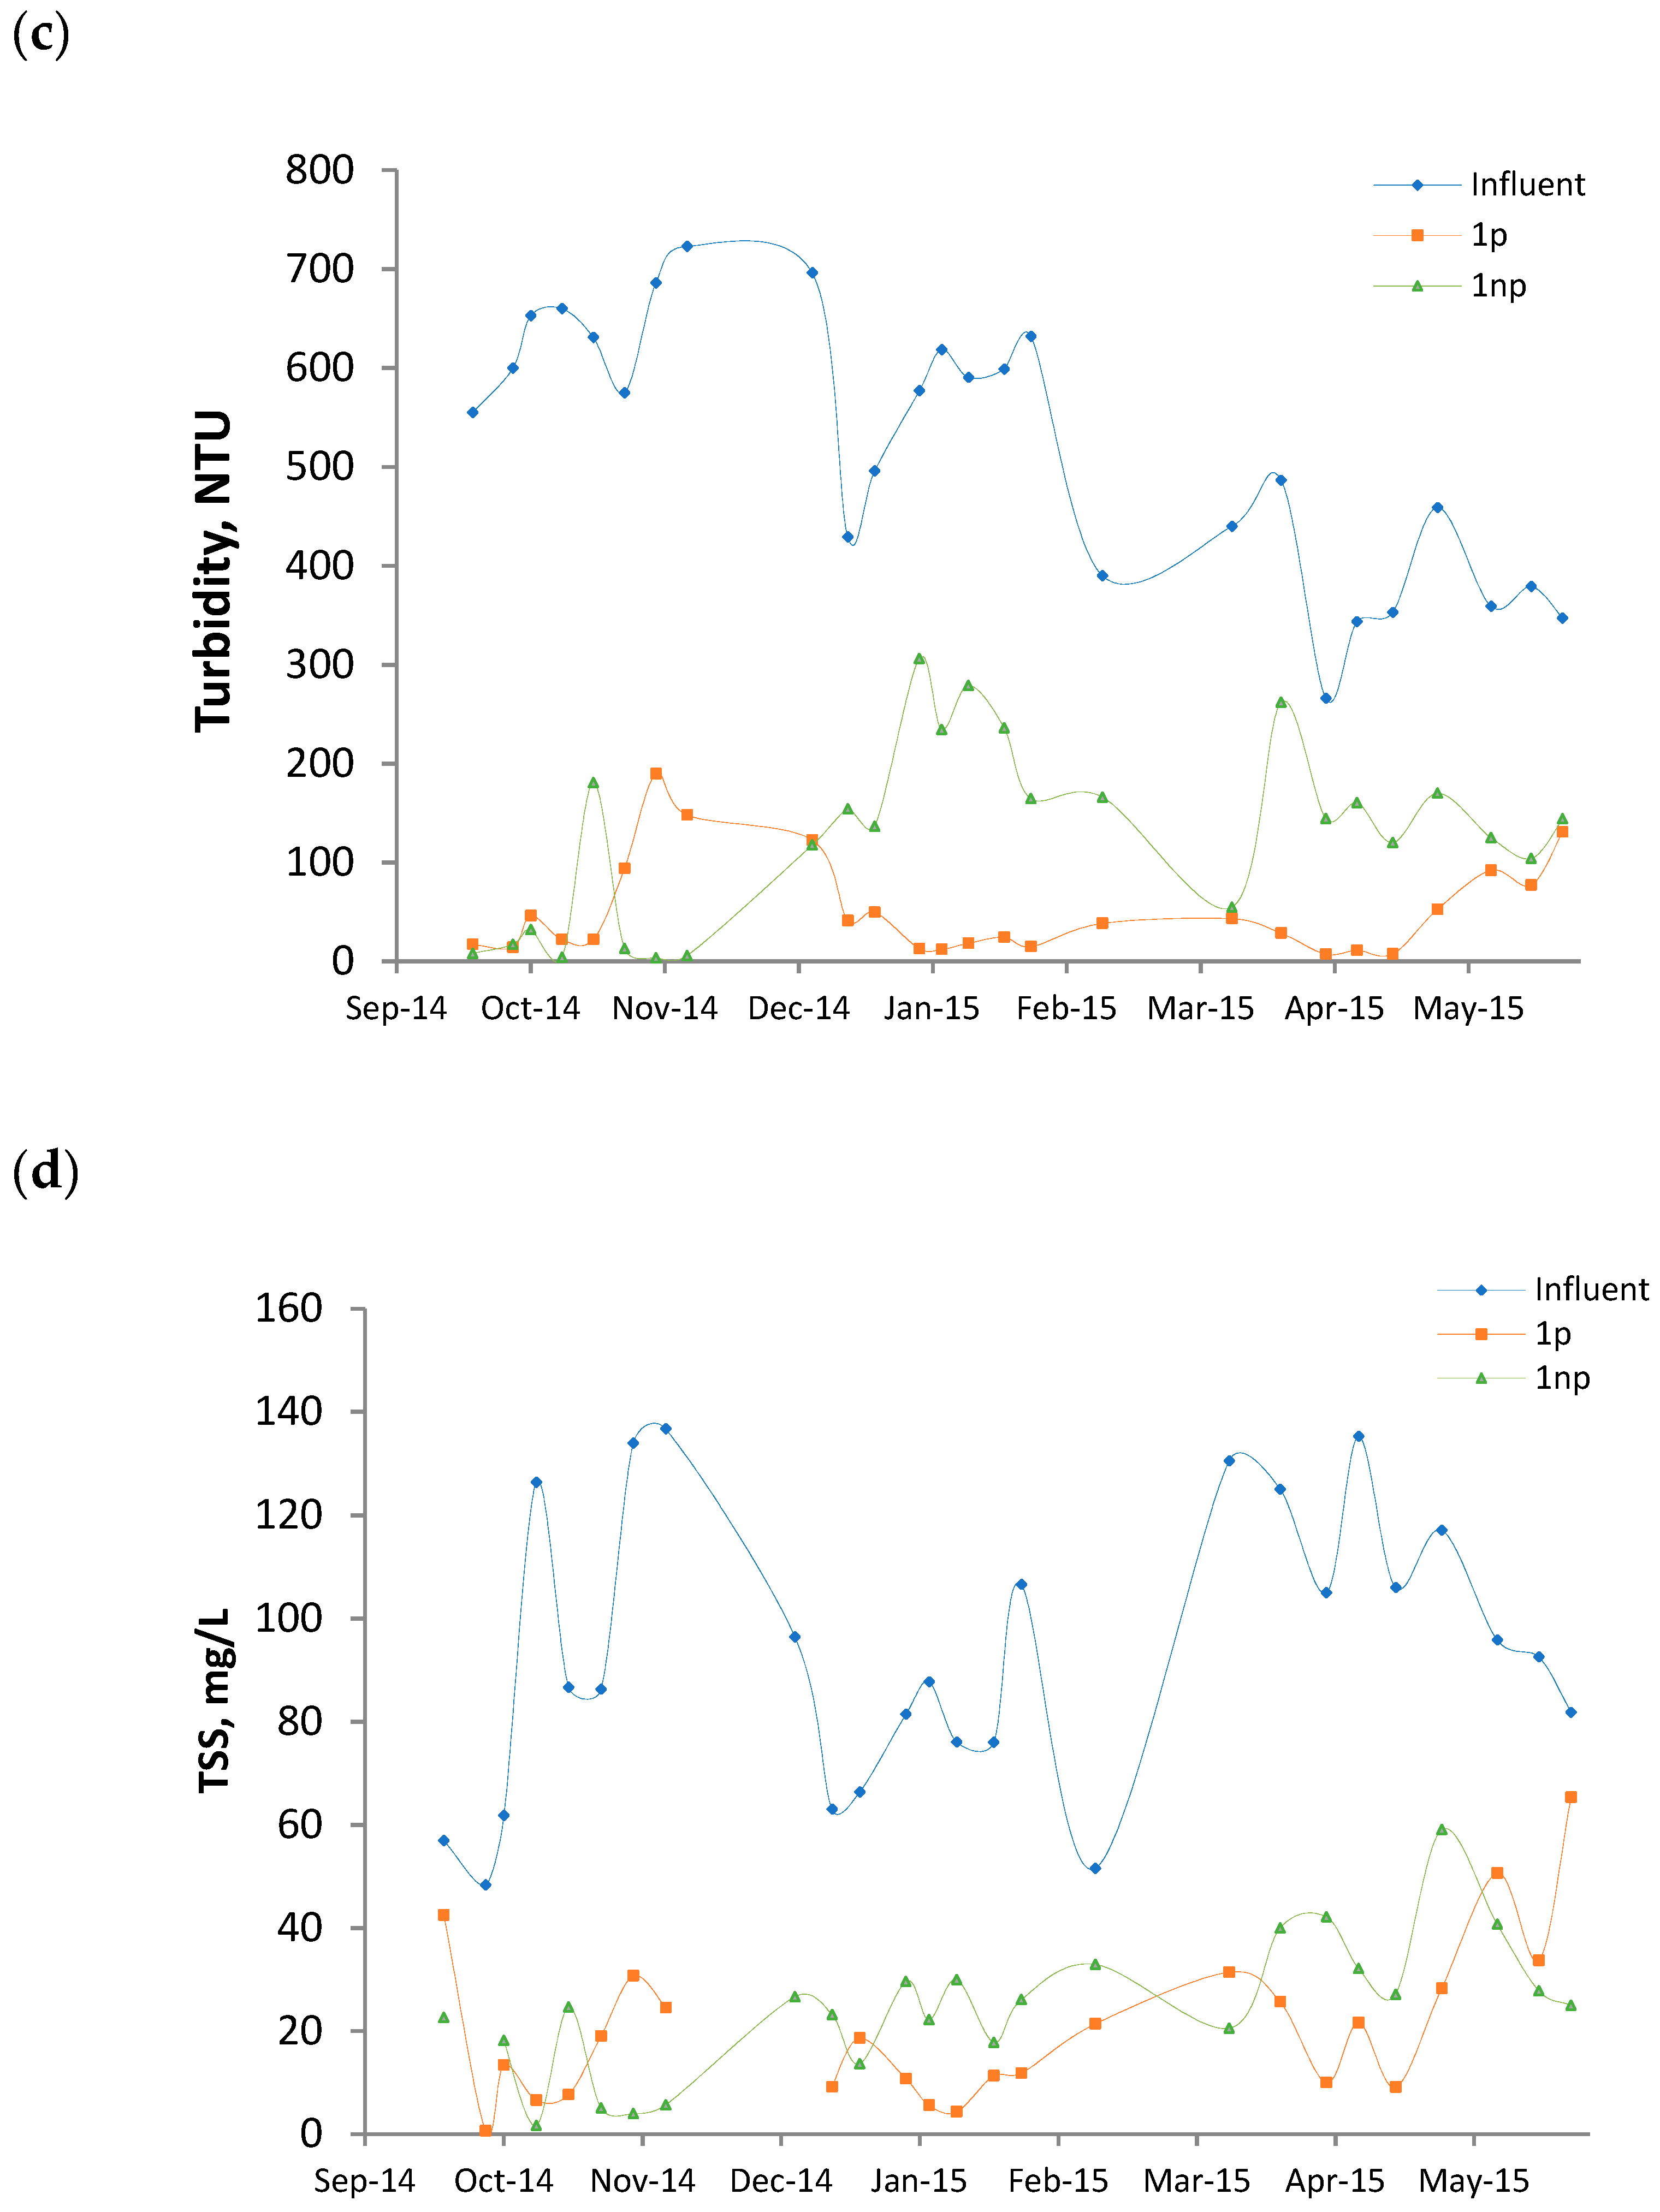
3.1. Features of the Influent
3.2. Average Surface Loading Rates and Removals
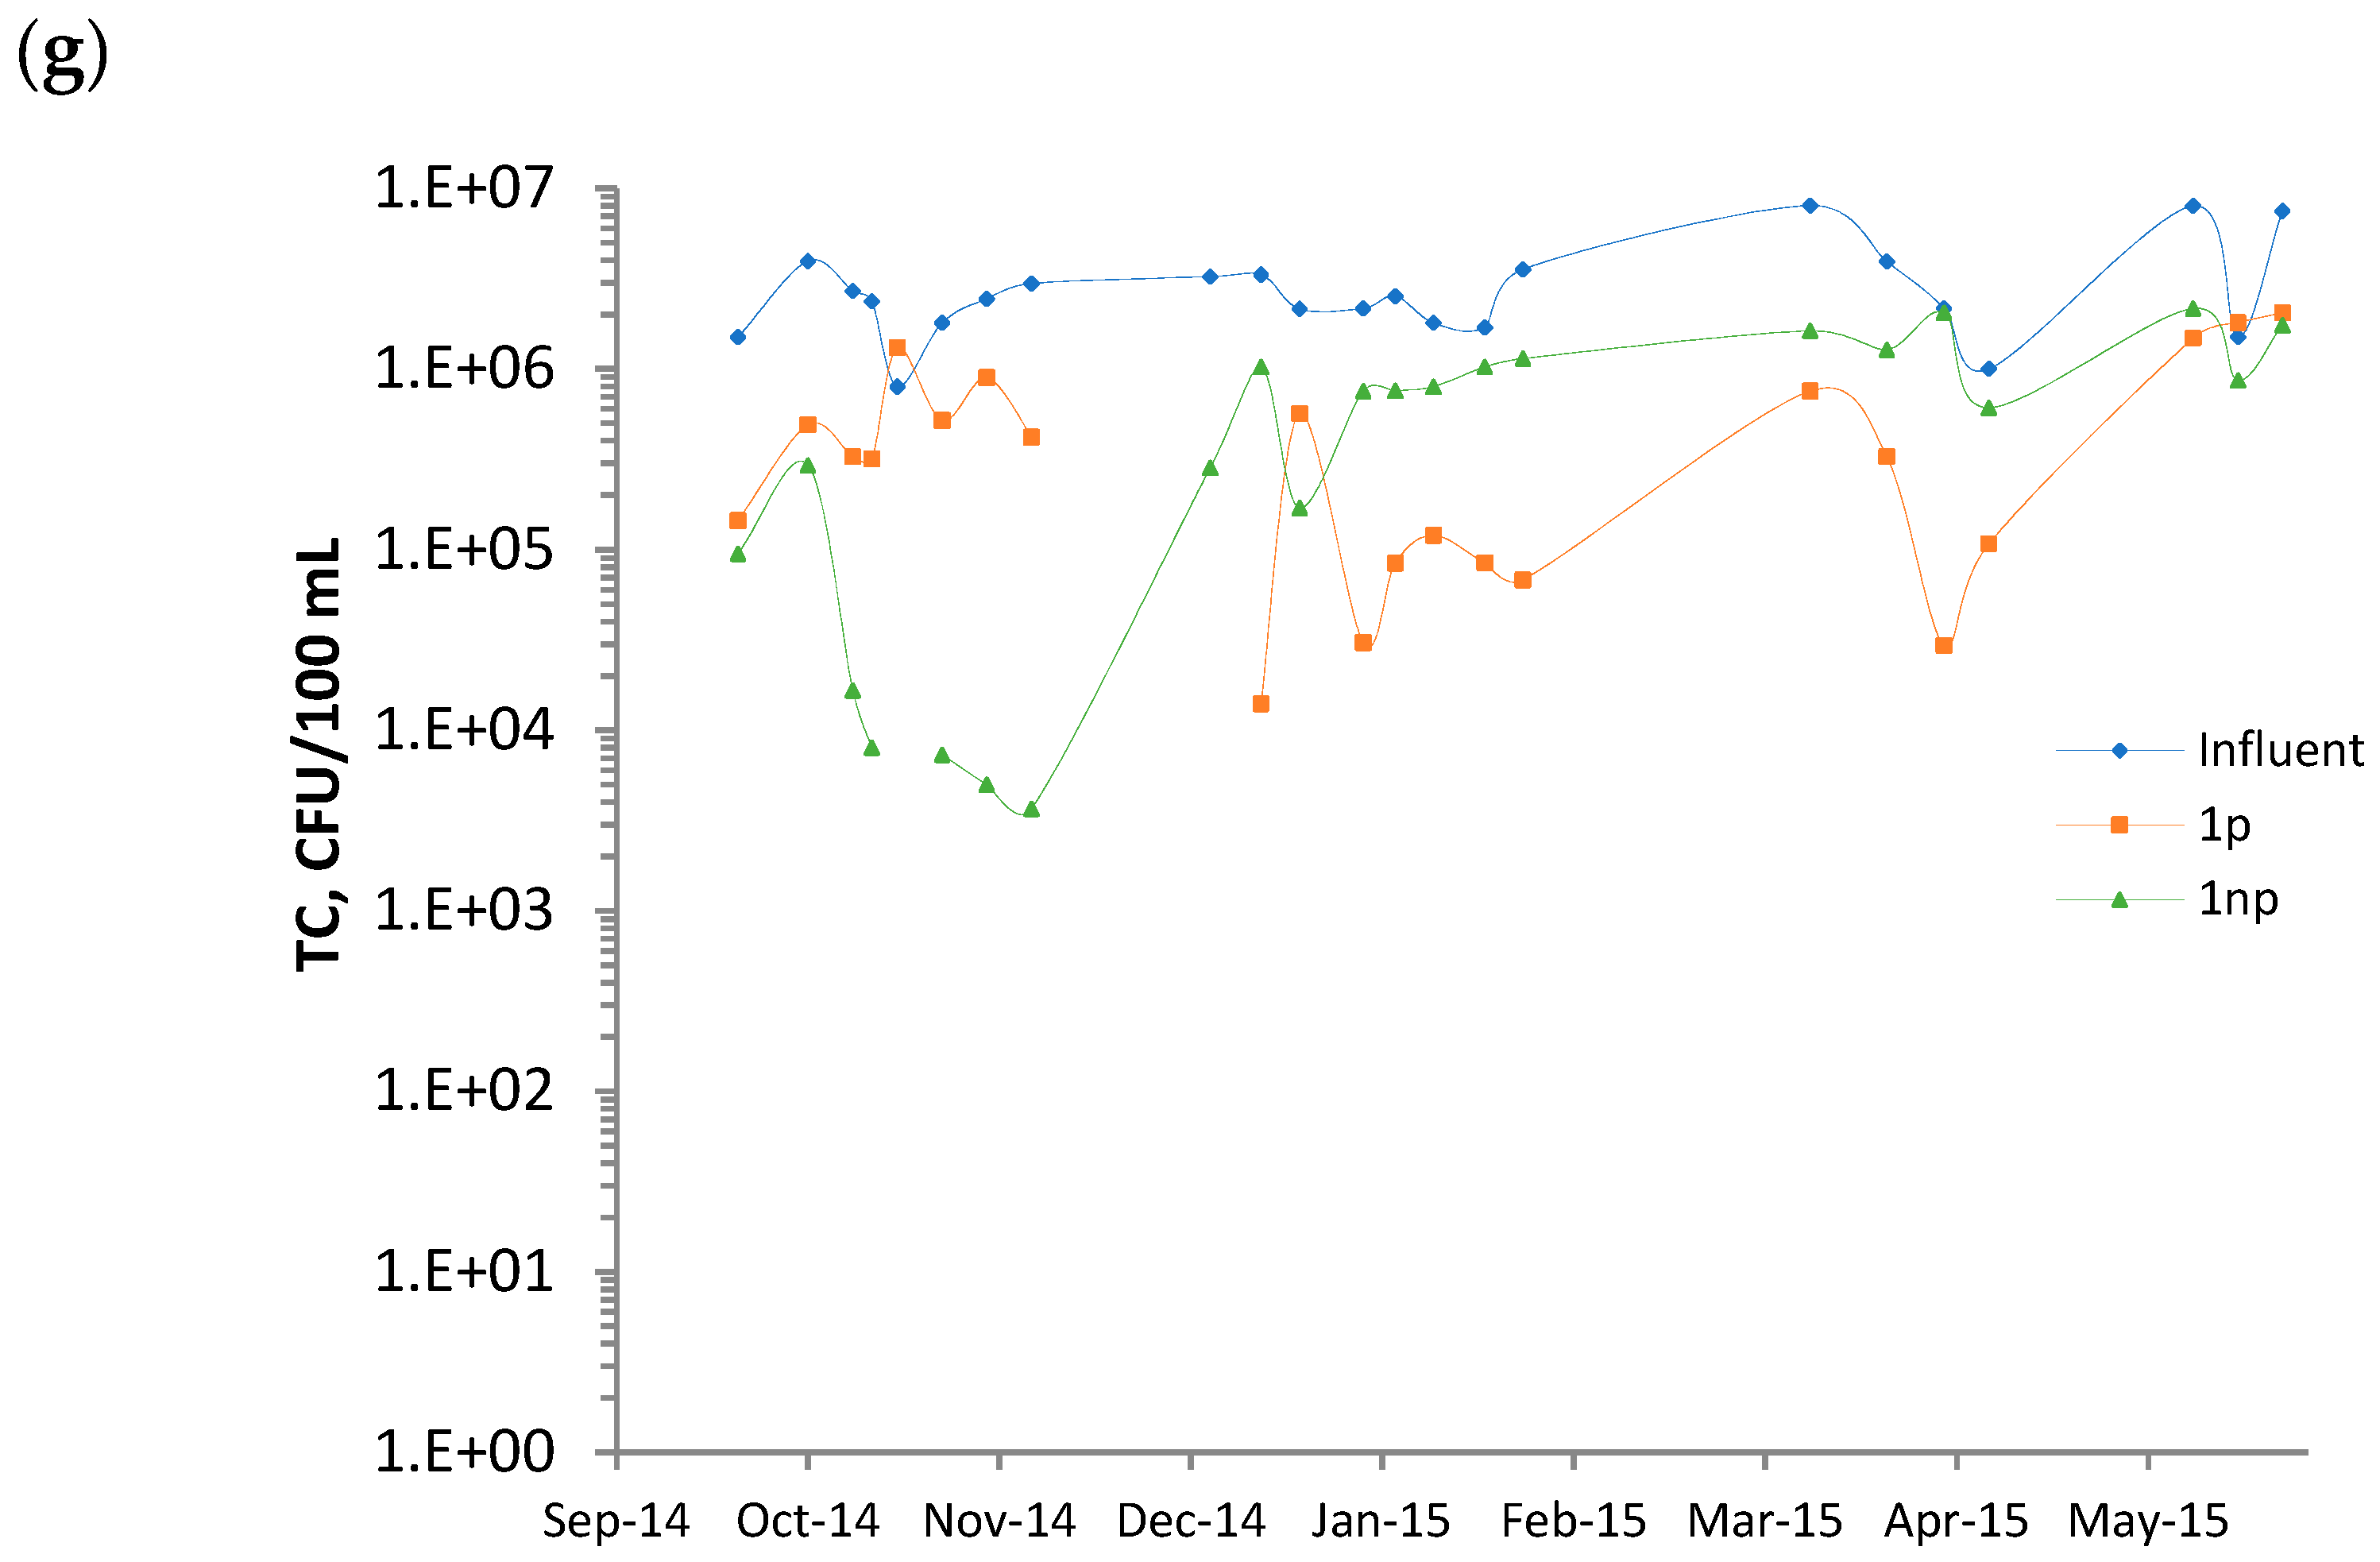
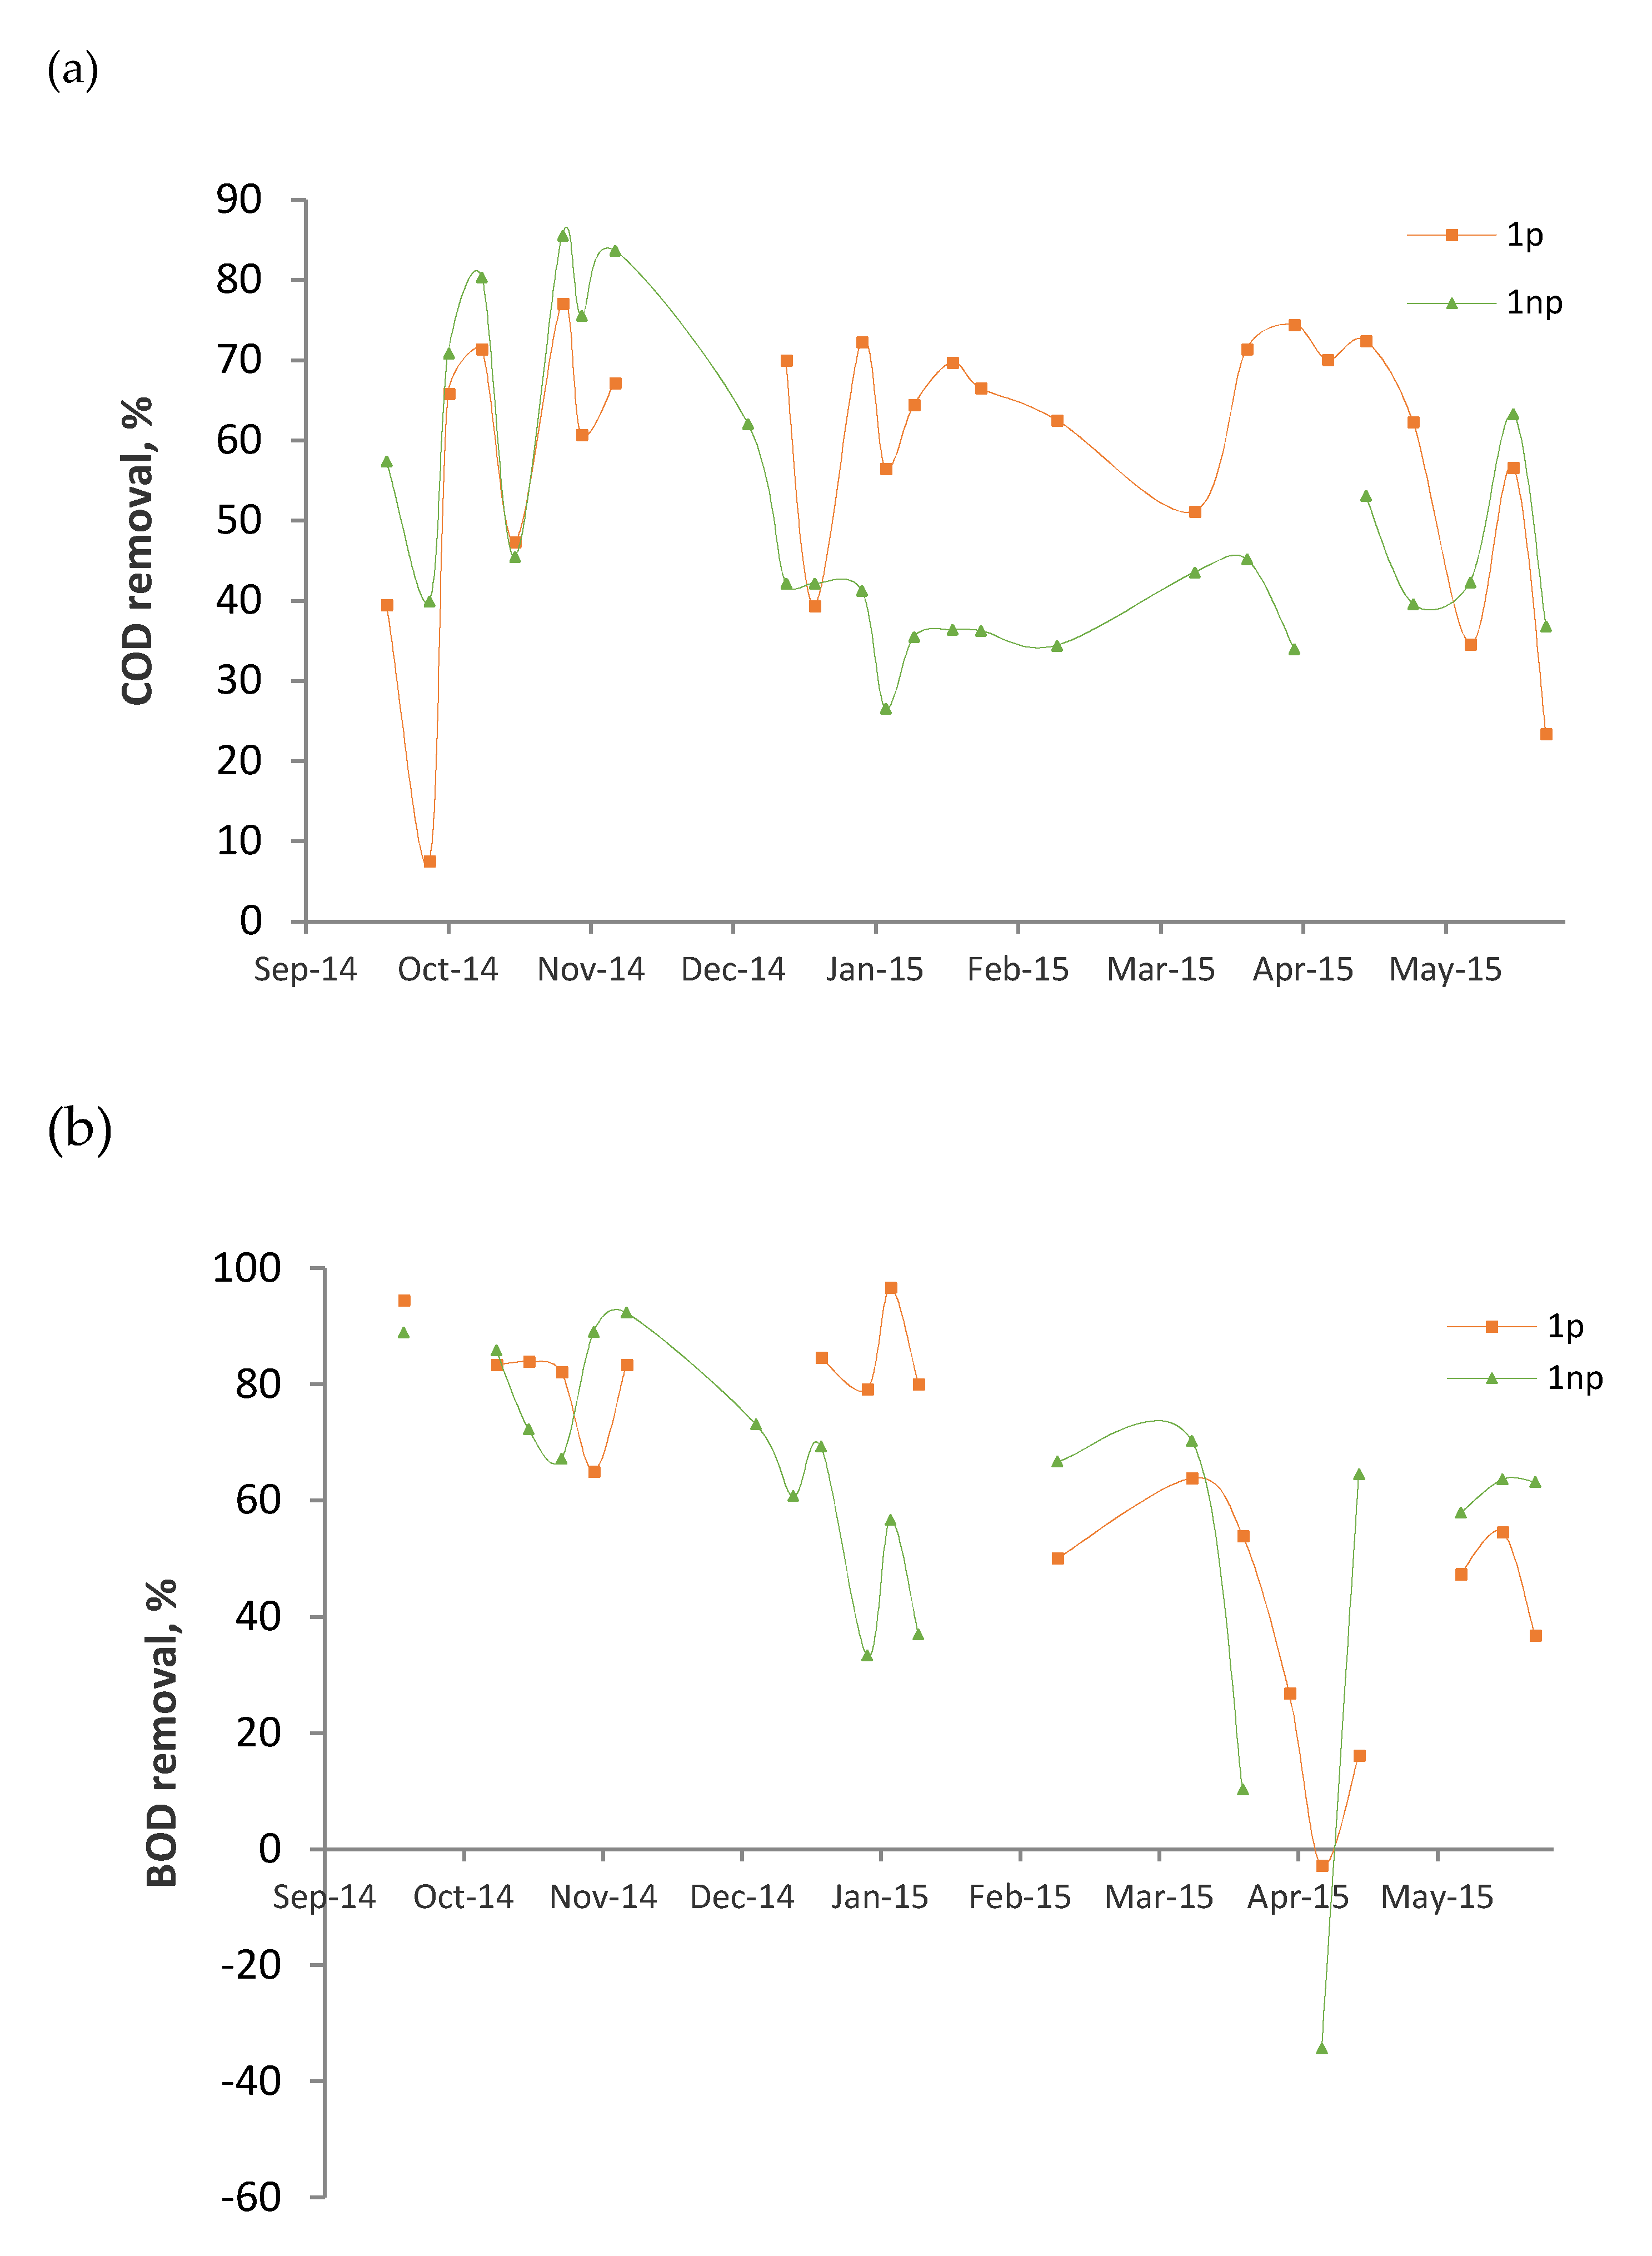
3.3. Performance Evolution of the Wetlands
- (i)
- The mulch employed was not fully stable. Although the analyses were made 1 year after the construction of the beds, the results indicate that the substrate was not fully stabilized. The palm branch is basically composed of a central rachis on which leaflets and spines are inserted. Once the branch is dead, the leaflets degrade relatively fast and release color, organic matter, and ions. Hence, their presence in palm mulch for CW substrate should be minimized.
- (ii)
- The average surface loadings were relatively high (BOD: 59–62 g/m2d, TSS: 18–22 g/m2d, Table 2).
- (iii)
- The reactors were in continuous operation without any rest period. In a survey of 169 full-scale VF CWs treating raw domestic wastewater, Paing et al. [5] claimed that the nominal BOD load calculated on the first stage was generally 40–50 g/m2d, which is a similar value to that applied in this study. However, the success of the French system is partially justified by the good aeration of the substrate. This was achieved by different measures that include the application of rest periods, allowing the sludge accumulated on the surface to become mineralized.
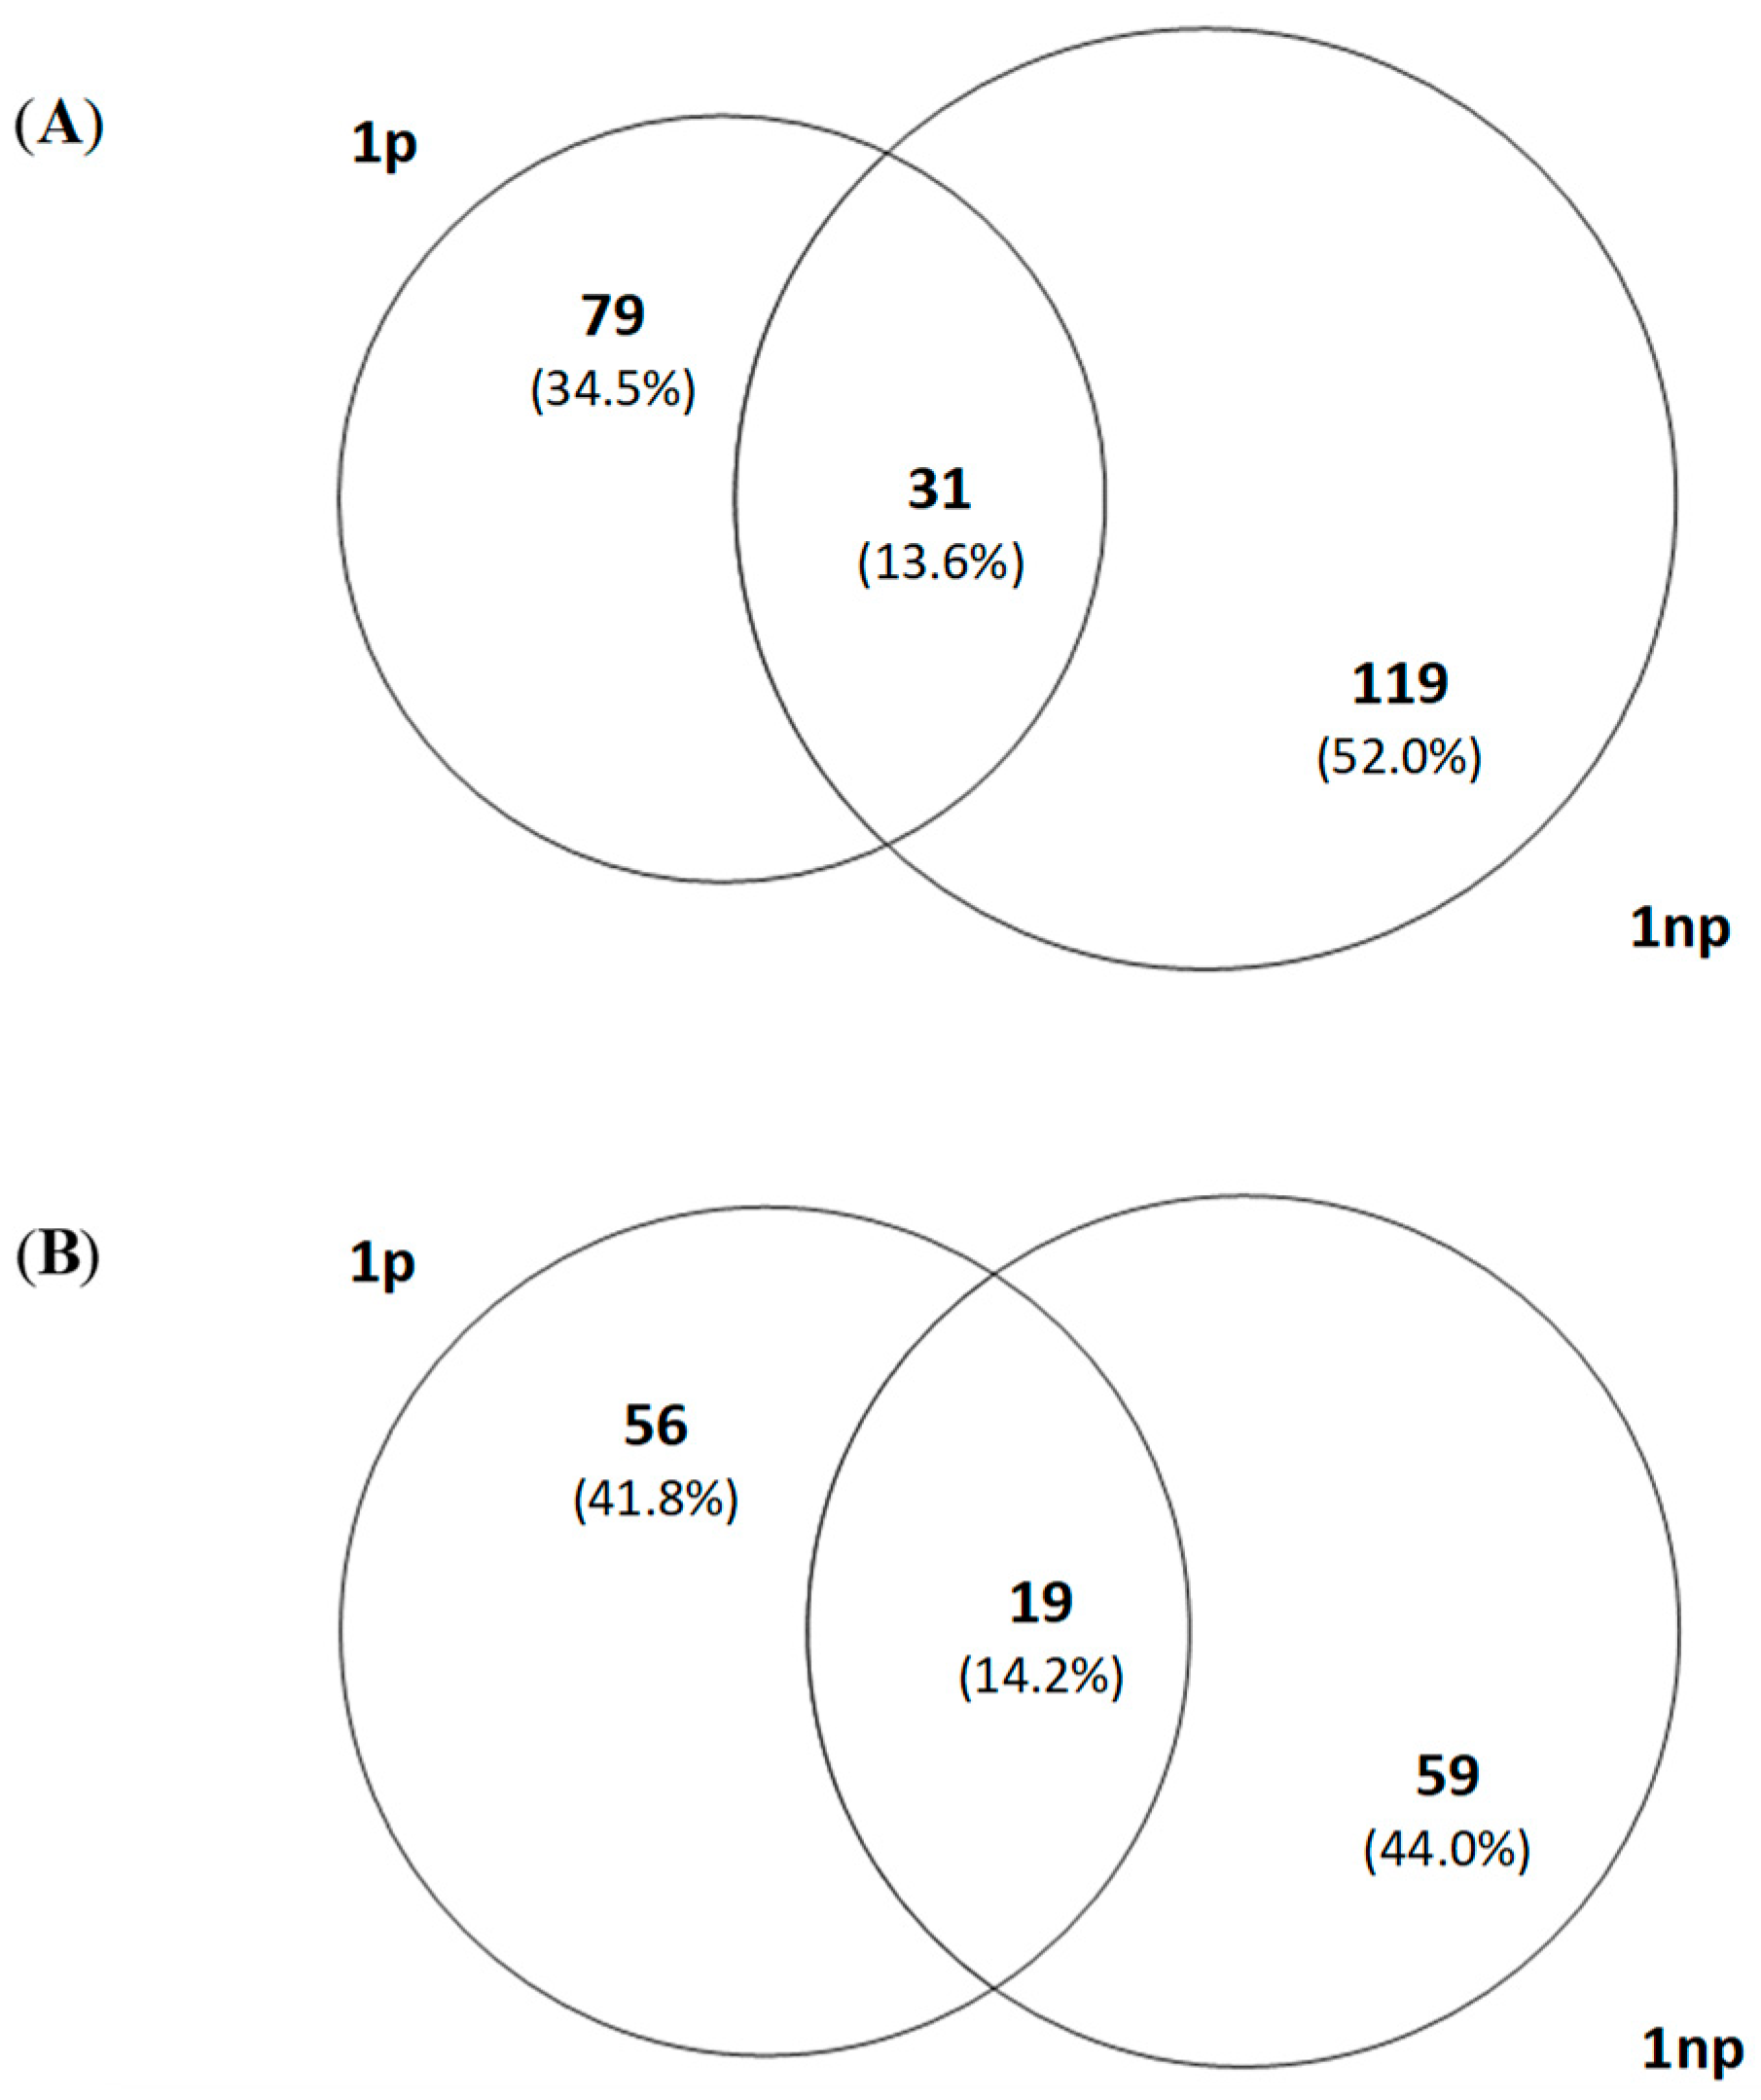
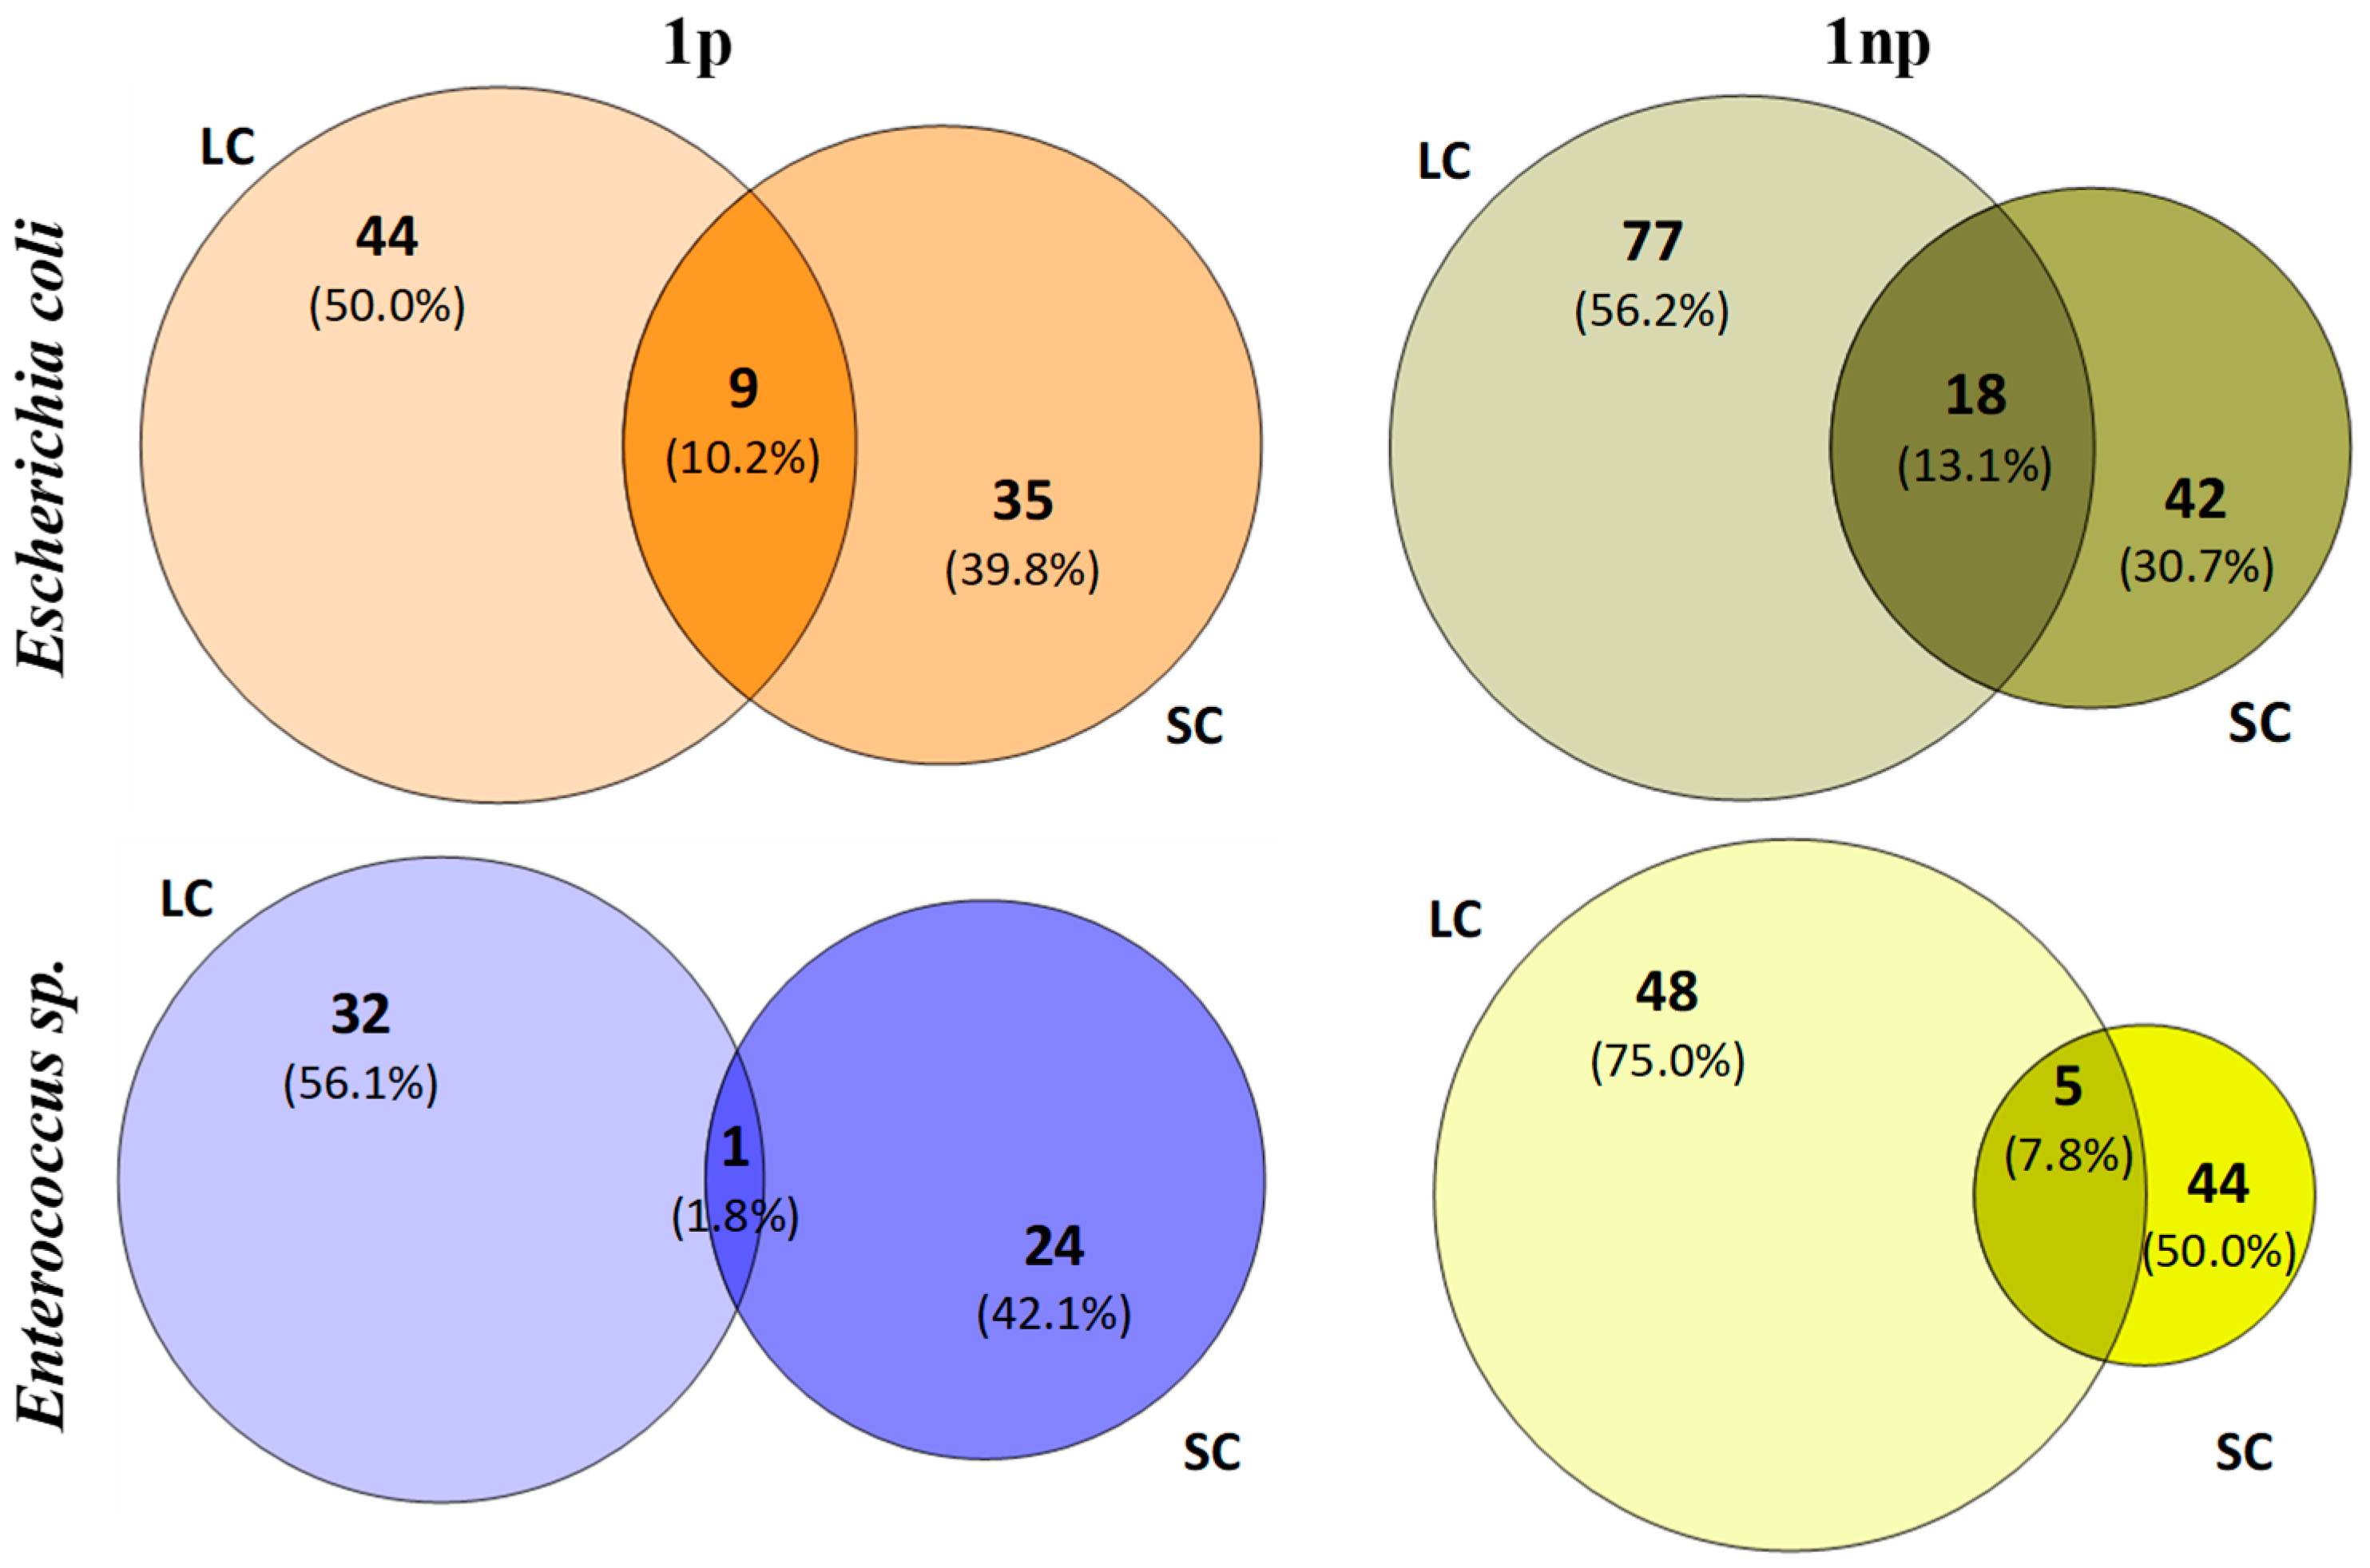
3.4. Analysis of T-RFLP
Author Contributions
Funding
Conflicts of Interest
References
- Carvalho, P.N.; Arias, C.A.; Brix, H. Constructed wetlands for water treatment: New developments. Water 2017, 9, 397. [Google Scholar] [CrossRef]
- Samsó, R.; García, J.; Molle, P.; Forquet, N. Modelling bioclogging in variably saturated porous media and the interactions between surface/subsurface flows: Application to Constructed Wetlands. J. Environ. Manag. 2016, 165, 271–279. [Google Scholar] [CrossRef] [Green Version]
- Saeed, T.; Sun, G. Pollutant removals employing unsaturated and partially saturated vertical flow wetlands: A comparative study. Chem. Eng. J. 2017, 325, 332–341. [Google Scholar] [CrossRef]
- Knowles, P.; Dotro, G.; Nivala, J.; García, J. Clogging in subsurface-flow treatment wetlands: Occurrence and contributing factors. Ecol. Eng. 2011, 37, 99–112. [Google Scholar] [CrossRef]
- Paing, J.; Guilbert, A.; Gagnon, V.; Chazarenc, F. Effect of climate, wastewater composition, loading rates, system age and design on performances of French vertical flow constructed wetlands: A survey based on 169 full scale systems. Ecol. Eng. 2015, 80, 46–52. [Google Scholar] [CrossRef]
- ElZein, Z.; Abdou, A.; Abd ElGawad, I. Constructed wetland as a sustainable wastewater treatment method in communities. Procedia Environ. Sci. 2016, 34, 605–617. [Google Scholar] [CrossRef]
- Casas Ledón, Y.; Rivas, A.; López, D.; Vidal, G. Life-cycle greenhouse gas emissions assessment and extended exergy accounting of a horizontal-flow constructed wetland for municipal wastewater treatment: A case study in Chile. Ecol. Indicators 2017, 74, 130–139. [Google Scholar] [CrossRef]
- Fuchs, V.J.; Mihelcic, J.R.; Gierke, J.S. Life cycle assessment of vertical and horizontal flow constructed wetlands for wastewater treatment considering nitrogen and carbon greenhouse gas emissions. Water Res. 2011, 45, 2073–2081. [Google Scholar] [CrossRef]
- Farahani, H.; Bayazidi, S. Modeling the assessment of socio-economical and environmental impacts of sand mining on local communities: A case study of Villages Tatao River Bank in North-western part of Iran. Resour. Policy 2018, 55, 87–95. [Google Scholar] [CrossRef]
- Ioannidou, D.; Meylan, G.; Sonnemann, G.; Haberte, G. Is gravel becoming scarce? Evaluating the local criticality of construction aggregates. Resour. Conserv. Recycle 2017, 126, 25–33. [Google Scholar] [CrossRef]
- Campos-Serrano, A.; Rodríguez-Esteban, J.A. Imagined territories and histories in conflict during the struggles for Western Sahara, 1956–1979. J. Hist. Geogr. 2017, 55, 44–59. [Google Scholar] [CrossRef]
- Yang, Y.; Zhao, Y.; Liu, R.; Morgan, D. Global development of various emerged substrates utilized in constructed wetlands. Bioresour. Technol. 2018, 261, 441–452. [Google Scholar] [CrossRef]
- Zhao, Y.Q.; Zhao, X.H.; Babatunde, A.O. Use of dewatered alum sludge as main substrate in treatment reed bed receiving agricultural wastewater: Long-term trial. Bioresour. Technol. 2009, 100, 644–648. [Google Scholar] [CrossRef] [Green Version]
- Zanella, L.; Nour, E.; Roston, D. Use of bamboo rings as substrate in subsuperficial constructed wetland system in Brazil. In Proceedings of the 12th International Conference on Wetland Systems for Water Pollution Control, Venice, Italy, 3–6 October 2010. [Google Scholar]
- Herrera-Melián, J.A.; González-Bordón, A.; Martín-González, M.A.; García-Jiménez, P.; Carrasco, M.; Araña, J. Palm tree mulch as substrate for primary treatment wetlands processing high strength urban wastewater. J. Environ. Manag. 2014, 139, 22–31. [Google Scholar] [CrossRef]
- Herrera-Melián, J.A.; Borreguero-Fabelo, A.; Araña, J.; Peñate-Castellano, N.; Ortega-Méndez, J.A. Effect of Substrate, Feeding Mode and Number of Stages on the Performance of Hybrid Constructed Wetland Systems. Water 2018, 10, 39. [Google Scholar] [CrossRef]
- Cao, W.; Wang, Y.; Sun, L.; Jiang, J.; Zhang, Y. Removal of nitrogenous compounds from polluted river water by floating constructed wetlands using rice straw and ceramsite as substrates under low temperature conditions. Ecol. Eng. 2016, 88, 77–81. [Google Scholar] [CrossRef]
- Thomas, R.; Gough, R.; Freeman, C. Linear alkylbenzene sulfonate (LAS) removal in constructed wetlands: The role of plants in the treatment of a typical pharmaceutical and personal care product. Ecol. Eng. 2017, 106, 415–422. [Google Scholar] [CrossRef]
- Arunbabu, V.; Sruthy, S.; Antony, I.; Ramasamy, E.V. Sustainable greywater management with Axonopus compressus (broadleaf carpet grass) planted in sub surface flow constructed wetlands. J. Water Process Eng. 2015, 7, 153–160. [Google Scholar] [CrossRef]
- Masi, F.; Rizzo, A.; Regelsberger, M. The role of constructed wetlands in a new circular economy, resource oriented, and ecosystem services paradigm. J. Environ. Manag. 2018, 216, 275–284. [Google Scholar] [CrossRef]
- Calhoun, A.; King, G.M. Regulation of root-associated methanotrophy by oxygen availability in the rhizosphere of two aquatic macrophytes. Appl. Environ. Microbiol. 1997, 63, 3051–3058. [Google Scholar]
- Schriewer, A.; Miller, W.A.; Byrne, B.A.; Miller, M.A.; Oates, S.; Conrad, P.A.; Hardin, D.; Yang, H.; Chouicha, N.; Melli, A.; et al. Presence of Bacteroidales as a Predictor of Pathogens in Surface Waters of the Central California Coast? Appl. Environ. Microbiol. 2010, 76, 5802–5814. [Google Scholar] [CrossRef]
- Wang, D.; Farnleitner, A.H.; Field, K.G.; Green, H.C.; Shanksd, O.C.; Boehma, A.B. Enterococcus and Escherichia coli fecal source apportionment with microbial source tracking genetic markers—Is it feasible? Water Res. 2013, 47, 6849–6861. [Google Scholar] [CrossRef]
- Li, Y.; Wang, C.; Zhang, W.; Wang, P.; Niu, L.; Hou, J.; Wang, J.; Wang, L. Modeling the Effects of Hydrodynamic Regimes on Microbial Communities within Fluvial Biofilms: Combining Deterministic and Stochastic Processes. Environ. Sci. Technol. 2015, 49, 12869–12878. [Google Scholar] [CrossRef]
- Brower, S.; Leff, L.; Mou, X. Effects of Short and Long-Term Hydrological Regimes on the Composition and Function of Denitrifying Bacteria in Experimental Wetlands. Wetlands 2017, 37, 573–583. [Google Scholar] [CrossRef]
- Hua, G.; Chenga, Y.; Kongb, J.; Li, M.; Zhao, Z. High-throughput sequencing analysis of bacterial community spatiotemporal distribution in response to clogging in vertical flow constructed wetlands. Bioresour. Technol. 2018, 248, 104–112. [Google Scholar] [CrossRef]
- Kadam, S.K.; Chandanshivea, V.V.; Raneb, N.R.; Patilb, S.M.; Gholaved, A.R.; Khandareb, R.V.; Bhosalee, A.R.; Jeonf, B.H.; Govindwar, S.P. Phytobeds with Fimbristylis dichotoma and Ammannia baccifera for treatment of real textile effluent: An in situ treatment, anatomical studies and toxicity evaluation. Environ. Res. 2018, 160, 1–11. [Google Scholar] [CrossRef]
- Murray, M.G.; Thompson, W.F. Rapid isolation of high molecular weight plant DNA. Nucleic Acids Res. 1980, 8, 4321–4325. [Google Scholar] [CrossRef]
- Deasy, B.M.; Rea, M.C.; Fitzgerald, G.F.; Cogan, T.M.; Beresford, T.P. A Rapid PCR Based Method to Distinguish between Lactococcus and Enterococcus. System. Appl. Microbiol. 2000, 23, 510–522. [Google Scholar] [CrossRef]
- Bej, A.K.; Steffan, R.J.; DiCesare, J.; Haff, L.; Atlas, R.M. Detection of Coliform Bacteria in Water by Polymoerase Chain Reaction and Gene Probes. Appl. Environ. Microbiol. 1990, 56, 307–314. [Google Scholar]
- Smith, C.J.; Danilowicz, B.S.; Clear, A.K.; Costello, F.J.; Wilson, B.; Meijer, W.G. T-Align, a web-based tool for comparison of multiple terminal restriction fragment length polymorphism profile. FEMS Microbiol. Ecol. 2005, 54, 375–380. [Google Scholar] [CrossRef]
- The R Project for Statistical Computing. Available online: https://www.r-project.org/ (accessed on 26 February 2018).
- Integrative Omics, Pacific Northwest National Laboratory. Venn Diagram Plotter. Available online: https://omics.pnl.gov/software/venn-diagram-plotter (accessed on 8 October 2018).
- Tchobanoglous, G.; Burton, F.L.; Stensel, H.D. Wastewater Engineering: Treatment and Reuse, 4th ed.; McGraw Hill Book Co.: New York, NY, USA, 2003. [Google Scholar]
- Royal Decree 1620, 2007, That Stablishes the Legislative Frame for the Reuse of Recovered Wastewater; Official Bulletin of the State: Madrid, Spain, 7 December 2007.
- Saeed, T.; Sun, G. A comparative study on the removal of nutrients and organic matter in wetland reactors employing organic media. Chem. Eng. J. 2011, 171, 439–447. [Google Scholar] [CrossRef]
- Torrens, A.; Molle, P.; Boutin, C.; Salgot, M. Impact of design and operation variables on the performance of vertical-flow constructed wetlands and intermittent sand filters treating pond effluent. Water Res. 2009, 43, 1851–1858. [Google Scholar] [CrossRef]
- Brix, H. Do macrophytes play a role in constructed treatment wetlands? Water Sci. Technol. 1997, 35, 11–17. [Google Scholar] [CrossRef]
- Teixeira, D.L.; Teixeira de Matos, A.; Pimentel de Matos, M.; Pires Vieira, D.; Dias Araújo, E.; Aparecida Ferraz, L. The influence of plant roots on the clogging process and the extractive capacity of nutrients/pollutants in horizontal subsurface flow constructed wetlands. Ecol. Eng. 2018, 120, 54–60. [Google Scholar] [CrossRef]
- Hua, G.F.; Zhao, Z.W.; Kong, J.; Guo, R.; Zeng, Y.T.; Zhao, L.F.; Zhu, Q.D. Effects of plant roots on the hydraulic performance during the clogging process in mesocosm vertical flow constructed wetlands. Environ. Sci. Pollut. Res. 2014, 21, 13017–13026. [Google Scholar] [CrossRef]
- Headley, T.; Nivala, J.; Kassaa, K.; Olsson, L.; Wallace, S.; Brix, H.; Afferden, M.; Müller, R. Escherichia coli removal and internal dynamics in subsurface flow ecotechnologies: Effects of design and plants. Ecol. Eng. 2013, 61, 564–574. [Google Scholar] [CrossRef]
- Thies, J.E. Soil microbial community analysis using terminal restriction fragment length polymorphisms. Soil Sci. Soc. Am. J. 2007, 71, 579–591. [Google Scholar] [CrossRef]
- Lazzaro, A.; Widmer, F.; Sperisen, C.; Frey, B. Identification of dominant bacterial phylotypes in a cadmium-treated forest soil. FEMS Microbial. Ecol. 2008, 63, 143–155. [Google Scholar] [CrossRef] [Green Version]
- Bru, D.; Ramette, A.; Saby, N.P.; Dequiedt, S.; Ranjard, L.; Jolivet, C.; Arrouays, D.; Philippot, L. Determinants of the distribution of nitrogen-cycling microbial communities at the landscape scale. ISME J. 2011, 5, 532–542. [Google Scholar] [CrossRef]


| Parameter | Average ± Std. Dev. | Max–Min, Number of Data Points | Units |
|---|---|---|---|
| COD | 390 ± 114 | 783–260, 26 | mg/L |
| BOD | 279 ± 89 | 470–140, 22 | mg/L |
| Total Suspended Solids | 94 ± 27 | 137–48, 26 | mg/L |
| Turbidity | 521 ± 132 | 723–266, 26 | NTU |
| N-ammonia | 31.1 ± 6.2 | 42.8–20.2, 25 | mg/L |
| Escherichia coli | 1.5 (± 0.92) × 106 | 3.0 × 10⁶–3.6 × 10⁵, 23 | CFU/100 mL |
| Total coliforms | 3.1 (± 2.1) × 106 | 8.0 × 10⁶–8.0 × 10⁵, 23 | CFU/100 mL |
| Na+ | 114 ± 39 | 157–41, 9 | mg/L |
| Hardness (Ca 2+Mg 2+) | 3.0 ± 1.5 | 5.4–1.6, 10 | meq/L |
| Sodium Absorption Ratio | 6.2 ± 2.9 | 10.7–2.5, 9 | |
| Electrical Conductivity | 1945 ± 169 | 2190–1304, 25 | μS/cm |
| pH | 7,8 ± 0 | 8.0–7.5, 25 | |
| N-Nitrites | 0.09 ± 0.4 | 1.6–0.0, 17 | mg/L |
| N-Nitrates | 1.1 ± 0.83 | 2.6–0.0, 17 | mg/L |
| P-Phosphates | 10.4 ± 3.9 | 14.7–2.0, 17 | mg/L |
| Sulfates | 14 ± 17 | 76–4, 16 | mg/L |
| Cl− | 99 ± 11 | 122–83, 17 | mg/L |
| F− | 7.9 ± 1.2 | 10.23–6.27, 17 | mg/L |
| Parameters | Average ± Std. Dev. Max–Min | |
|---|---|---|
| 1p | 1np | |
| HLR | 233 ± 54 323–146 | 189 ± 78 349–44 |
| COD | 90 ± 29 137–46 | 74 ± 40 171–18 |
| BOD | 70 ± 29 126–24 | 51 ± 23 98–6 |
| TSS | 22 ± 9 40–8 | 18 ± 10 41–4 |
| Ammonia-N | 9 ± 3 18–5 | 7 ± 3 16–1 |
| Parameters | Average ± Std. Dev. Max–Min | |
|---|---|---|
| 1p | 1np | |
| COD | 58 ± 17 77–8 | 50 ± 17 86–27 |
| BOD | 62 ± 28 97–(−3) | 59 ± 30 92–(−34) |
| Turbidity | 90 ± 10 98–62 | 73 ± 19 99–46 |
| TSS | 77 ± 20 99–20 | 72 ± 15 99–39 |
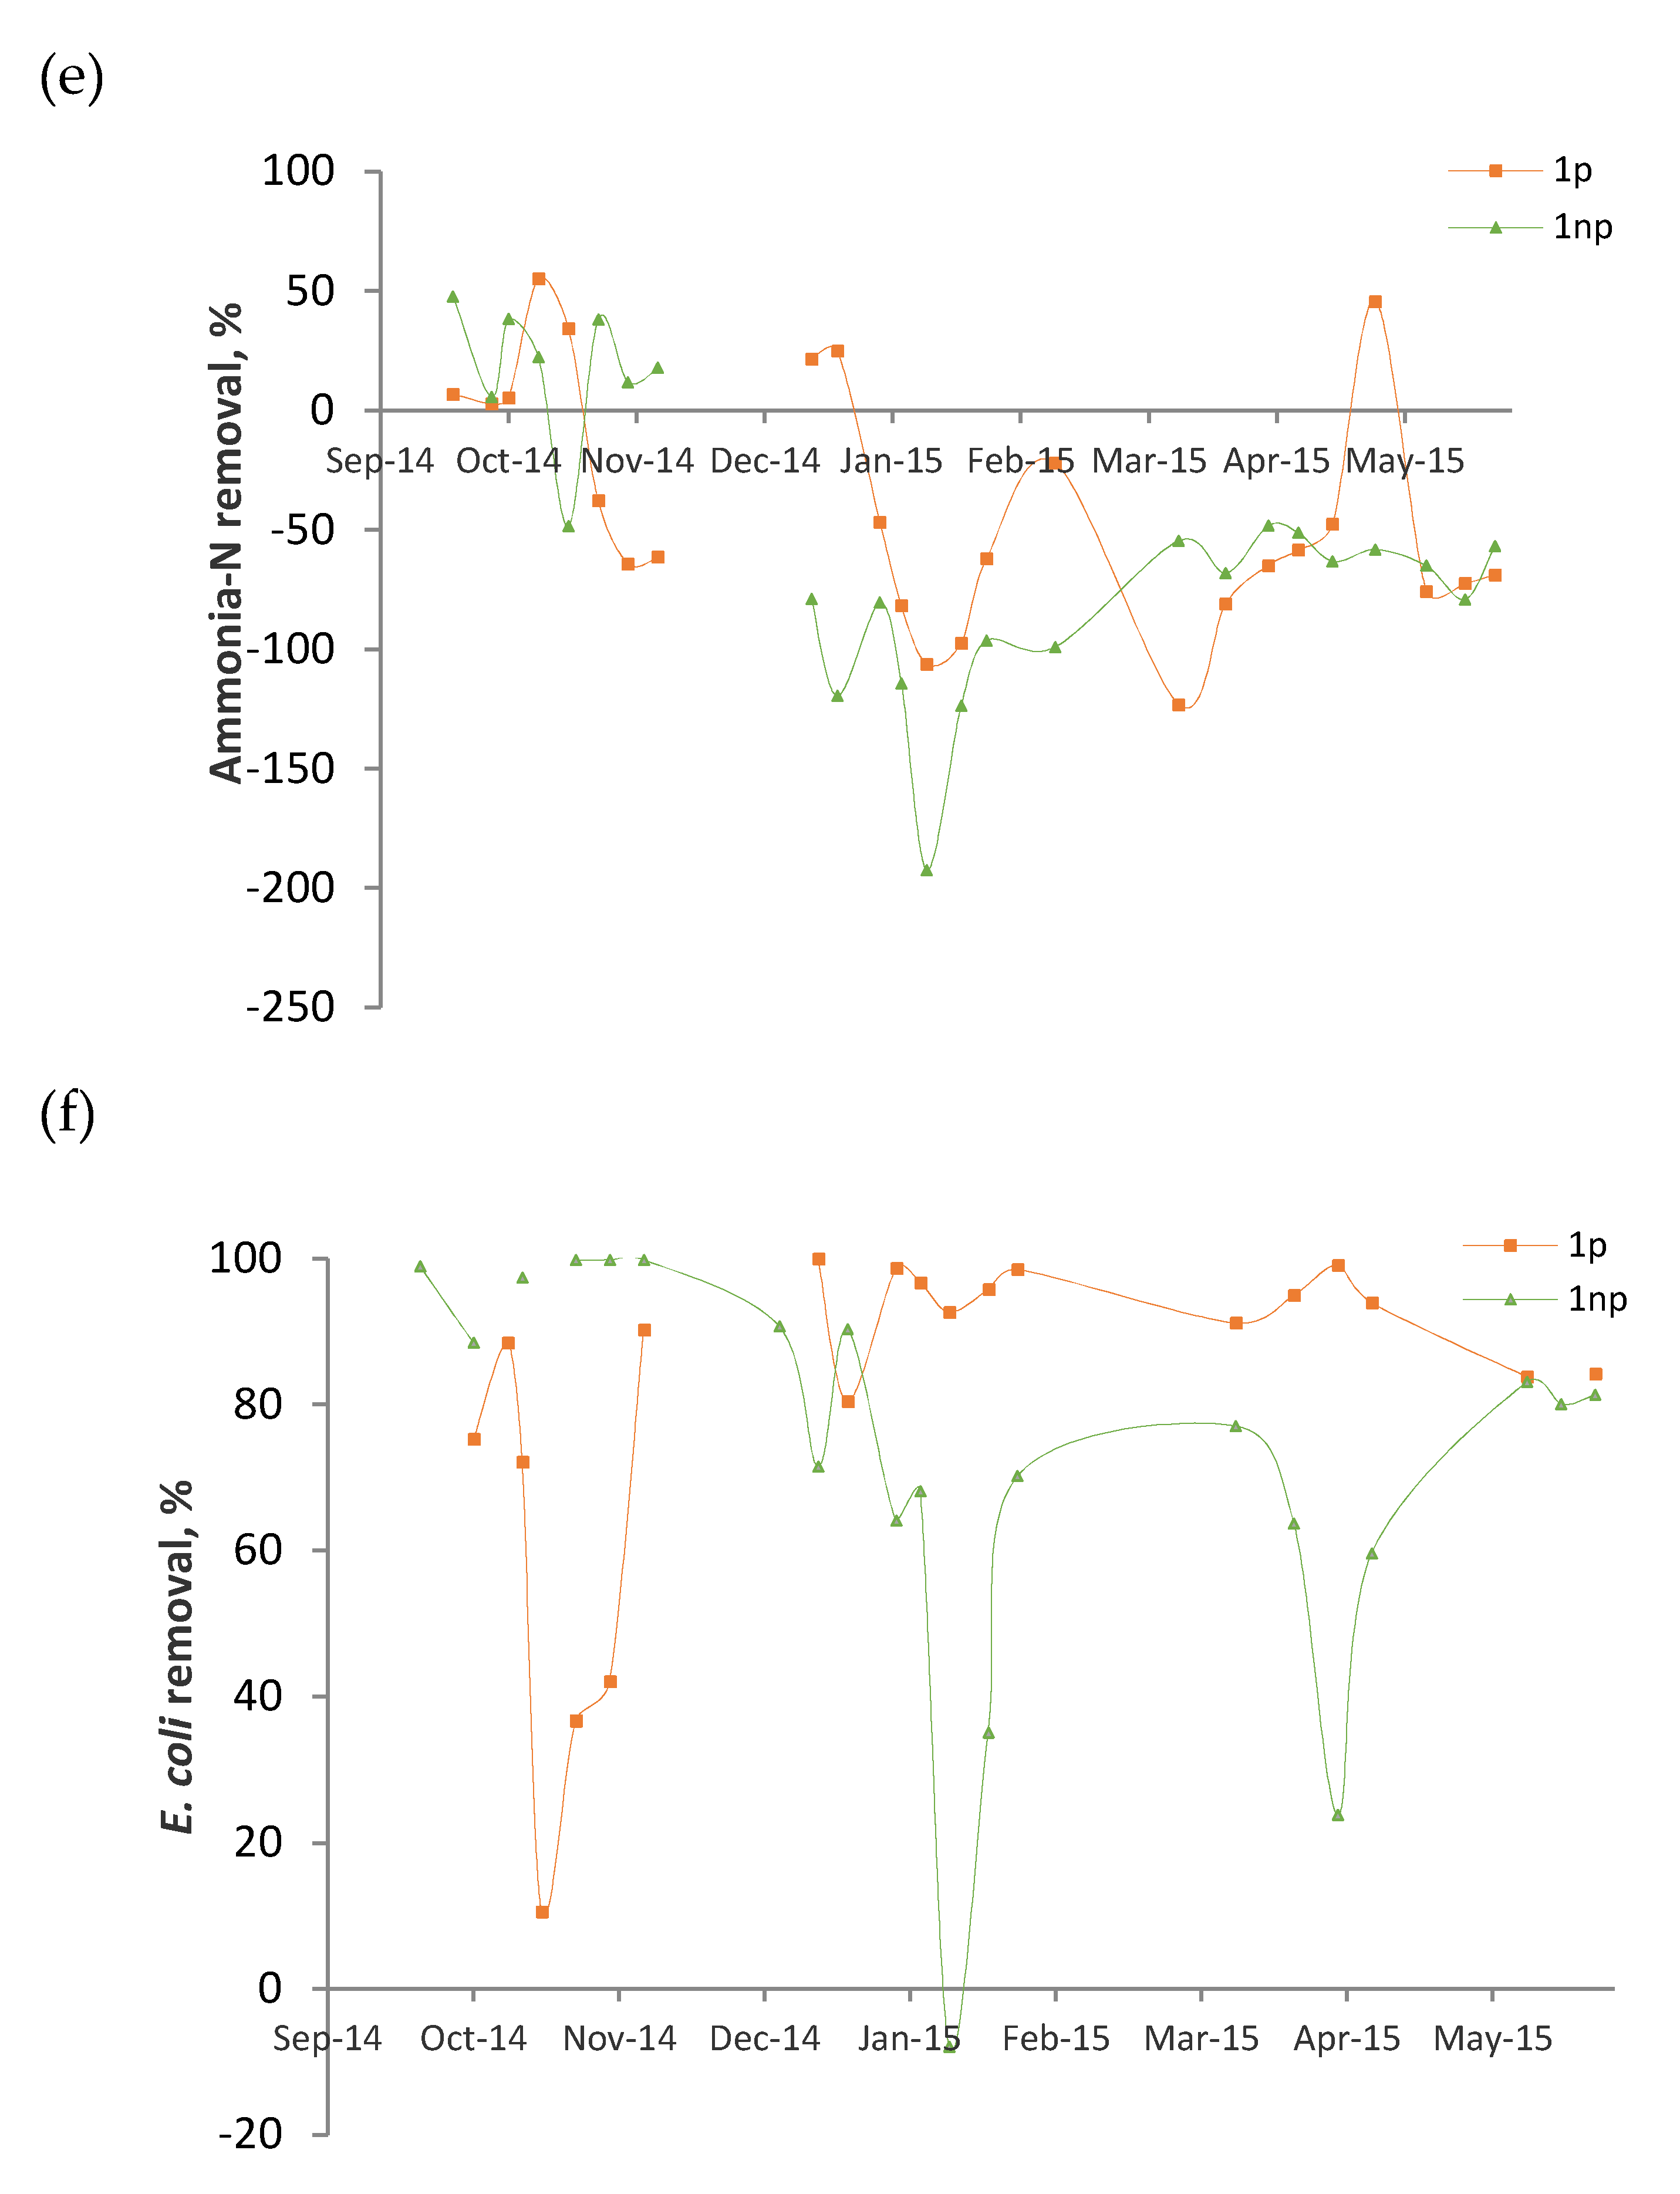
| Ammonia-N | −39 ± 50 55–(−123) | −53 ± 59 48–(−192) |
| Phosphate-P | −38 ± 169 39–(−666) | −46 ± 163 36–(−675) |
| Sulfate | −297 ± 282 86–(−1071) | −175 ± 239 61–(−777) |
| E. coli | 79 ± 26 99.9–11 | 73 ± 28 99.8–(−8) |
| Total coliforms | 82 ± 26 99.6–(−20) | 74 ± 25 99.9–5.5 |
| Wetland | Before | After | |
|---|---|---|---|
| COD | 1p 1np | 55 67 | 63 40 |
| BOD | 1p 1np | 82 83 | 85 55 |
| Turbidity | 1p 1np | 90 95 | 94 65 |
| TSS | 1p 1np | 75 84 | 87 71 |
| Ammonia-N | 1p 1np | −7 17 | −50 −115 |
| E. coli | 1p 1np | 59 97 | 95 60 |
| Total coliforms | 1p 1np | 82 98 | 94 69 |
© 2019 by the authors. Licensee MDPI, Basel, Switzerland. This article is an open access article distributed under the terms and conditions of the Creative Commons Attribution (CC BY) license (http://creativecommons.org/licenses/by/4.0/).
Share and Cite
Carrasco-Acosta, M.; Garcia-Jimenez, P.; Herrera-Melián, J.A.; Peñate-Castellano, N.; Rivero-Rosales, A. The Effects of Plants on Pollutant Removal, Clogging, and Bacterial Community Structure in Palm Mulch-Based Vertical Flow Constructed Wetlands. Sustainability 2019, 11, 632. https://doi.org/10.3390/su11030632
Carrasco-Acosta M, Garcia-Jimenez P, Herrera-Melián JA, Peñate-Castellano N, Rivero-Rosales A. The Effects of Plants on Pollutant Removal, Clogging, and Bacterial Community Structure in Palm Mulch-Based Vertical Flow Constructed Wetlands. Sustainability. 2019; 11(3):632. https://doi.org/10.3390/su11030632
Chicago/Turabian StyleCarrasco-Acosta, Marina, Pilar Garcia-Jimenez, José Alberto Herrera-Melián, Néstor Peñate-Castellano, and Argimiro Rivero-Rosales. 2019. "The Effects of Plants on Pollutant Removal, Clogging, and Bacterial Community Structure in Palm Mulch-Based Vertical Flow Constructed Wetlands" Sustainability 11, no. 3: 632. https://doi.org/10.3390/su11030632