Shifts in the Microbial Community of Activated Sludge with Different COD/N Ratios or Dissolved Oxygen Levels in Tibet, China

1
Ministry of Education Key Laboratory of Integrated Regulation and Resource Development on Shallow Lakes, College of Environment, Hohai University, Nanjing 210098, China
2
College of Resources and Environment, Tibet Agricultural and Animal Husbandry University, Tibet Nyingtri 860000, China
*
Authors to whom correspondence should be addressed.
Sustainability 2019, 11(8), 2284; https://doi.org/10.3390/su11082284
Submission received: 29 March 2019
/
Revised: 9 April 2019
/
Accepted: 12 April 2019
/
Published: 16 April 2019
(This article belongs to the Special Issue Sustainable Wastewater Treatment Systems)
Abstract
:In this study, we examined the influence of the organic carbon-to-nitrogen ratio (chemical oxygen demand (COD/N)) and dissolved oxygen (DO) levels on the removal efficiency of pollutants and on the change in total microflora in the cyclic activated sludge system (CASS) in the Nyingchi prefecture in Tibet. The results demonstrated that the treatment performance was the best when the COD/N ratio was 7:1 or the DO levels were 2–2.5 mg/L in comparison with four different tested COD/N ratios (4:1, 5:1, 7:1, and 10:1) and DO concentrations (0.5–1, 1–2, 2–2.5, and 2.5–3.5 mg/L). The treatment performance can be explained by the relative operational taxonomic unit richness and evenness of the microbial communities in activated sludge. Evident microbial variance was observed, especially different COD/N ratios and DO concentrations, which were conducive to the disposal of urban sewage in plateaus. The results help to understand sewage treatment under different COD/N ratios or DO concentrations on plateaus. This work provides practical guidance for the operation of any wastewater treatment plant on a plateau.
1. Introduction
Sewage treatment has contributed to the improvement in the water-environment in high-altitude regions [1]. The activated sludge method uses activated sludge to transform organic and inorganic pollutants, which has been applied to improve aquatic environments around the world. Due to its low operational cost and good performance (chemical oxygen demand (COD/N) removal efficiency can reach 85% or higher), it is still the most widely used and common water treatment measured in urban effluent treatment [2]. The wastewater treatment plants (WWTPs) at high-altitude regions face some operational barriers, mainly because of extreme climate conditions, such as thin air and low pressure [3]. The stable operation of WWTPs with widely-used sewage treatment technology, based on the activated sludge or biological process in plateau regions, is crucial [1].
The main factors influencing urban effluent treatment processes include the COD/N ratio and the dissolved oxygen (DO) concentration. If the COD/N ratio in influent concentration is too high, heterotrophic organisms consume more available ammonia-nitrogen than nitrifying organisms [4]. Yun [5] stated that nitration activity gradually fails at the reactors with organic additions. Sharma [6] reported that the nitrification rate increases with deduced COD/TKN (Kjeldahl nitrogen) in the influent. Luo et al. [7] studied the effect of the COD/N ratio in influent on the decomposition of aerobic granule sludge, and the results showed that when the COD/N ratio in the influent is 2:1 or 1:1, it strongly influenced the stability of aerobic granule sludge with regard to physical properties and nitrification efficiency, and when the COD/N ratio is reduced to 1:1, the aerobic granule sludge decomposes. Since an increased COD/N could result in a lowered nitrification efficiency and enhanced denitrification efficiency, the COD/N ratio in influent influences the quantity of microorganisms [8]. Zielinska [9] studied nitrogen removal from wastewater and the bacterial diversity of activated sludge at different COD/N ratios and DO concentrations. The results showed that the total bacteria diversity was similar in all experimental series and the diversity and abundance of ammonia-oxidizing bacteria (AOB) were higher in the reactors with a COD/N ratio of 0.7:1 in comparison with the reactors with a COD/N of 6.8:1 [9].
In any urban WWTP, the DO concentration determines the degradation rate of organic matter in microflora, aerobic growth, and the operational cost [10,11]. DO concentrations must be controlled because it determines the dominant reaction process in the reactor. High DO concentrations suppress denitrification, and low DO concentrations lead to restricted ammoxidation [12]. Dissolved oxygen can be controlled by air supply, so the cost of treating wastewater with oxygen is affected. A low COD/N ratio and DO concentration facilitate a nitrification effect to some extent and decrease oxygen demand by 25% and COD by 40% in the denitrification process [13,14]. According to the report by Ma [15], in the continuous flow system of domestic urban wastewater treatment, 0.4–0.7 mg/L DO was conducive to nitrite accumulation. Yadav [16] evaluated the microbial community in response to different DO concentrations (1, 2, and 4 mg/L) in activated sludge and the results showed that the diversity of bacteria was the greatest when the DO was 2 mg/L in the reactor. The pressure increases in the gas phase and the concentration of saturated DO increases in the water, which is conducive to the oxygen transfer to the water, whereas the pressure decreases when the sewage is aerated in the biological treatment tank. The oxygen pressure at 4000 m altitude is only 60% of that at sea level [3]. Oxygen transfer varies due to variation in pressure and its influence on microbial communities at high latitudes. Therefore, we need more information on the microbial community of activated sludge with different DO levels at high latitudes.
Many studies have provided information about low-elevation WWTPs. To provide some practical guidance on domestic wastewater treatment in plateau regions, the objectives of this study were: (1) To investigate the influence of different COD/N ratios or DO concentrations on urban wastewater treatment on plateaus, (2) to investigate microbial community structure and its diversity in activated sludge under different COD/N ratios or DO concentrations in plateaus, and (3) to determine the relationships amongst domestic wastewater treatment performance, microflora structure, and species diversity. We think these results provide practical guidance for treating domestic wastewater in plateau regions.
2. Materials and Methods
2.1. Reactor and Operation
A total of four lab-scale cyclic activated sludge systems (CASSs) were used to treat synthetic sewage in Nyingtri, Tibet. The experimental site, the Environmental Science and Engineering Laboratory of the Tibet Agricultural and Animal Husbandry University, was located at an altitude of about 3000 m above sea level. The atmospheric pressure of the experimental site was 706 hPa (measured value). A schematic diagram of the CASS reactor and the reactor volume of 0.045 m3 are shown in Figure 1. Activated sludge (AS) originated from the Lhasa sewage treatment plant with an initial sludge concentration of 2.5 g/L. The synthetic influent sewage feed and the aeration system of the device were adjusted by a creep pump. The pH in the system was maintained between 7.2 and 8.4. The pH was adjusted with anhydrous sodium carbonate. The reactor was run under water temperature (11 ± 1 °C). The composition of the synthetic sewage is shown in Table 1 at different COD/N ratios test stages. CN-1, CN-2, CN-3, and CN-4 refer to the COD/N ratios of 4:1, 5:1, 7:1, and 10:1, respectively. The DO was kept constant, or more than 4 mg/L, to provide adequate oxygen during the different COD/N ratios test stages. The composition of the synthetic sewage is shown in Table 2 at different DO concentration test stages. DO-1, DO-2, DO-3, and DO-4 refer to the DO concentrations of 0.5–1, 1–2, 2–2.5, and 2.5–3.5 mg/L, respectively. The COD/N ratio was controlled at 7:1 to provide adequate nutrients during the different DO concentration test stages. Under batch feeding conditions, there were four daily CASS cycles. One CASS operational cycle required 6 h, of which 4 h were the aeration stage, and 2 h were the sludge setting and drainage stage.
To describe “cyclical”, a decanting factor (Fd) can be obtained: Fd = Ve/Vd,
Where Ve is 10 L wastewater that was exchanged in each cycle, Vd is the reactor volume, 0.045 m3. The reactors ran continuously for about 25 days, including 10 days of adjustment and 15 days of stabilization.
2.2. Collection of Samples and Analytical Methods
Daily measurements of the effluent of the reactors included: COD, NH4–N+, NO2−–N, NO3−–N, and total phosphorus (TP), according to Chinese standard methods during the stable stage [17]. COD was determined using the potassium dichromate method. Nitrogen content was measured with a flow analyzer. TP was determined by ammonium molybdate spectrophotometry. A portable dissolved oxygen meter (JPBJ-608, Shanghai Precision and Scientific Instrument Corporation, Shanghai, China) was used to determine the water temperature and DO. We collected 10 mL of the mixed liquor-suspended solids (MLSS) reaction mixture from each reactor during the stable stage for microbiological analysis.
2.3. Pyrosequencing Analysis
The microbial community structure and its diversity of activated sludge samples were investigated by high-throughput 16S ribosomal ribonucleic acid (rRNA) gene sequencing. The detailed operational steps of the pyrosequencing methods have been described by Xu [18]. The rarefaction analysis was conducted to reveal the diversity indices. The detailed data processing and analysis have also been described by Xu [19].
3. Results and Discussion
3.1. Richness and Evenness of Microbial Communities of Activated Sludge
The relative operational taxonomic unit (OTU) richness and evenness of microbial communities of activated sludge with different COD/N ratios or DO concentrations are shown in Figure 2, Figure 3 and Figure 4. The relative OTU richness of the species is reflected in the length of the curve on the horizontal axis. The wider the curve, the richer the relative OTU richness of the species. The relative OTU evenness of species composition is reflected in the shape of the curve. The flatter the curve, the more relative the OTU evenness of species composition. The relative OTU richness and evenness of the bacterial communities occurred when the COD/N ratio was 7:1 or the DO was 2–2.5 mg/L (Figure 2). The relative OTU richness and evenness of the fungal communities of activated sludge peaked at a COD/N ratio of 5:1 or DO of 2–2.5 mg/L (Figure 3). The relative OTU richness and evenness of archaeal communities were the highest, at the COD/N ratio of 7:1 or the DO of 2–2.5 mg/L (Figure 4). The Shannon index values for different COD/N ratios and DO concentrations are shown in Table 3. The Shannon index values represent the diversity and evenness of a sample. Table 3 shows that the diversity and evenness of fungal communities of activated sludge were far lower at COD/N of 4:1, 7:1, and 10:1 than that at 5:1. The diversity and evenness of fungal communities of activated sludge were far lower at the DO of 0.5–1, 1–2, and 2.5–3.5 mg/L than at 2–2.5 mg/L. As shown in Figure 3, the broken curve ends at the lower horizontal axis values. The highest species diversity and evenness was observed when the COD/N ratio was 7:1 or the DO was 2–2.5 mg/L.
3.2. Microbial Community Structures
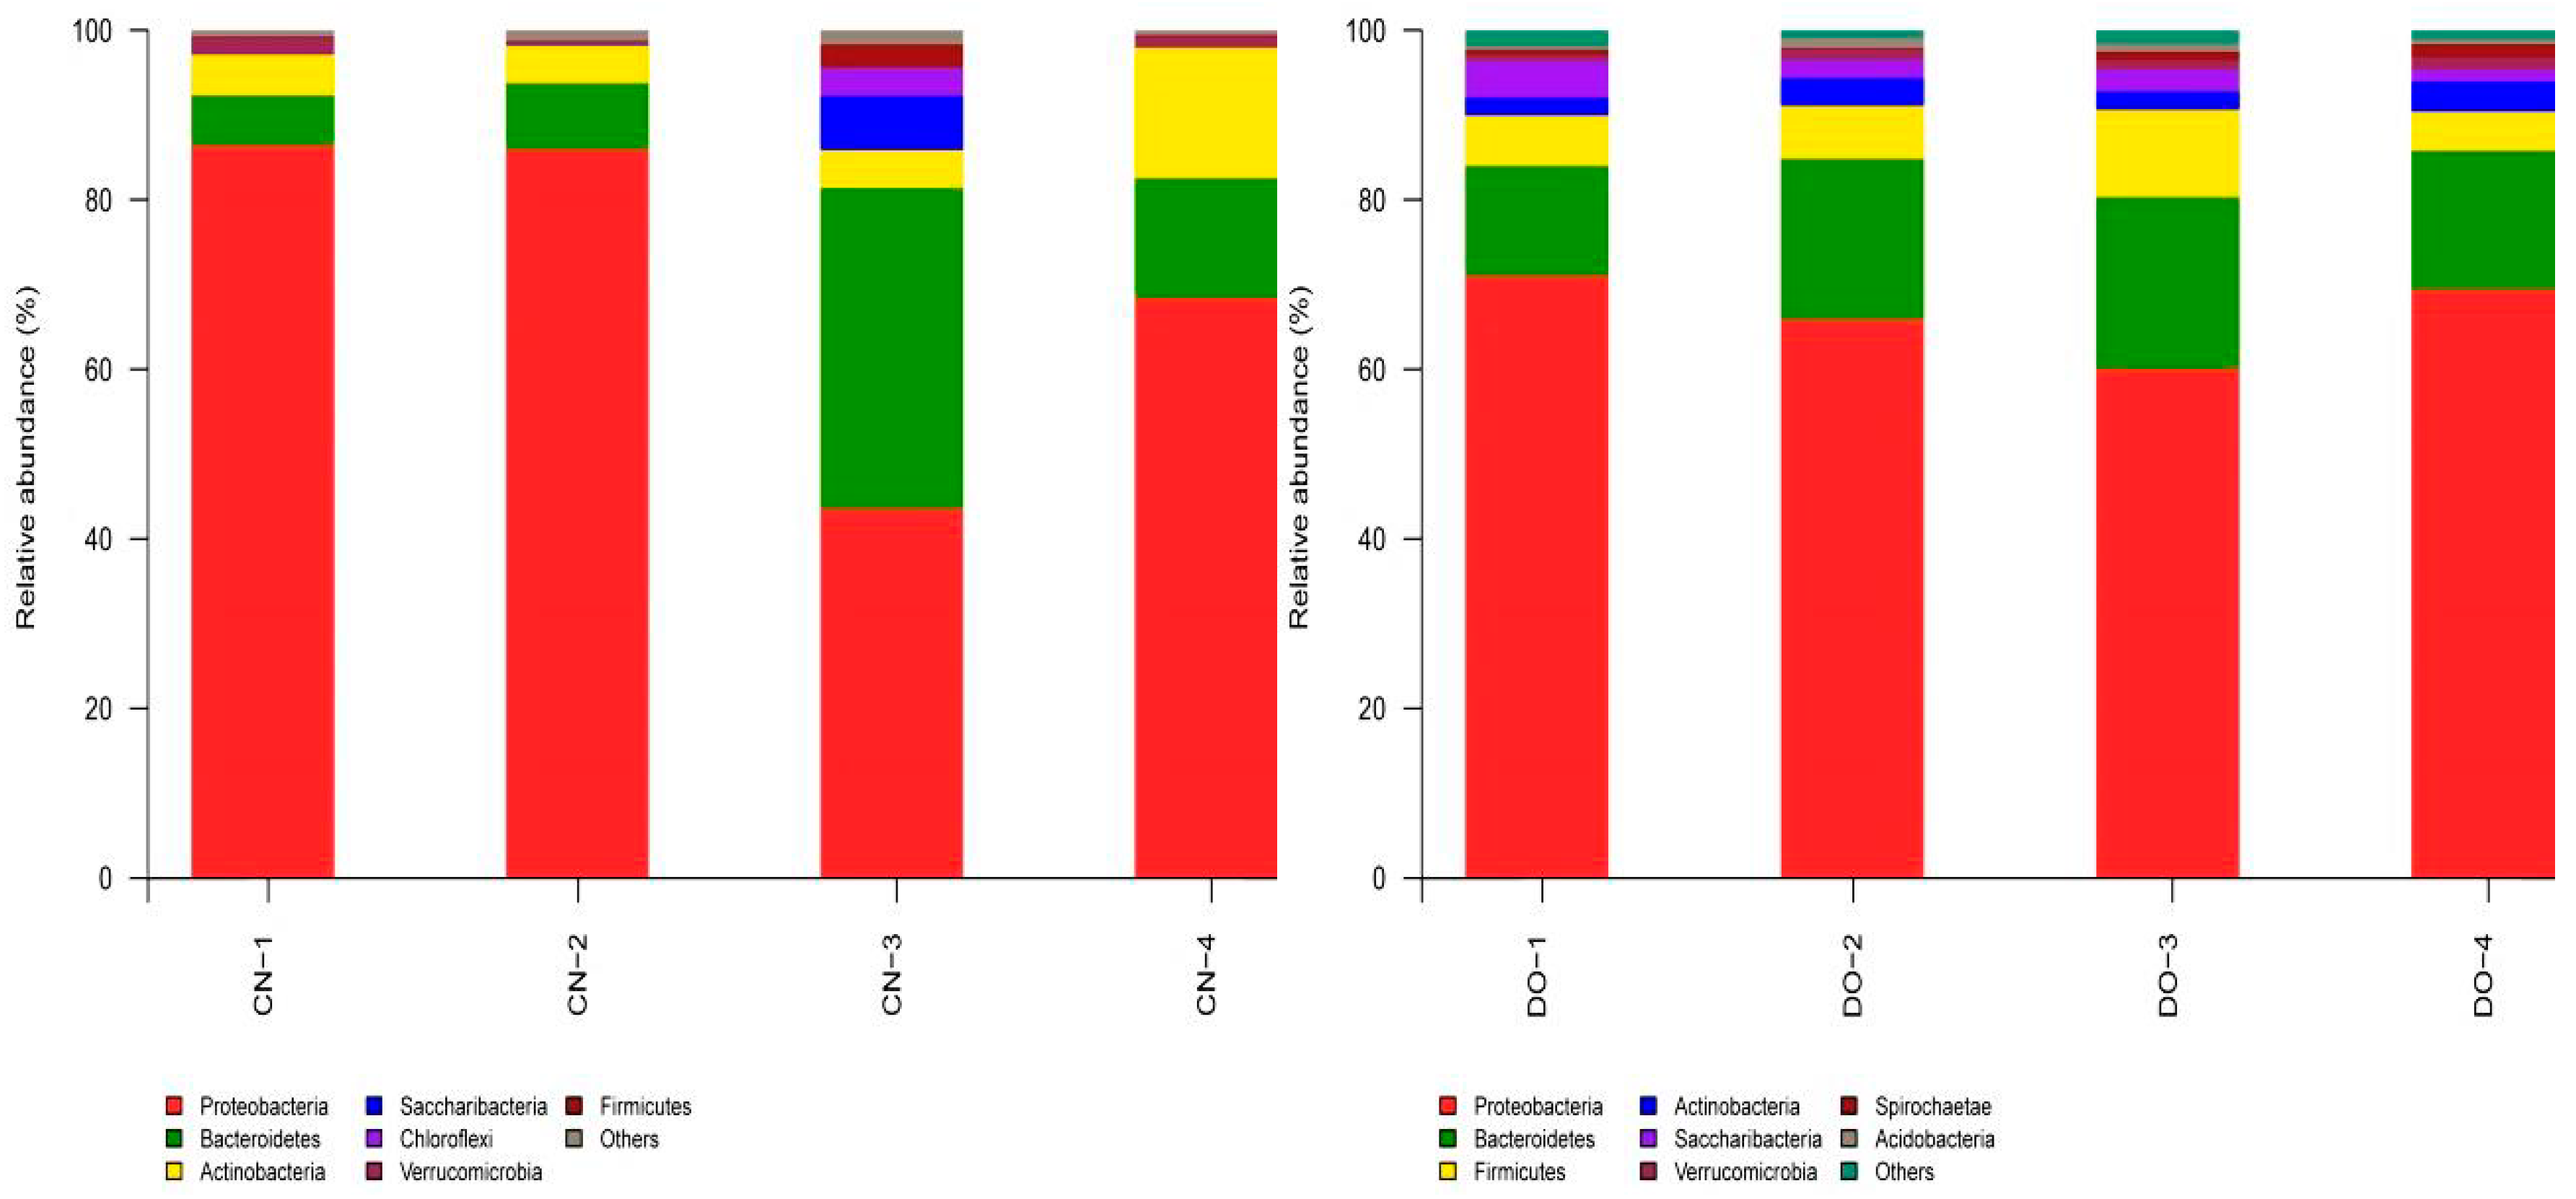
Figure 5 depicts the relative abundance of the bacterial community under different COD/N ratios or DO concentrations in the activated sludge. The results indicate that Proteobacteria (>80%) was the main group in the activated sludge and Bacteroidetes (<10%) was secondary in activated sludge when the COD/N ratio was 4:1 and 5:1. When the COD/N ratio was 7:1, Proteobacteria (43.51%) was the main group and Bacteroidetes (37.88%) was the secondary group in activated sludge. When the COD/N ratio was 10:1, Proteobacteria (68.38%) was the main group and Bacteroidetes (14.19%) was the secondary group in activated sludge. These figures demonstrate that Proteobacteria was sensitive to the COD/N ratio. As shown in Figure 5, under different COD/N ratios, Proteobacteria was the most abundant phylum and Bacteroidetes was the second most abundant phylum in activated sludge. This result is similar to reported research results for urban WWTPs [20,21]. The previous research revealed that some Actinobacteria, Bacteroidetes, and Firmicutes members can decompose complex polysaccharides [22,23]. When the COD/N ratio was 10:1, the proportion of Actinobacteria increased to 15.39%. As shown in Figure 5, the relative abundance of the Actinobacteria was lower at the COD/N ratios of 4:1, 5:1, and 7:1 than at 10:1. Actinobacteria play a necessary role in nutrient removal during sewage treatment [24]. The microbial abundance at the phylum level was lower at COD/N ratios of 4:1, 5:1, and 10:1 than at 7, indicating that the proportions of different phyla in the bio-community in the sludge vary with the feeding ratio.
As shown in Figure 5, when the DO concentrations were 0.5–1, 1–2, 2–2.5, and 2.5–3.5 mg/L, Proteobacteria (>60%) was the main group in activated sludge. Under different DO concentrations, Proteobacteria was the most abundant phylum. When the DO concentration was 2–2.5 mg/L, Firmicutes (10.29%) was significantly augmented. The relative abundance of Firmicutes was lower when the DO concentration was 0.5–1, 1–2, and 2.5–3.5 mg/L (5.89%, 6.23%, and 4.60%, respectively) than that at 2–2.5 mg/L (10.29%). In this research, the majority of sequences were labelled as unclassified, and the most abundant phylum observed in all reactors and the previously activated biomass, such as Actinobacteria, Proteobacteria, Firmicutes, Bacteroidetes, Acidobacteria, Nitrospira, and Chloroflexi, were previously reported [25,26]. This result is similar to previous research results [16]. The difference in our reported richness and evenness of microbial community to those reported by Chandra Yadav et al. [16] may be related to elevational gradient. As reported by Niu [27], a significant change in the evenness of the bacterial community was observed at around 1200 m of elevation with a linear decline as elevation increased to 3660 m. The microbial abundance at the phylum level was clearly lower when the DO concentration was 0.5–1, 1–2, and 2.5–3.5 mg/L than when the DO was 2–2.5 mg/L, indicating that the bio-community proportions in the sludge vary with the DO concentration.
Figure 6 summarizes the relative abundances of the fungi community on the phylum level of activated sludge with different COD/N ratios or DO concentrations. The figure shows that Ascomycota was the most abundant phylum. Basidiomycota was the second most abundant phylum, followed by unclassified fungi when the COD/N ratio was at 4:1, 5:1, 7:1, or 10:1. Ascomycota (81.38%) was predominant and Basidiomycota (17.50%) was also a major group when the COD/N ratio was at 7. Ascomycota also played a critical role in nutrient removal during sewage treatment. As shown in Figure 6, Basidiomycota (>70%) was predominant, followed by Ascomycota (<30%) in activated sludge, when the DO was at 0.5–1, 1–2, 2–2.5, or 2.5–3.5 mg/L. In Figure 6, the relative abundances of Ascomycota at the DO of 0.5–1, 1–2, and 2.5–3.5 mg/L (2.04%, 4.58%, and 7.21%, respectively) were lower than when the DO was 2–2.5 mg/L (23.81%).
Figure 7 demonstrates the relative abundances of the archaeal community on the phylum level of activated sludge at different COD/N ratios or DO concentrations. Figure 7 show that Thaumarchaeota represented the most abundant phylum. Euryarchaeota was the second most abundant phylum, followed by Bacteroidetes when the COD/N ratio was 4:1 and 5:1. Bacteroidetes was the most abundant phylum, Euryarchaeota was the second most abundant phylum, followed by Thaumarchaeota when the COD/N ratio was 7:1. Euryarchaeota was the most abundant phylum, Thaumarchaeota was the second most abundant phylum, followed by Bacteroidetes when the COD/N ratio was 10:1. Figure 7 suggests that Euryarchaeota was sensitive to the COD/N ratio. Thaumarchaeota (>50%) was predominant, and Euryarchaeota (<40%) was also a major group in activated sludge when the DO was 0.5–1, 1–2, 2–2.5, and 2.5–3.5 mg/L. The relative abundances of Euryarchaeota when the DO was 0.5–1, 1–2, and 2.5–3.5 mg/L (18.89%, 24.77%, and 26.22%, respectively) were lower than when the DO was 2–2.5 mg/L (39.82%). These results demonstrate that shifts in microbial community occur with different COD/N ratios or DO concentrations.
3.3. Process Performance
The COD/N ratio in domestic sanitary wastewater is normally lower than these specified values, where the removal of nitrogen was restricted by the lack of organic carbon sources [28]. When the COD/TN (Total Nitrogen) ratio in influent concentration was less than four, removing the nitrogen was difficult [29,30]. Carbon shortage was detrimental to denitrification [31]. Figure 8 demonstrates the removal result of carbon, nitrogen, and phosphorus under different COD/N ratios. Figure 8 shows that the removal rate of COD and TP was the highest when the COD/N ratio was 7:1. The average removal rate of COD and TP was about 81% and 66%, respectively, when the COD/N ratio was 7:1. A lack of nutrients in the aerobic tank or excessive sludge load could lead to sludge disintegration.
Figure 8 shows that, in every reactor, the ammonia–nitrogen concentration in effluent did not exceed 4 mg/L, and nitrites and nitrates were the main nitrogen oxide form. The NO3−–N and NO2−–N concentrations in the effluent gradually increased in the stable stage. In the stable stage, the accumulated NO3−–N and NO2−–N concentrations were 19.28, 19.19, 19.36, and 19.04 mg/L when the COD/N ratio was 4:1, 5:1, 7:1, and 10:1, respectively. As shown in Figure 8, the effluent NH4–N+ (average 2.38 mg/L) at a COD/N ratio of 7:1 were lower than when the COD/N ratio was 4:1 (2.59 mg/L), 5:1 (2.67 mg/L), and 10:1 (2.64 mg/L). In this batch of experiments, the ammonia oxidation efficiency exceeded 89%, with nitrites and nitrates as the main products. The treatment performance was the best when the COD/N ratio was 7:1, compared with all tested COD/N ratios.
Figure 9 demonstrates the removal result of carbon, nitrogen, and phosphorus under different DO concentrations. The water quality blackened for a long time in the aerobic pond due to lack of oxygen. The figure shows that the COD degradative efficiency was the lowest when operating at 0.5–1 mg/L. Operation at 2–2.5 mg/L DO produced the highest COD removal rates throughout the 15-day stabilization period of the study. The average removal rates of COD and TP were about 83% and 75%, respectively, when the DO was 2–2.5 mg/L. High DO concentration lead to the oxidation and disintegration of sludge. It was easier to sediment active sludge as a result of degassing.
The nitrogen content in wastewater was also important as it not only caused eutrophication of a water body, but excessive ammonia in wastewater affected the degradation capacity and microbial growth [32,33,34]. In every reactor, the ammonia–nitrogen concentration in effluent did not exceed 6 mg/L (Figure 9), and nitrites and nitrates were the main nitrogen oxide form. The effluent NO3−–N and NO2−–N concentrations gradually increased. In the stable stage, the accumulated NO3−–N and NO2−–N concentrations increased up to 18.97, 18.60, 18.19, and 18.88 mg/L at DO concentrations of 0.5–1, 1–2, 2–2.5, and 2.5–3.5 mg/L, respectively. As can be seen in Figure 9, the effluent NH4–N+ (average 3.61 mg/L) concentration at a DO of 2–2.5 mg/L was lower than when the DO was 0.5–1 (4.58 mg/L), 1–2 (4.29 mg/L), and 2.5–3.5 mg/L (3.84 mg/L). In this experiment, the ammonia oxidation efficiency exceeded 81% with nitrites and nitrates as the main products. The treatment performance was the best when the DO was 2–2.5 mg/L.
As the test site was located in Nyingtri in Tibet, the atmospheric pressure of Nyingtri was 706 hPa (measured value). The oxygen content at 3000 m above sea level (ASL) was only 79% of that at sea level. Therefore, the calculation method should be revised according to the actual situation when the sewage treatment plant calculates the aeration amount [35,36].
3.4. The Relationship among the Changes of Pollutants, Microbial Community Structure, and Species Diversity
The treatment performance can be explained by the relative OTU richness and evenness of microbial communities of activated sludge [19,27]. The community richness and evenness were two important factors that influenced the functional stability and general performance of WWTPs [37]. As Wittebolle [38] reported, communities with higher evenness have more functional resistance to environmental stress. According to Werner [39], in full-scale bioenergy systems, the methanogenic activity and substrate removal efficiency are correlated with community evenness. As shown in Figure 2, Figure 3 and Figure 4, the highest OTU richness and evenness of microbial communities was observed when the COD/N ratio was 7:1 or the DO was 2–2.5 mg/L. As shown in Table 3, the highest species diversity and evenness were also observed when the COD/N ratio was 7:1 or the DO was 2–2.5 mg/L. The treatment performance was the best of the four conditions studied when the COD/N ratio was 7:1 or the DO was 2–2.5 mg/L (Figure 8 and Figure 9). The shifts in microbial community with different operational conditions could be correlated with differential treatment performances. The treatment performance was the best when the COD/N ratio was 7:1 or the DO was 2–2.5 mg/L because the relative OTU richness and evenness were the highest at these values. The richness and evenness of the community may be important for determining the general performance of WWTPs.
4. Conclusions
In this study, we proved that the wastewater treatment performance was the most efficient when the COD/N ratio was 7:1 (average 81% COD and 66% TP removal efficiency) or the DO was 2–2.5 mg/L (average 83% COD and 75% TP removal efficiency) of the four different COD/N ratios (4:1, 5:1, 7:1, and 10:1) and DO concentrations (0.5–1, 1–2, 2–2.5, and 2.5–3.5 mg/L) tested in a plateau region. The ammonia oxidation efficiency exceeded 89% for different COD/N ratios or 81% for different DO concentrations with nitrites and nitrates as the main products. We also demonstrated that the relative abundance species evenness of the microbial community structure of activated sludge was the greatest when the COD/N ratio was 7:1 or the DO was 2–2.5 mg/L. The microbial community structure was shown to vary with different COD/N ratios or DO concentrations. Due to the difference in altitude between plateaus and plains, the calculation method of aeration in the sewage treatment plant should be adapted according to the actual situation. The analyses provided a better understanding of sewage treatment with different COD/N ratios or DO concentrations in plateau areas.
Author Contributions
Conceptualization, J.X.; data curation, J.X.; formal analysis, J.X.; investigation, J.X. and L.N.; methodology, J.X.; project administration, P.W. and Y.L.; resources, P.W. and Y.L.; supervision, P.W. and Y.L.; validation, J.X.; visualization, J.X.; writing—original draft, J.X.; writing—review and editing, J.X. and Z.X.
Funding
This research was funded by the National Natural Science Foundation of China (no. 51568059).
Conflicts of Interest
The authors declare no conflict of interest. The founding sponsors had no role in the design of the study; in the collection, analyses, or interpretation of data; in the writing of the manuscript, and in the decision to publish the results.
References
- Xu, J.; Wang, P.F.; Li, Y.; Niu, L.H. Performance and characterization of the microbial community structures in the activated sludge from wastewater treatment plant at high altitudes in Tibet of China. Desalin. Water. Treat. 2018, 106, 108–115. [Google Scholar] [CrossRef]
- Yang, M.; Liu, X.C.; Zhang, Y. Analysis of bacterial community structures in two sewage treatment plants with different sludge properties and treatment performance by nested PCR-DGGE method. J. Environ. Sci. 2007, 19, 60–66. [Google Scholar] [Green Version]
- Juanico, M.; Weinberg, H.; Soto, N. Process design of waste stabilization ponds at high altitude in Bolivia. Water Sci. Technol. 2000, 42, 307–313. [Google Scholar] [CrossRef]
- Strauss, E.A.; Lamberti, G.A. Regulation of nitrification in aquatic sediments by organic carbon. Limnol. Oceanogr. 2000, 45, 1854–1859. [Google Scholar] [CrossRef] [Green Version]
- Yun, Z.; Jung, Y.H.; Lim, B.R. The stability of nitrite nitrification with strong nitrogenous wastewater: Effects of organic concentration and microbial diversity. Water Sci. Technol. 2004, 49, 89–96. [Google Scholar] [CrossRef]
- Sharma, R.; Gupta, S.K. Influence of chemical oxygen demand to total Kjeldahl nitrogen ratio and sludge age on nitrification of nitrogenous wastewater. Water Environ. Res. 2004, 76, 155–161. [Google Scholar] [CrossRef]
- Luo, J.H.; Hao, T.W.; Wei, L. Impact of Influent COD/N Ratio on Disintegration of Aerobic Granular Sludge. Water Res. 2014, 62, 127–135. [Google Scholar] [CrossRef]
- Gieseke, A.; Purkhold, U.; Wagner, M.; Amann, R.; Schramm, A. Community structure and activity dynamics of nitrifying bacteria in a phosphate-removing biofilm. Appl. Environ. Microbiol. 2001, 67, 1351–1362. [Google Scholar] [CrossRef]
- Zielinska, M.; Bernat, K.; Cydzik-Kwiatkowsa, A.; Sobolewska, J.; Wojnowska-Baryla, I. Nitrogen removal from wastewater and bacterial diversity in activated sludge at different COD/N ratios or dissolved oxygen concentrations. J. Environ. Sci. 2012, 24, 990–998. [Google Scholar] [CrossRef]
- Kapley, A.; Tolmare, A.; Purohit, H.J. Role of oxygen in the utilization of phenol by Pseudomonas CF600 in continuous culture. J. Microbiol. Biotechnol. 2001, 17, 801–804. [Google Scholar] [CrossRef]
- Wells, G.F.; Park, H.D.; Yeung, C.H.; Eggleston, B.; Francis, C.A.; Criddle, C.S. Ammonia-oxidizing communities in a highly aerated full-scale activated sludge bioreactor: Betaproteobacterial dynamics and low relative abundance of Crenarchaea. Environ. Microbiol. 2009, 11, 2310–2328. [Google Scholar] [CrossRef]
- Garrido, J.M.; van Benthum, W.A.J.; van Loosdrecht, M.C.M.; Heijnen, J.J. Influence of dissolved oxygen concentration on nitrite accumulation in a biofilm airlift suspension reactor. Biotechnol Bioeng. 1997, 53, 168–178. [Google Scholar] [CrossRef]
- Ganigué, R.; López, H.; Balaguer, M.D.; Colprim, J. Partial ammonium oxidation to nitrite of high ammonium content urban landfill leachates. Water Res. 2007, 41, 3317–3326. [Google Scholar] [CrossRef] [PubMed]
- Pollice, A.; Tandoi, V.; Lestingi, C. Influence of aeration and sludge retention time on ammonium oxidation to nitrite and nitrate. Water Res. 2002, 36, 2541–2546. [Google Scholar] [CrossRef]
- Ma, Y.; Peng, Y.Z.; Wang, S.Y.; Yuan, Z.G.; Wang, X.L. Achieving nitrogen removal via nitrite in a pilot-scale continuous pre-denitrification plant. Water Res. 2009, 43, 563–572. [Google Scholar] [CrossRef]
- Chandra Yadav, T.; Khardenavis, A.A.; Kapley, A. Shifts in microbial community in response to dissolved oxygen Levels in activated sludge. Bioresour. Technol. 2014, 165, 257–264. [Google Scholar] [CrossRef] [PubMed]
- The State Environmental Protection Administration. Water and Wastewater Monitoring Analysis Method, 4th ed.; China Environmental Science Press: Beijing, China, 2002. (In Chinese) [Google Scholar]
- Xu, J.; Li, S.W. The Changes of Pollutants and Microbial Community Structures of the Activated Sludge in Response to Different Temperature Levels in Tibet of China. IOP Conf. Ser. Earth Environ. Sci. 2018, 189, 052080. [Google Scholar] [CrossRef]
- Xu, J.; Wang, P.F.; Li, Y.; Niu, L.H. Activated sludge culture domestication at high altitudes in Tibet of China. Desalin. Water. Treat. 2019, 142, 98–103. [Google Scholar] [CrossRef]
- Zhang, T.; Shao, M.F.; Ye, L. 454 pyrosequencing reveals bacterial diversity of activated sludge from 14 sewage treatment plants. ISME J. 2012, 6, 1137–1147. [Google Scholar] [CrossRef]
- Xia, S.; Duan, L.; Song, Y.; Li, J.; Piceno, Y.M.; Andersen, G.L.; Alvarez-Cohen, L.; Moreno-Andrade, I.; Huang, C.L.; Hermanowicz, S.W. Bacterial community structure in geographically distributed biological wastewater treatment reactors. Environ Sci. Technol. 2010, 44, 7391–7396. [Google Scholar] [CrossRef] [PubMed]
- Flint, H.J.; Scott, K.P.; Duncan, S.H.; Louis, P.; Forano, E. Microbial degradation of complex carbohydrates in the gut. Gut Microbes 2010, 3, 289–306. [Google Scholar] [CrossRef]
- Větrovský, T.; Steffen, K.T.; Baldrian, P. Potential of cometabolic transformation of polysaccharides and lignin in lignocellulose by soil actinobacteria. PLoS ONE 2014, 9, 1–9. [Google Scholar]
- Gao, F.; Nan, J.; Zhang, X.H.; Wu, T.H. A dynamic modelling of nutrient metabolism in a cyclic activated sludge technology (CAST) for treating low carbon source wastewater. Environ. Sci. Pollut. Res. 2017, 24, 17016–17030. [Google Scholar] [CrossRef] [PubMed]
- LeCleir, G.R.; Buchan, A.; Hollibaugh, J.T. Chitinase gene sequences retrieved from diverse aquatic habitats reveal environment-specific distributions. Appl. Environ. Microbiol. 2004, 70, 6977–6983. [Google Scholar] [CrossRef]
- Zang, K.; Kurisu, F.; Kasuga, I.; Furumai, H.; Yagi, O. Analysis of the phylogenetic diversity of estrone-degrading bacteria in activated sewage sludge using microautoradiography–fluorescence in situ hybridization. Syst. Appl. Microbiol. 2008, 31, 206–214. [Google Scholar] [CrossRef] [PubMed]
- Niu, L.H.; Li, Y.; Wang, P.F. Understanding the linkage between elevation and activated sludge bacterial community along a 3600 m elevational gradient in China. Appl. Environ. Microbiol. 2015, 81, 6567–6576. [Google Scholar] [CrossRef] [PubMed]
- Ryu, H.D.; Lee, S.I. Comparison of 4-stage biological aerated filter (BAF) with MLE process in nitrogen removal from low carbon-to-nitrogen wastewater. Environ. Eng. Sci. 2009, 26, 163–170. [Google Scholar] [CrossRef]
- Her, J.J.; Huang, J.S. Influences of carbon source and C/N ratio on nitrate/nitrite denitrification and carbon breakthrough. Bioresour. Technol. 1995, 54, 45–51. [Google Scholar] [CrossRef]
- Liu, H.B.; Yang, C.Z.; Pu, W.H. Removal of nitrogen from wastewater for reusing to boiler feed-water by an anaerobic/aerobic/membrane bioreactor. Chem. Eng. J. 2008, 140, 122–129. [Google Scholar] [CrossRef]
- Sheng, P.S.; Carles, P.N.; Brian, M. Effective Biological Nitrogen Removal Treatment Processes for Domestic Wastewaters with Low C/N Ratios: A Review. Environ. Eng. Sci. 2010, 27, 111–126. [Google Scholar]
- Puigagut, J.; Salvadó, H.; García, J. Short-term harmful effects of ammonia nitrogen on activated sludge microfauna. Water Res. 2005, 39, 4397–4404. [Google Scholar] [CrossRef]
- Khardenavis, A.A.; Kapley, A.; Purohit, H.J. Simultaneous nitrification and denitrification by diverse Diaphorobacter sp. Appl. Microbiol. Biotechnol. 2007, 77, 403–409. [Google Scholar] [CrossRef] [PubMed]
- Rajagopal, R.; Massé, D.I.; Singh, G. A critical review on inhibition of anaerobic digestion process by excess ammonia. Bioresour. Technol. 2013, 143, 632–641. [Google Scholar] [CrossRef]
- Shen, H.Y.; Guo, Y.; Wang, Y.Y.; Shen, Y.T. Case study on engineering projects of sewage treatment plants in plateau region. Water. Pure Technol. 2014, 33, 9–12. (In Chinese) [Google Scholar]
- Cui, J. Discussion on the calculation of air supply for sewage treatment plant in plateau region. Water Wastewater Eng. 2012, 38, 41–45. (In Chinese) [Google Scholar]
- Johnson, D.R.; Lee, T.K.; Park, J.; Fenner, K.; Helbling, D.E. The functional and taxonomic richness of wastewater treatment plant microbial communities are associated with each other and with ambient nitrogen and carbon availability. Environ. Microbiol. 2015, 17, 4851–4860. [Google Scholar] [CrossRef]
- Wittebolle, L.; Marzorati, M.; Clement, L.; Balloi, A.; Daffonchio, D.; Heylen, K.; De Vos, P.; Verstraete, W.; Boon, N. Initial community evenness favours functionality under selective stress. Nature 2009, 458, 623–626. [Google Scholar] [CrossRef] [PubMed]
- Werner, J.J.; Knights, D.; Garcia, M.L.; Scalfone, N.B.; Smith, S.; Yarasheski, K.; Cummings, T.A.; Beers, A.R.; Knight, R.; Angenent, L.T. Bacterial community structures are unique and resilient in full-scale bioenergy systems. Proc. Natl. Acad. Sci. USA 2011, 108, 4158–4163. [Google Scholar] [CrossRef] [Green Version]
Figure 1.
The cyclic activated sludge system (CASS) process unit.

Figure 2.
Relative abundance of the operational taxonomic unit () richness and evenness of bacterial communities of activated sludge.
Figure 2.
Relative abundance of the operational taxonomic unit () richness and evenness of bacterial communities of activated sludge.

Figure 3.
Relative abundance of the OTU richness and evenness of fungal communities of activated sludge.
Figure 3.
Relative abundance of the OTU richness and evenness of fungal communities of activated sludge.

Figure 4.
Relative abundance of the OTU richness and evenness of archaeal communities of activated sludge.
Figure 4.
Relative abundance of the OTU richness and evenness of archaeal communities of activated sludge.

Figure 5.
Relative abundance of bacterial phyla of activated sludge.

Figure 6.
Relative abundance of fungal phyla of activated sludge.

Figure 7.
Relative abundance of archaeal phyla of activated sludge.

Figure 8.
The effluent parameter NH4–N+, NO3−–N, and NO2−–N, COD and total phosphorus (TP) removal efficiency under different COD/N ratios.
Figure 8.
The effluent parameter NH4–N+, NO3−–N, and NO2−–N, COD and total phosphorus (TP) removal efficiency under different COD/N ratios.


Figure 9.
The effluent parameter, NH4–N+, NO3−–N, and NO2−–N, COD, and TP removal efficiency under different DO concentrations.
Figure 9.
The effluent parameter, NH4–N+, NO3−–N, and NO2−–N, COD, and TP removal efficiency under different DO concentrations.


Table 1.
The composition of synthetic sewage (chemical oxygen demand (COD/N), H4+–N = 4/1, 5/1, 7/1 and 10/l).
Table 1.
The composition of synthetic sewage (chemical oxygen demand (COD/N), H4+–N = 4/1, 5/1, 7/1 and 10/l).
| Species | Composition | Concentration (mg/L) | Confect |
|---|---|---|---|
| Organics | COD | 120, 150, 210, 300 | glucose |
| Nitrogen compounds | NH4+–N | 30 | NH4CI |
| Phosphorus compounds | TP | 5 | K2HPO4 |
| Other additions and trace elements (mg/L) | MgSO4·7H2O(12); FeSO4·7H2O(10); CaCl2(30); NaHCO3(50); pH (7.2–8.4); H3BO3(0.15); CoCl2·6H2O(0.15); CuSO4·6H2O(0.03); FeCl3·6H2O(1.5); KI(0.03); MnCl2·2H2O(0.12); (NH4)2Mo7O24·2H2O(0.06); ZnSO4·7H2O(0.12) | ||
Table 2.
The composition of synthetic sewage (dissolved oxygen (DO) = 0.5–1, 1–2, 2–2.5 and 2.5–3.5 mg/L).
Table 2.
The composition of synthetic sewage (dissolved oxygen (DO) = 0.5–1, 1–2, 2–2.5 and 2.5–3.5 mg/L).
| Species | Composition | Concentration (mg/L) | Confect |
|---|---|---|---|
| Organics | COD | 210 | glucose |
| Nitrogen compounds | NH4+–N | 30 | NH4CI |
| Phosphorus compounds | TP | 5 | K2HPO4 |
| Other additions and trace elements (mg/L) | MgSO4·7H2O(12); FeSO4·7H2O(10); CaCl2(30); NaHCO3(50); pH (7.2–8.4); H3BO3(0.15); CoCl2·6H2O(0.15); CuSO4·6H2O(0.03); FeCl3·6H2O(1.5); KI(0.03); MnCl2·2H2O(0.12); (NH4)2Mo7O24·2H2O(0.06); ZnSO4·7H2O(0.12) | ||
Table 3.
The Shannon index values with different COD/N ratios or DO concentrations.
| Shannon Index | CN-1 | CN-2 | CN-3 | CN-4 | DO-1 | DO-2 | DO-3 | DO-4 |
|---|---|---|---|---|---|---|---|---|
| bacterial | 2.27 | 1.93 | 3.29 | 2.39 | 2.62 | 3.23 | 3.37 | 2.61 |
| fungal | 1.26 | 2.53 | 1.10 | 1.52 | 0.13 | 0.38 | 1.13 | 0.38 |
| archaeal | 2.21 | 2.22 | 3.38 | 2.17 | 3.05 | 3.06 | 3.37 | 2.87 |
© 2019 by the authors. Licensee MDPI, Basel, Switzerland. This article is an open access article distributed under the terms and conditions of the Creative Commons Attribution (CC BY) license (http://creativecommons.org/licenses/by/4.0/).
Share and Cite
MDPI and ACS Style
Xu, J.; Wang, P.; Li, Y.; Niu, L.; Xing, Z. Shifts in the Microbial Community of Activated Sludge with Different COD/N Ratios or Dissolved Oxygen Levels in Tibet, China. Sustainability 2019, 11, 2284. https://doi.org/10.3390/su11082284
AMA Style
Xu J, Wang P, Li Y, Niu L, Xing Z. Shifts in the Microbial Community of Activated Sludge with Different COD/N Ratios or Dissolved Oxygen Levels in Tibet, China. Sustainability. 2019; 11(8):2284. https://doi.org/10.3390/su11082284
Chicago/Turabian StyleXu, Jin, Peifang Wang, Yi Li, Lihua Niu, and Zhen Xing. 2019. "Shifts in the Microbial Community of Activated Sludge with Different COD/N Ratios or Dissolved Oxygen Levels in Tibet, China" Sustainability 11, no. 8: 2284. https://doi.org/10.3390/su11082284
Note that from the first issue of 2016, this journal uses article numbers instead of page numbers. See further details here.