Sustainable Reuse of Groundwater Treatment Iron Sludge for Organic Matter Removal from River Neris Water

1
Department of Chemistry and Bioengineering, Vilnius Gediminas Technical University, Sauletekio ave. 11, 10223 Vilnius, Lithuania
2
“Infes technologijos”, UAB, Verkių str. 34b, 08223 Vilnius, Lithuania
3
Department of Mechanics and Materials Engineering, Vilnius Gediminas Technical University, Sauletekio ave. 11, 10223 Vilnius, Lithuania
*
Author to whom correspondence should be addressed.
Sustainability 2019, 11(3), 639; https://doi.org/10.3390/su11030639
Submission received: 17 December 2018
/
Revised: 22 January 2019
/
Accepted: 22 January 2019
/
Published: 26 January 2019
(This article belongs to the Special Issue Water-Energy Sustainable Urban Development)
Abstract
:The most important advances in sustainability in the water industry are focused on the reuse of water treatment sludge. The Antaviliai Water Supply Plant, which is located in Lithuania, treats groundwater by removing iron and manganese from it. This technology does not produce water waste, as the iron sludge is used for recycling. In this study, iron sludge received from groundwater treatment is used to remove natural organic matter from river Neris water, which can be used as drinking water. Twelve doses (from 1 to 6 g/L and from 0.1 g/L to 0.9 g/L) of iron sludge powder, with acid and without it, were used. The most effective removal of organic compounds (55.51%) and reduction in water colour (53.12%) were observed when 0.3 g of iron sludge powder and 8 ml of 0.95% H2SO4 solution were added to the tested water. It was found that the use of a conventional coagulant (Al2(SO4)3*17H2O), with and without iron sludge powder, decreased the concentration of organic compounds and water colour from 2.8 to 28.2% compared with the use of a pure coagulant (Al2(SO4)3*17H2O) alone.
1. Introduction
One of the 2030 Agenda for Sustainable Development goals of the United Nations is to achieve the environmentally sound management of wastes throughout their lifecycle by 2020. In accordance with international frameworks, the aim is to significantly reduce their release into the air, water, and soil in order to minimize their adverse impacts on human health and the environment [1]. Europe 2020 is the European Union (EU)’s growth strategy for the circular economy, which offers an opportunity to reinvent an economy by making it more sustainable and competitive. The reuse of water treatment iron sludge may allow us to innovate new materials and processes that can be an integral part of the circular economy. The actions to promote reuse and stimulate symbiosis include turning water treatment iron sludge into a raw material for organic matter removal from water [2].
Natural organic matter (NOM) is present in all surface waters, shallow groundwater, and soil pore waters. NOM is a group of heterogeneous macromolecules with aromatic and aliphatic hydrocarbon structures of varying molecular weight/size, hydrophobicity, and functional groups [3,4]. Organic compounds condition the taste and smell of drinking water that is not acceptable for consumption [5]. During the disinfection process, NOM forms carcinogenic disinfection by-products (such as haloacetic acid and trihalomethanes) by reacting with disinfectants/oxidants [6]. Elevated levels of disinfection by-products (DBPs) may pose health risks [7]. NOM deteriorates the performance of sorption processes with granular activated carbon and membrane filtration [8], has an influence on pipeline corrosion [9], and has an influence on bacterial regrowth in distribution systems [10]. For these reasons, NOM should be removed from drinking water. According to the European Union Council Directive 98/83/EC and the Lithuanian hygiene norm HN24:2017 “Drinking Water Safety and Quality Requirements”, the total amount of organic matter (the permanganate index (PI) determines the amount of organic matter) should not exceed 5.0 mgO2/L.
The most common technologies used for NOM removal are coagulation [11,12,13], coagulation and hallow-fibre nanofiltration [14], nanofiltration [15], biofiltration [3,4,16], ion exchange [17,18], various oxidation processes [19], carbon nanotubes [20], and adsorption by granulated active carbon [21,22].
Coagulation is the most common method for NOM removal. Iron and aluminium salts are used in large amounts, and play an essential role in the production of drinking water and the removal of NOM, colour, and turbidity. A large amount of iron-rich drinking water treatment sludge is produced during coagulation. That sludge requires handling and ultimate disposal through, e.g., landfill [23]. The term “water treatment sludge” (further referred to as the WTS) covers all wastes produced during the treatment of water in the WTS, and the properties of the WTS depend typically on the quality of the raw water and the applied treatment method [24]. The most important advances in sustainability in the water industry are focused on minimizing energy usage and reusing wastewater sludge. The conventional coagulant treatment has a considerable impact on the improvement of sustainability through coagulant recovery, which enables the atoms of coagulant metals to be repeatedly recycled and reused [25]. Different techniques have been adopted to recover iron or aluminium salts from the precipitate: acid treatment, alkaline treatment, ion exchange with a cation resin [26], liquid ion exchange [27], and pressure-driven membranes, such as ultrafiltration and electrodialysis processes [25,27]. Ahmad and colleagues [24] present a summary of the WTS reuse options. WTS can be used: (1) for coagulant recovery and reuse; (2) as a coagulant in wastewater treatment; (3) as an adsorbent for contaminants and heavy metals in wastewater [28]; (4) as a substrate in constructed wetlands; (5) in sewage sludge dewatering; (6) in cement production; (7) in manufacturing lightweight aggregates; (8) in brick and ceramic production; (9) as a raw material for concrete and mortar; and (10) in agricultural practices and other land-based activities. Other researchers have found that the high iron concentration in drinking water sludge has the potential to be beneficially reused in sewer networks for sulphide control [29]. Yoo and colleagues [30] reused iron sludge as an iron source for a Fenton reaction. Many researchers have found that iron-based adsorbents generally have a higher arsenic adsorptive capacity and efficiency [31].
In Lithuania, which is rich in underground water resources, water utilities supply only groundwater to residents. However, the iron concentration in 87% of groundwater resources exceeds the permissible hygiene rates [32]. Although iron does not have a significant impact on human health, iron compounds should be removed from the groundwater because when soluble ferrous (bivalent) iron compounds interact with oxygen, insoluble ferric (trivalent) compounds, which fall into sediments, are formed. As a result, the water’s turbidity increases, it takes on an unpleasant metallic taste, and iron compounds give the water a brownish colour. Iron bacteria develop in the accumulated iron, and, as a result, sludge is formed [33]. During water pressure fluctuation in the system, more ferruginous sediments come from water taps [34]. Due to these aesthetic issues, the World Health Organization recommends that the maximum permissible iron concentration in drinking water should not exceed 300 μg/L. According to the European Union Council Directive 98/83/EC and the Lithuanian hygiene norm HN24:2017 “Drinking Water Safety and Quality Requirements”, the total amount of iron should not exceed 200 μg/L. In drinking water treatment plants, these ions and compounds are efficiently removed by aeration and filtration through granular media filters [35,36] or by other conventional technologies.
The Antaviliai Water Supply Plant is located in the north-eastern part of Vilnius, the capital of Lithuania. This plant is the largest drinking water treatment plant in Lithuania, and removes iron and manganese from the water. The facilities apply non-reagent technologies for water aeration and one-stage open filtration with a quartz sand filter. Drinking water is saturated with oxygen from the air only. With this technology, it is not necessary to use extra chemical reagents. This technology does not produce water damage waste. The backwash water is precipitated, filtrated, and then restored back to the water preparation stream, where it is filtered again and then supplied. Iron and manganese hydroxide sludge is dehumidified using a chamber draining press, then stored and transported for recycling. This WTS is used in the production of ceramics.
The aim of this study is to sustainably reuse iron sludge, received from groundwater treatment, to remove NOM from river Neris water, which can be used as drinking water, and to find the most effective dose of WTS. While studying the works of other authors, we became acquainted with various ways to use iron sludge in coagulation; however, we found no information on how to use iron sludge, received from groundwater treatment. The only known uses for iron sludge are in landfill and the ceramics industry. This study provides a sustainable way to reuse groundwater treatment iron sludge.
2. Materials and Methods
2.1. Materials
Water samples for testing were taken from the Neris River. The River Neris is the second largest river (510 km) in Lithuania. Neris is the largest basin (24,942 km2) of the River Nemunas. The headwaters of the stream are found in Belarus and reach the peripheries of Lithuania as a mature river, the length of which is 275 km with a catchment area covering 10,961 km2. [37]. Neris water is rich in organic matter. The water quality indicators are presented in Table 1.
The water samples were stored in plastic 20-litre containers, which were filled up to the top in order to avoid contact with the air, at 4 °C for as short a time as possible before analysis. The handling of water samples followed ISO (International Organization for Standardization) standard procedures for refrigerated storage under laboratory conditions according to Water Quality–Sampling—Part 1: Guidance on the design of sampling programmes and sampling techniques (ISO 5667–1:2006). All 20-litre plastic sampling containers were properly washed with distillate water before use. All sampling bottles and caps were rinsed three times using water taken from the sampling sites.
The suppressed iron sludge was taken from the JSC (Joint-Stock Company) Vilniaus Vandenys drinking water treatment plant. The iron sludge composition data are presented in Table 2.
The iron sludge was transported from the water treatment plant. They are humid and contained 55% water. To evaporate this water, the iron sludge was dried in a dryer at 105 °C for 3 hours. The sludge was then crushed and sieved to obtain a homogenous powder (Figure 1).
2.2. Organic Matter Removal Procedure
According to an analysis of the scientific literature and from practical knowledge, six doses (1 g/L; 2 g/L; 3 g/L; 4 g/L; 5 g/L; and 6 g/L) of iron sludge powder were selected for the first stage of research, and another six doses (0.1 g/L; 0.3 g/L; 0.5 g/L; 0.7 g/L; 0.8 g/L; and 0.9 g/L) of iron sludge powder were selected for the second one. Different amounts (0 mL; 3 mL; 6 mL; and 8 mL) of sulfuric acid (H2SO4 0.95%) were added to the samples in the coagulation process. To determine the most efficient dose of iron sludge powder, an identification of the organic compounds and the colour of the water should be carried out after some contact time. The laboratory experiment was performed by mixing 1 L of sample with an iron sludge powder dose for 1 min at the speed of 200 rpm, and then for 10 min at the speed of 50 rpm; after this, it was left to settle for 10 min. This regime was selected experimentally and based on the recommendations in the scientific literature [39]. After mixing, water was filtered through 0.45-μm filters and a quantitative analysis was performed. Each test was performed three times. The conditions for this study are given in Table 3.
Further studies were conducted by using a traditional coagulant (Al2 (SO4)3*17H2O). Doses of 10 mgAl/L, 20 mgAl/L, and 30 mgAl/L (quantities are calculated in milligrams of pure aluminium to 1 litre of water) were used for the study. The pure coagulant and the coagulant with iron sludge powder were added to the tested water in doses of 0.1 g and 0.5 g, respectively. The above-described procedures were used for the coagulation process. The conditions for this study are given in Table 4.
After filtration, tests of water quality were performed.
2.3. Analytical Methods
The water quality assessment tests were performed based on the following methodologies.
The permanganate index (PI) was determined according to LST EN ISO 8467:2000 “Water quality—Determination of permanganate index”. The tube was filled by a pipette of 25 ± 0.25 mL of the test sample, and 5 ± 0.5 mL of sulfuric acid was added and mixed gently with stirring. The tube was placed in a boiling water bath for 10 ± 2 min. Then, 5 ± 0.05 mL of titrated potassium permanganate solution was added and the time was labelled. After 10 min, 5 ± 0.05 mL of standard titrated sodium oxalate solution was added and the solution was allowed to fade. Then, the solution was titrated, while hot, with a titrated solution of potassium permanganate to a light pink colour that did not disappear after about 30 s.
The colour was determined according to ISO 7887:2012 “Water quality—Examination and determination of colour”. A Genesys 10Vis spectrophotometer, a 50 mm optical cell, a Sartorius vacuum pump, and membrane nitrate cellulose filters (pore size, 0.45 µm) were used to determine the colour of the water. The water sample was filtered through a membrane filter, and the colour was measured on the spectrophotometer at 436 nm. Optically clear water (deionized water, twice filtered through a 0.1-μm membrane filter) was used for comparison and calibration.
The pH was determined according to LST ISO 10523:2008 “Water quality—Examination of water pH”. The pH value can change rapidly due to chemical, physical, and biological processes in the water sample. For this reason, pH was measured as soon as possible. The electrode was washed with distilled water and sample water and then immersed in the sample. The solution was stirred, and the pH was read off after mixing.
The results of the analysis are expressed as the average concentration of three samples when the distribution does not exceed 5%. When the distribution was higher, the tests were repeated.
3. Results and Discussion
3.1. Removal of Organic Matter Using Larger Doses of Iron Sludge Powder
Figure 2 shows the concentration of organic compounds expressed as the permanganate index, depending on the different doses of iron sludge powder (1, 2, 3, 4, 5, and 6 g/L).
Adding 1, 2, and 3 g of acid-free iron sludge powder to the tested water did not decrease the permanganate index. Following the introduction of more iron sludge powder (4, 5, and 6 g) into the water, the organic matter amount was reduced, but not to the HN24:2017 “Drinking Water Safety and Quality Requirements” concentration (PI 5.00 mgO2/L). The amount of organic matter in the tested water decreased upon the addition of 4 g, 5 g, and 6 g of acid-free iron sludge powder to 5.24%, 9.23%, and 24.09%, respectively. The adsorption process took place by the incorporation of iron sludge powders, the majority of which contained Fe(OH)3. However, to remove enough organic matter to reach the HN24:2017 “Drinking Water Safety and Quality Requirements” limit (PI 5.00 mgO2/L), one has to add more than 6 g of iron sludge powder. Furthermore, the same doses of iron sludge powder were added to the tested water together with 3 mL of 0.95% H2SO4 acid solution. Figure 2 shows that the reduction in the amount of organic matter in the tested water was insufficient to reach the permissible concentration (PI 5.00 mgO2/L) under the HN24:2017 “Drinking Water Safety and Quality Requirements” standards. The coagulation process only began when 1 g of iron sludge powder and 3 mL of 0.95% H2SO4 solution were added to the tested water. The amount of organic matter decreased by 1.49%. The amount of organic matter in the tested water decreased with the increase in the amount of acid up to 6 mL and the addition of 1 g and 2 g of iron sludge powder. The amount of organic matter in the tested water decreased by 15.86% and 6.82%, respectively. However, a reduction in the organic matter amount down to that allowed by HN24:2017 was not achieved. By further increasing the amount of acid to 8 mL, the amount of organic matter was found to decrease with 1 g and 2 g of iron sludge powder. The organic matter amount in the tested water decreased by 36.18% and 8.05%, respectively.
The dependency of water colour on different iron sludge powder doses (1; 2; 3; 4; 5; and 6 g/L) is shown in Figure 3.
Adding 1, 2, and 3 g of acid-free iron sludge powder to the tested water did not result in a reduction in the colour of the water. Furthermore, more iron sludge powder (4, 5, and 6 g) was added to the tested water. The colour of the water decreased, but not to the permissible level under HN24:2017 “Safety and Quality Requirements for Drinking Water” (30 mgPt/L). The water colour in the tested water decreased upon the addition of 4 g, 5 g, and 6 g of acid-free iron sludge powder to 5.24%, 9.23%, and 24.09%, respectively. Furthermore, the same doses of iron sludge powder were added to the tested water together with 3 mL of 0.95% H2SO4 acid solution. Figure 3 shows that the water colour has not been reduced to the permissible level under the HN24:2017 “Drinking Water Safety and Quality Requirements” standards. The water colour was reduced by 1.37% when 1 g of iron sludge powder and 3 mL of 0.95% H2SO4 solution were added to the tested water. When the amount of iron sludge powder was increased, the colour of the water began to increase. With the increase in the acid content up to 6 mL, the colour of the test water decreased when 1 g and 2 g of iron sludge powder were added to the tested water by 14.90% and 6.40%, respectively. However, a reduction in the water colour down to that allowed in HN24:2017 was not achieved. When the amount of iron sludge powder was increased up to 6 g, the colour of the water began to intensively grow. Further, when the amount of acid was increased to 8 ml and 1 g and 2 g of iron sludge powder were added to the water, the colour decreased by 34.04% and 7.56%, respectively. However, a reduction in the water colour down to that allowed by HN24:2017 was not achieved. When the amount of iron sludge powder was increased, the colour of the water began to intensively increase.
Similarly, different iron sludge powder and sulfuric acid doses were used to measure pH values. The results of the studies are presented in Table 5.
The results show that the pH of the tested water is 7.70–7.72 with no acid, and the pH decreases with an increasing amount of acid. When the same amount of acid and different amounts of iron sludge powder were added, it was observed that the pH increased as the amount of iron sludge powder increased. After adding the highest amount of acid (8 mL) and the lowest amount of iron sludge powder (1 g), the pH decreased to 6.50. This means that, when using all of these doses, the pH of the tested water corresponds to the permissible HN24:2017 Drinking Water Safety and Quality Requirements pH (6.5–9.5).
An analysis of the results shows that the use of iron sludge powder alone results in the adsorption of organic compounds. Adsorption efficiency is achieved by an increase in the amount of iron sludge powder. Increasing the amount of acid-free iron sludge powder reduces the concentration of organic compounds and also decreases the water colour intensity. The adsorption process occurred when 4, 5, and 6 g of iron sludge powder were added to the water. However, such adsorbent doses were still not very effective in reducing the levels of organic compounds and water colour to the permissible values of HN24:2017 “Drinking Water Safety and Quality Requirements” (PI 5.00 mgO2/L and 30 mgPt/L, respectively). The coagulation process was triggered with the addition of acid to the powder. The coagulation process was more effective when using lower doses of iron sludge powder (1 and 2 g) and larger amounts of acid (6 and 8 mL). When using these amounts of iron sludge powder and acid, the concentration of organic compounds and the colour of the water decreased. The most effective coagulation process took place when 1 g of iron sludge powder and 8 mL of 0.95% H2SO4 solution were added to the tested water. The increase in iron doses and acid levels did not result in the removal of organic matter, as the acid dissolved large amounts of iron and neither sorption nor coagulation processes occurred. When adding 3, 4, 5, and 6 g of iron and 3, 6, and 8 mL of acid to the water, the colour of the water began to increase. This is because the acid dissolved the iron and the amount of iron in the water increased, which resulted in the water being coloured not only by organic compounds, but also by soluble iron compounds, which increased the colour of the water compared to the colour of the untreated water. Although the concentration of organic matter and the water colour were somewhat reduced, the tests with 1–6 g doses of iron sludge powder and different amounts of acid did not result in a reduction of the organic matter concentration and the water colour down to the permissible limits according to HN24:2017 “Drinking Water Safety and Quality Requirements” (PI 5.00 mgO2/L and 30 mgPt/L, respectively).
3.2. Removal of Organic Matter Using Smaller Doses of Iron Sludge Powder
As the coagulation process was more efficient with smaller doses of iron sludge powder (1 and 2 g), we decided to perform the tests using doses of 0.1 g/L, 0.3 g/L, 0.5 g/L, 0.7 g/L, 0.8 g/L, and 0.9 g/L. Figure 4 shows the concentration of organic compounds expressed as the permanganate index, depending on the different doses of iron sludge powder (0.1; 0.3; 0.5; 0.7; 0.8; and 0.9 g/L).
Figure 4 demonstrates that, when using 0.1, 0.3, 0.5, 0.7, 0.8, and 0.9 g/L iron-free acid doses, the organic matter concentration remained completely unchanged and a reduction to acceptable levels under the HN24:2017 “Safety and Quality Requirements for Drinking Water” was not achieved. Adding 3 mL of 0.95% H2SO4 acid solution to the water samples reduced the organic matter concentration when 0.1 g/L, 0.3 g/L, and 0.5 g/L of iron sludge powder were added to the tested water by 26.86%, 10.30%, and 1.61%, respectively. However, a reduction of the organic matter concentration to the permissible level under the HN24:2017 “Drinking Water Safety and Quality Requirements” (PI 5.00 mgO2/L) was not achieved. Adding 6 mL of 0.95% H2SO4 acid solution to the water samples reduced the organic matter concentration with all iron sludge powder doses. The amount of organic matter in the tested water decreased by 27.75%, 31.07%, 34.29%, 32.68%, 29.36%, and 35.90% for the 0.1 g/L, 0.3 g/L, 0.5 g/L, 0.7 g/L, 0.8 g/L, and 0.9 g/L iron sludge powder doses, respectively. However, a reduction in the concentration of organic matter to HN24:2017 levels has not been achieved. Increasing the acid content up to 8 mL in the samples decreased the concentration of organic matter with all iron sludge powder doses. The amount of organic matter in the test water decreased by 45.75%, 55.51%, 52.28%, 52.19%, 47.36%, and 44.14% for the 0.1 g/L, 0.3 g/L, 0.5 g/L, 0.7 g/L, 0.8 g/L, and 0.9 g/L iron sludge powder doses, respectively. The most effective coagulation process occurred when 0.3 g of iron sludge powder and 8 mL of 0.95% H2SO4 solution were added to the tested water. Using this combination, we managed to reduce the concentration of organic substances below the permissible HN24:2017 limit (PI 5.00 mgO2/L).
Figure 5 shows the dependency of the water colour on the different iron sludge powder doses (0.1; 0.3; 0.5; 0.7; 0.8; and 0.9 g/L).
Figure 5 demonstrates that the use of 0.1, 0.3, 0.5, 0.7, 0.8, and 0.9 g/L iron-free acid doses did not reduce the colour of the water; on the contrary, the increase in the iron sludge powder quantity increased the colour of the water. Adding 3 mL of 0.95% H2SO4 acid solution to the water samples resulted in a reduction in the colour of the water when 0.1 g/L, 0.3 g/L, and 0.5 g/L of iron sludge powder were added to the tested water. The water colour decreased by 26.86%, 10.30%, and 1.61%, respectively. However, a reduction in the water colour to the permissible HN24:2017 “Drinking Water Safety and Quality Requirements” limit (30 mgPt/L) was not achieved. When adding 6 mL of 0.95% H2SO4 acid solution to the water samples, the water colour decreased with all iron sludge powder doses. The water colour decreased by 26.55%, 29.69%, 32.81%, 31.25%, 28.11%, and 34.37% for the 0.1 g/L, 0.3 g/L, 0.5 g/L, 0.7 g/L, 0.8 g/L, and 0.9 g/L iron sludge powder doses, respectively. However, a reduction in the water colour to the allowed HN24:2017 limit was not achieved. When the amount of acid in the sample was increased to 8 ml, the water colour, depending on the iron sludge powder quantity, was further reduced. The water colour decreased by 43.74%, 53.12%, 50.00%, 49.95%, 45.32%, and 42.18%, for the 0.1 g/L, 0.3 g/L, 0.5 g/L, 0.7 g/L, 0.8 g/L, and 0.9 g/L iron sludge powder doses, respectively. The water colour was effectively reduced to below the acceptable threshold (30 mgPt/L) for the HN24:2017 “Drinking Water Safety and Quality Requirements” when 0.3, 0.5, and 0.7 g of iron sludge powder and 8 mL of 0.95% H2SO4 acid solution were added to the tested water.
Similarly, different iron sludge powder and sulfuric acid doses were used to measure pH values. The results of the studies are presented in Table 6.
The results show that the pH of the test water is 7.68–7.73 with no acid, and the pH decreases with an increasing amount of acid. When the same amount of acid and different amounts of iron sludge powder were added, it was observed that the pH increased as the iron sludge powder amount increased. After the addition of the lowest amount of acid (3 mL), the pH of the tested water decreased to 7.07–7.46, which corresponds to the permissible HN24:2017 “Drinking Water Safety and Quality Requirements” (pH 6.5–9.5). After the addition of a higher amount of acid (6 mL), the pH of the water was reduced to 6.35–6.62. The addition of 0.7, 0.8, and 0.9 g/L of iron sludge powder still meets the permissible limits for HN24:2017 “Drinking Water Safety and Quality Requirements”; however, the addition of 0.1, 0.3, and 0.5 g/L iron sludge powder no longer complies with the permissible HN24:2017 “Drinking Water Safety and Quality Requirements”. The addition of the highest amount of acid (8 mL), which most effectively removes organic matter, reduces the pH to 3.78–5.48. This means that, when using all of these doses, the pH of the test water does not comply with the permissible HN24:2017 “Drinking Water Safety and Quality Requirements” (pH 6.5–9.5).
It was observed that small quantities of acid-free iron sludge powder, when used for the removal of organic compounds from water and the reduction of the water colour, did not yield the desired result. Such powder quantities are insufficient. The removal intensified with the addition of the acid into the sample. The tests showed that 3 mL of acid is insufficient to intensify the removal of organic compounds and the reduction in the water colour. However, with higher amounts of acid (6 and 8 mL), the efficiency of the elimination of organic compounds and the reduction in the colour of the water significantly increased. Six millilitres (6 mL) of acid is not sufficient to reduce the concentration of organic compounds and the colour of the water to the acceptable levels under HN24:2017; however, when using 8 ml of acid and the corresponding iron sludge powder doses, the concentration of organic compounds and the water colour were reduced to the permissible level under the HN24:2017 “Drinking Water Safety and Quality Requirements” (5.00 mgO2/L and 30 mgPt/L, respectively). However, it should be noted that increasing the acid content reduces the pH of the water to 3.78–5.48. This means that using these dosages will require additional alkalis to ensure that the water complies with the permissible HN24:2017 Drinking Water Safety and Quality Requirements (pH 6.5–9.5).
3.3. Removal of Organic Matter Using an Aluminium Sulphate Coagulant and Iron Sludge Powder Together
Further to the removal of organic compounds from water using different doses of iron sludge powder, tests using aluminium sulphate as a coagulant with and without iron sludge powder were also performed. Figure 6 shows the dependency of the permanganate index on different amounts of aluminium coagulant with iron sludge powder.
The results presented in Figure 6 demonstrate that the concentration of organic matter decreased by 13.2% when using 10 mgAl/L of coagulant aluminium sulphate. Using 10 mgAl/L of coagulant with 0.1 g of iron sludge powder reduced the concentration of organic compounds by 37.7%. When the dose of iron sludge powder was increased to 0.5 g, the concentration of organic compounds was reduced by 30%. However, using such coagulant and iron sludge powder doses, the concentration of organic compounds was still above the HN24:2017 levels. When 20 mlAl/L of coagulant was added, the concentration of organic matter was reduced by 47.1%, but still exceeded the norm of 5.00 mgO2/L under HN24:2017. Using 20 mgAl/L of coagulant with 0.1 g of iron sludge powder, the concentration of organic compounds was reduced by 48.9% and was no longer above the HN24:2017 threshold of 5.00 mgO2/L. Increasing the dose of iron sludge powder up to 0.5 g reduced the concentration of organic compounds by 37.7%, and the concentration of organic compounds again exceeded the permissible values. Increasing the dose of coagulant to 30 mgAl/L reduced the concentration of organic compounds to 62.2% and did not exceed the permissible rates. Using 30 mgAl/L of coagulant with 0.1 g of iron sludge powder reduced the concentration of organic compounds by 67.3%. Increasing the dose of iron sludge powder to 0.5 g reduced the concentration of organic compounds by 63.3%. Using the maximum dose of coagulant with and without iron sludge powder, the concentration of organic compounds was effectively reduced and did not exceed HN24:2017 at 5.00 mgO2/L.
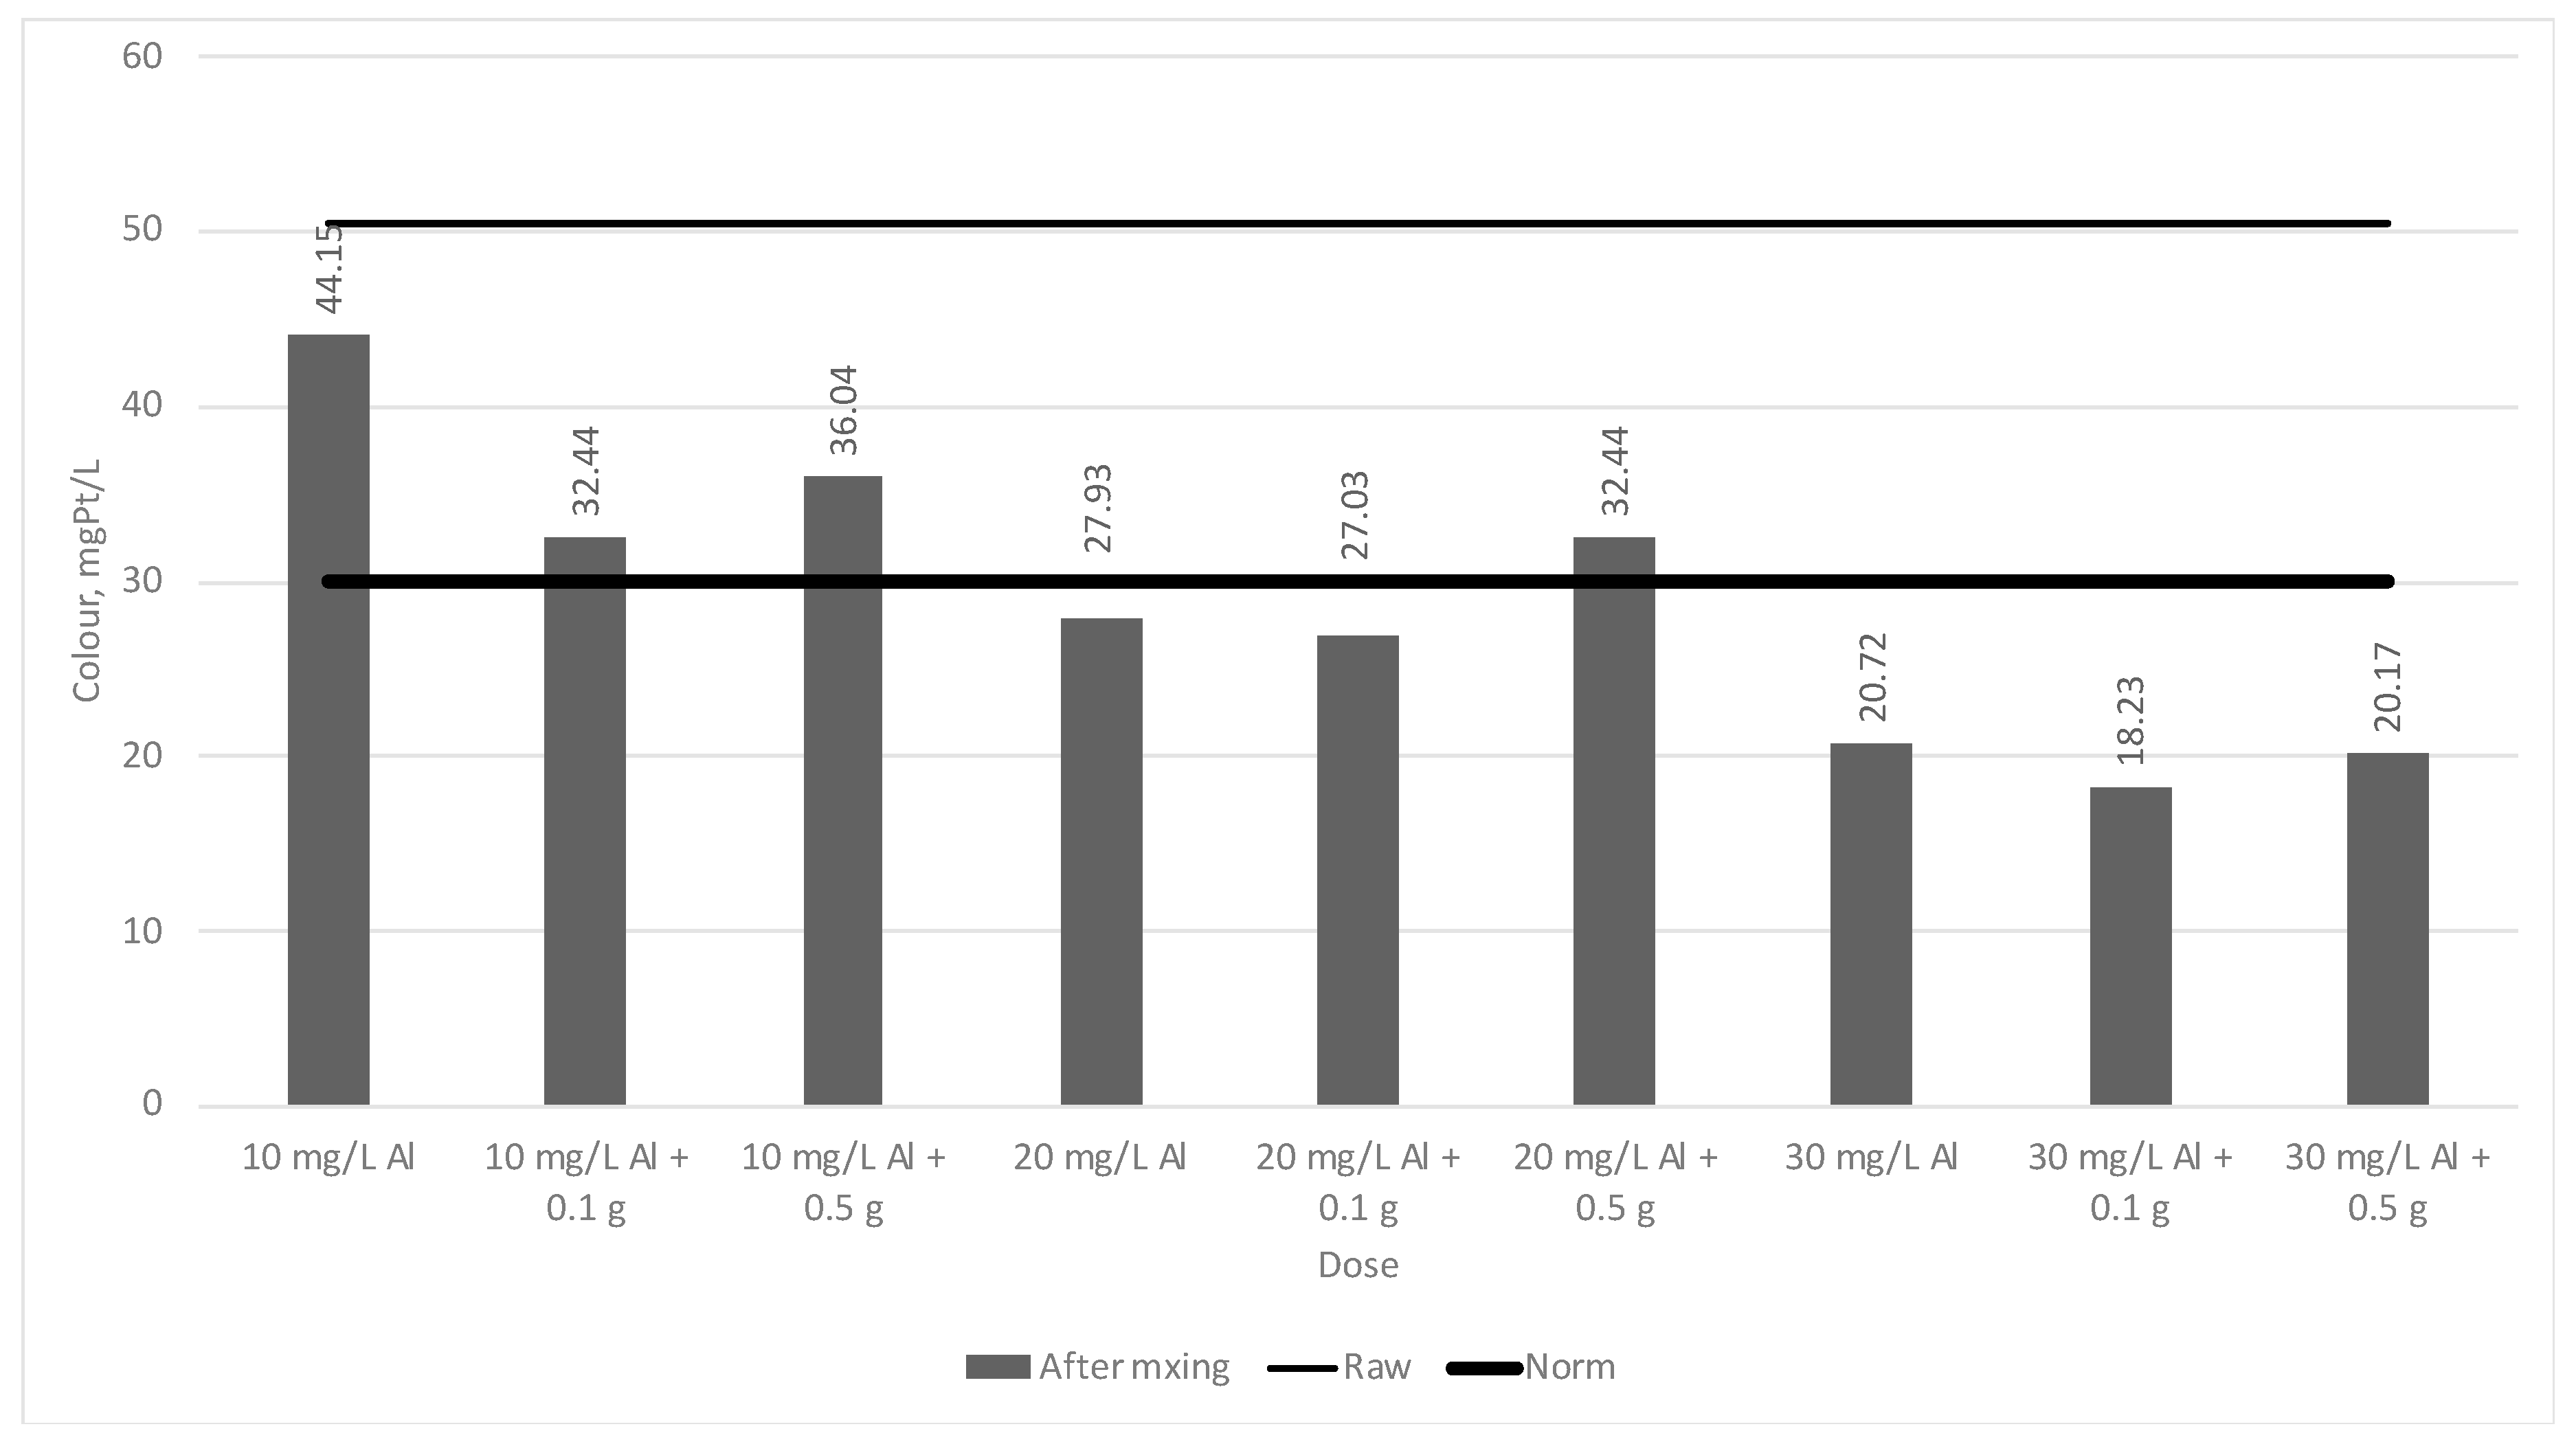
Figure 7 shows the dependency of water colour on different amounts of aluminium coagulant with iron sludge powder.
Figure 7 shows the water colour dependency on different doses of coagulant and iron sludge powder. One can see from the results presented in Figure 7 that the colour of the water decreased by 12.5% when using 10 mgAl/L of coagulant aluminium sulphate. When using 10 mgAl/L of coagulant with 0.1 g of iron sludge powder, the colour of the water decreased by 35.7%. Increasing the dose of iron sludge powder to 0.5 g, the colour of the water decreased by 28.5%. However, using such coagulant and iron sludge powder doses, the water colour still exceeded the permitted HN24:2017 concentrations. When 20 mlAl/L of coagulant was added, the concentration of organic matter was reduced by 44.6% and no longer exceeded the HN24:2017 norm. Using 20 mgAl/L of coagulant with 0.1 g of iron sludge powder, the water colour decreased by 46.4%. Increasing the dose of iron sludge powder to 0.5 g, the colour of the water decreased by 35.7%, and the colour of the water again exceeded the permissible limits. Increasing the dose of coagulant to 30 mgAl/L reduced the colour of the water to 62.2% and did not exceed the permissible values. Using 30 mgAl/L of coagulant with 0.1 g of iron sludge powder, the colour of the water decreased by 63.9%. Increasing the dose of iron sludge powder to 0.5 g, the colour of the water decreased by 60%. Using the maximum dose of coagulant with and without iron sludge powder, the water colour was effectively reduced and did not exceed the HN24:2017 limit at 30.00 mgPt/L.
The pH values were also measured at different doses of iron sludge powder and aluminium sulphate (Al2 (SO4)3*17H2O) coagulant. The results of the studies are presented in Table 7.
The results show that using different doses of coagulant and iron sludge powder does not change the pH of the tested water. The pH value ranges from 7.45 to 7.65. When the dose of coagulant is increased, the value of pH is slightly decreased, but corresponds to the permissible HN24:2017 “Drinking Water Safety and Quality Requirements” (pH 6.5–9.5).
The tests with the conventional coagulant with and without iron sludge powder led to the observation that, when using a coagulant with iron sludge powder, the concentration of organic compounds and the colour of the water decreases from 2.8 to 28.2% when the coagulant alone is used. It was observed that, with low doses of coagulant, iron sludge powder does not reduce the concentration of organic compounds and the colour of the water to acceptable levels. When increasing the doses of the coagulant, the concentration of organic compounds and the colour of the water decreases. It has also been noted that small iron sludge powder doses (0.1 g) help to eliminate organic compounds and reduce the water colour more efficiently than the larger ones (0.5 g). The results of the tests showed that the concentration of organic compounds in the water and its colour no longer exceed the permissible HN 24:2017 levels when 0.1 g of iron sludge powder in a 20 mgAl/L coagulant were used. The most effective reduction in the concentration of organic compounds and the water colour (the PI decreased by 67.3%, and the water colour decreased by 63.9%) was achieved by adding 30 mgAl/L of coagulant and 0.1 g of iron sludge powder into the tested water. It was also observed during the tests that the resulting flakes were deposited two times faster when adding a coagulant and iron sludge powder than when adding a coagulant alone. The flake deposition took 20 minutes when adding aluminium sulphate, and 10 min when adding a coagulant with iron sludge powder.
The sustainable use of water treatment iron sludge can be achieved by means of a circular economy and, especially, biotechonomic principles for the extraction of resources in the production of secondary material utilizations. A circular economy can be treated as a “panacea” to save the planet’s finite resources, as the current linear economy, which is based on a “take-cook-exclude everything” approach, creates large amounts of waste. This waste, such as water treatment iron sludge, is then sent to landfills, resulting in the loss of valuable materials that can be useful to humans and the environment.
4. Conclusions
- The organic compounds concentration (PI 8.07 mgO2/L) and the colour (42.4 mgPt/L) of river Neris water were reduced to the permissible HN24:2017 “Drinking Water Safety and Quality Requirements” (PI 5.00 mgO2/L and 30 mgPt/L, respectively) when 0.3 g of iron sludge powder and 8 mL of 0.95% of H2SO4 solution were added to 1 L of the tested water, mixed for 1 min at the speed of 200 rpm and 10 min at the speed of 50 rpm, and 10 min were allowed for sedimentation. The efficiency of the organic compounds removal was 55.51% and the reduction in water colour was 53.12%.
- It was found that, when using aluminium sulphate as a coagulant with iron sludge powder, the concentration of organic compounds and water colour decreased from 2.8 to 28.2% compared with the use of a pure coagulant alone. The most effective reduction in the concentration of organic compounds and the colour of the water (the PI decreased by 67.3% and the water colour decreased by 63.9%) was achieved when we added 30 mg Al/L of aluminium sulphate coagulant and 0.1 g of iron sludge powder to 1 L of river Neris water (Mixing: 1 min at the speed of 200 rpm and 10 min at the speed of 50 rpm; sedimentation: 10 min). When using a coagulant with iron sludge powder, the sedimentation of flakes is 50% faster compared with the sedimentation that occurs with a pure coagulant only.
- It can be concluded that the investigated process can be beneficial and effective in solving problems encountered in the more sustainable reuse of groundwater treatment iron sludge and alternative methods for removing organic matter from surface water, especially in areas where drinking water is produced from surface water. Such processes still need to be substantiated in more extensive research; however, the results of this study show that groundwater treatment iron sludge can be used to remove organic matter from surface water.
Author Contributions
Data curation, K.K.; Formal analysis, R.A. and K.B.; Investigation, K.K.; Methodology, R.A.; Writing—original draft, R.A.; Writing—review & editing, K.B.
Funding
This research received no external funding.
Conflicts of Interest
The authors declare no conflict of interest.
References
- Reynolds, M.; Blackmore, C.; Ison, R.; Wedlock, R.S. The Role of Systems Thinking in the Practice of Implementing Sustainable Development Goals. In Handbook of Sustainability Science and Research; Springer: Cham, Switzerland, 2017; pp. 677–698. [Google Scholar]
- Tukker, A. Product services for a resource-efficient and circular economy—A review. J. Clean. Prod. 2015, 97, 76–91. [Google Scholar] [CrossRef]
- Matilainen, A.; Sillanpaa, M. Removal of natural organic matter from drinking water by advanced oxidation processes. Chemosphere 2010, 80, 351–365. [Google Scholar] [CrossRef]
- Chen, F.; Peldszus, S.; Elhadidy, A.M.; Legge, R.L.; Dyke, M.I.; Huck, P.M. Kinetics of natural organic matter (NOM) removal during drinking water biofiltration using different NOM characterization approaches. Water Res. 2016, 104, 361–370. [Google Scholar] [CrossRef]
- Shao, J.; Li, R.; Lepo, J.E.; Gu, J.D. Potential for control of harmful cyanobacterial blooms using biologically derived substances: Problems and prospects. J. Environ. Manag. 2013, 125, 149–155. [Google Scholar] [CrossRef]
- Winter, J.; Wray, H.E.; Schulz, M.; Vortisch, R.; Barbeau, B.; Berube, P.R. The impact of loading approach and biological activity on NOM removal by ion exchange resins. Water Res. 2018, 134, 301–310. [Google Scholar] [CrossRef]
- Richardson, S.D.; Plewa, M.J.; Wagner, E.D.; Schoeny, R.; Demarini, D.M. Occurrence, genotoxicity, and carcinogenicity of regulated and emerging disinfection by-products in drinking water: A review and roadmap for research. Mutat. Res. 2007, 636, 178–242. [Google Scholar] [CrossRef]
- Halle, C.; Huck, P.M.; Peldszus, S.; Haberkamp, J.; Jekel, M. Assessing the performance of biological filtration as pretreatment to low pressure membranes for drinking water. Environ. Sci. Technol. 2009, 43, 3878–3884. [Google Scholar] [CrossRef]
- Broo, A.E.; Berghult, B.; Hedberg, T. Drinking water distribution e the effect of natural organic matter (NOM) on the corrosion of iron and copper. Water Sci. Technol. 1999, 40, 17–24. [Google Scholar] [CrossRef]
- Jacangelo, J.G.; Demarco, J.; Owen, D.M.; Randtke, S.J. Selected processes for removing NOM: An overview. J. Am. Water Works Assoc. 1995, 87, 64–77. [Google Scholar] [CrossRef]
- Odegaard, H.; Osterhus, S.; Melin, E.; Eikebrokk, B. NOM removal technologies—Norwegian experiences. Drink. Water Eng. Sci. 2010, 3, 1–9. [Google Scholar] [CrossRef]
- Callegari, A.; Boguniewicz-Zablocka, J.; Capodaglio, A.G. Experimental Application of an Advanced Separation Process for NOM Removal from Surface Drinking Water Supply. Separations 2017, 4, 32. [Google Scholar] [CrossRef] [Green Version]
- Ackah, L.A.; Guru, R.; Peiravi, M.; Mohanty, M.; Ma, X.; Kumar, S.; Liu, J. Characterization of Southern Illinois Water Treatment Residues for Sustainable Applications. Sustainability 2018, 10, 1374. [Google Scholar] [CrossRef]
- Kohler, S.J.; Lavonen, E.; Keucken, A.; Schmitt-Kopplin, P.; Spanjer, T.; Persson, K. Upgrading coagulation with hollow-fibre nanofiltration for improved organic matter removal during surface water treatment. Water Res. 2016, 89, 232–240. [Google Scholar] [CrossRef]
- Yuan, Y.; Kilduff, J.E. Mass transport modelling of natural organic matter (NOM) and salt during Nanofiltration of inorganic colloid-NOM mixtures. Desalination 2018, 429, 60–69. [Google Scholar] [CrossRef]
- Terry, L.G.; Summer, R.S. Biodegradable organic matter and rapid-rate biofilter performance: A review. Water Res. 2018, 128, 234–245. [Google Scholar] [CrossRef]
- Kothawala, D.N.; Kohler, S.J.; Ostlund, A.; Wiberg, K.; Ahrens, L. Influence of dissolved organic matter concentration and composition on the removal efficiency of perfluoroalkyl substances (PFASs) during drinking water treatment. Water Res. 2017, 121, 320–328. [Google Scholar] [CrossRef]
- Finkbeiner, P.; Redman, J.; Patriarca, V.; Moore, G.; Jefferson, B.; Jarvis, P. Understanding the potential for selective natural organic matter removal by ion exchange. Water Res. 2018, 146, 256–263. [Google Scholar] [CrossRef]
- Sillnpaa, M.; Ncibi, M.C.; Matilainen, A. Advanced oxidation processes for the removal of natural organic matter from drinking water sources: A comprehensive review. J. Environ. Manag. 2018, 208, 56–76. [Google Scholar] [CrossRef]
- Ajmani, G.S.; Cho, H.H.; Chalew, T.E.A.; Schwab, K.J.; Jacangelo, J.G.; Huang, H. Static and dynamic removal of aquatic natural organic matter by carbon nanotubes. Water Res. 2014, 59, 262–270. [Google Scholar] [CrossRef]
- Canzano, S.; Capasso, S.; Natale, M.; Erto, A.; Iovino, P.; Musmarra, D. Remediation of groundwater polluted by aromatic compounds by means of adsorption. Sustainability 2014, 6, 4807–4822. [Google Scholar] [CrossRef]
- Asherman, G.; Zietzschmann, F.; Jekel, M. Influence of dissolved organic matter and activated carbon pore characteristics on organic micropollutant desorption. Water Res. 2018, 133, 123–131. [Google Scholar] [CrossRef]
- Dental, S.K. Coagulant control in water treatment. Crit. Rev. Environ. Control 1991, 21, 41–135. [Google Scholar] [CrossRef]
- Ahmad, T.; Ahmad, K.; Alam, M. Sustainable management of water treatment sludge through 3‘R’ concept. J. Clean. Prod. 2016, 124, 1–13. [Google Scholar] [CrossRef]
- Keeley, J.; Jarvis, P.; Judd, S.J. Coagulant recovery from water treatment residuals: A review of applicable technologies. Crit. Rev. Environ. Sci. Technol. 2014, 44, 2675–2719. [Google Scholar] [CrossRef]
- Petruzzelli, D.; Volpe, A.; Limoni, N.; Passino, R. Coagulants removal and recovery from water clarifier sludge. Water Res. 2000, 34, 2177–2182. [Google Scholar] [CrossRef]
- Sthapak, A.K.; Killedar, D.J.; Bhole, A.G. Applicability of liquid ion exchange to alum recovery from waste stabilization pond sludge. J. Environ. Sci. Eng. 2008, 50, 227–234. [Google Scholar]
- Ghorpade, A.; Ahammed, M.M. Water treatment sludge for removal of heavy metals from electroplating wastewater. Environ. Eng. Res. 2018, 23, 92–98. [Google Scholar] [CrossRef]
- Sun, J.; Pikaar, I.; Sharma, K.R.; Keller, J.; Yuan, Z. Feasibility of sulfide control in sewers by reuse of iron rich drinking water treatment sludge. Water Res. 2015, 71, 150–159. [Google Scholar] [CrossRef]
- Yoo, H.; Cho, S.; Ko, S. Modification of coagulation and Fenton oxidation processes for cost-effective leachate treatment. J. Environ. Sci. Health 2001, 36, 39–48. [Google Scholar] [CrossRef]
- Chen, A.S.C.; Sorg, T.J.; Wang, L. Regeneration of iron-based adsorptive media used for removing arsenic from groundwater. Water Res. 2015, 77, 85–97. [Google Scholar] [CrossRef]
- Diliunas, J.; Jurevicius, A.; Zuzevicius, A. Formation of iron compounds in the Quaternary groundwater of Lithuania. Geologija 2006, 55, 66–73. [Google Scholar]
- Albrektiene, R.; Rimeika, M.; Jurkiene, J. Analysis of Coagulation Processes for the Groundwater Treatment. SSP J. Civ. Eng. 2013, 8, 51–58. [Google Scholar] [CrossRef] [Green Version]
- Marjani, A.; Nazari, A.; Seyyed, M. Alteration of iron level in drinking water by aeration in Gonbad Kavoos (North East of Iran). Am. J. Biochem. Biotechnol. 2009, 5, 94–97. [Google Scholar] [CrossRef]
- Yang, H.; Li, D.; Zhang, J.; Hao, R.; Li, B. Design of biological filter for iron and manganese removal from water. J. Environ. Sci. Health 2004, 39, 1447–1454. [Google Scholar] [CrossRef]
- Bruins, J.H.; Petrusevski, B.; Slokar, Y.M.; Kruithof, J.C.; Kennedy, M.D. Manganese removal from groundwater: Characterization of filter media coating. Desalin. Water Treat. 2015, 55, 1851–1863. [Google Scholar] [CrossRef]
- Valentukeviciene, M.; Bagdziunaite-Litvinietiene, L.; Chadysas, V.; Litvinaitis, A. Evaluating the impacts of Integrated pollution on water quality of the trnas-boundary Neris (Viliya) river. Sustainability 2018, 10, 4239. [Google Scholar] [CrossRef]
- Bykov, A.; Valentukeviciene, M. Fosfatų Šalinimas Iš Nuotekų Naudojant Geležies Prisotintas Paplavas, Iš 17-Osios Lietuvos Jaunųjų Mokslininkų Konferencijos “Mokslas—Lietuvos Ateitis” Teminės Konferencijos “Pastatų Inžinerinės Sistemos”; Technika: Vilnius, Lithuania, 2014; pp. 13–16. [Google Scholar]
- Ratnaweera, H.; Gjessing, E.; Oug, E. Influence of physical-chemical characteristics of natural organic matter (NOM) on coagulation properties: An analysis of eight Norwegian water sources. Water Sci. Technol. Water Supply 1999, 40, 89–95. [Google Scholar] [CrossRef]
Figure 1.
The water treatment iron sludge and the iron sludge powder.

Figure 2.
The dependency of the permanganate index on the different iron sludge powder doses (1; 2; 3; 4; 5; and 6 g/L).
Figure 2.
The dependency of the permanganate index on the different iron sludge powder doses (1; 2; 3; 4; 5; and 6 g/L).

Figure 3.
The dependency of water colour on different iron sludge powder doses (1; 2; 3; 4; 5; and 6 g/L).
Figure 3.
The dependency of water colour on different iron sludge powder doses (1; 2; 3; 4; 5; and 6 g/L).

Figure 4.
The dependency of the permanganate index on different iron sludge powder doses (0.1; 0.3; 0.5; 0.7; 0.8; and 0.9 g/L).
Figure 4.
The dependency of the permanganate index on different iron sludge powder doses (0.1; 0.3; 0.5; 0.7; 0.8; and 0.9 g/L).

Figure 5.
The dependency of the water colour on different iron sludge powder doses (0.1; 0.3; 0.5; 0.7; 0.8; and 0.9 g/L).
Figure 5.
The dependency of the water colour on different iron sludge powder doses (0.1; 0.3; 0.5; 0.7; 0.8; and 0.9 g/L).

Figure 6.
The dependency of the permanganate index on different amounts of aluminium coagulant with iron sludge powder.
Figure 6.
The dependency of the permanganate index on different amounts of aluminium coagulant with iron sludge powder.

Figure 7.
The dependency of the water colour on different amounts of aluminium coagulant with iron sludge powder.
Figure 7.
The dependency of the water colour on different amounts of aluminium coagulant with iron sludge powder.


Table 1.
Water quality data on the Neris River.
| Water Quality Indicator | Unit | Data |
|---|---|---|
| pH | 7.71 | |
| Permanganate index | mgO2/L | 8.07 |
| Colour | mgPt/L | 42.4 |
| Total iron | μg/L | 190 |
Table 2.
The composition of the iron sludge [38].
Table 2.
The composition of the iron sludge [38].
| Element | Quantity % |
|---|---|
| Iron (Fe) | 33.9 |
| Calcium (Ca) | 4.5 |
| Siliceous (Si) | 2.7 |
| Phosphorus (F) | 2.2 |
| Aluminium (Al) | 0.4 |
| Manganese (Mn) | 0.25 |
| Microelements (Zn, Ba, S, and ect.) | 1.05 |
Table 3.
The experimental conditions.
| Dose of Iron Sludge Powder, g/L | Dose of Sulfuric Acid, mL | Speed and Duration of Mixing | Filtering |
|---|---|---|---|
| 1 | |||
| 2 | |||
| 3 | |||
| 4 | |||
| 5 | |||
| 6 | 0, 3, 6, 8 | 1 min 200 rpm, 10 min 50 rpm, | 0.45 μm |
| 0.1 | 10 min sedimentation | ||
| 0.3 | |||
| 0.5 | |||
| 0.7 | |||
| 0.8 | |||
| 0.9 |
Table 4.
The experimental conditions.
| Dose of Coagulant, mgAl/L | Dose of Iron Sludge Powder, g | Speed and Duration of Mixing | Filtering |
|---|---|---|---|
| 10 | 1 min 200 rpm, 10 min 50 rpm, | ||
| 20 | 0, 0.1, 0.5 | 10 min sedimentation | 0.45 μm |
| 30 |
Table 5.
The pH measurement results.
| Dose of Iron Sludge Powder, g/L | pH 0 mL of H2SO4 | pH 3 mL of H2SO4 | pH 6 mL of H2SO4 | pH 8 mL of H2SO4 |
|---|---|---|---|---|
| 1 | 7.71 | 7.30 | 6.94 | 6.50 |
| 2 | 7.70 | 7.38 | 6.96 | 6.66 |
| 3 | 7.71 | 7.50 | 6.97 | 6.82 |
| 4 | 7.72 | 7.50 | 7.04 | 6.89 |
| 5 | 7.70 | 7.53 | 7.06 | 6.92 |
| 6 | 7.70 | 7.55 | 7.18 | 6.94 |
Table 6.
The pH measurement results.
| Dose of Iron Sludge Powder, g/L | pH 0 mL of H2SO4 | pH 3 mL of H2SO4 | pH 6 mL of H2SO4 | pH 8 mL of H2SO4 |
|---|---|---|---|---|
| 0.1 | 7.71 | 7.07 | 6.35 | 3.78 |
| 0.3 | 7.69 | 7.20 | 6.39 | 4.18 |
| 0.5 | 7.70 | 7.27 | 6.41 | 4.47 |
| 0.7 | 7.68 | 7.29 | 6.52 | 4.80 |
| 0.8 | 7.73 | 7.31 | 6.56 | 5.25 |
| 0.9 | 7.70 | 7.46 | 6.62 | 5.48 |
Table 7.
The pH measurement results.
| Dose of Iron Sludge Powder, g/L | Dose of Coagulant, mgAl/L | pH |
|---|---|---|
| 10 | 0.1 | 7.65 |
| 10 | 0.5 | 7.68 |
| 20 | 0.1 | 7.55 |
| 20 | 0.5 | 7.53 |
| 30 | 0.1 | 7.48 |
| 30 | 0.5 | 7.45 |
© 2019 by the authors. Licensee MDPI, Basel, Switzerland. This article is an open access article distributed under the terms and conditions of the Creative Commons Attribution (CC BY) license (http://creativecommons.org/licenses/by/4.0/).
Share and Cite
MDPI and ACS Style
Albrektienė, R.; Karaliūnas, K.; Bazienė, K. Sustainable Reuse of Groundwater Treatment Iron Sludge for Organic Matter Removal from River Neris Water. Sustainability 2019, 11, 639. https://doi.org/10.3390/su11030639
AMA Style
Albrektienė R, Karaliūnas K, Bazienė K. Sustainable Reuse of Groundwater Treatment Iron Sludge for Organic Matter Removal from River Neris Water. Sustainability. 2019; 11(3):639. https://doi.org/10.3390/su11030639
Chicago/Turabian StyleAlbrektienė, Ramunė, Karolis Karaliūnas, and Kristina Bazienė. 2019. "Sustainable Reuse of Groundwater Treatment Iron Sludge for Organic Matter Removal from River Neris Water" Sustainability 11, no. 3: 639. https://doi.org/10.3390/su11030639
Note that from the first issue of 2016, this journal uses article numbers instead of page numbers. See further details here.