Interconnections Accelerate Collapse in a Socio-Ecological Metapopulation

1
Department of Applied Mathematics, University of Waterloo, Waterloo, ON N2L 3G1, Canada
2
School of Environmental Sciences, University of Guelph, Guelph, ON N1G 2W1, Canada
*
Author to whom correspondence should be addressed.
Sustainability 2019, 11(7), 1852; https://doi.org/10.3390/su11071852
Submission received: 30 December 2018
/
Revised: 12 March 2019
/
Accepted: 20 March 2019
/
Published: 28 March 2019
(This article belongs to the Special Issue Human Nature Interactions)
Abstract
:Over-exploitation of natural resources can have profound effects on both ecosystems and their resident human populations. Simple theoretical models of the dynamics of a population of human harvesters and the abundance of a natural resource being harvested have been studied previously, but relatively few models consider the effect of metapopulation structure (i.e., a population distributed across discrete patches). Here we analyze a socio-ecological metapopulation model based on an existing single-population model used to study persistence and collapse in human populations. Resources grow logistically on each patch. Each population harvests resources on its own patch to support population growth, but can also harvest resources from other patches when their own patch resources become scarce. We show that when populations are allowed to harvest resources from other patches, the peak population size is higher, but subsequent population collapse is significantly accelerated and across a broader parameter regime. As the number of patches in the metapopulation increases, collapse is more sudden, more severe, and occurs sooner. These effects persist under scenarios of asymmetry and inequality between patches. Our model makes simplifying assumptions in order to facilitate insight and understanding of model dynamics. However, the robustness of the model prediction suggests that more sophisticated models should be developed to ascertain the impact of metapopulation structure on socio-ecological sustainability.
1. Introduction
Simple population dynamic models have long been used in theoretical population biology, beginning with the logistic growth model developed by Verhulst [1]:
where is the population size at time t, r is the net growth rate, and K is the carrying capacity. This model represents resource-limited population growth reaching a carrying capacity K that is the largest population size that the resources of the environment can support. The logistic growth model and various extensions thereof are richly represented in the ecological literature and have been used as a framework to study population dynamics in a variety of species [2,3,4,5,6].
Single population models were subsequently expanded, for instance by considering interacting predator and prey species where predator growth depends on prey species abundance [6]. In other research, the impact of other populations is represented implicitly, such as through a fixed inflow rate that adds new individuals to the population [7]. Alternatively, a metapopulation approach can be used to represent other populations explicitly. In a metapopulation, multiple populations of the same species undergo dynamics on separate patches, but exchange individuals through immigration [8,9,10,11]. Metapopulation structure can significantly impact both within-patch and between-patch dynamics [12,13,14,15]. For instance, metapopulation theory has given rise to the concept of the extinction debt, whereby destruction of a natural habitat has not only immediate impacts on populations, but also creates a ‘debt’ effect whereby future extinctions will occur as well long after habitat destruction has ceased [12]. Similarly, in a rescue effect, the local extinction of a population is prevented due to immigration of a neighboring population residing in the same metapopulation [13]. Metapopulation dynamics in a variety of natural systems are an ongoing topic of research [16,17,18,19].
Human settlements can be conceptualized as a metapopulation: a series of patches distributed across a landscape and exchanging not only species members, but resources. This cross-patch resource flow generates a significant contrast with natural populations, which typically exchange only species members. This contrast has increased especially since the Industrial Era. Human exploitation of extra-metabolic energy sources stemming from technological uses now dwarfs the power consumption associated with our (bodily) metabolic power consumption, by several orders of magnitude [20,21,22], and a significant portion of this extra-metabolic power is expended to move goods between populations.
Although population growth models such as the logistic growth model have found their fullest expression in ecology, Verhulst developed his model for application to human populations and he inferred the model’s parameter values using population data from Belgium and other countries. This interest in human populations may be attributable to the influence of Thomas Malthus and his work ‘An Essay on the Principle of Population’, which is well known for its hypothesis that famine and poverty are mathematically inevitable [23]. Malthus continues to influence our thought in a time of severe global over-consumption and resource depletion. Resource depletion has been conceptualized and quantified in various ways. For instance, recent literature identifies seven planetary boundaries that must not be transgressed if humans are able to live sustainably on the planet, and finds that three of these boundaries have already been transgressed [24].
Simple population growth models to study resource-limited human population dynamics are well represented in the literature, perhaps on account of our growing awareness of the ramifications of resource over-exploitation [25]. These models exemplify socio-ecological (or human-environment) systems, wherein human dynamics and environmental dynamics are coupled to one another [26,27,28,29]. Such models have been used to study phenomena such as the impact of resource dynamics on the potential for human population collapse [30] and conflict among metapopulations arising over common resources [31,32]. Models have also been used to study historical human population collapses such as in the Easter Island civilization [33,34,35,36,37,38,39,40,41,42,43], the Kayenta Anasazi [44], and the Andean Tiwanaku civilization [45], as well as the potential collapse of modern populations [46,47,48,49]. With some exceptions [31,32,43,50], previous research on resource-limited human population growth has focused on single population dynamics. However, multi-population interactions through trading, raiding and immigration are an inescapable feature of the world’s human metapopulation dynamic, and can have significant impacts on ecosystems and the natural resources they provide [51]. The literature on multi-population interactions has explored metapopulation models involving migration of individuals between patches [44], or competing populations conflicting and bargaining over a common resource [31,32]. A metapopulation model of humans fitted to data from Easter Island predicts that coupling human populations together through exchange of resources, migration and technology can stabilize the entire metapopulation [43].
As described in the earlier paragraphs of this Introduction, human metapopulations differ from other species with respect to their transfer of significant amounts of resources between patches (“cross-patch harvesting”). (This differs crucially from prey immigration, for example, because most harvested resources do not reproduce once they have been transported to a new patch for consumption.) Here, we study this aspect of human metapopulations with a simple metapopulation model of resource-limited growth. Since the use of metapopulation models is well established in theoretical ecology, we develop a metapopulation model by extending an existing single population model that has been applied to studying the collapse of the Easter Island civilization [34] and wolf population dynamics [52], among other uses. Unlike the classical and widely studied Rosenzweig-Macarthur predator-prey model that also captures resource (prey) dynamics [6,7], our model assumes that predator population growth is limited by density dependence governed by resource availability. (We compare the merits of this assumption versus a Rosenzweig-Macarthur formulation in the Discussion section.) Populations grow logistically by exploiting a resource that follows a resource dynamic. Local populations can take resources not only from their own patch but also from other patches, when resources in their own patch become sufficiently scarce. We develop a simple model that does not capture all the features of real populations for several reasons. Simple models can be easier to understand, analyze and manipulate and thus can be used to suggest new hypotheses, test the logic of a hypothesis, convey concepts and provide intuition and understanding. (Moreover, they often give the same predictions as more complicated models [53].) Our research objective is to study how model dynamics depend on the number of patches in the metapopulation and the parameter values governing resource harvesting and population growth. We hypothesize that allowing populations to harvest resources from other patches will cause the metapopulation to collapse more quickly and for a broader parameter regime. We describe the model in the next section, followed by Results and a Discussion section.
2. Materials and Methods
We build on a model previously applied to the collapse of the Easter Island civilization [34]. The first equation describes a population growing logistically to a carrying capacity that is proportional to the resource level. A second equation describes the logistic growth of resources to its own natural carrying capacity, minus harvesting. We develop both two-patch and 10-patch versions of our model. The population growth rates were obtained by calibrating the model population trajectory to historical human population size time series and agricultural data (see Section 2.3 for details) [54,55].
2.1. Two-Patch Model
In the two-patch model, patch 1 has population size and resource level , and patch 2 has population size and resource level :
where is the growth rate of patch 1 (resp. 2); is the resource renewal rate in patch 1 (resp. 2); is the carrying capacity of the depletable resource in patch 1 (resp. 2); is the baseline harvesting rate at which patch 1 (resp. patch 2) harvests resources for its population’s consumption; is the proportion of resources that patch 1 takes from patch 2, and similarly for . In this model, the carrying capacity of the human populations is determined by how much resource is available to support them, either from their own patch or taken from the other patch. When we recover the original model by Basener and Ross [34].
We set and assume that patch 1 will attempt to harvest more resources from patch 2 when the resources from patch 1 are not enough to support the patch 1 population. Similarly, . These functions take the form
These are sigmoidal functions where the rate at which patch 1 harvests from patch 2 is higher when is higher, and vice versa, where controls the location of the mid-point of the sigmoid, and where controls how steep the curve is. Parameters and are similarly defined.
2.2. Ten-Patch Model
We also analyzed a version of the model where 10 patches are interconnected and can take resources from one another. The dynamics of patch i in the 10-patch model are given by
where parameter definitions are the same as in the two-patch case.
2.3. Baseline Parameter Values
The baseline values of our parameters appear in Table 1. The growth rates were estimated as the average world population growth rate from 1950 to 2015 [54]. The resource growth rate was taken as the average increase in global crop yield from 1961 to 2005 [55]. The values of the harvesting efficiency and carrying capacity of the resources were calibrated so that the populations would begin with enough resources to survive for several centuries regardless of their rate of resource use, and so their harvesting efficiency was high enough that there were consequences to over-exploitation but not high enough to make resource use incredibly costly. At these parameter values, the population size on a single patch grows to 650,000 and then declines somewhat to an equilibrium population size of 480,000 over a timescale of several hundred years. These criteria put the model in a regime where parameter variation around the baseline values produces nontrivial changes in model predictions that can be analyzed to gain insight into socio-ecological dynamics.
The parameters controlling the midpoint and steepness of the sigmoid function ( and ) were obtained through calibration by analyzing the effect they had on how much and when the populations would take from neighboring populations. To calibrate , our intention was that the populations did not take much from neighbors when they were not in need. In contrast, they would take more when their resources began to dwindle and neighbour’s resources were needed to survive. To calibrate we choose a value such that the switch between these two described states was relatively gradual. In particular, we required and to satisfy the property that if and thus resources were abundant, then was roughly 25%, whereas if , indicating a situation where a shortage of resources was beginning to become worrisome, then would be greater than 75%.
Initial conditions were = 50,000, = 50,000, = 1,000,000, and = 1,000,000. These initial conditions corresponded to two populations with relatively low starting population levels and with initially abundant resources at carrying capacity in their respective patches.
We solved the model equations numerically using the adaptive fourth-fifth order Runge Kutta method implemented via Matlab’s ODE45 solver. The code can be found on Github [56]. We compared model dynamics for both interconnected and isolated versions of the two-patch and 10-patch models to determine the impact of interconnectedness on the likelihood and timing of collapse.
We explored the sensitivity of model predictions to parameter variations away from the baseline parameter values. In this process we considered two different scenarios for parameter variations. In most figures, populations were always assumed symmetric and had identical parameter values, but some figures explore the case of asymmetric populations where the two populations differ in one parameter value.
3. Results
3.1. Baseline Scenario
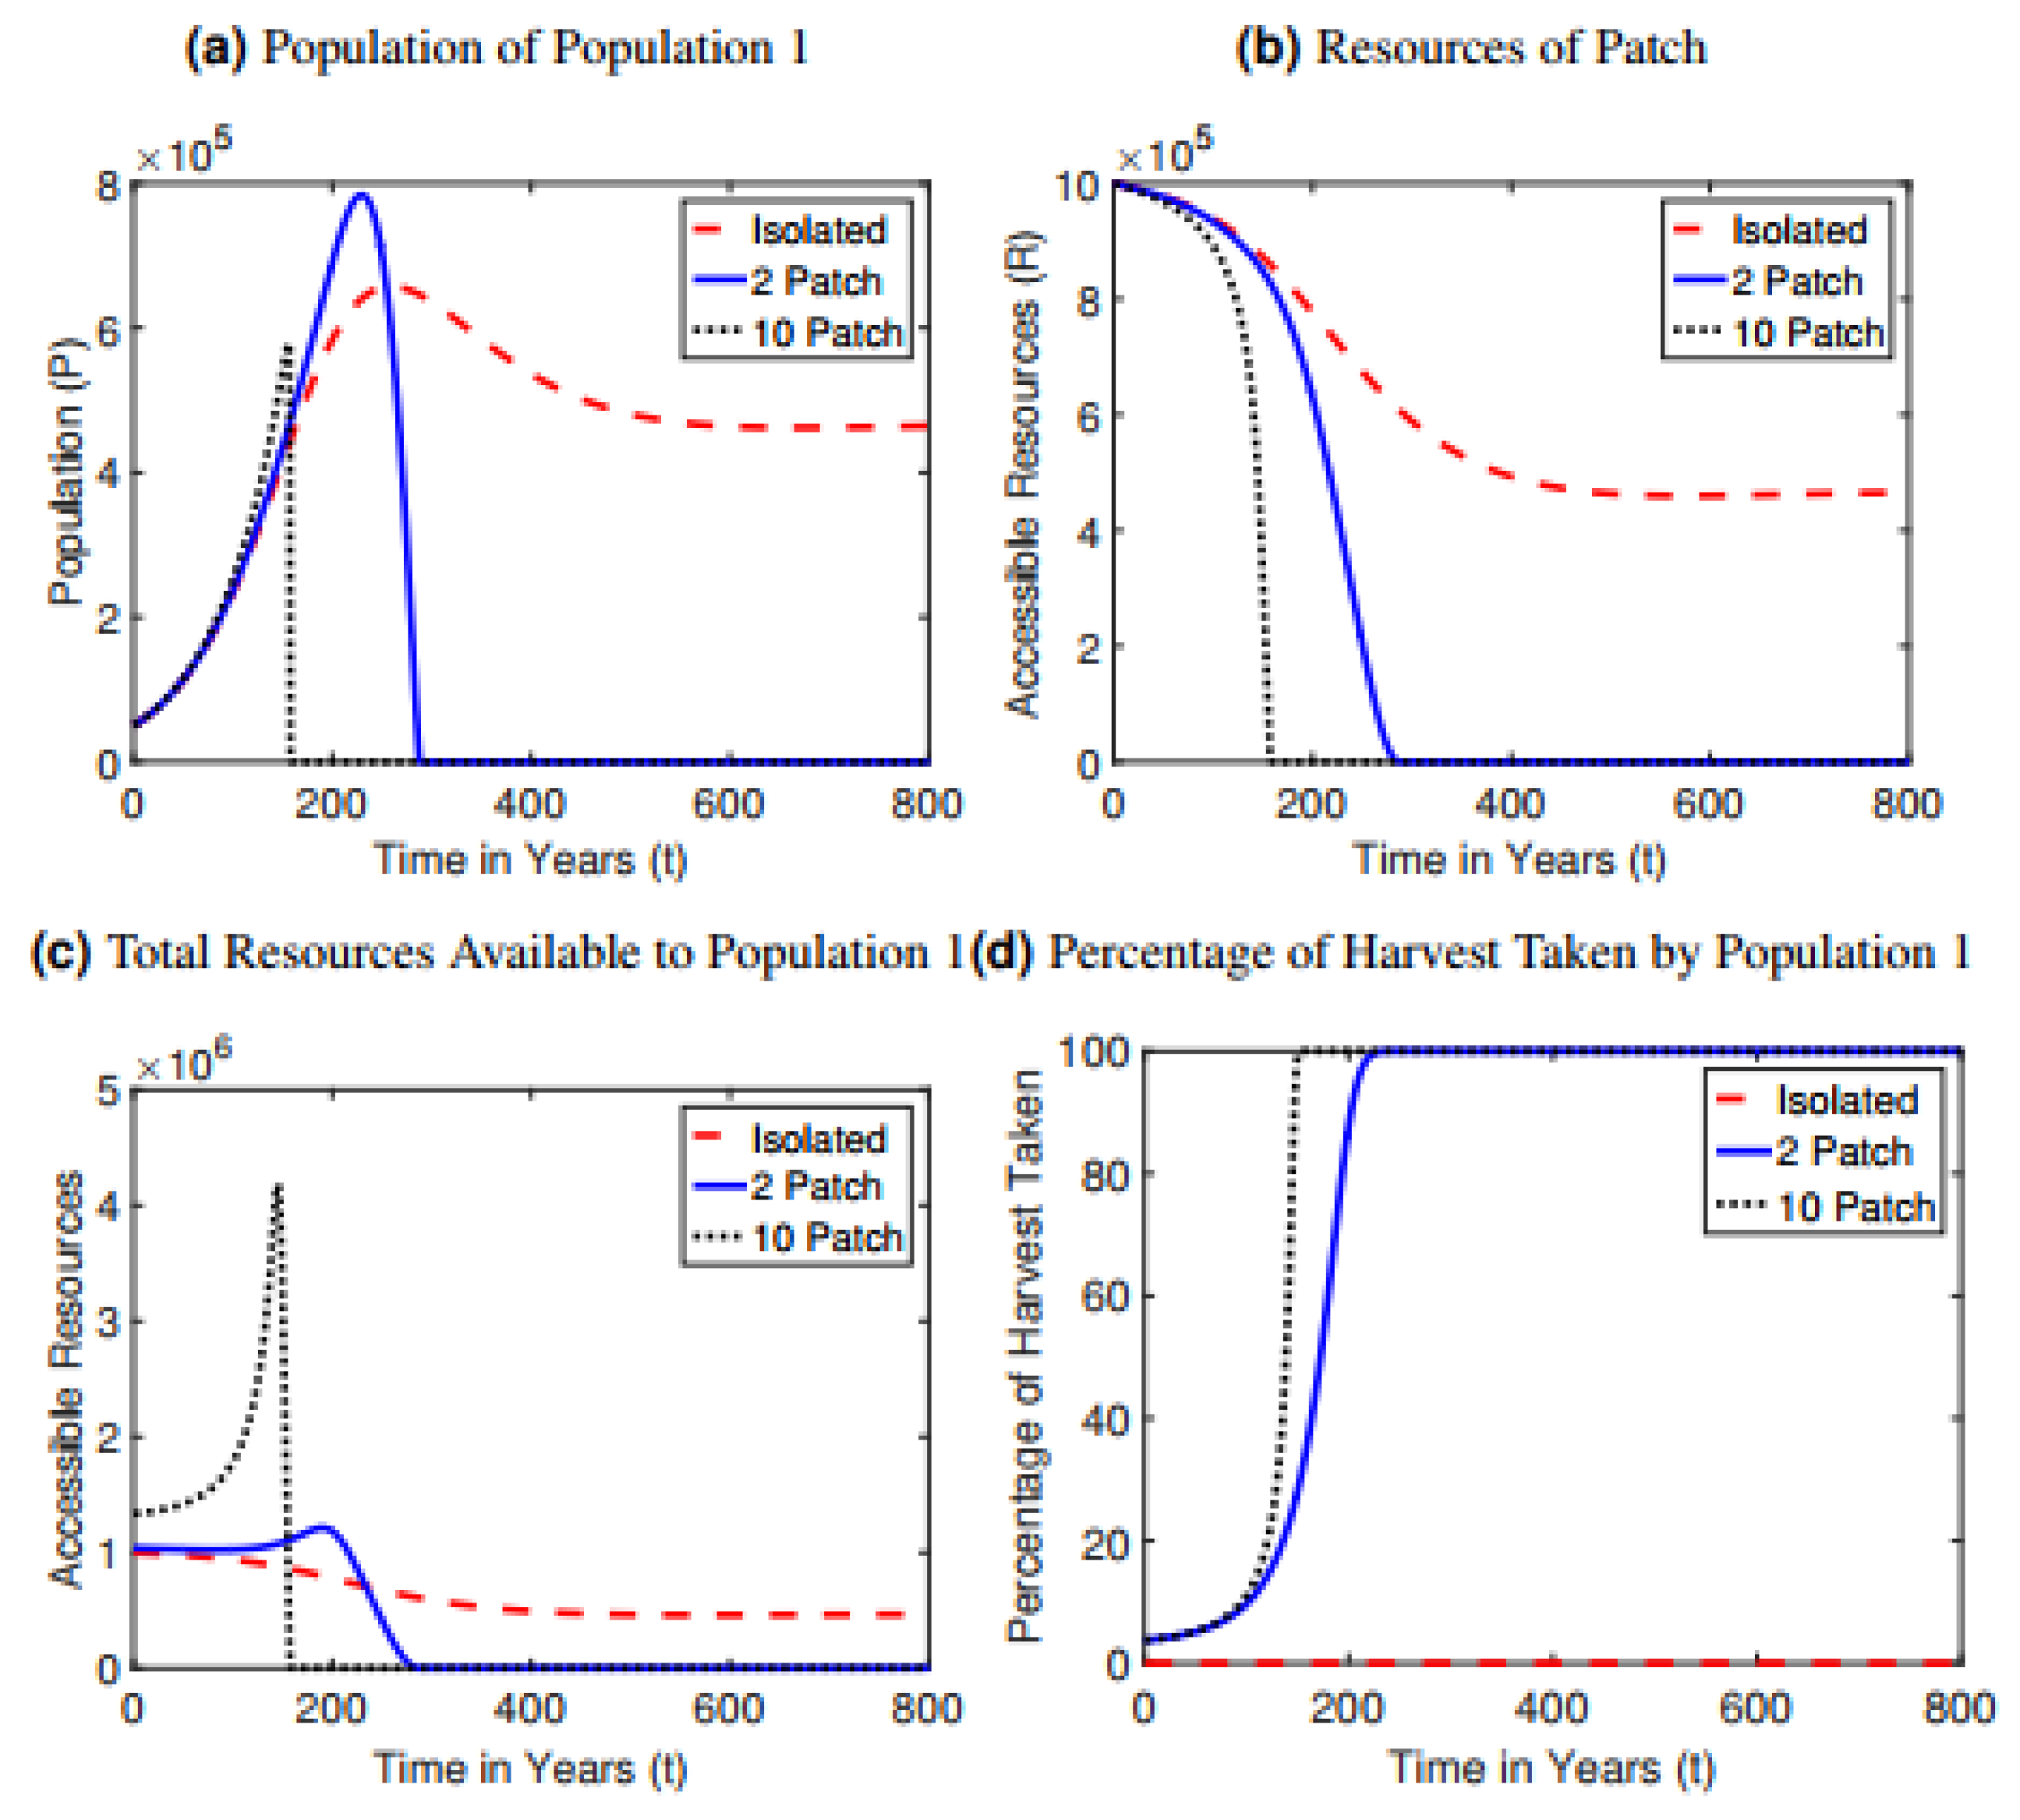
The baseline scenario was simulated for both the interconnected () and isolated () versions of the model. In the interconnected baseline scenario (Figure 1), the populations begin a nearly exponential increase in their population growth (Figure 1a) as they quickly reduce their local resources (Figure 1b). This decrease in local resources causes the populations to begin taking resources from their neighboring patch to continue supporting their population (Figure 1d). This results in greater resource availability (Figure 1c) which stimulates further unsustainable population growth. Once the resources of both patches are strongly depleted, both populations collapse.
In contrast to the interconnected case, populations can achieve a stable equilibrium in the isolated case at baseline parameter values (Figure 1). Much like the interconnected scenario, an isolated population grows very quickly, reaching a peak and then beginning to decline (Figure 1a). However, instead of complete extinction of the population, the population decline begins to slow as the system reaches a steady state in which the population and resources equilibrate at a sustainable level.
Dynamics in the 10-patch model amplify the trends in dynamics observed in the two-patch model. The initial increase in population size is much more rapid (since the total available resource pool is larger), but the following collapse happens much sooner and is much more sudden than in the two-patch model (Figure 1a). Collapse occurs after 159 years in the 10-patch model compared to the 289 years in the two-patch model. Resources are depleted much more rapidly in the 10-patch model (Figure 1b–d).
We also studied how the time to collapse depends on parameter values for the isolated and interconnected scenarios. Time to collapse was defined as the time elapsed until the populations of both patches reached zero (). We generated plots showing the time to collapse versus a single parameter, with all other parameter values held constant at their baseline values (Figure 2 and Figure 3). By doing so, we obtain an idea of whether the more rapid collapse of interconnected systems compared to isolated systems is robust to changes in model parameter values, and which parameter values are most influential in determining collapse.
3.2. Time to Collapse
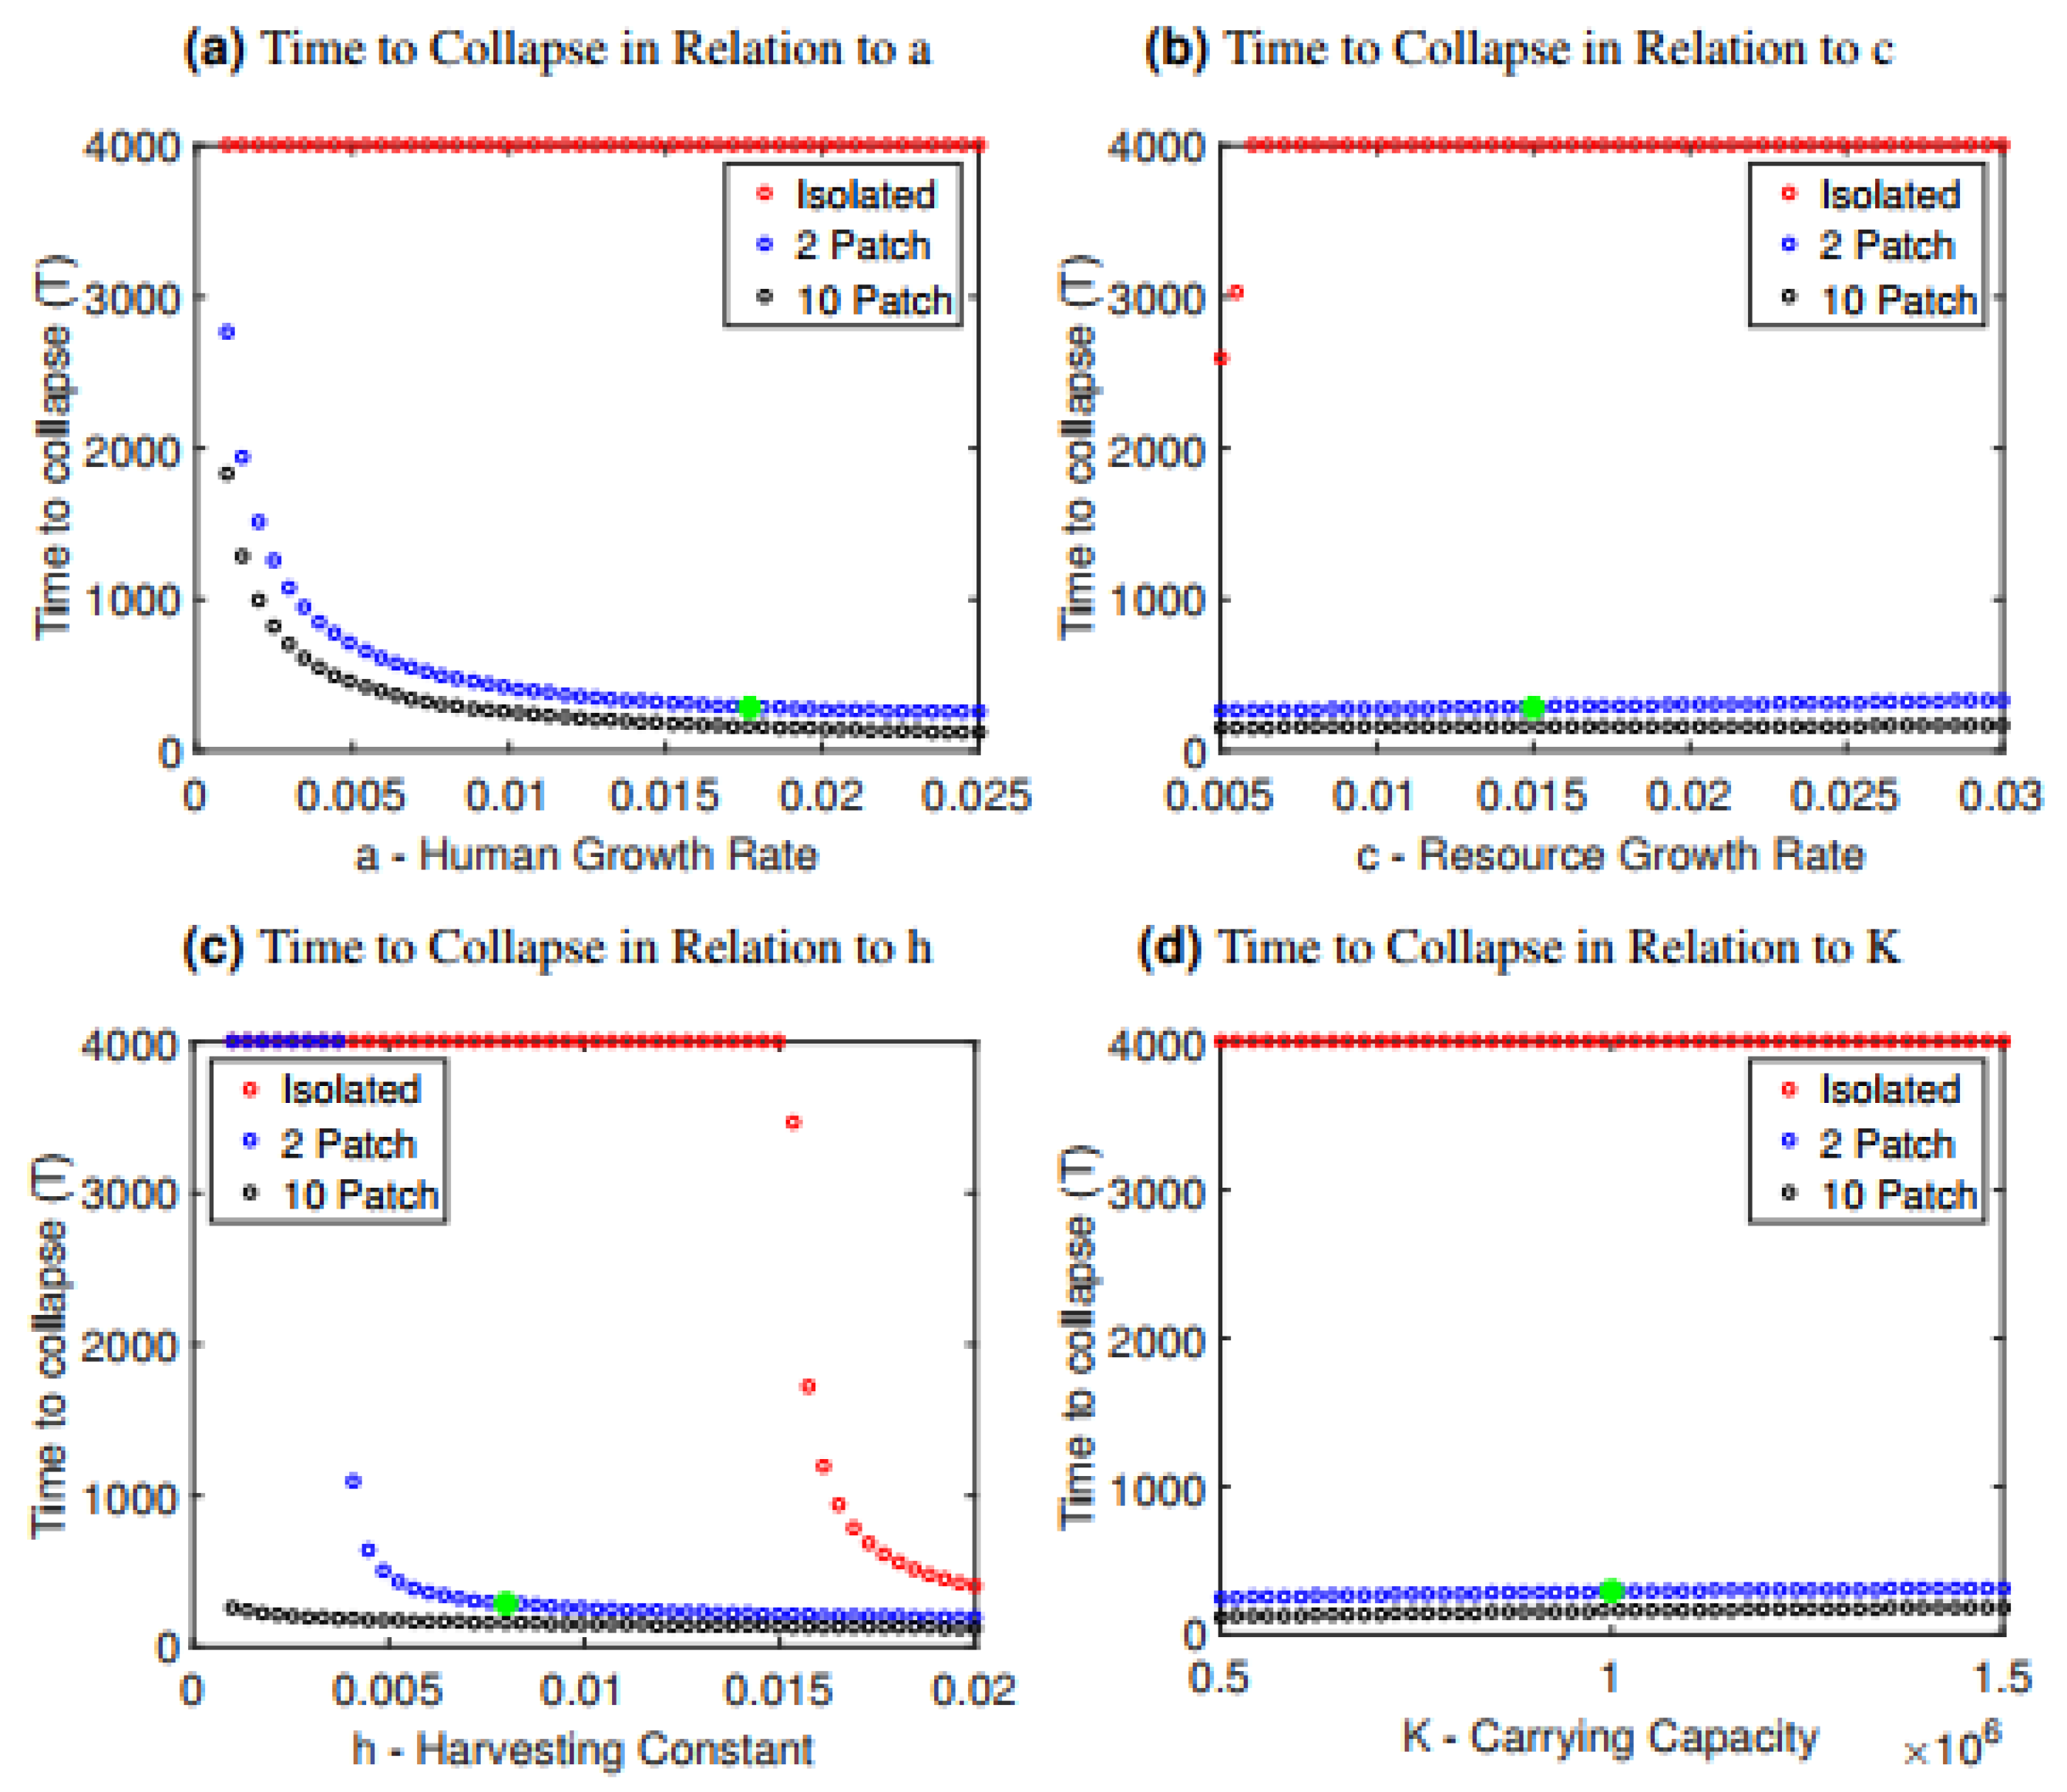
Across a broad range of parameter values, time to collapse in the interconnected case is much shorter, demonstrating that the interconnection of the two populations is detrimental to the stability of the system (Figure 2 and Figure 3). The isolated case is more resilient to collapse, as we see that the model often survives indefinitely in all cases except when the harvesting constant or resource growth rate are changed drastically relative to the baseline values (Figure 2b,c). This is in contrast to the interconnected case, where nearly all parameter choices for the human growth rate a, the resource growth rate c, the harvesting constant h and the carrying capacity K lead to collapse. Collapse occurs more rapidly when the human growth rate a or the harvesting constant h are increased, since both scenarios correspond to populations growing unsustainably quickly ( or exploiting their resources unsustainably quickly (h). Interestingly, it is relatively independent of the carrying capacity K and the resource growth rate c. Therefore, in this system, increasing carrying capacity (K) by boosting yield, or increasing the ability of the resource to replenish itself (r) has relatively little effect in delaying the collapse.
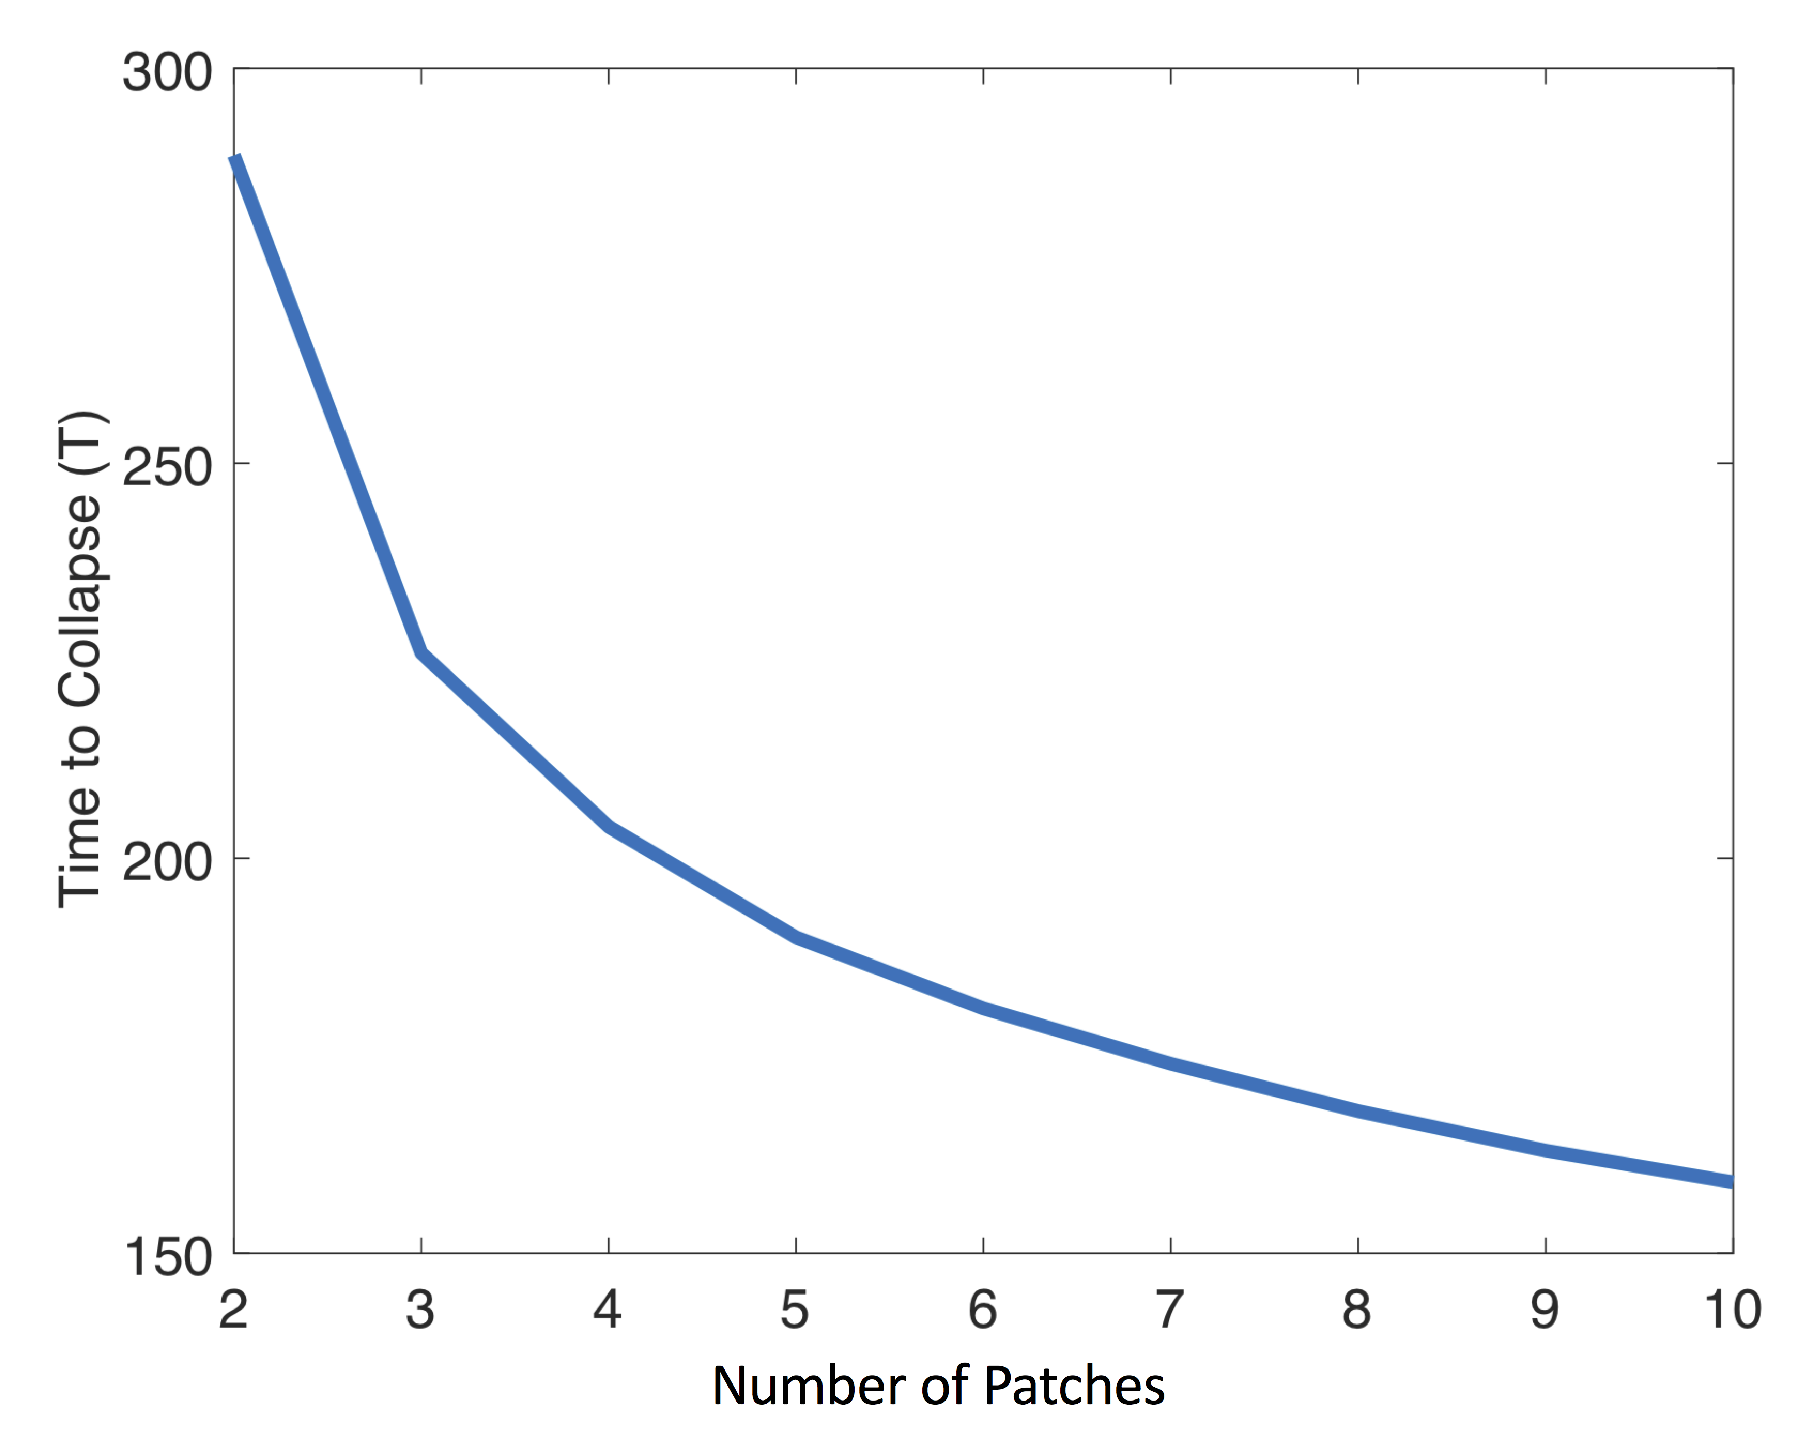
The more rapid collapse observed in the 10-patch model compared to the two-patch model (Figure 1) is also robust under these parameter variations (Figure 2). As the number of population patches increases from 2 to 10, the time to collapse declines with the number of patches (Figure 4).
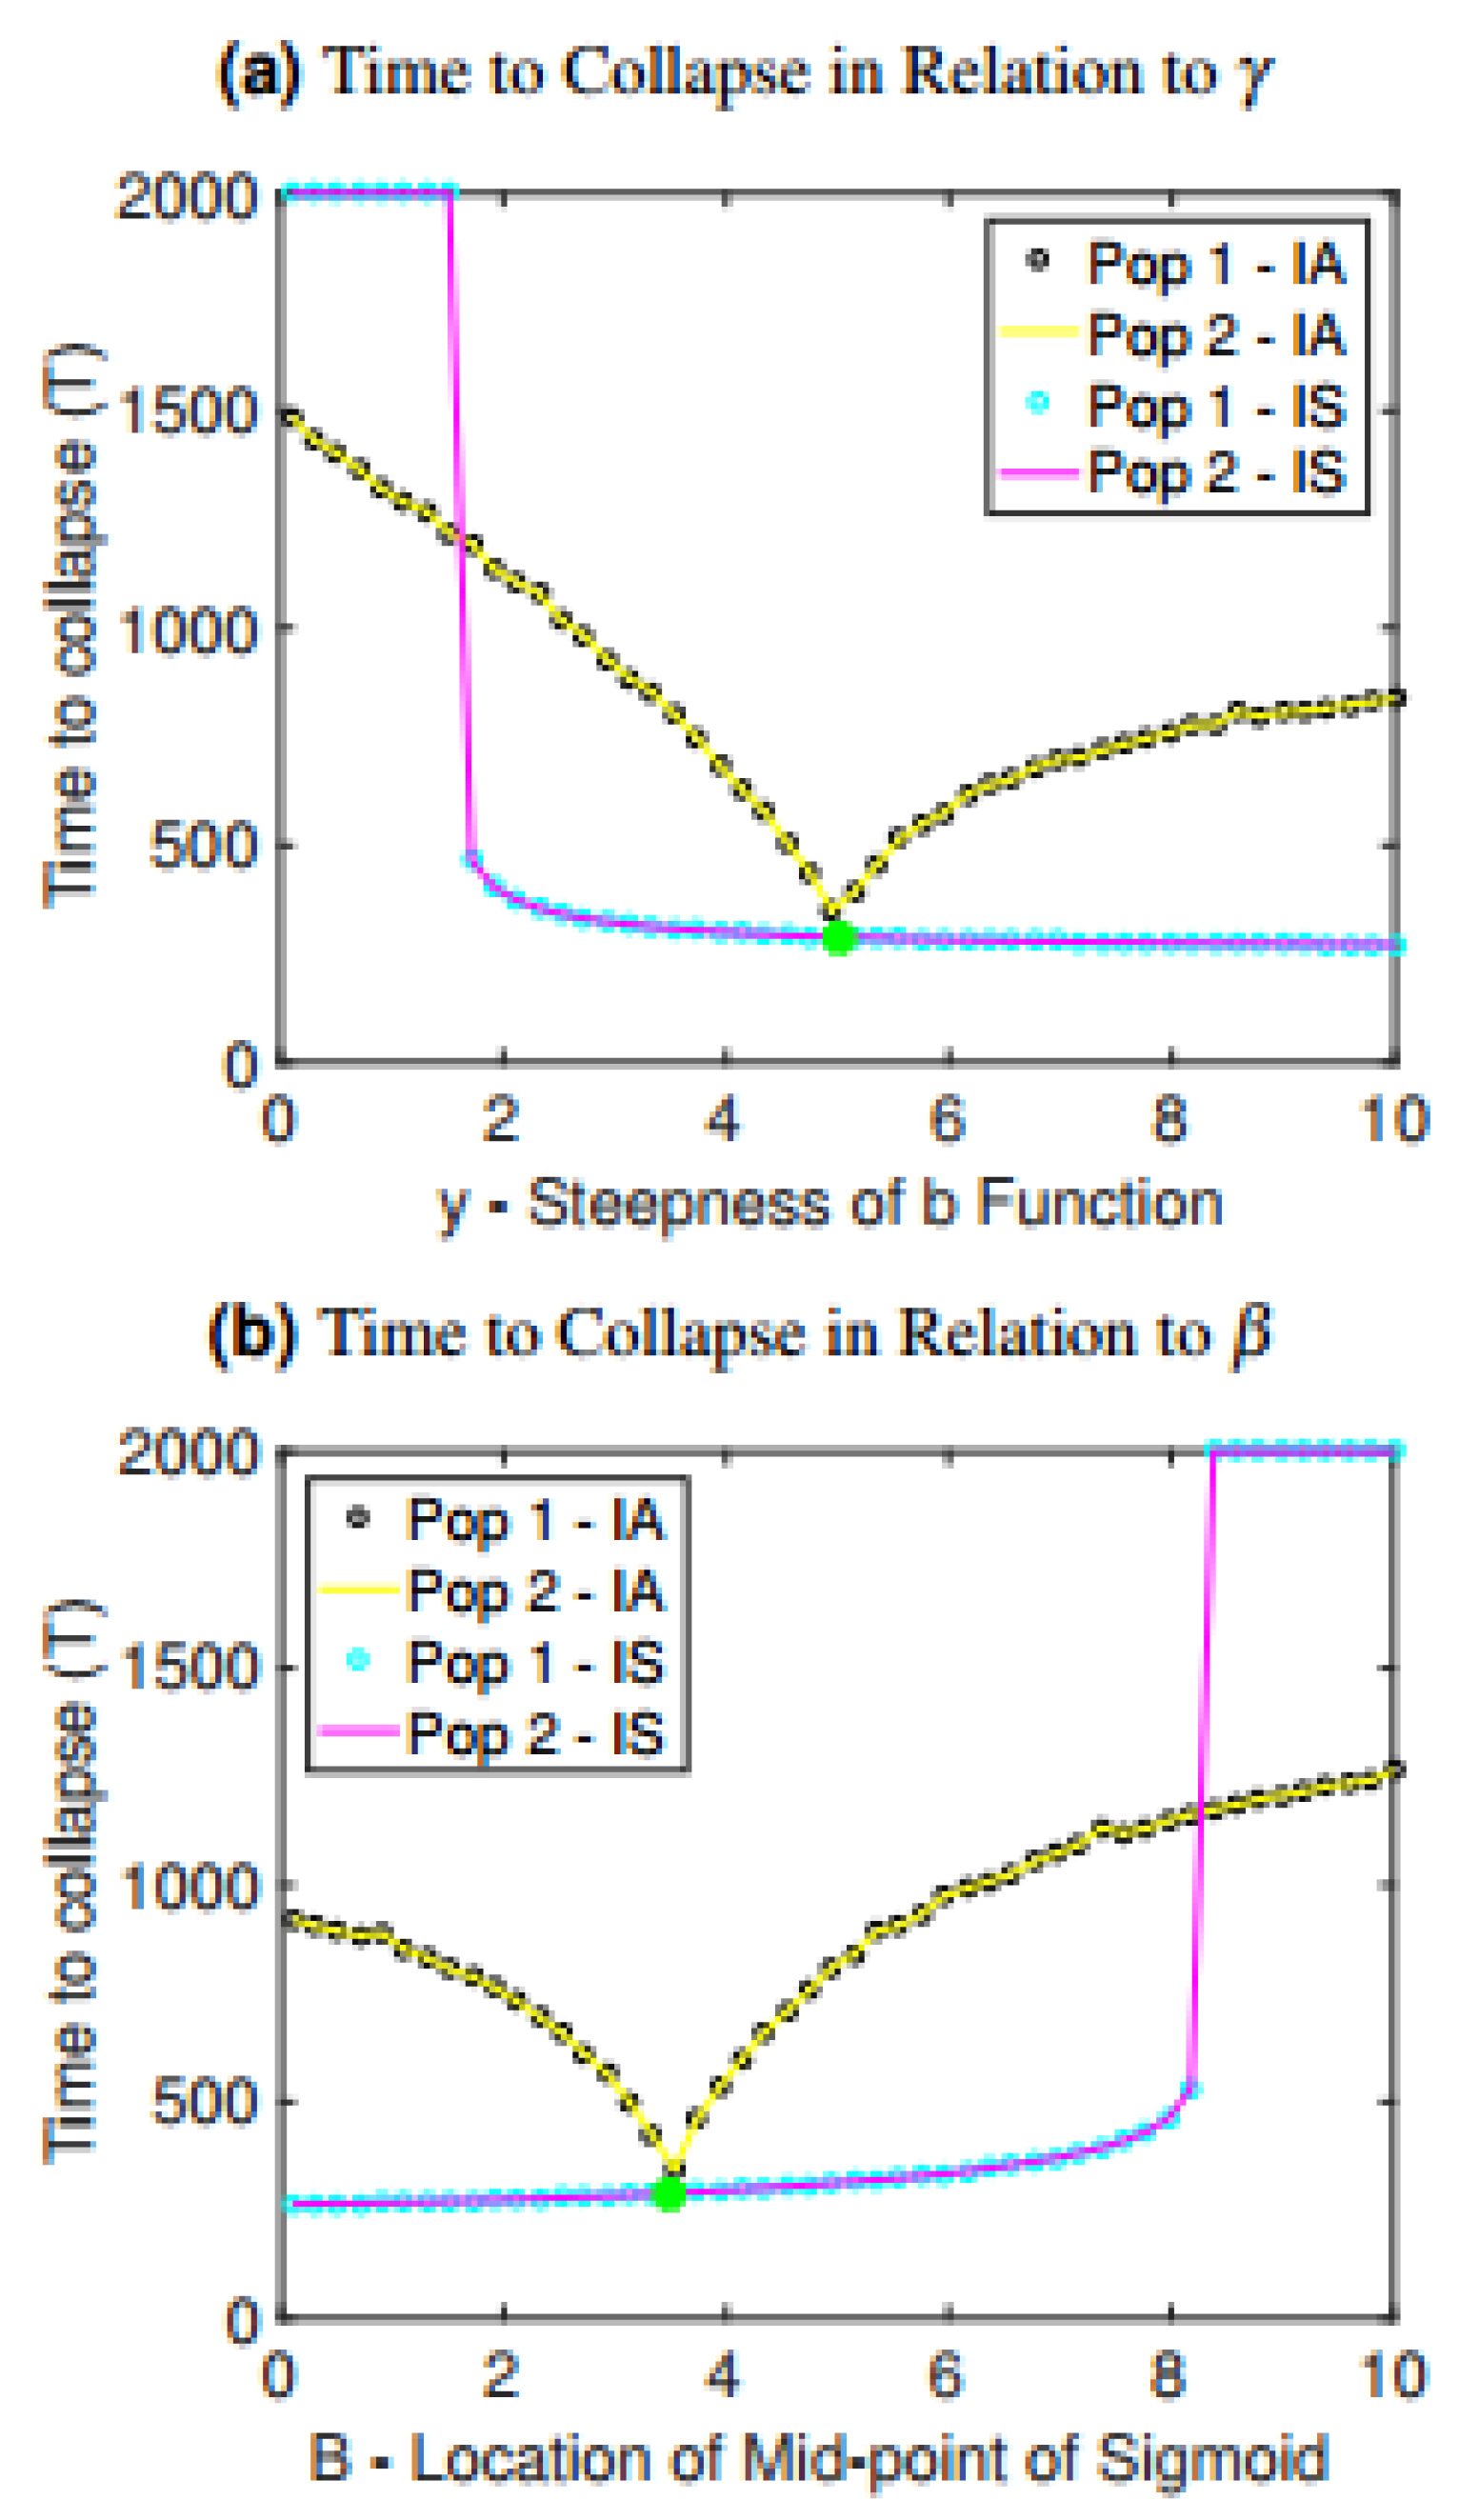
The observed relationships between time to collapse and interconnectedness are also preserved under variation in parameters controlling the rate at which one patch harvests resources from another patch: , which controls the midpoint location in the sigmoidal function, and , which controls the steepness of the sigmoidal function (Figure 3). When is increased, the switch to harvesting from other patches happens more quickly, causing more rapid collapse (Figure 3a). Interestingly, if is sufficiently low (meaning the sigmoidal function transitions smoothly), then collapse does not occur. Hence, if populations transition more gradually to harvesting from other patches, collapse can be avoided. When is decreased, populations begin harvesting from other patches earlier and more intensely, causing more rapid collapse (Figure 3b).
The case of asymmetric parameter variation is also considered in Figure 3 to provide a contrast with our baseline assumption of symmetric parameter values. As the value of is increased for only one of the populations while the value of for the other population is held constant, the time to collapse decreases for both populations until it reaches a minimum at the baseline value, and then starts to increase again (Figure 3a). Similarly, if is increased for only one of the populations, time to collapse decreases until it reaches the baseline value but then increases again (Figure 3b). This suggests that heterogeneity in the metapopulation may stave off collapse.
3.3. Parameter Planes
By varying two parameters at one time and holding all others constant at their baseline values, we can understand parameter combinations that lead to collapse or survival under the isolated and interconnected scenarios. It is evident from these parameter planes that the isolated case of the model is far less prone to collapse over the same ranges of parameter values. Collapse occurs for a much wider part of the parameter plane under the interconnected symmetric case than under the isolated case (electronic supplementary material, Figure S1). In contrast to the baseline parameter values, we observe parameter regimes in the interconnected symmetric case where increasing the resource growth rate c can move the populations into a region of sustainability. Introducing asymmetry to the parameter plans, such that the two parameter values for one population are varied while the parameter values for the other population are held at baseline values, we observe that sustainability is a more frequent outcome than in the symmetric case, but occurs less frequently than in the isolated case (electronic supplementary material, Figure S1).
3.4. Impact of Inequality
To observe the effect of inequality on system dynamics, we created an additional scenario involving two unequal populations. Population 1 has a higher starting population size, population growth rate, resource growth rate and harvesting efficiency, but a lower carrying capacity than population 2, which has more resources but a lower starting population size and growth rate. Population 1 is also more prone to take resources from population 2 than vice versa. The inequality scenario was simulated with and without interconnections. Parameter values can be found in electronic supplementary material, Table S1 and the initial conditions were (0) = 50,000, (0) = 25,000, (0) = 250,000, (0) = 1,000,000.
In the interconnected case (electronic supplementary material, Figure S2), population 1 grows relatively quickly (Figure S2a), reaching their maximum population size nearly 100 years before population 2. In the process, they exhaust all of their resources early in the simulation (Figure S2b). However, this causes very little disturbance to population 1 since there is only a small, nearly non-existent, decrease in population size at the time of resource depletion. This is due to their early dependence on population 2’s resources (Figure S2g) dampening the effect that over-exploitation has on their own population. After this point, both populations continue to consume population 2’s resources (Figure S2d) until the inevitable depletion, causing both populations to collapse.
In the corresponding isolated but unequal case (electronic supplementary material, Figure S3), the outcomes are very different. Population 2 begins a similar population increase as in the interconnected case, but the population avoids complete collapse and instead recovers to a stable state (Figure S3c). However, population 1 grows unsustainably, over-depletes their resource, and collapses (Figure S3a,b). Hence, for these parameter values, we observe that the dichotomy between outcomes in the isolated and interconnected scenario persists when the two populations are unequal.
4. Discussion
In this paper we extended a single population model where a population harvests a depletable resource, to a metapopulation setting where a population patch can also harvest resources from other patches, when their own resources run sufficiently low. We showed how the populations collapse faster and for a broader range of parameter values when patches are allowed to harvest resources from other patches. As the number of patches increases, the effect is amplified.
Interconnections accelerate collapse in this model because the ability to harvest resources from other patches enables populations to access a larger resource pool. Consequently, the populations are able to grow at a very rapid rate, compared to the case where patches are isolated from one another. Each patch population size grows beyond what is sustainable using only the resources in a single patch, and this causes rapid collapse as the resources disappear and all patches are left with unsustainably high populations. This mechanism operates even when the net resource growth rate parameter exceeds the net population growth rate parameter . Collapse remains possible in the isolated scenario, but the smaller available resource pool means that collapse happens for a more restricted parameter regime.
This effect was robust under a wide range of parameter variation. We also found that asymmetry in parameter values between the two patches does not change the qualitative results, but does tend to stave off collapse. We speculate that models with greater heterogeneity (such that each patch has a unique set of parameter values) might replicate this feature, but we leave this for future work. We furthermore found that collapse can occur in a scenario of inequality between the two patches, although we did not test the robustness of this finding to parameter variation.
Our model embodies some aspects of the “red and green loop” sustainability framework as introduced by Cumming et al. [57]. The red/green sustainability framework describes how populations become increasingly disconnected from their impacts as they urbanize [57]. In a ‘green’ phase, populations are highly dependent on their local environment for their subsistence, and therefore feedback from the environmental implications of human activity is quick to down-regulate human activity. However, as populations develop technologically and draw their resources from a global resource pool, their economic activities cause environmental impacts that are no longer felt by them but rather by geographically distant populations, weakening the short-term coupling between humans and their environment. This process is captured by, for instance, the linkages between local deforestation and high pressure for international agricultural exports [58], and the large dependence seafood markets in Japan, the United States, and the European Union on foreign sources [59]. Populations in our model can depend on resources harvested non-locally, such that the population is buffered from the implications of their harvesting activities in the short term (red loop). As the population transitions to relying on the resources of other patches as its own resources are depleted, the red loop progresses to a red trap corresponding to collapse of both populations in the interconnected scenario. In comparison, in the isolated case, populations are much more dependent on their local resources and feel the impacts of their harvesting choices immediately (green loop).
Our model was relatively simple and follows a structure similar to those used to study natural population dynamics, such as interacting predator and prey species. For instance, the switch from harvesting resources in one patch to harvesting resources in another patch bears similarity to diet diversification exhibited by generalist predators [60]. Alternatively, cross-patch resource harvesting could represent prey (resource) immigration. However, the dynamics of our model differ from prey immigration in the crucial aspect that the resource does not reproduce on the new patch it has been moved to—it is simply consumed upon arrival.
To develop our model we made simplifying assumptions that may influence its predictions. For instance, due to the structure of our sigmoidal function governing cross-patch harvesting and in particular the assumed dependence of cross-patch harvesting on , patches tend to collapse simultaneously when becomes small. Moreover, patches cannot prevent cross-patch harvesting. In reality, effective institutions (where they exist) would be able to prevent cross-patch harvesting through legislation and this might have the effect of preventing collapse from spreading to all patches. Future work could study the effects of retaining a portion of local resources for the native patch’s exclusive use. Similarly, allowing migration of individuals as well as cross-patch harvesting could influence dynamics, perhaps even to the point of preventing collapse [43]. Non-human species migrate when local resources are depleted; humans migrate but technology now allows them to import the resources they need without migrating. Allowing cross-patch harvesting while preventing migration could therefore be particularly dangerous. Similarly, we assumed a Malthusean world where more resources are always converted into more offspring. However, it is observed that most populations go through a demographic transition to lower fertility when they become sufficiently industrialized [21]. Incorporating this effect into the model may help prevent unsustainable growth, although the strength of the effect depends on whether increases in per capita resource consumption outstrip the benefits of slowed population growth.
Another possible extension of the model is to include dynamically changing parameters. At the moment, all parameters in the model are static. However, technological improvements mean that parameters like the harvesting efficiency h and cross-patch harvesting should change over the course of the simulation. In this vein, work by Reuveny and Decker [41] explores how technological advancement affects a human-resource population model. Similarly, modifications to our model could be implemented, and their effects studied. Finally, we assumed a complete network where each is connected to each other patch, but the dynamics of incomplete networks where some patches are not directly connected to one another (as represented by the international trade network in agricultural commodities [61]) could yield different dynamics.
In our multi-population socio-ecological model where populations grow by harvesting a depletable resource, the ability of one patch to support its population growth by harvesting resources from other patches increases population growth in the short run, but causes population collapse in all patches in the long run. This effect is robust to parameter variation, and is accelerated significantly by the inclusion of more patches. Given the ubiquity of cross-patch harvesting in real populations, more sophisticated socio-ecological models of human growth and resource consumption should be developed to study the role of metapopulation effects.
Supplementary Materials
The following are available online at https://www.mdpi.com/2071-1050/11/7/1852/s1, Figure S1: Parameter planes showing how outcomes depend on parameter combinations for (a, d, g) isolated scenarios, (b, e, h) interconnected asymmetric scenario, and (c, f, i) interconnected symmetric scenario. Yellow indicates survival of the populations and blue represents collapse; Figure S2: Results from a scenario of inequality between two populations for the interconnected case. Population 1 is significantly more industrialized and more prone to take resources from population 2. Subpanels show (a) patch 1 population size, (b) patch 1 resources, (c) patch 2 population size, (d) patch 2 resources, (e) total resources available to population 1, (f) total resources available to population 2, (g) percentage of population 2 resources taken by population 1; Figure S3: Results from an inequality scenario identical to Figure S2, except without interconnection of the populations. Table S1: Parameter values used for the inequality scenario.
Author Contributions
Conceptualization, M.A. and C.T.B.; analysis of model and generation of results, Z.D.; writing, all authors.
Funding
This research was supported by NSERC Discovery Grants to M.A. and C.T.B.
Conflicts of Interest
The authors declare no conflict of interest.
References
- Verhulst, P.F. Notice sur la loi que la population suit dans son accroissement. correspondance mathématique et physique publiée par a. Quetelet 1838, 10, 113–121. [Google Scholar]
- Pearl, R.; Slobodkin, L. The Growth of Populations. Q. Rev. Biol. 1976, 51, 6–24. [Google Scholar] [CrossRef]
- Gamito, S. Growth models and their use in ecological modelling: An application to a fish population. Ecol. Model. 1998, 113, 83–94. [Google Scholar] [CrossRef]
- Hanson, F.B.; Tuckwell, H.C. Logistic growth with random density independent disasters. Theor. Popul. Biol. 1981, 19, 1–18. [Google Scholar] [CrossRef]
- Noy-Meir, I. Stability of grazing systems: An application of predator-prey graphs. J. Ecol. 1975, 63, 459–481. [Google Scholar] [CrossRef]
- Rosenzweig, M.L.; MacArthur, R.H. Graphical representation and stability conditions of predator-prey interactions. Am. Nat. 1963, 97, 209–223. [Google Scholar]
- Holt, R.D. Food webs in space: On the interplay of dynamic instability and spatial processes. Ecol. Res. 2002, 17, 261–273. [Google Scholar]
- Hanski, I. Metapopulation dynamics. Nature 1998, 396, 41. [Google Scholar] [CrossRef]
- Nee, S.; Hassell, M.P.; May, R.M. Two-species metapopulation models. In Metapopulation Biology; Elsevier: Amsterdam, The Netherlands, 1997; pp. 123–147. [Google Scholar]
- Hanski, I. Metapopulation ecology; Oxford University Press Inc.: Oxford, UK, 1999; pp. 2–3. [Google Scholar]
- Hanski, I. Spatially realistic theory of metapopulation ecology. Naturwissenschaften 2001, 88, 372–381. [Google Scholar] [CrossRef]
- Tilman, D.; May, R.M.; Lehman, C.L.; Nowak, M.A. Habitat destruction and the extinction debt. Nature 1994, 371, 65–66. [Google Scholar] [CrossRef]
- Brown, J.H.; Kodric-Brown, A. Turnover rates in insular biogeography: Effect of immigration on extinction. Ecology 1977, 58, 445–449. [Google Scholar] [CrossRef]
- Earn, D.J.; Rohani, P.; Grenfell, B.T. Persistence, chaos and synchrony in ecology and epidemiology. Proc. R. Soc. Lond. B Biol. Sci. 1998, 265, 7–10. [Google Scholar] [CrossRef] [PubMed]
- Eriksson, A.; Elías-Wolff, F.; Mehlig, B.; Manica, A. The emergence of the rescue effect from explicit within-and between-patch dynamics in a metapopulation. Proc. R. Soc. B 2014, 281, 20133127. [Google Scholar] [CrossRef] [PubMed]
- Metcalf, C.; Munayco, C.; Chowell, G.; Grenfell, B.; Bjørnstad, O. Rubella metapopulation dynamics and importance of spatial coupling to the risk of congenital rubella syndrome in Peru. J. R. Soc. Interface 2010, 8, 369–876. [Google Scholar] [CrossRef] [PubMed]
- Gilarranz, L.J.; Bascompte, J. Spatial network structure and metapopulation persistence. J. Theor. Biol. 2012, 297, 11–16. [Google Scholar] [CrossRef] [PubMed]
- Dolrenry, S.; Stenglein, J.; Hazzah, L.; Lutz, R.S.; Frank, L. A metapopulation approach to African lion (Panthera leo) conservation. PLoS ONE 2014, 9, e88081. [Google Scholar] [CrossRef] [PubMed]
- Lloyd, A.L.; May, R.M. Spatial heterogeneity in epidemic models. J. Theor. Biol. 1996, 179, 1–11. [Google Scholar] [CrossRef]
- Moses, M.E.; Brown, J.H. Allometry of human fertility and energy use. Ecol. Lett. 2003, 6, 295–300. [Google Scholar] [CrossRef]
- Bauch, C.T. Wealth as a source of density dependence in human population growth. Oikos 2008, 117, 1824–1832. [Google Scholar] [CrossRef]
- Burger, O.; DeLong, J.P.; Hamilton, M.J. Industrial energy use and the human life history. Sci. Rep. 2011, 1, 56. [Google Scholar] [CrossRef]
- Malthus, T.R. An Essay on the Principle of Population: Or, a View of Its Past and Present Effects on Human Happiness; Reeves & Turner: London, UK, 1888. [Google Scholar]
- Rockström, J.; Steffen, W.; Noone, K.; Persson, Å.; Chapin, F.S., III; Lambin, E.; Lenton, T.; Scheffer, M.; Folke, C.; Schellnhuber, H.J.; et al. Planetary boundaries: Exploring the safe operating space for humanity. Ecol. Soc. 2009, 14, 32. [Google Scholar] [CrossRef]
- Lindkvist, E.; Ekeberg, Ö.; Norberg, J. Strategies for sustainable management of renewable resources during environmental change. Proc. R. Soc. B R. Soc. 2017, 284, 20162762. [Google Scholar] [CrossRef] [PubMed] [Green Version]
- Innes, C.; Anand, M.; Bauch, C.T. The impact of human-environment interactions on the stability of forest-grassland mosaic ecosystems. Sci. Rep. 2013, 3, 2689. [Google Scholar]
- Barlow, L.; Cecile, J.; Bauch, C.T.; Anand, M. Modelling interactions between forest pest invasions and human decisions regarding firewood transport restrictions. PLoS ONE 2014, 9, e90511. [Google Scholar]
- Henderson, K.; Bauch, C.T.; Anand, M. Alternative stable states and the sustainability of forests, grasslands, and agriculture. Proc. Natl. Acad. Sci. USA 2016, 113, 14552–14559. [Google Scholar] [Green Version]
- Bauch, C.T.; Sigdel, R.; Pharaon, J.; Anand, M. Early warning signals of regime shifts in coupled human—Environment systems. Proc. Natl. Acad. Sci. USA 2016, 113, 14560–14567. [Google Scholar]
- Motesharrei, S.; Rivas, J.; Kalnay, E. Human and nature dynamics (HANDY): Modeling inequality and use of resources in the collapse or sustainability of societies. Ecol. Econ. 2014, 101, 90–102. [Google Scholar] [CrossRef] [Green Version]
- De la Croix, D.; Dottori, D. Easter Island’s collapse: A tale of a population race. J. Econ. Growth 2008, 13, 27–55. [Google Scholar] [CrossRef]
- Reuveny, R.; Maxwell, J.W. Conflict and renewable resources. J. Confl. Resolut. 2001, 45, 719–742. [Google Scholar] [CrossRef]
- Bologna, M.; Flores, J. Mathematical model of Easter Island society collapse. arXiv, 2010; arXiv:1002.0068. [Google Scholar]
- Basener, B.; Ross, D.S. Booming and crashing populations and Easter Island. SIAM J. Appl. Math. 2004, 65, 684–701. [Google Scholar] [CrossRef]
- Nelson, S. Population Modeling with Delay Differential Equations; Rochester Institute of Technology: Rochester, NY, USA, 2013. [Google Scholar]
- Brander, J.A.; Taylor, M.S. The simple economics of Easter Island: A Ricardo-Malthus model of renewable resource use. Am. Econ. Rev. 1998, 88, 119–138. [Google Scholar]
- Dalton, T.R.; Coats, R.M. Could institutional reform have saved Easter Island? J. Evol. Econ. 2000, 10, 489–505. [Google Scholar] [CrossRef]
- D’Alessandro, S. Non-linear dynamics of population and natural resources: The emergence of different patterns of development. Ecol. Econ. 2007, 62, 473–481. [Google Scholar] [CrossRef] [Green Version]
- Dalton, T.R.; Coats, R.M.; Asrabadi, B.R. Renewable resources, property-rights regimes and endogenous growth. Ecol. Econ. 2005, 52, 31–41. [Google Scholar] [CrossRef]
- Pezzey, J.C.; Anderies, J.M. The effect of subsistence on collapse and institutional adaptation in population–resource societies. J. Dev. Econ. 2003, 72, 299–320. [Google Scholar] [CrossRef]
- Reuveny, R.; Decker, C.S. Easter Island: Historical anecdote or warning for the future? Ecol. Econ. 2000, 35, 271–287. [Google Scholar] [CrossRef]
- Anderies, J.M. On modeling human behavior and institutions in simple ecological economic systems. Ecol. Econ. 2000, 35, 393–412. [Google Scholar] [CrossRef]
- Roman, S.; Bullock, S.; Brede, M. Coupled Societies are More Robust Against Collapse: A Hypothetical Look at Easter Island. Ecol. Econ. 2017, 132, 264–278. [Google Scholar] [CrossRef] [Green Version]
- Axtell, R.L.; Epstein, J.M.; Dean, J.S.; Gumerman, G.J.; Swedlund, A.C.; Harburger, J.; Chakravarty, S.; Hammond, R.; Parker, J.; Parker, M. Population growth and collapse in a multiagent model of the Kayenta Anasazi in Long House Valley. Proc. Natl. Acad. Sci. USA 2002, 99, 7275–7279. [Google Scholar] [CrossRef] [Green Version]
- Flores, J.; Bologna, M.; Urzagasti, D. A mathematical model for the Andean Tiwanaku civilization collapse: Climate variations. J. Theor. Biol. 2011, 291, 29–32. [Google Scholar] [CrossRef]
- Meadows, D.; Randers, J.; Meadows, D. Limits to Growth: The 30-Year Update; Chelsea Green Publishing: White River Junction, VT, USA, 2004. [Google Scholar]
- Pearce, D.; Meadows, D.H.; Meadows, D.L.; Randers, J. Beyond the Limits: Global Collapse or a Sustainable Future; Earthscan Publications Ltd.: London, UK, 1992. [Google Scholar]
- Meadows, D.H.; Meadows, D.L.; Randers, J.; Behrens, W.W., III. The Limits to Growth: A Report to the Club of Rome. 1972. Available online: http://www.ask-force.org/web/Global-Warming/Meadows-Limits-to-Growth-Short-1972.pdf (accessed on 26 March 2019).
- Turner, G.M. A comparison of The Limits to Growth with 30 years of reality. Glob. Environ. Chang. 2008, 18, 397–411. [Google Scholar] [CrossRef]
- Maxwell, J.W.; Reuveny, R. Resource scarcity and conflict in developing countries. J. Peace Res. 2000, 37, 301–322. [Google Scholar] [CrossRef]
- Pagnutti, C.; Bauch, C.T.; Anand, M. Outlook on a worldwide forest transition. PLoS ONE 2013, 8, e75890. [Google Scholar] [CrossRef]
- Eberhardt, L. Is wolf predation ratio-dependent? Can. J. Zool. 1997, 75, 1940–1944. [Google Scholar] [CrossRef]
- May, R.M. Uses and abuses of mathematics in biology. Science 2004, 303, 790–793. [Google Scholar] [CrossRef]
- DeSA, U. World Population Prospects: The 2015 Revision, Volume I: Comprehensive Tables; Population Division of the Department of Economic and Social Affairs of the United Nations Secretariat: New York, NY, USA, 2015. [Google Scholar]
- Aizen, M.A.; Garibaldi, L.A.; Cunningham, S.A.; Klein, A.M. Long-Term global trends in crop yield and production reveal no current pollination shortage but increasing pollinator dependency. Curr. Biol. 2008, 18, 1572–1575. [Google Scholar] [CrossRef]
- Dockstader, Z. Population Model. 2016. Available online: https://github.com/zgmdocks/PopulationModel (accessed on 27 March 2019).
- Cumming, G.S.; Buerkert, A.; Hoffmann, E.M.; Schlecht, E.; von Cramon-Taubadel, S.; Tscharntke, T. Implications of agricultural transitions and urbanization for ecosystem services. Nature 2014, 515, 50–57. [Google Scholar] [CrossRef]
- DeFries, R.S.; Rudel, T.; Uriarte, M.; Hansen, M. Deforestation driven by urban population growth and agricultural trade in the twenty-first century. Nat. Geosci. 2010, 3, 178–181. [Google Scholar] [CrossRef]
- Swartz, W.; Sumaila, U.R.; Watson, R.; Pauly, D. Sourcing seafood for the three major markets: The EU, Japan and the USA. Mar. Policy 2010, 34, 1366–1373. [Google Scholar] [CrossRef]
- Novak, M.; Wolf, C.; Coblentz, K.; Shepard, I.D. Quantifying predator dependence in the functional response of generalist predators. Ecol. Lett. 2017, 20, 761–769. [Google Scholar]
- Fair, K.; Bauch, C.T.; Madhur, A. Dynamics of the global wheat trade network and resilience to shocks. Sci. Rep. 2017, 7, 7177. [Google Scholar]
Figure 1.
Model dynamics at baseline parameter values for the isolated, interconnected, and 10 population scenarios for (a) population size of patch 1, (b) resource availability in patch 1, (c) total resources available to population 1, and (d) percentage of harvest of patch 2 taken by population 1. Results for population 2 and patch 2 are symmetrical.

Figure 2.
Time to collapse for the isolated and interconnected cases as it depends on changes in (a) the human growth rate a, (b) the resource growth rate c, (c) the harvesting constant h and (d) the carrying capacity K. The parameter along the horizontal axes was changed for both patches, thus preserving symmetry. A green star has been included in each graph to indicate the value of the parameter in the baseline scenario.

Figure 3.
Time to collapse for the isolated and interconnected cases as it depends on changes in (a) the steepness of sigmoidal function , (b) the midpoint of sigmoidal function . A green and yellow star have been included in each graph to indicate the value of the parameter in the baseline scenario of the interconnected case and isolated case, respectively. IS denotes interconnected symmetric, wherein the parameter along the horizontal axes was changed for both patches, thus preserving symmetry, while IA denotes interconnected asymmetric, wherein the parameter values for population 1 was changed while the parameter values for population 2 was held constant at its baseline value.

Figure 4.
Time to collapse versus number of population patches included in model. Baseline parameter values were used (Table 1).
Figure 4.
Time to collapse versus number of population patches included in model. Baseline parameter values were used (Table 1).


Table 1.
Baseline model parameter values.
| Symbol | Definition | Value | Source |
|---|---|---|---|
| Population 1,2 net growth rate | 0.0177/year | [54] | |
| Resource growth rate in patch 1, 2 | 0.015/year | [55] | |
| Harvesting efficiency of population 1, 2 | 0.008/year | calibrated | |
| Carrying capacity of resources in patch 1, 2 | 1,000,000 | calibrated | |
| Controls location of the mid-point of the sigmoid for population 1, 2 | 3.5 | calibrated | |
| Controls steepness of the sigmoid for population 1, 2 | 5 | calibrated |
© 2019 by the authors. Licensee MDPI, Basel, Switzerland. This article is an open access article distributed under the terms and conditions of the Creative Commons Attribution (CC BY) license (http://creativecommons.org/licenses/by/4.0/).
Share and Cite
MDPI and ACS Style
Dockstader, Z.; Bauch, C.T.; Anand, M. Interconnections Accelerate Collapse in a Socio-Ecological Metapopulation. Sustainability 2019, 11, 1852. https://doi.org/10.3390/su11071852
AMA Style
Dockstader Z, Bauch CT, Anand M. Interconnections Accelerate Collapse in a Socio-Ecological Metapopulation. Sustainability. 2019; 11(7):1852. https://doi.org/10.3390/su11071852
Chicago/Turabian StyleDockstader, Zachary, Chris T. Bauch, and Madhur Anand. 2019. "Interconnections Accelerate Collapse in a Socio-Ecological Metapopulation" Sustainability 11, no. 7: 1852. https://doi.org/10.3390/su11071852
Note that from the first issue of 2016, this journal uses article numbers instead of page numbers. See further details here.