Article

Development of Sustainable Heterogeneous Catalysts for the Photocatalytic Treatment of Effluents

by
Herbet B. Sales
1,*,
Romualdo R. Menezes
1,
Gelmires A. Neves
1,
João J. N. de Souza
2,
Jailson M. Ferreira
2,
Laís Chantelle
3,
André L. Menezes de Oliveira
3 and
Hélio de L. Lira
1
1
Laboratory of Materials Technology (LTM), Department of Materials Engineering, Federal University of Campina Grande (UFCG), Campina Grande, Paraíba 58429-900, Brazil
2
Laboratory of Characterization and Development of Nanomaterials (LANANO), Federal Institute of Paraiba (IFPB), João Pessoa, Paraíba 58011-000, Brazil
3
Research and Extension Nucleus: Fuel and Materials Laboratory (NPE/LACOM), Department of Chemistry, Federal University of Paraiba (UFPB), João Pessoa, Paraíba 58051-900, Brazil
*
Author to whom correspondence should be addressed.
Sustainability 2020, 12(18), 7393; https://doi.org/10.3390/su12187393
Submission received: 25 July 2020 / Revised: 27 August 2020 / Accepted: 2 September 2020 / Published: 9 September 2020

Abstract

:
The inadequate discharge of effluents from different sources without prior treatment can impact the characteristics of soil and water, which reflect serious environmental problems. Advanced oxidative processes (AOP) appear as a viable alternative for environmental remediation, including wastewater treatment. Herein, α-MoO3 and α-Fe2O3 semiconductors were synthesized at low temperature by a Pechini-based method and then applied in photocatalysis. The catalytic efficiency was performed under visible light toward the degradation of an organic persistent pollutant (Rhodamine B dye, RhB), commonly present in industries wastewater. The results indicated that the synthesized α-MoO3 or α-Fe2O3 photocatalysts presented a pronounced activity and promoted an efficient RhB degradation after 15 min of reaction. α-MoO3 had a degradation efficiency of 93% and 98%, while α-Fe2O3 showed 67% and 100% RhB degradation without and with the addition of H2O2, respectively. These results suggest that the synthesized oxides have high oxi-reductive capacity, which can be used for a fast and effective photodegradation of RhB and other organic persistent pollutants to minimize environmental impacts.

Graphical Abstract

1. Introduction

The contamination of water resources is considered as one of the major problems in developed countries and other in development. The significant amount of organic pollutants detected in water bodies (rivers, lakes and drinking water treatment plants) commonly originate from different industrial sectors (textile, food, paper, petrochemical and pharmaceutical industries). Among them, the textile industry is one of the segments that produce the most water bodies’ pollution due to the large amounts of water and synthetic dye consumption, which generates a large volume of effluents rich in organic matter, besides being heavily tinted by dyes that are not attached to the fiber of the tissues during the process [1,2,3,4].
In order to mitigate the disposal of contaminated effluents from industries and to minimize the environmental impacts caused by organic persistent pollutants in water, different water treatment methods have been developed. Among them, biological treatments that need long periods for effluents to reach standards’ requirements, filtration processes using membranes [5], electrochemical techniques [4], adsorption processes [6] and advanced oxidative processes (AOP) [7] can be mentioned. Particularly, heterogeneous photocatalysis, which is an advanced oxidative process, has been gaining a lot of attention in decontamination processes for being faster and more effective when compared to other processes.
During photocatalysis, a semiconductor material is irradiated by a light source with energy equal to or greater than that of its band gap. Thus, the irradiation promotes the excitation of electrons that helps to generate hydroxyl radicals (OH) with high oxidative power, and other intermediate species ( O 2   ,   H O 2 ,   etc . ) that act on the degradation of organic pollutants, even at low concentrations (<100 ppm) [8,9]. Various wide band gap semiconductor oxides, which include TiO2, SnO2, ZnO and WO3 [8,9,10,11,12,13,14], and metal chalcogenides (CdS and PbS) [15,16], have been applied as photosensitizers in the oxidation and reduction processes of organic molecules mediated by light. However, the application of high concentrations of these elements for the rapid mineralization of chemical species with environmental relevance can bring some practical inconveniences, besides being harmful to man and the aquatic ecosystem due to the short time stability. All these things make it difficult to consolidate most photocatalysts as alternatives for environmental applications [17].
Therefore, transition metal oxides such as MoO3 and Fe2O3 are promising candidates in photo-oxidative processes; especially due to their redox properties and because they are more environmentally friendly compared to other metallic-based systems. Particularly, iron oxide (Fe2O3) might be highlighted as one of the most important transition metal oxides [18] due to its interesting physical and chemical properties. Hematite (α-Fe2O3) in its rhombohedral R3c-type phase can be readily applied in photocatalytic reactions for the degradation of contaminants in water due to its high stability [19]. Zhang et al. [20] stated that the use of α-Fe2O3 in photocatalysis has a great practical advantage when visible light irradiation is employed in the process due to the band gap energy value (~1.9 eV) of Fe2O3, which is lower than that observed for TiO2 (~3.2 eV) [21]. Thus, different authors have investigated the efficiency of hematite (α-Fe2O3) in the Fenton and photo-Fenton process toward the degradation of different organic contaminants [20,22]. For instance, Zhang et al. [20] obtained 94.8% Rhodamine B dye (RhB) removal using Fe2O3/H2O2 after 180 min under UV and visible light irradiation. On the other hand, Xiao et al. [22] obtained a photodegradation efficiency of 98% for the Fe2O2/H2O2/vis system toward the degradation of red acid G (ARG) dye after 90 min of visible light exposure. The authors associate the catalytic properties of this material with deformations and/or defects in its crystal structure. Most iron oxides present iron cations in oxidation state +3 (Fe3+), which is its most stable form, it is easily synthesized by ecosystems and naturally absorbed by the human body [23]. Thus, it is evident that Fe2O3 becomes an excellent alternative as an environmentally friendly heterogeneous catalyst for wastewater treatment.
Molybdenite (α-MoO3) is another important oxide with great technological interest, especially in catalysis for hydrogen evolution, oxygen evolution, and fuel cells [24,25]. α-MoO3 is a non-toxic semiconductor oxide material with high chemical stability. This oxide has a band gap energy in the range of 3.0–4.0 eV [26], which makes it useful in UV-mediated photocatalysis. In spite of this, few studies have been dedicated to the use of α-MoO3 as photocatalysts for environmental remediation, since this material presents a low quantum yield that restricts its practical applications [25,27,28]. However, Huang et. al. [27] evaluated the photocatalytic activity of α-MoO3 toward Rhodamine B dye (RhB) degradation and observed that the catalyst presented a good performance after 160 min under UV exposure.
Several methods have already been used to synthesize α-Fe2O3- and α-MoO3-based materials, such as the sol–gel method [29], micro-wave assisted hydrothermal [30], and solvothermal methods [31], among others, but little is described about the synthesis of these oxides by a Pechini-based method, also known as the polymerizing complex method [32]. This method stands out from others because of its simplicity and low cost, besides presenting a good control of the desired phase, particle size and pore distribution. In addition, this method allows a homogeneous mixing of reagents at the molecular level, has good stoichiometric control and a low processing temperature [33].
In this context, this work aimed to produce sustainable materials based on rhombohedral iron oxide (α-Fe2O3) and orthorhombic molybdenum trioxide (α-MoO3) using a Pechini-based method to be applied in visible-light-driven heterogeneous photocatalysis for the degradation of Rhodamine B (RhB) dye. RhB dye was used as a target molecule commonly present in wastewater. RhB dye is a persistent organic pollutant compound widely used in agate dyeing industries, animal feed industries and textile industries. Moreover, RhB is also used as a fluorescent tracer in water and employed in the production of cartridges inkjet and laser printers [27,34,35,36]. It is also important mentioning that the visible light photocatalytic performance of α-Fe2O3 and α-MoO3 synthesized by the Pechini method has not been investigated toward Rhodamine B or any other organic dye compounds yet.

2. Experimental Procedure

2.1. Synthesis and Characterization of the Photocatalysts

α-Fe2O3 and α-MoO3 oxides were synthesized by the Pechini-based method [37], using stoichiometric amounts of ammonium molybdate tetrahydrate ((NH4)6Mo7O2·4H2O NEON, 83.0%), citric acid monohydrate (C2H8O7·H2O NEON, 99.8%), iron nitrate nonahydrate (Fe(NO3)3·9H2O SIGMA-ALDRICH, 98.0%) and ethylene glycol (C2H6O2 DINÂMICA, 99.5%). The precursor solutions were prepared by dissolving stoichiometric amounts of metal salts into citric acid (AC) solution in a proportion of 3 moles of AC to 1 mol of the metal to ensure the metal chelating. The mixing solution was maintained under constant stirring and heating at a temperature of approximately 65 °C. After the complete dissolution of the metal salts and AC, ethylene glycol (EG) with a mass ratio of 40% of EG to 60% of AC was added and the temperature was raised to 90 °C to promote the polymerization and then to form a polymeric resin. This polymeric resin has a clear and characteristic color of the precursor salt. Each resin was calcined at 300 °C for 2 h with a heating rate of 5 °C min−1 to obtain the precursor powders. The precursor powders of α-MoO3 and α-Fe2O3 were deagglomerated in a mortar and pestle, sieved through a 200-mesh sieve and calcined at 550 °C for 2 h at the heating rate of 5 °C min−1. The calcination temperature was optimized based on the formation of the desired crystalline phase of α-MoO3 (as described in the Discussion Section). Further details about the synthesis can be found in previous works [32,33].
The quality of the obtained α-MoO3 and α-Fe2O3 samples were investigated by X-ray powder diffraction (XRD) using a Shimadzu XRD 6000 diffractometer (Shimadzu Corporation, Tokyo, Japan) equipped with a KCuα1 radiation source. The short-range structural ordering was investigated by infrared (IR) spectroscopy using a Shimadzu IR Prestige-21 spectrophotometer (Shimadzu Corporation, Tokyo, Japan), and Raman spectroscopy using a Renishaw inVia confocal Raman microscope (Renishaw plc, Wotton-under-Edge, UK) that is equipped with an Ar laser. The morphology of the photocatalyst particles were evaluated by scanning electron microscopy (SEM) using a Shimadzu SSX 550 microscope (Shimadzu Corporation, Tokyo, Japan). The chemical composition of the samples was investigated using an energy dispersion X-ray (EDX) Shimadzu EDX 720 spectrophotometer (Shimadzu Corporation, Tokyo, Japan). The optical properties of the oxides were evaluated by ultraviolet–visible (UV–vis) absorption spectroscopy using a Shimadzu UV-3600 spectrometer (Shimadzu Corporation, Tokyo, Japan), and the optical band gap values (Eg) were determined using Wood and Tauc’s method [38]. The specific surface areas of Brunauer–Emmett–Teller (SBET) [39] were measured by N2 adsorption/desorption measurements using a BEL Japan BELSORP-mini II analyzer (BEL Japan Inc., Tokyo, Japan), while the particle sizes distribution was measured using laser light scattering performed on Malvern Mastersizer 2000 analyzer (Malvern Panalytical Instruments, Malvern, UK).

2.2. Photocatalysis and Adsorption Test

The photocatalytic efficiency of the α-Fe2O3 and α-MoO3 systems was evaluated toward the photodegradation of Rhodamine B (RhB) dye solution. The experiments were conducted in a custom-built photoreactor, containing a visible light irradiation source (λ = 500–800 nm, 160 W) placed on the top. The distance of 15 cm between the lamp and dye solution was maintained during the reactions. For the experiments, 10.0 mg of the oxide was dispersed in a petri dish containing 15.0 mL of the RhB stock solution previously prepared in a concentration of 5.0 mg L−1.
All the tests were performed in triplicate at pH 5.0 (natural pH of the RhB dye solution in a concentration of 5.0 mg L−1). A photolysis test was carried out under the same conditions without the presence of a photocatalyst, while an adsorption test was performed in the dark using the same methodology as described in our previous report [40].
To investigate the role of the hydroxyl radicals ( O H ) on the photocatalysis, 0.5 mL of hydrogen peroxide (H2O2, 30%) was added to the reaction vessel. Based on the literature reports, 0.5 mL of H2O2 is sufficient to increase the formation of further hydroxyl radicals ( O H ) to improve the photocatalytic activity of materials.
Therefore, to evaluate photolysis, an adsorption capacity and photocatalytic efficiency of the oxides with the presence or not of H2O2, an aliquot of the solution, was collected from the petri dish after 15 min of reaction, centrifuged and then filtered. After that, the resulting solution was analyzed by UV–vis absorption spectroscopy using a Shimadzu UV-1800 spectrophotometer, with a wavelength scanning between 400 and 800 nm. Thus, by monitoring the maximum absorption band of RhB at 553 nm, the final concentration of the solution can be calculated using the equation 1 as suggested by Rahman et al. [41] and Chantelle et al. [33]:
D e g r a d a t i o n   r a t e   ( % )   =   ( C 0 C C 0 )   ×   100
where C0 is the initial concentration at the time 0 min and C is the variable concentration at time t, respectively.
It is important mentioning that the maximum absorption of RhB is attributed to the chromophore group, which is responsible for the dye coloring [41,42] and the decrease in this band after photocatalysis indicates the photodegradation of the dye.

3. Result and Discussion

3.1. Characterization of the Photocatalysts

3.1.1. X-Ray Diffraction (XRD)

Figure 1 shows the XRD patterns of the MoO3 and Fe2O3 photocatalysts synthesized in the present work. To evaluate the crystallization process and the formation of the desired phase for MoO3, the sample was calcined at different temperatures and then analyzed by XRD (Figure 1a,b). The XRD patterns of MoO3 (Figure 1a,b) show that a long-range disordered phase was observed at 300 °C. The beginning of the sample crystallization occurred only at 350 °C as indicated by the presence of a few diffraction peaks in the XRD patterns of this sample (Figure 1a). A long-range structural ordering was achieved for the MoO3 sample calcined at 550 °C as indicated by the appearance of highly intense and well defined peaks in XRD (Figure 1b). All these diffraction peaks were then indexed to the orthorhombic Pbnm crystal structure (ICDD 05-0508) of α-MoO3, which is in good agreement with the XRD results reported by Layegh et al. [43].
In addition, it is possible to observe well defined and narrow diffraction peaks in the XRD patterns of Fe2O3 (Figure 1c). All the diffraction peaks were indexed to the rhombohedral-type structure with R3c symmetry (ICDD 33-0664), characteristic of the hematite mineral (α-Fe2O3), which is the most stable phase of iron oxide. This behavior agrees with other reported work [44]. Maggi et al. [45] observed the β-, γ- and α-phase transition of Fe2O3 when it is subjected to calcinations above 500 °C. Similarly, Mathevula et al. [29] synthesized hematite nanoparticles (α-Fe2O3) by the sol–gel method employing two-step heat treatments of 300 and 600 °C and observed the formation of the hematite phase after calcinations at 500 °C.
It is also important to mention that no peak related to any secondary phase was observed in the XRD patterns of the samples synthesized in this work. As a result, the proposed synthesis conditions and the calcination temperature of 550 °C contributed to the formation of well crystallized and single phase α-MoO3 and α-Fe2O3 samples in their thermodynamically stable structures.

3.1.2. Infrared Spectroscopy

The infrared spectra of the α-MoO3 and α-Fe2O3 samples are illustrated in Figure 2a,b, respectively, and the assignments of the main vibration bands are summarized in Table 1 and Table 2.
In Figure 1a, the bands observed in the region between 1000 and 400 cm−1 refer to the three band stretching vibration patterns of the orthorhombic structure of α-MoO3. The well-defined and narrow band at 997 cm−1 is attributed to the vibration bond ν(Mo=O) that involves the terminal oxygen atoms. Bands at 852 and 817 cm−1 are attributed to the angular deformation vibration of two-coordinated oxygens (Mo–O–Mo). The broad band at 592 cm−1 and the shoulder at 487 cm−1 are attributed to the vibrations of symmetrical Mo–O bonds that comprise the molybdenum and oxygen atoms. Some authors [46,47] observed similar band frequencies for the Mo–O group in comparison to that found in the present study (Table 1). As result, the formation of α-molybdenite crystallites is confirmed after calcination at 550 °C, which is in accordance with XRD data.
Figure 2b shows the characteristic IR pattern of the rhombohedral structure of α-Fe2O3. The high intensity vibration bands at 532 and 449 cm−1 were attributed to the stretching Fe–O bonds of the hematite, which agreed with other studies. For instance, Wang et al. [48] observed three patterns of band vibration for the same material, one at 578 cm−1, and two at 485 cm−1 and 380 cm−1 and the authors correlated these bands with the size, shape, and internal structure of the Fe2O3 particles. Žic et al. [49] investigated the influence of nitrate anions on the properties of hematite particles (α-Fe2O3) and obtained four vibration modes at 571, 461, 397 and 343 cm−1 associated to Fe–O stretching vibrations. Grigorie et al. [50], from the transformation of the maghemite phase (γ-Fe2O3) into hematite (α-Fe2O3), found two vibration bands at 542 and 488 cm−1 associated with the Fe–O bond vibrations. Therefore, all the IR results obtained in this work confirm the local structure vibrations of the synthesized oxides, which agree with the literature. A comparison of the IR modes observed in this work with the literature data is summarized in Table 2.

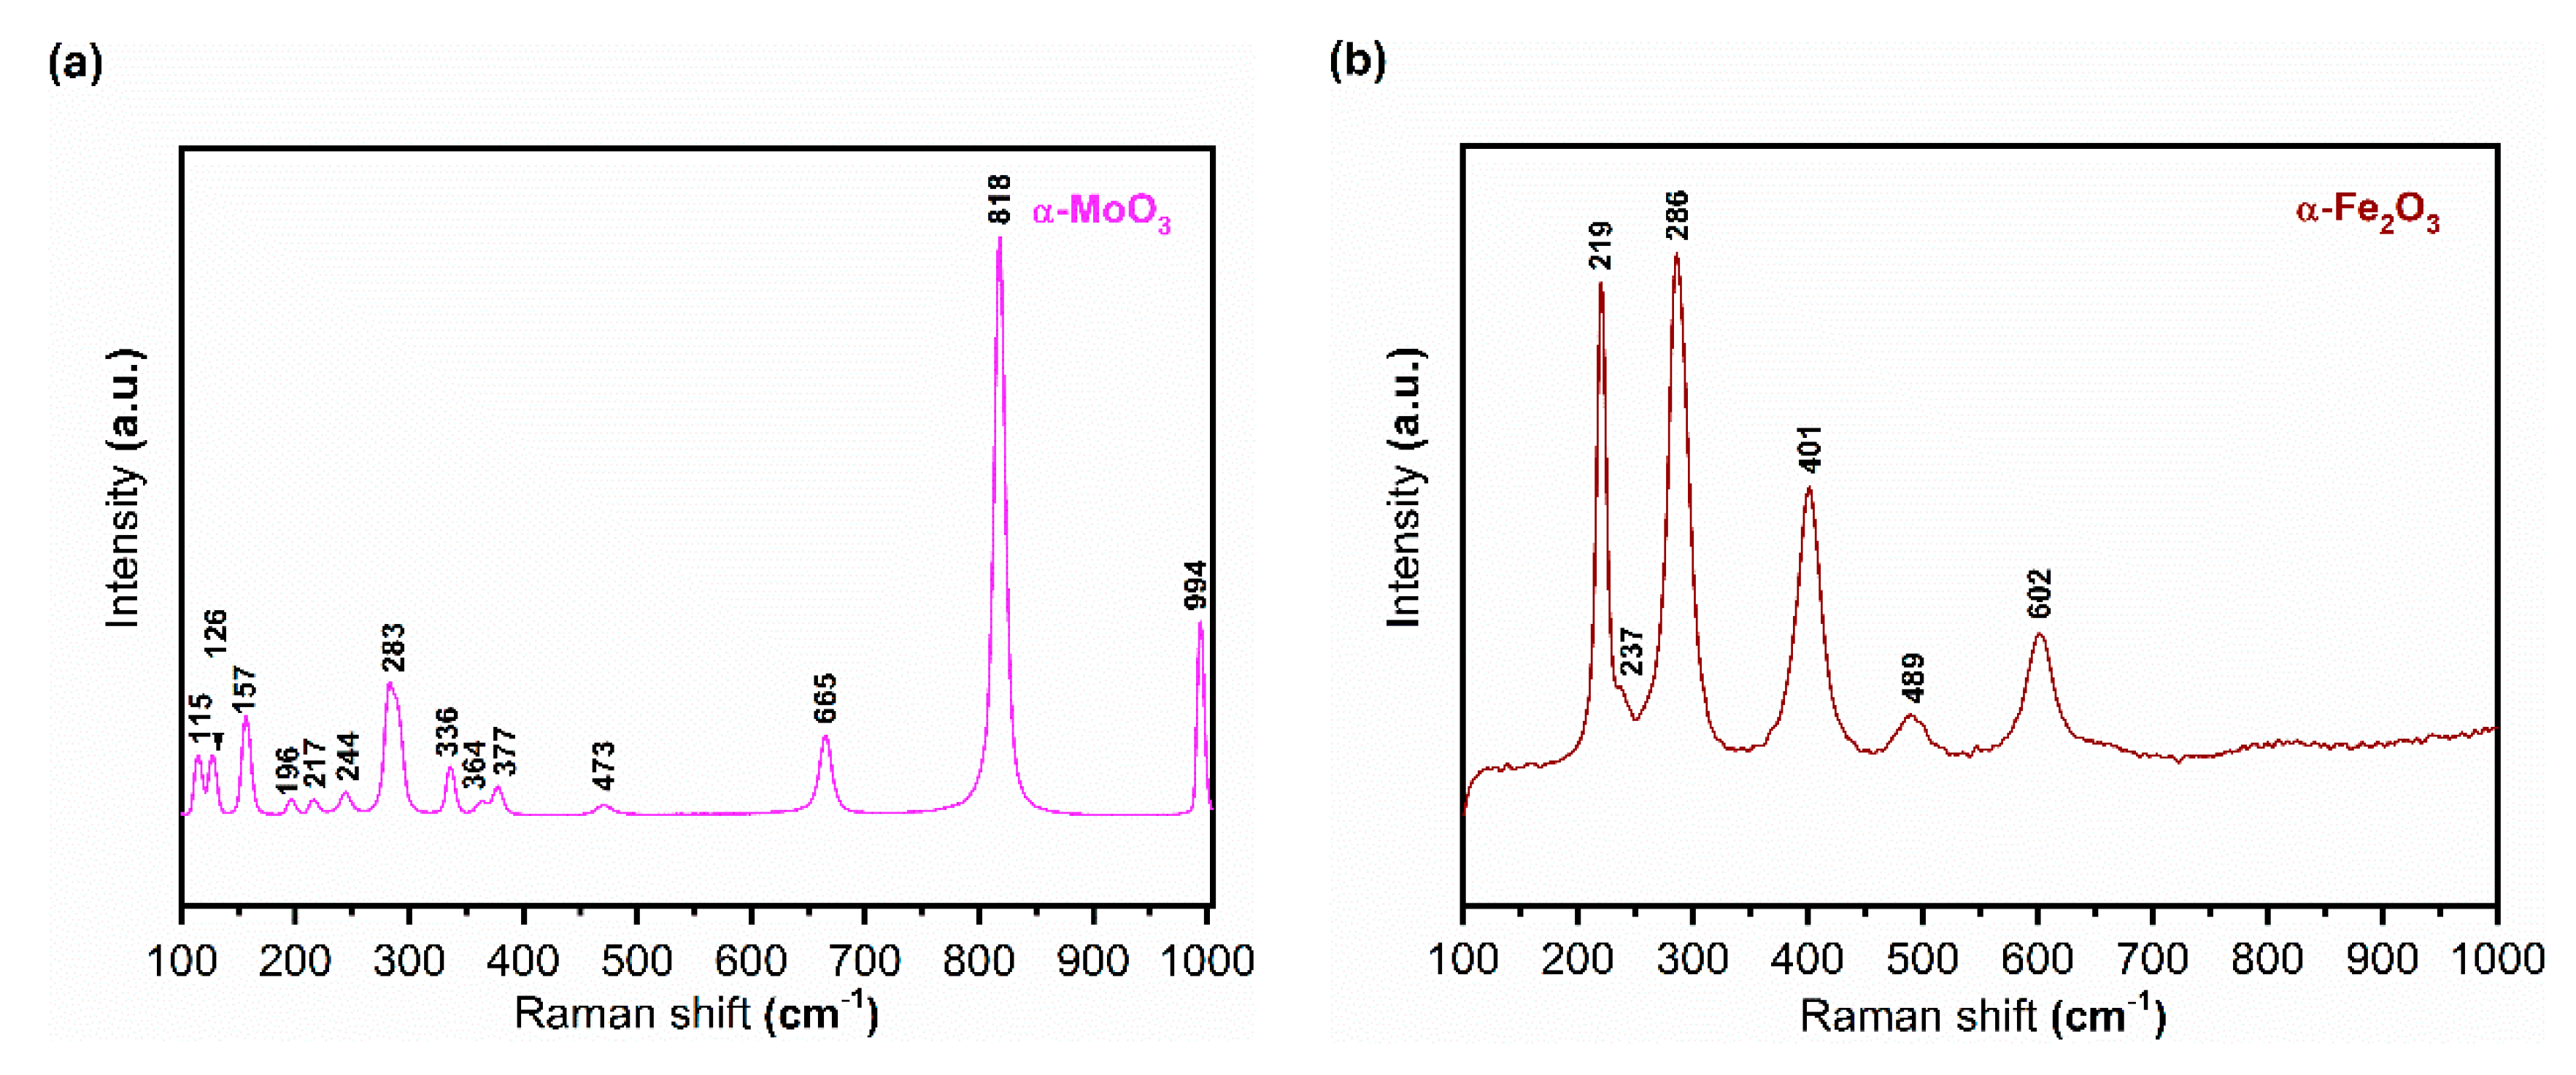
3.1.3. Raman Spectroscopy

The Raman spectra of the α-MoO3 and α-Fe2O3 photocatalysts are shown Figure 3a,b, respectively.
The spectrum of each material resulted from a sum of four spectra scanned in the frequency range between 100 and 1000 cm−1 acquired at different points in the samples. Well defined peaks related to the Raman active modes of α-MoO3 and α-Fe2O3 structures are observed in the spectra. Based on Raman results obtained for the molybdite phase (α-MoO3) (Figure 3a), high frequency and narrow bands positioned at 994 cm−1 and 818 cm−1 are observed. These bands are attributed to asymmetric vibrations of ( υ a s   M o = O ( 1 ) ) and symmetrical elongation modes ( υ a s   M o O 3 M o ) of the terminal oxygen O ( 1 ) atoms, unshared and doubly O ( 3 ) coordinated, respectively. The defined band centered at 665 cm−1 is attributed to the asymmetric stretching vibration ( υ M o O ( 2 ) M o ) of the oxygen atom doubly coordinated with two Mo, and the weak band at 473 cm−1 is characteristic of the O ( 2 , 2 ) M o 3 unit. The bands between 377 and 336 cm−1 are assigned to the vibration modes of the oxygen atoms O ( 2 ) in υ O ( 2 ) = M o = O ( 2 ) and the deformation of the oxygen atoms O ( 3 ) in δ O ( 3 ) M o O ( 3 ) . The band at 283 cm−1 is related to the wagging vibration of the oxygen atom O ( 1 ) in the δ O ( 1 ) = M o = O ( 1 ) unit, while the bands at 244 and 217 cm−1 are attributed to scissor-type vibrations of the oxygen atom O ( 2 ) in δ O ( 2 ) M o O ( 2 ) . Finally, the bands observed below 200 cm−1 correspond to the stretching, deformation and translational modes of the molybdenum oxide network [51].
For the hematite structure (α-Fe2O3), the spectrum (Figure 3b) presented the allowed Raman modes of the R3c symmetry. The band at 219 cm−1 is attributed to the A 1 g mode, and the others at 237, 286, 401 and 602 cm−1 are attributed to the E g symmetry mode characteristics of the iron oxide structure with R3c symmetry [52,53,54]. The first two frequencies correspond to external vibrations of the crystal (free rotations or translations of the molecule), and the latter two are attributed to internal vibrations. The band at 489 cm−1 represents the A 1 g transition mode. All these results confirm that both α-MoO3 and α-Fe2O3 samples synthesized in the present work are purely orthorhombic (Pbnm) and rhombohedral (R3c), respectively, without the presence of any other coexisting phase. All these results are in good agreement with XRD and IR data.

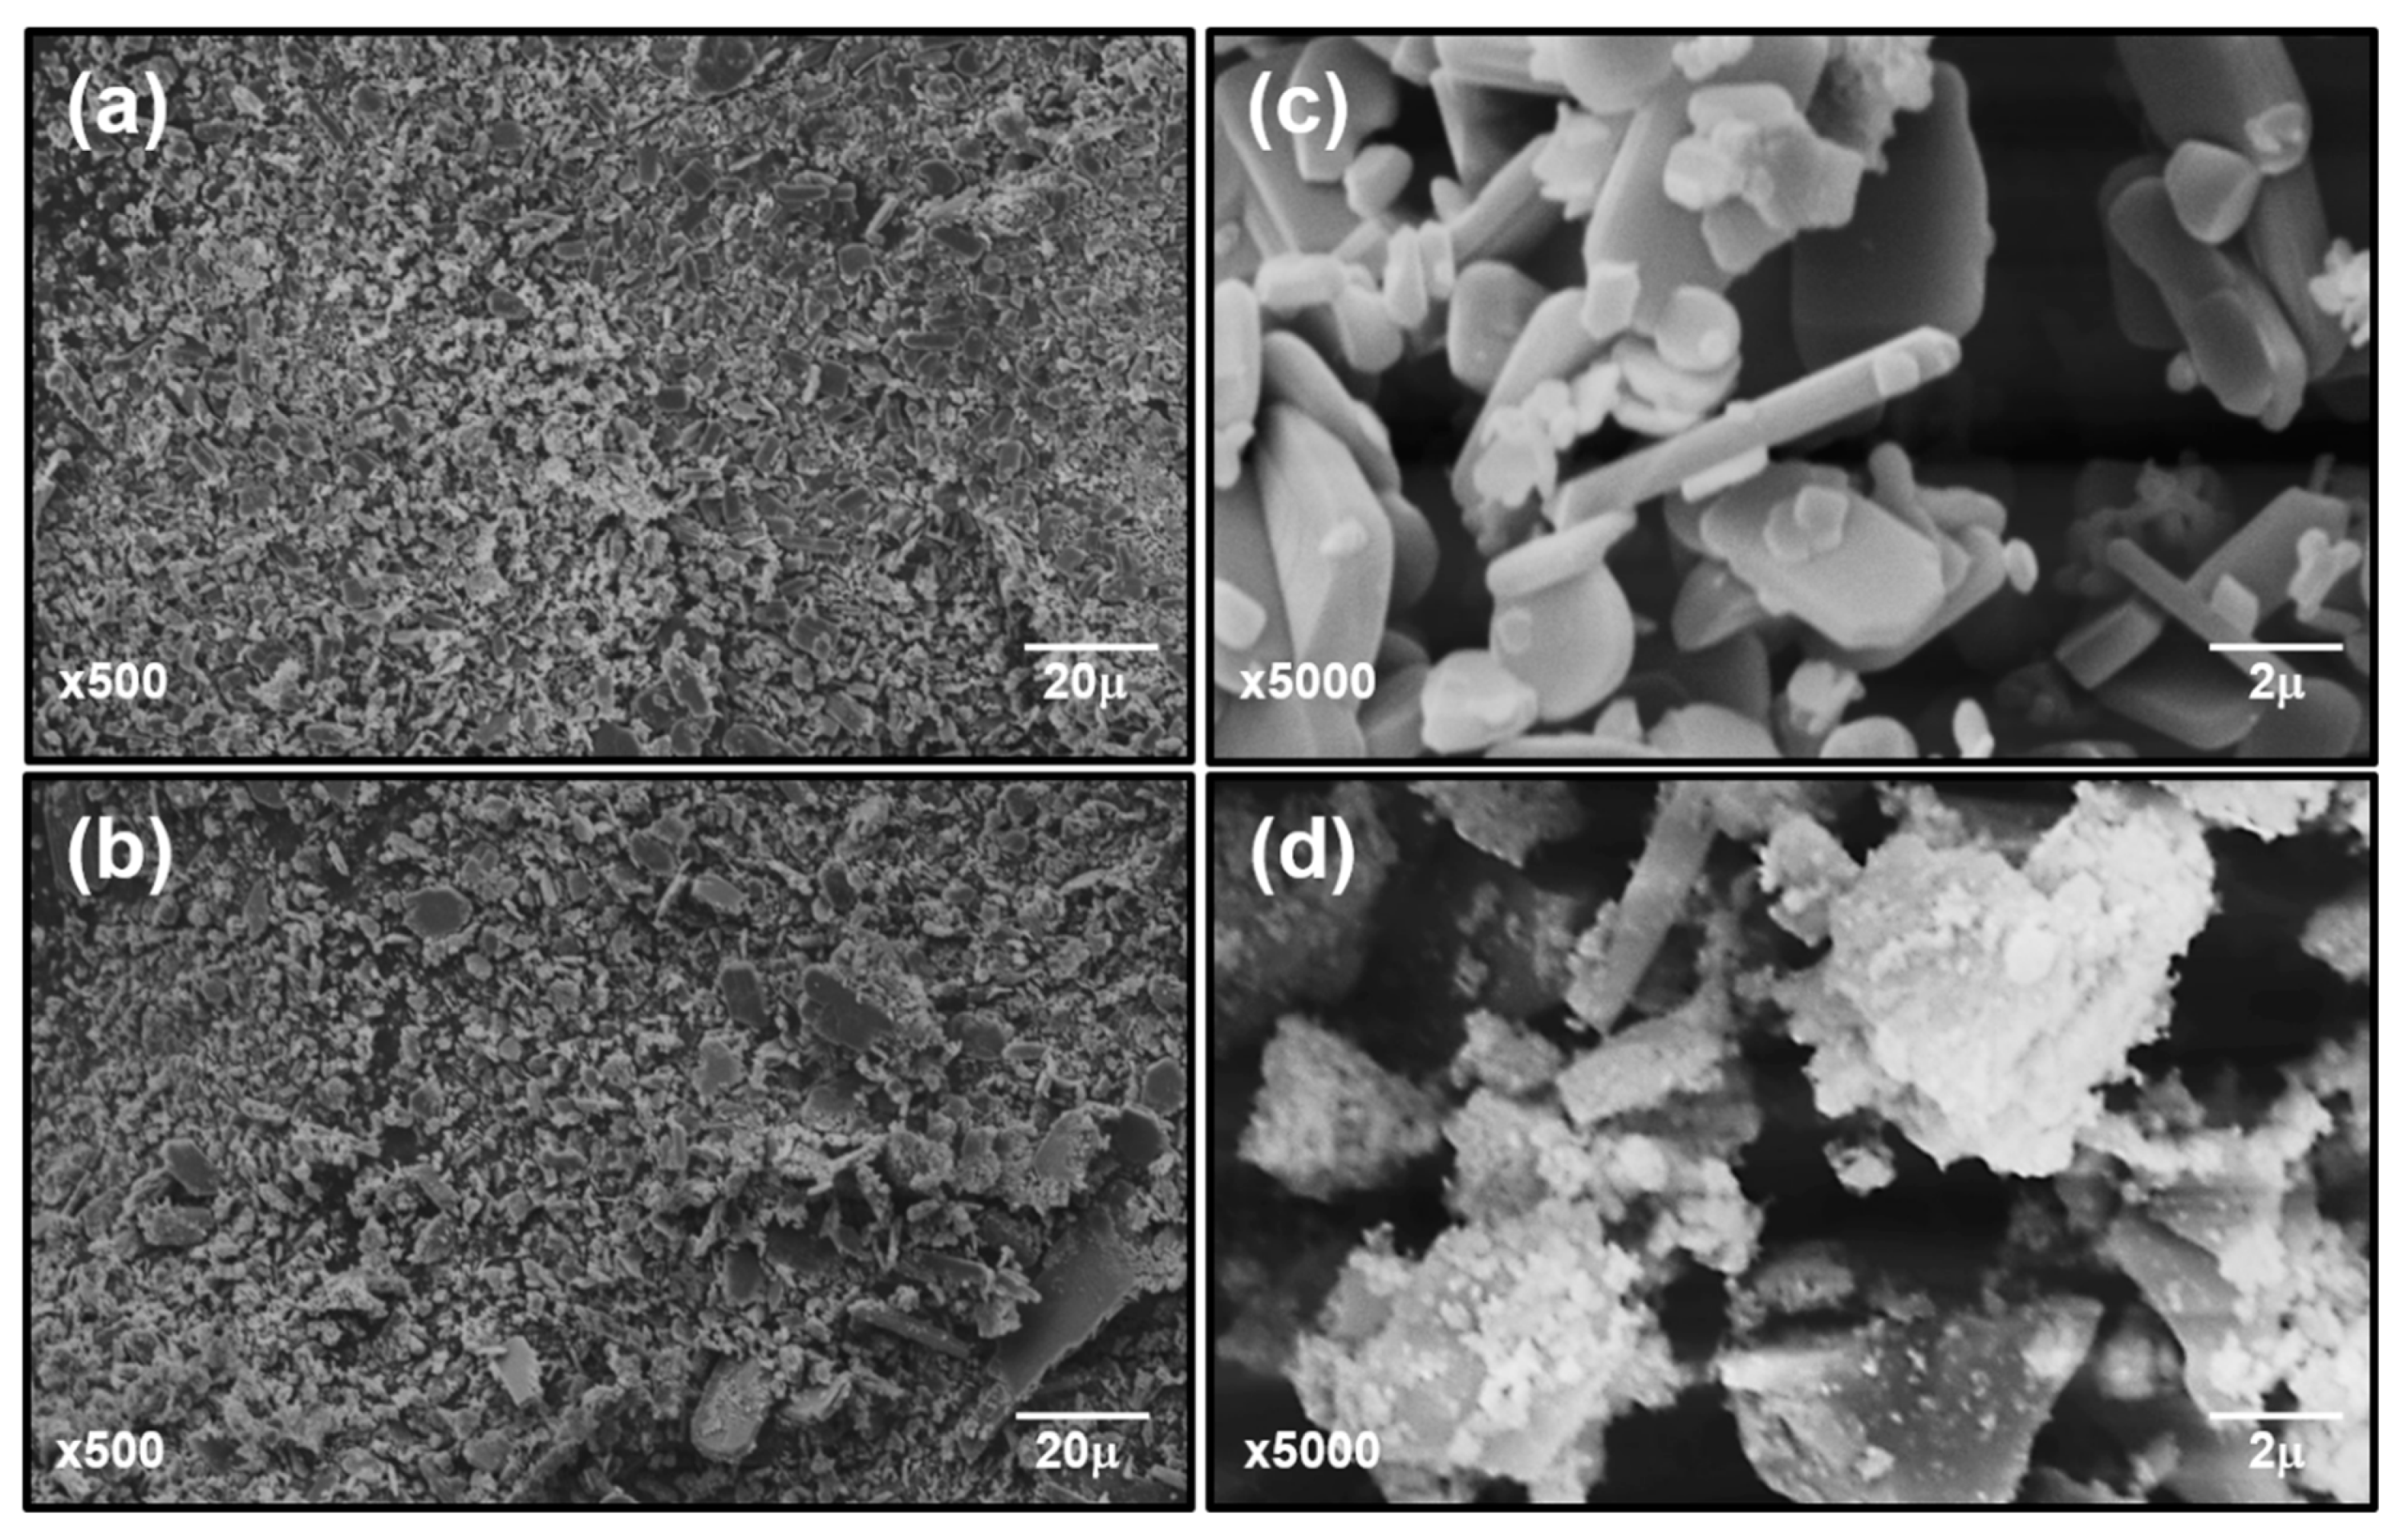
3.1.4. Microstructure Characteristics and Elemental Analysis

SEM images of the photocatalysts are displayed in Figure 4. The elemental composition obtained by X-ray dispersive energy (EDX) analysis is listed in Table 3.
A difference in the particles morphology was observed for α-MoO3 (Figure 4a,c) and α-Fe2O3 (Figure 4b,d) and it might be associated with the creation of different types of nucleation sites as a function of the composition. The orthorhombic α-MoO3 photocatalyst exhibited particles with a well-defined and unoriented plate-like morphology (Figure 4a,c). A similar result was observed by Chen et al. [55] who synthesized α-MoO3 nanoplates using inorganic–organic hybrids molybdate-based precursors, which were formed from the reaction of molybdic acid (MoO3·H2O) and n-octylamine at room temperature. The EDX results (Table 3) confirmed that the molybdenum ion is the major element present in the orthorhombic oxide structure. However, the presence of the volatile (SO3) in the α-MoO3 sample arises from the decomposition of the starting precursor [56], and insignificant traces of other elements resulting from the preparation process (Table 3).
Analyzing the SEM images of the hematite α-Fe2O3 (Figure 4b,d), an undefined morphology is observed, and aggregates composed by these unevenly distributed particles is also observed. Such morphology might be due to the thermal treatment that induces the particles sintering. Li et al. [57] observed similar morphological arrangements for hematite films deposited on Au and Ti. The results of X-ray spectroscopy by dispersive energy (EDX) for this system (Table 3) indicated a majority presence of iron metal confirming that the target composition was achieved for the α-Fe2O3 photocatalyst.

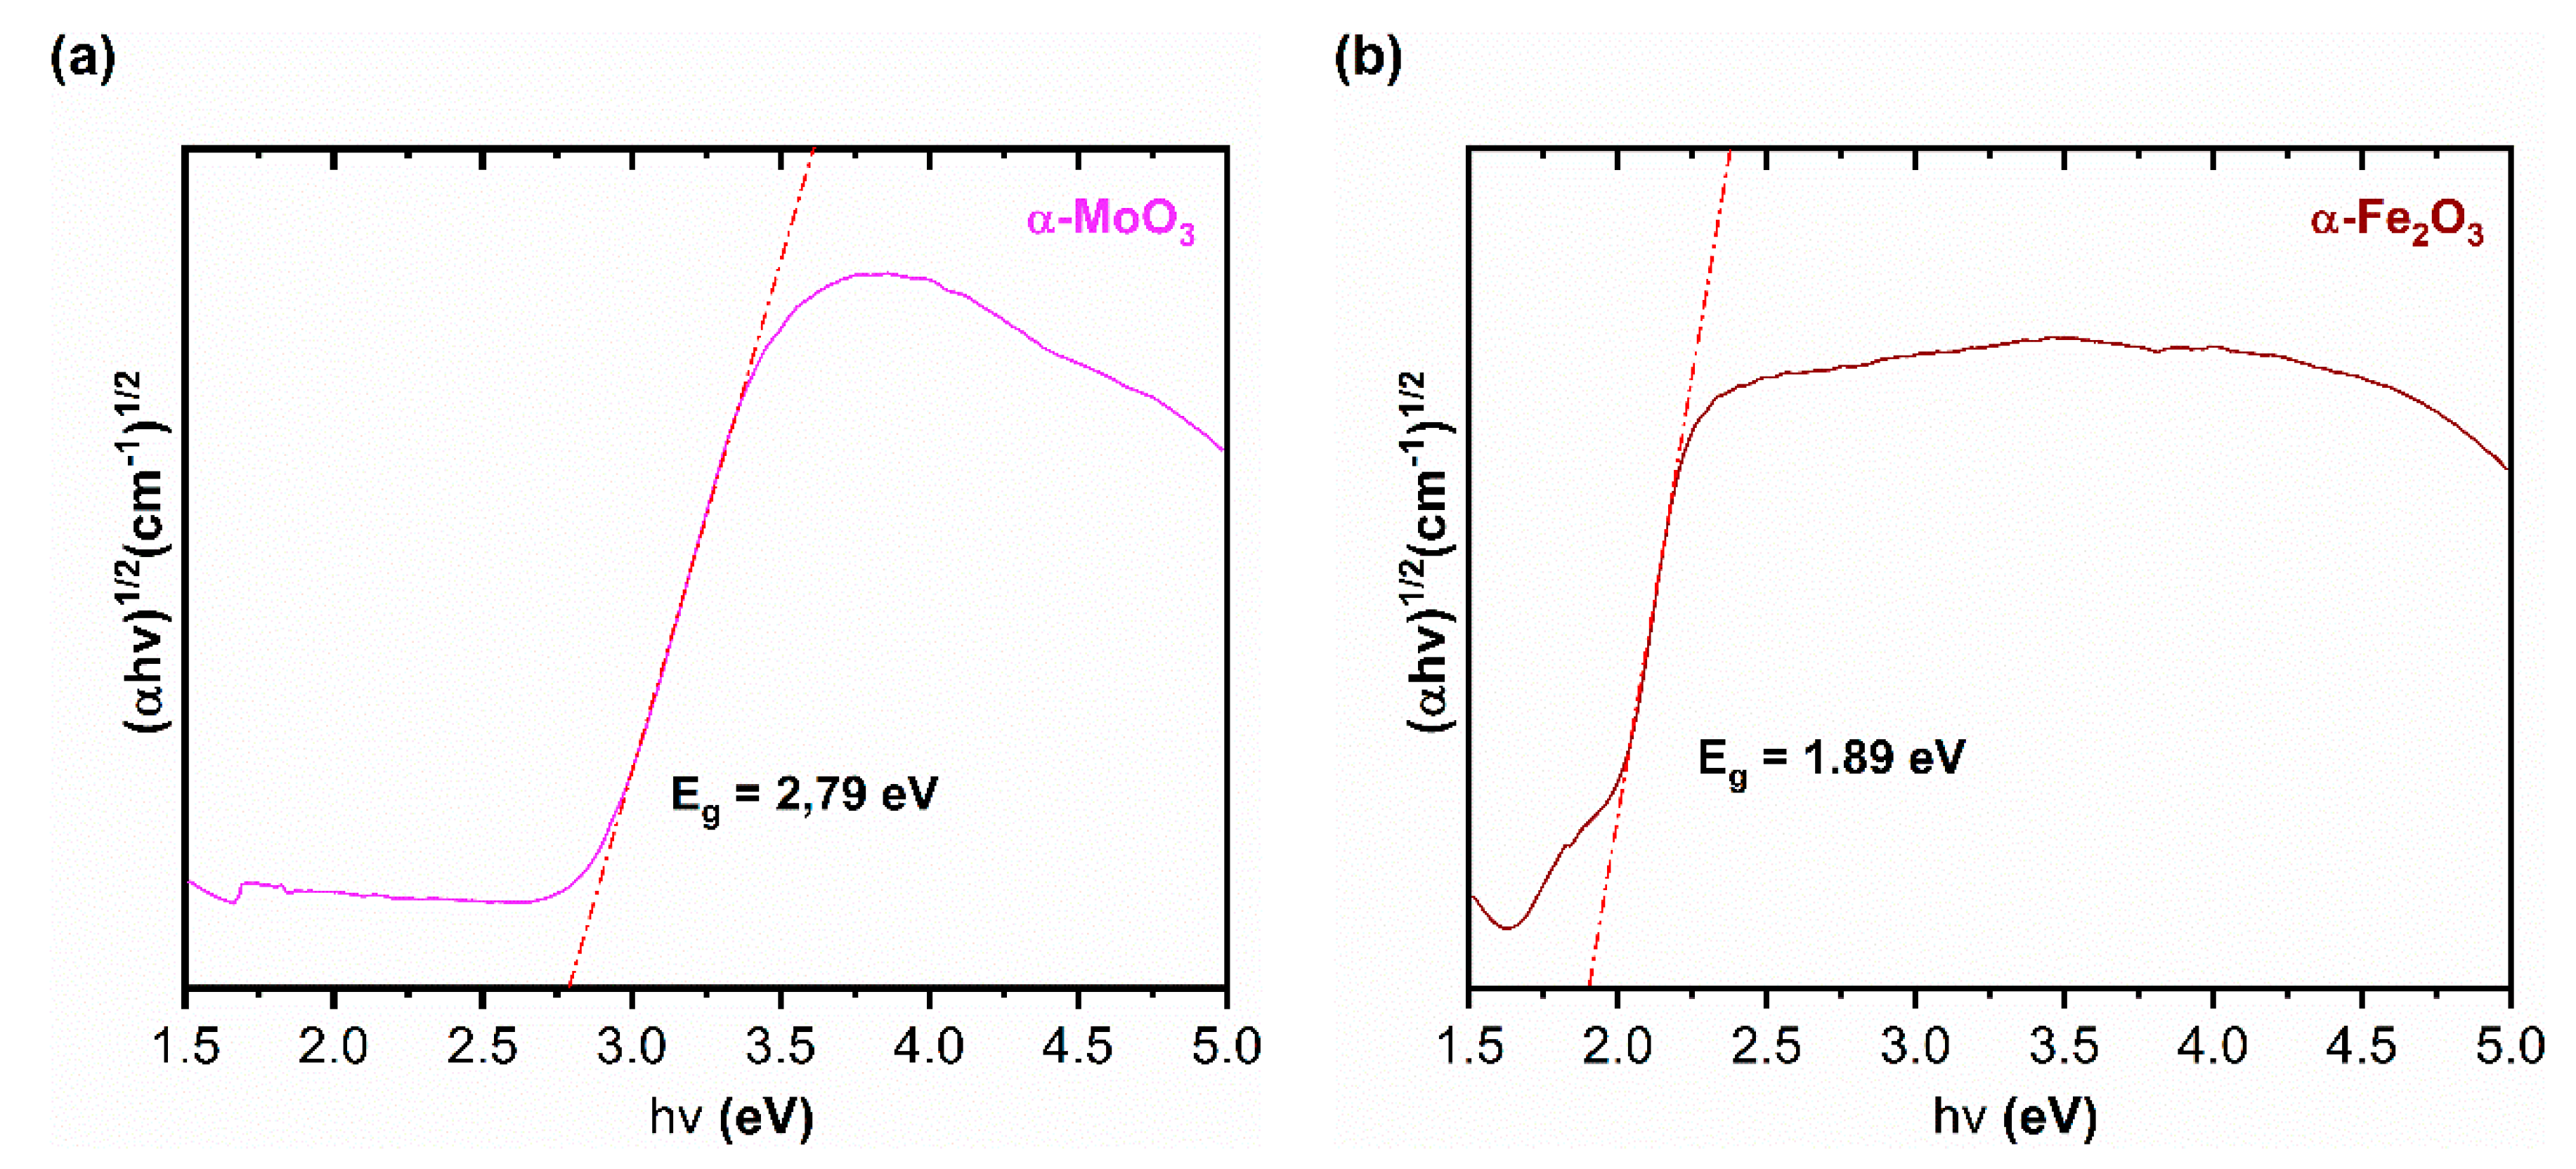
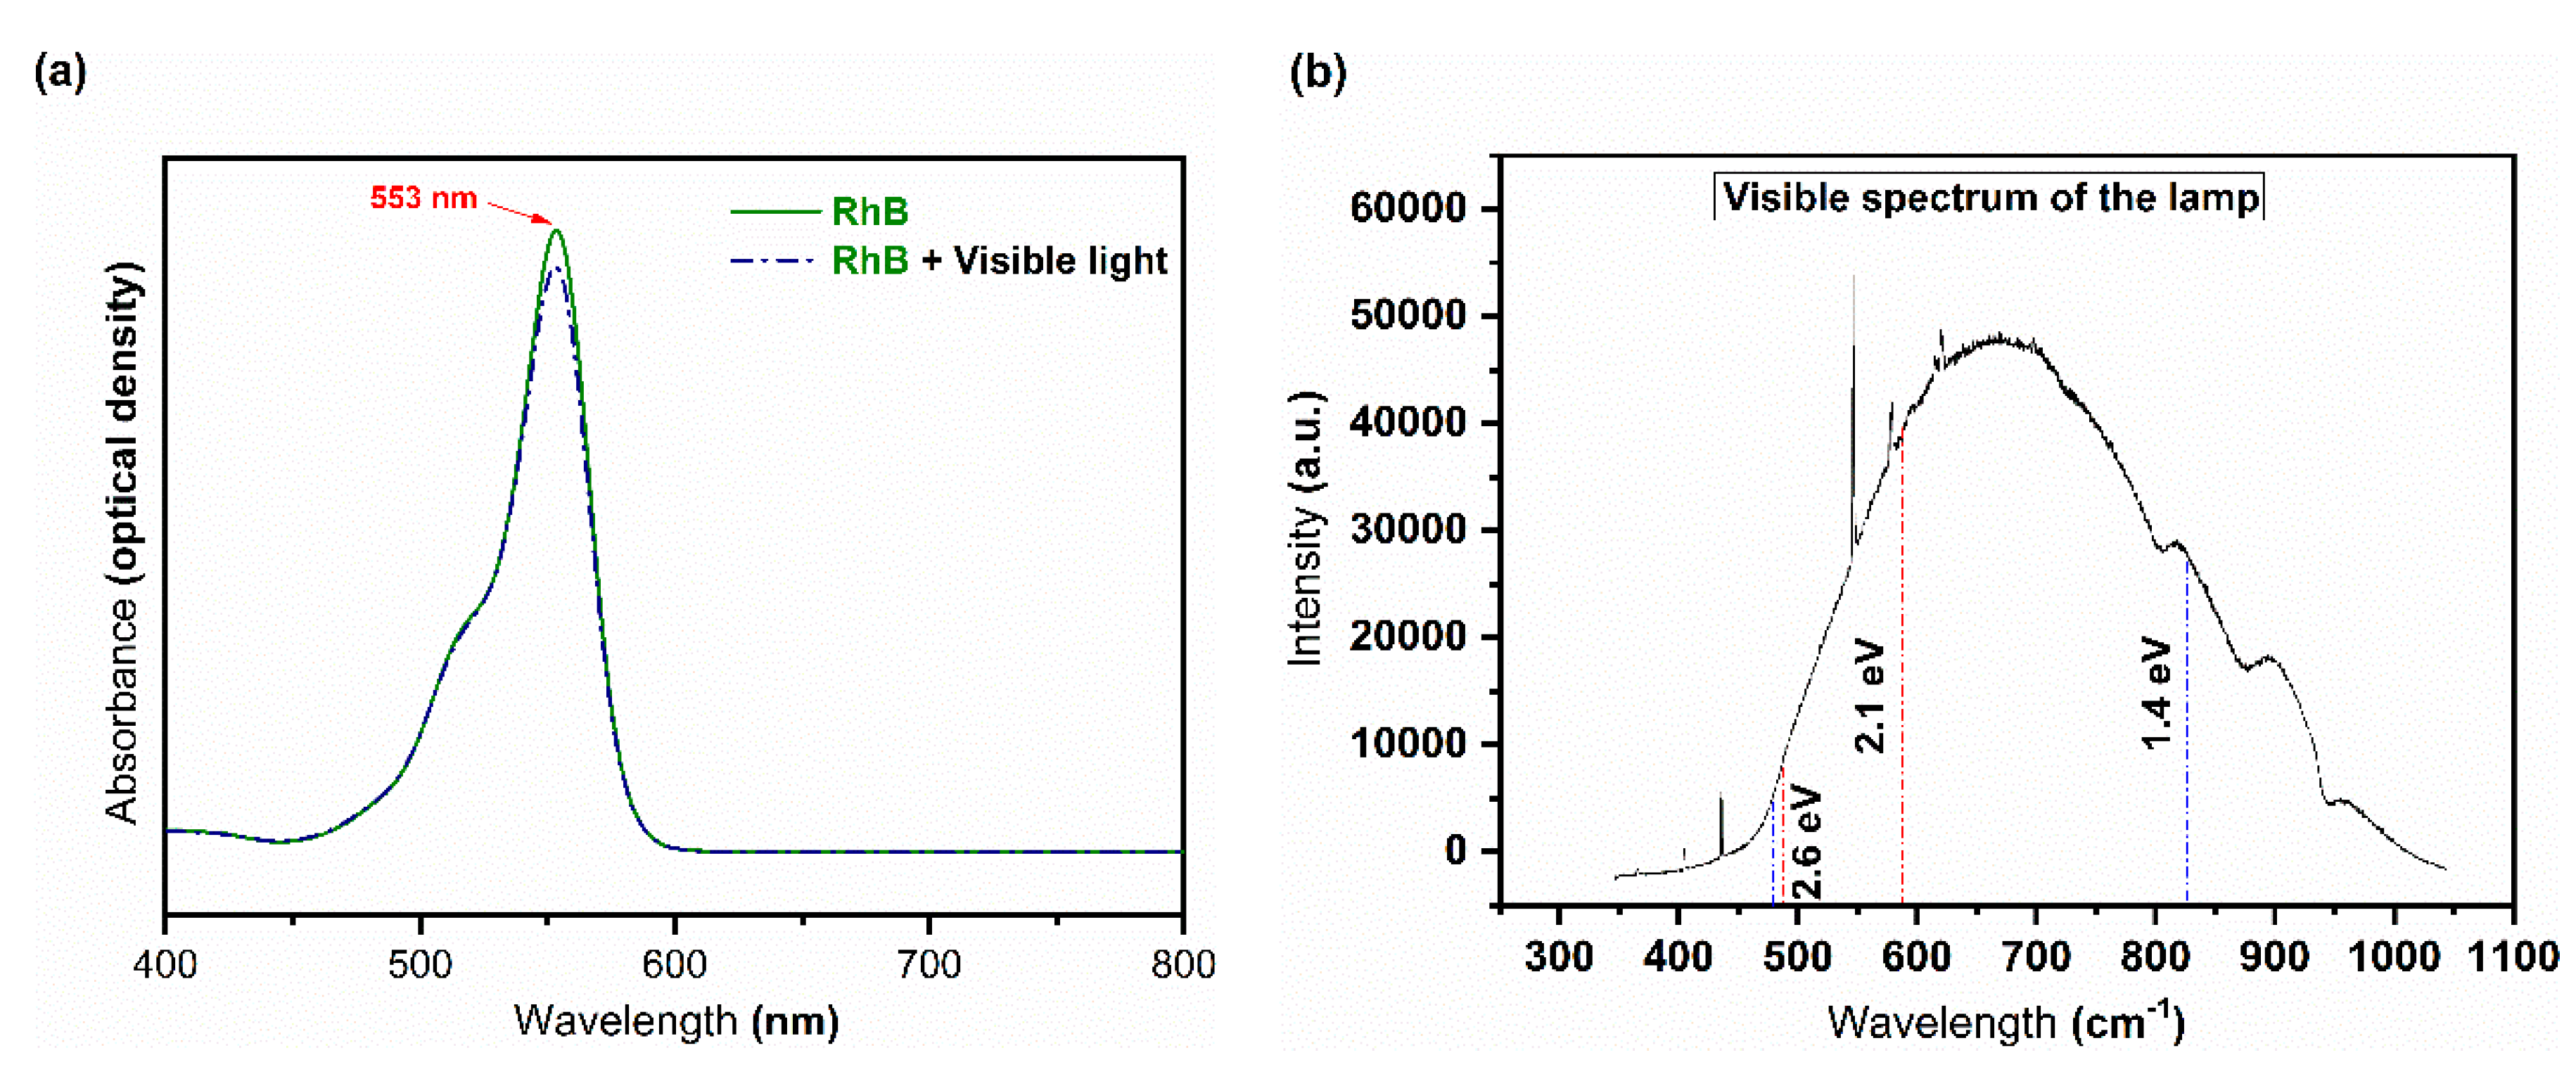
3.1.5. UV–Visible Spectroscopy

The UV–visible spectra of the samples are displayed in Figure 5. The band gap energy (Eg) values were estimated using the Wood and Tauc’s method [38] by extrapolating the linear part to the photon energy axis. The calculated Eg values are indicated in the graph.
Figure 5a illustrates the UV–vis spectrum of the molybdenite photocatalyst (α-MoO3). The band gap energy Eg obtained for this oxide was 2.79 eV, which is close to that (2.76 eV) observed by Scanlon et al. [58] and lower than those evidenced by Amlouk et al. [59] (3.14 eV) and by Boukhachem et al. [26] (4.01 eV). Thus, the fluctuation in the band energy values of this material might be explained by the existing structural ordering and the presence of different ionic defects such as mixed Mo valence, cationic and anionic vacancies or even interstitial defects in the samples [60]. Conversely, hematite photocatalyst (α-Fe2O3) (Figure 5b) presented a band gap energy of 1.89 eV, which is similar to the Eg value (1.90 eV) observed by Zhang et al. [20] and slightly lower than that obtained by Mathevula et al. [29] of 2.06 eV for the samples prepared by the sol–gel method, and to the Eg energy values (2.08–2.11 eV) calculated by Li et al. [57] for the thin films samples obtained by electrodeposition method. The difference among the samples prepared in the present work and the others synthesized in other studies might be attributed to the presence of defects as mentioned before for MoO3 samples. The formation of these defects creates different energy sublevels within the band gap of the materials. It is important noting that the presence of defects strongly depends on its crystalline state and synthesis methods for sample preparation [29].

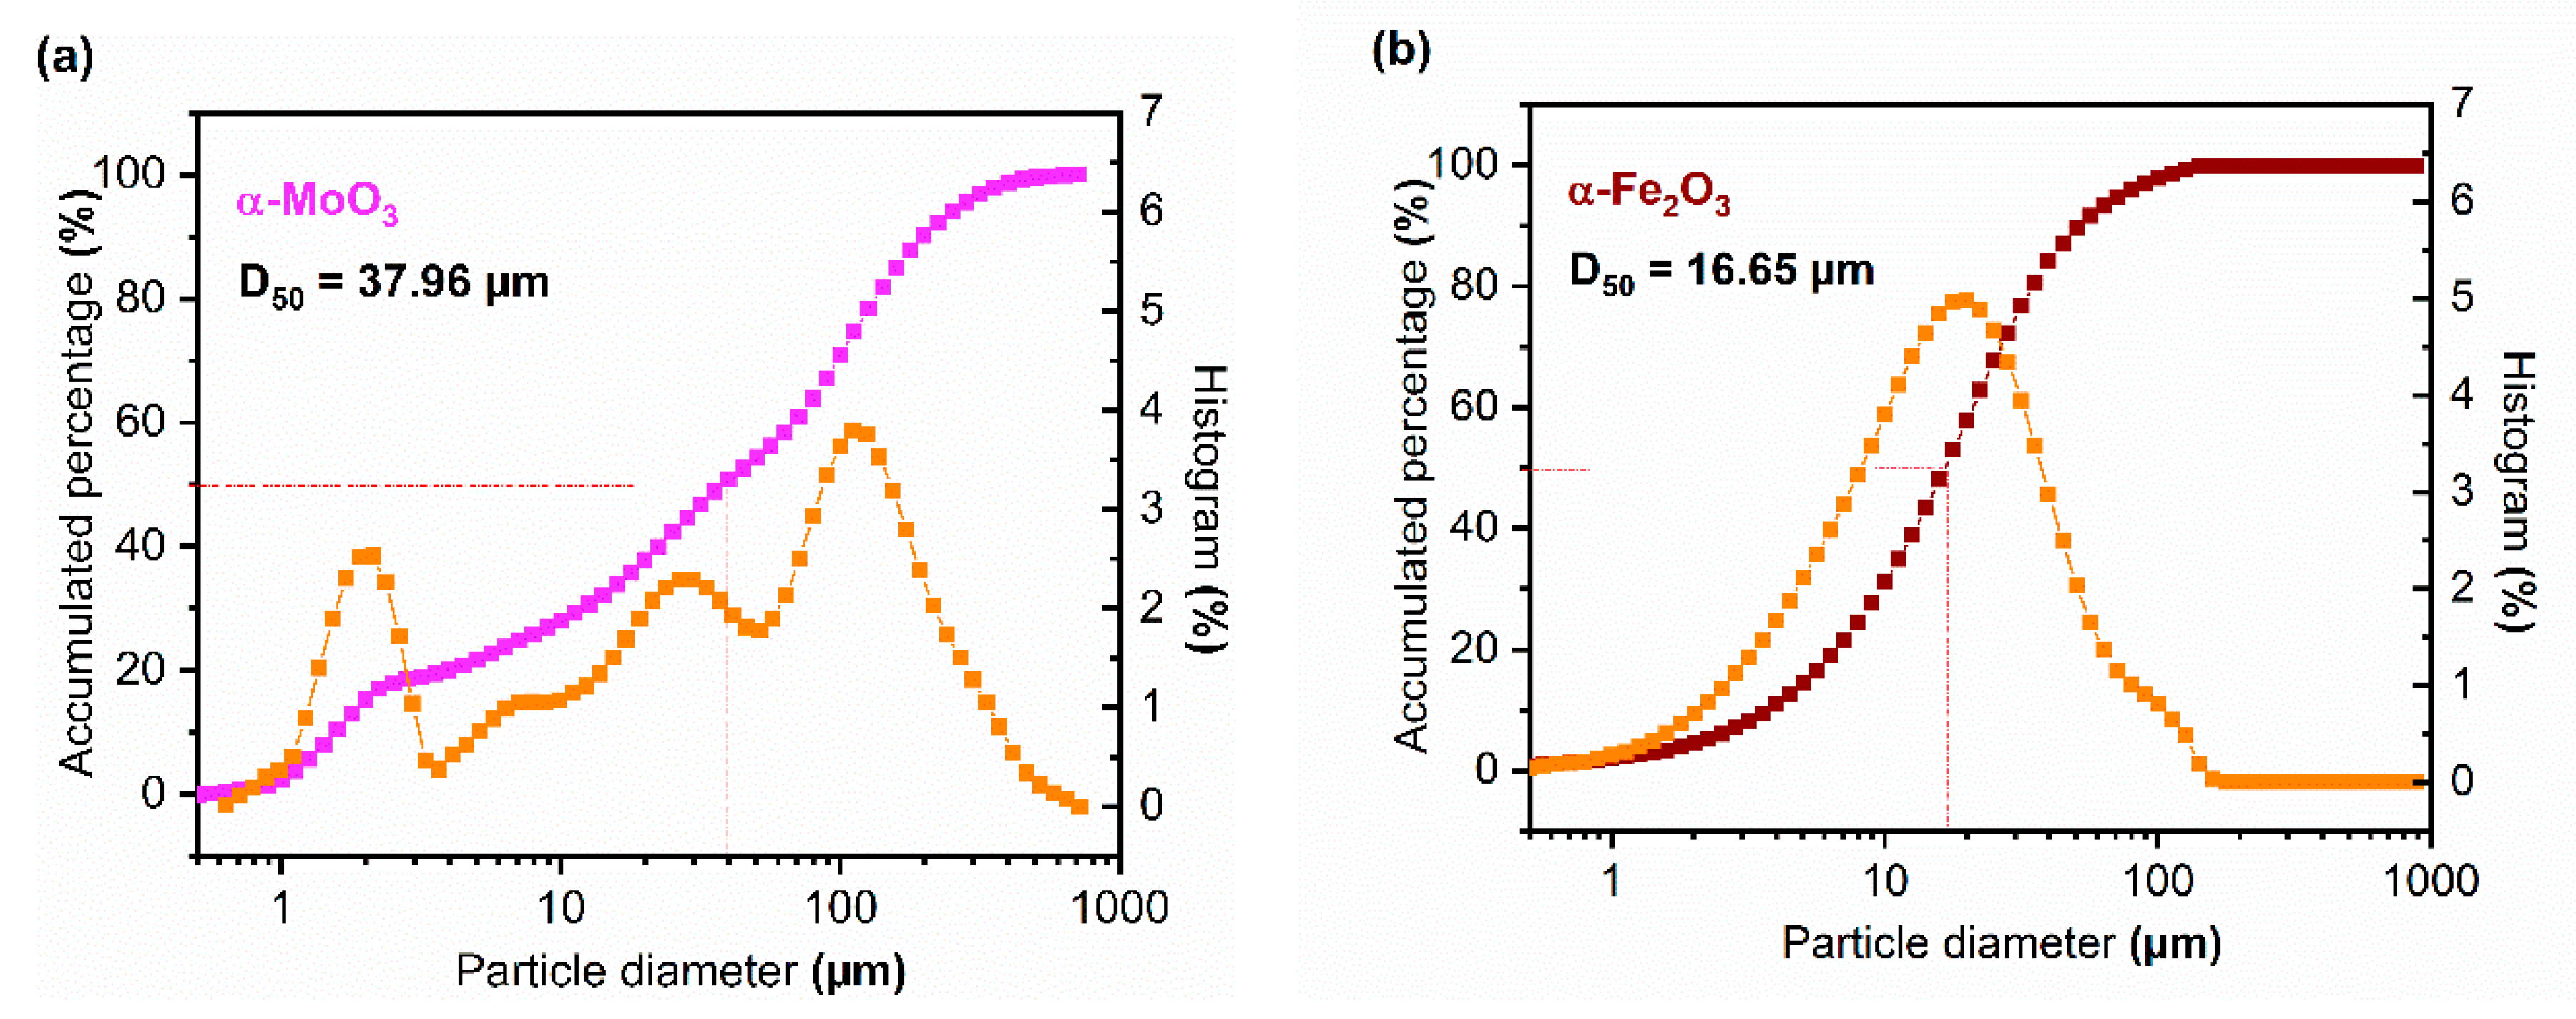
3.1.6. N2 Adsorption/Desorption Isotherms and Granulometric Analysis

The N2 adsorption–desorption isotherms of the photocatalysts (α-MoO3 and α-Fe2O3) were collected and the textural characteristics of the samples were investigated by the Brunauer–Emmett–Teller (BET) method [39]. The isotherms are illustrated in Figure 6. It was observed that the materials exhibited type II and III isotherm profiles with the absence of the hysteresis phenomenon, which is able to define the structures containing multilayer adsorption. From the BET measurements (Table 4), it was also possible to observe distinct textural features and the relatively small values for a specific surface area, pore diameter and pore volume distribution in both samples. These differences are due to the different nuclei sites and larger particle growth observed for α-MoO3 in comparison to the α-Fe2O3 system as evidenced in SEM images (Figure 4). The smaller values found for the pore diameters could classify the catalytic powders as mesoporous [61], however, the observed pores in these systems exist because of the interparticle domains.
Figure 7a,b show the curves of the equivalent spherical diameter values of the particles as a function of the cumulative mass of the photocatalysts. It was observed that the samples have a mean particle diameter (D50) between 10 and 50 µm. For the molybdenite (α-MoO3) photocatalyst (Figure 7a), one can be observed that half of its volume is composed by particles with diameters smaller than 37.96 µm. In addition, 50% of the hematite (α-Fe2O3) volume is composed of particles with diameters smaller than 16.65 µm. These results indicate that small particles of the samples tend to agglomerate after calcination and it is consistent with the morphology observed by microscopic analysis (Figure 4).

3.2. Photocatalytic Experiments

3.2.1. Photolysis

In order to evaluate the photo-stability of the RhB dye under visible light irradiation, a photolysis test (control reaction) was performed in the absence of the photocatalyst. The UV–vis spectra of the RhB solution before and after photolysis are shown in Figure 8a.
After 15 min of irradiation, no meaningful decrease in the maximum absorption band of the RhB dye was observed. The maximum absorption at 553 nm (E = 2.24 eV) is characteristic of the chromophore group that is responsible for the dye coloring [41,42]. The low decrease in this band after photolysis corresponds to approximately 5.8% of the dye discoloration.
According to the UV–vis spectrum of the light source employed in the experiment (Figure 8b), the highest emission occurs in the wavelength range of λ = 600–750 nm (E = 2.07–1.65 eV). This energy is not sufficiently high to promote the direct degradation of the dye without catalysts. Some authors have also evidenced the photo-stability of RhB dye under irradiation, especially under UV light, even after a long period of exposure [62]. All this confirms that RhB has great stability under irradiation.

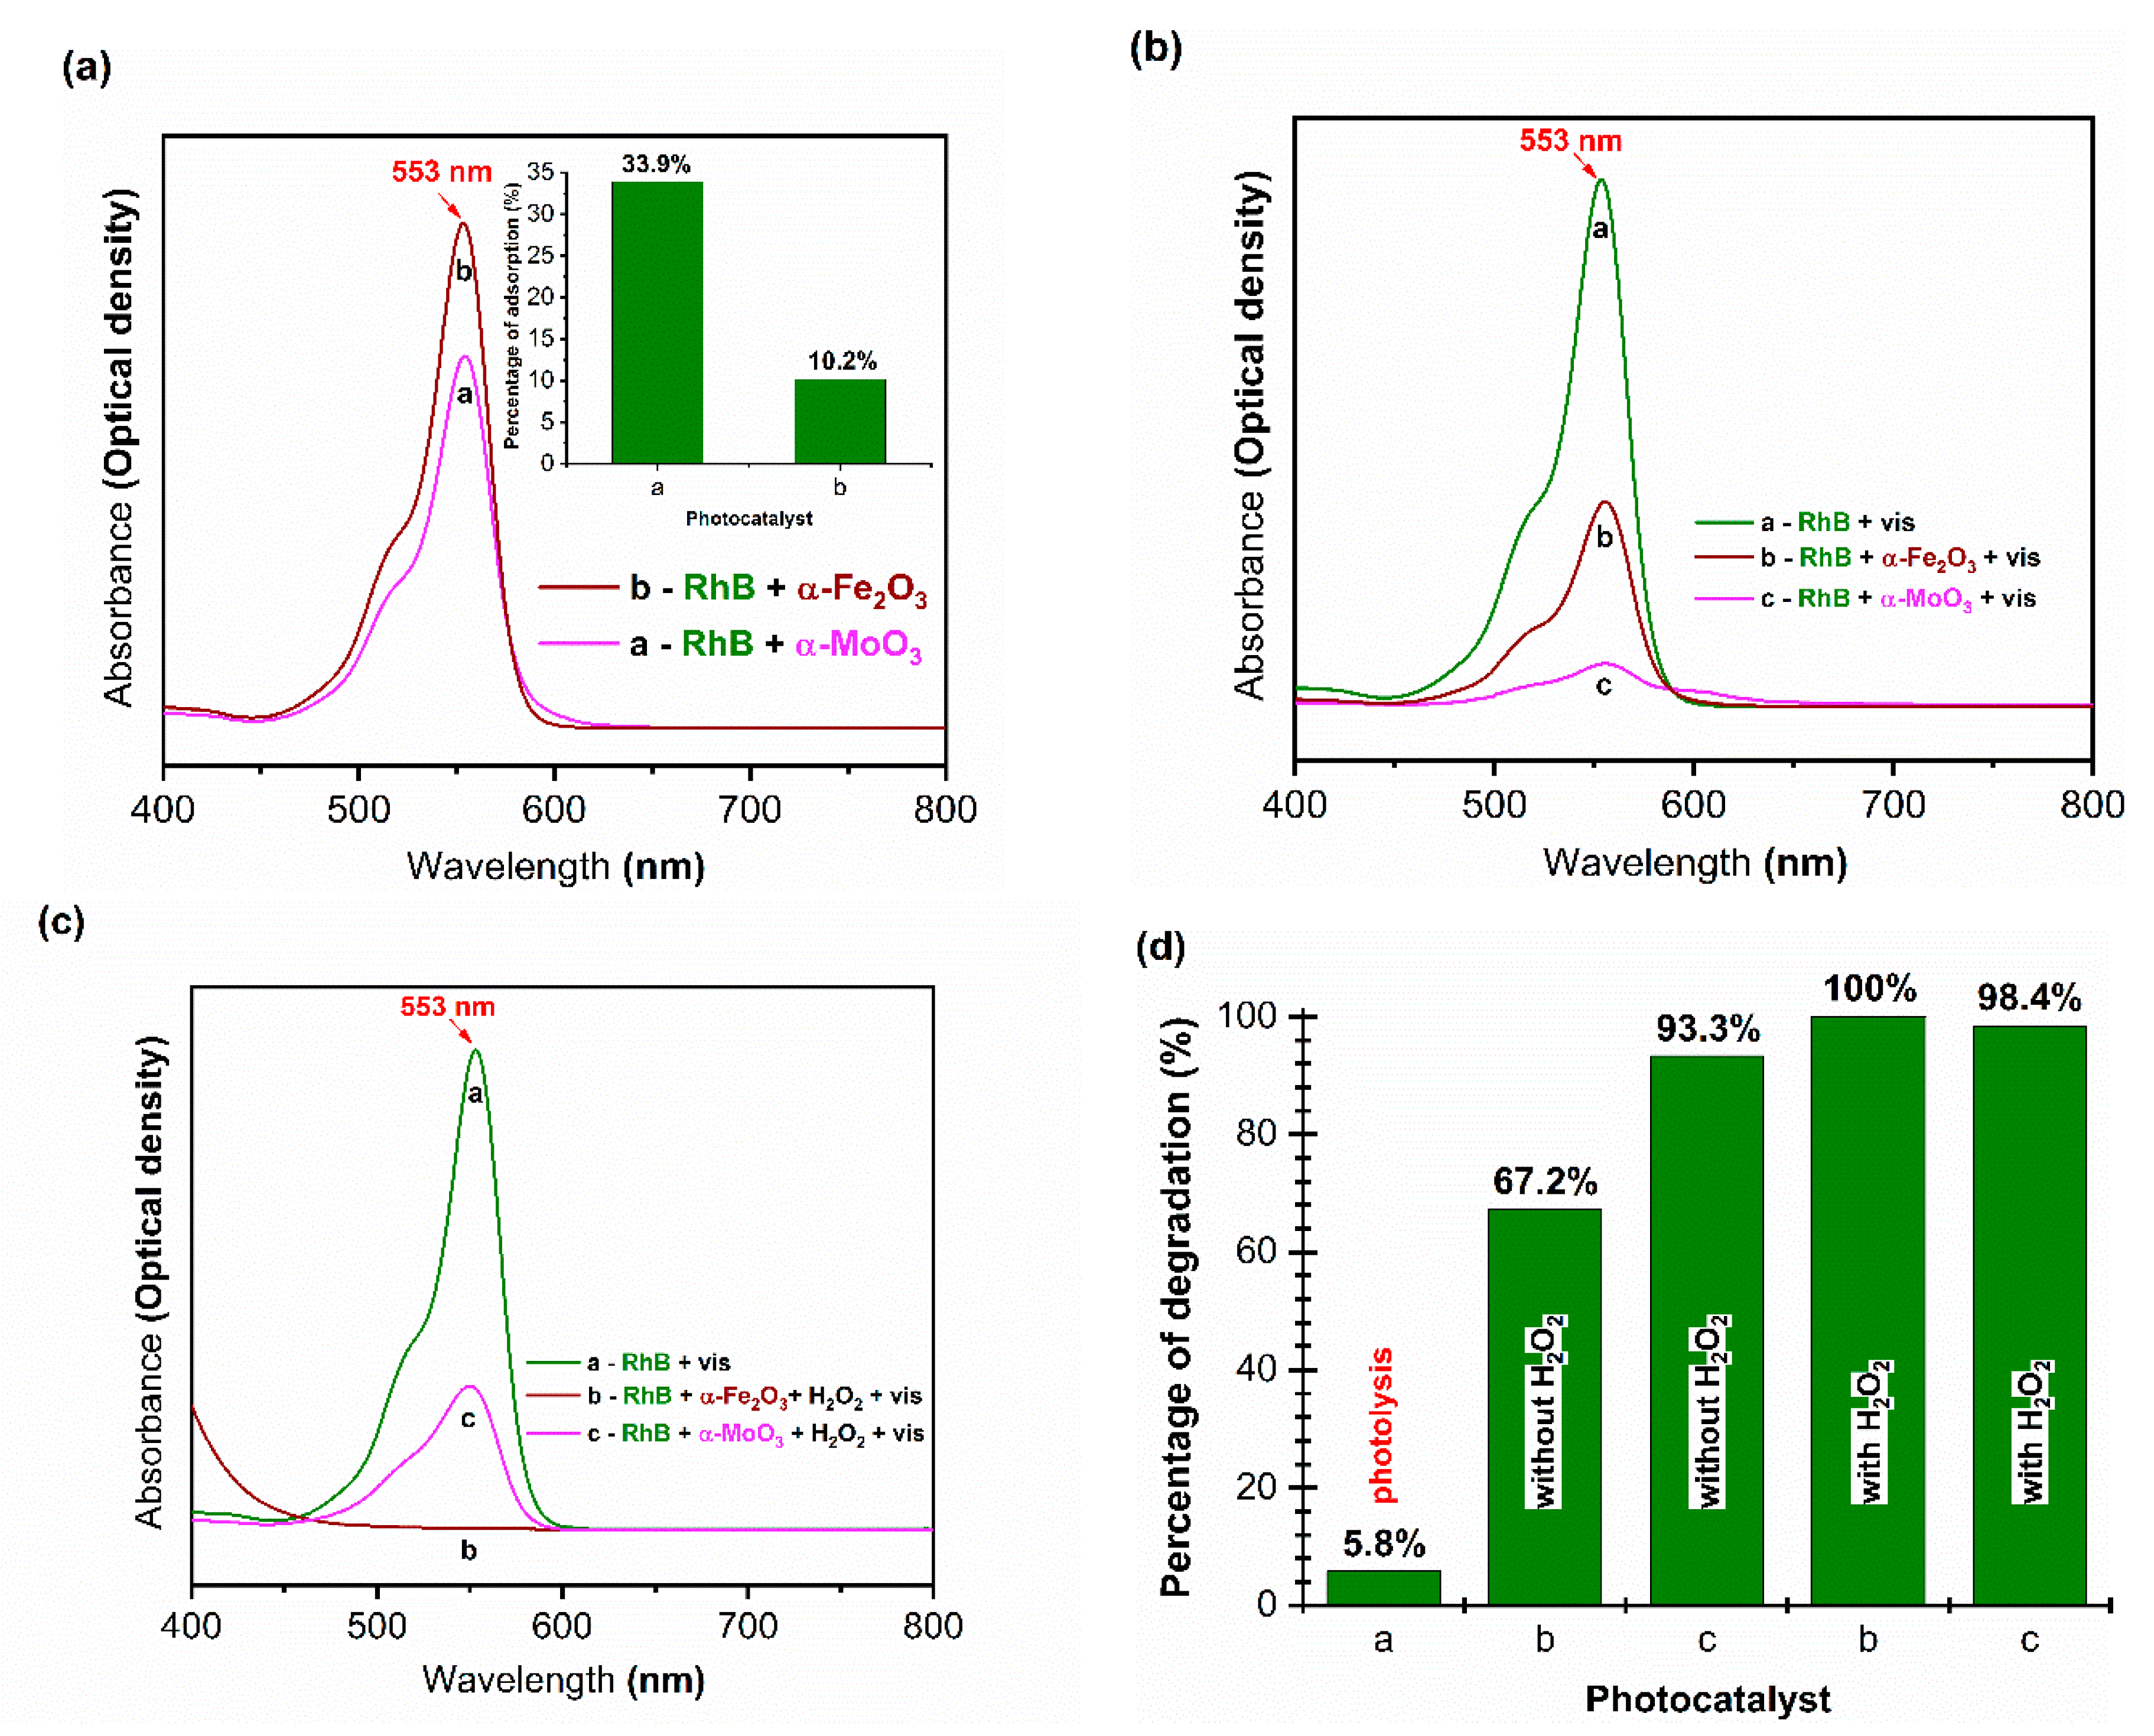
3.2.2. Photocatalytic Activity and Possible Mechanism

Given the photo-stability of the RhB dye, the use of photocatalysts to promote the complete degradation of the dye is necessary. In this context, α-MoO3 and α-Fe2O3 were investigated for the photodegradation of RhB dye solution (5 mg L−1, pH 5) under visible light for 15 min.
The literature reports two distinct mechanisms to describe photocatalysis, the direct mechanism and the indirect one. In the direct mechanism, there is an electron transfer from the catalyst to the compound to be oxidized, while, in indirect photocatalysis, strong oxidizing agents are generated on the surface of the catalysts. These oxidizing agents can react homogeneously with the organic material degrading them [63,64]. For the indirect mechanism to occur, the adsorption of the dye molecules onto the catalyst is necessary. Thus, to better understand this, adsorption tests were also performed as shown in Figure 9a. It was observed that an adsorption of approximately 33.9% of the RhB dye was attained when the molybdenite (α-MoO3) is used, while 10.2% of the adsorption was achieved for the hematite (α-Fe2O3) sample. The different adsorption behavior observed for α-MoO3 and α-Fe2O3 might be especially due to the different types of defects present on the surface of the catalysts, since the low specific surface area observed for both materials seems to not play an important role in the process (Table 4), whereas we can suggest that the indirect mechanism is probably the most important way for the photodegradation of RhB to occur in the presence of these catalysts.
When α-MoO3 and α-Fe2O3 are used in the photocatalytic degradation of RhB under visible light, a pronounced decrease in the maximum UV–vis absorption band of the dye at 553 nm was observed after 15 min (Figure 9b). This indicates that a 93.3% and 67.2% degradation of RhB were achieved for molybdite (α-MoO3) and hematite (α-Fe2O3), respectively (Figure 9d).
Different factors may contribute to the photocatalytic performance of materials. For instance, crystal structure and surface defects as well as particle sizes and surface area are important parameters that affect the interaction of the dye molecules with catalysts for the photocatalysis to occur [33]. The higher photocatalytic activity observed for α-MoO3 might be attributed to either the presence of structural defects that are inherent to the material or due to the presence of ionic defects in the material as suggested by Raman results. As a result, a high interaction between dye molecules and the α-MoO3 surface occurs, which leads to an increased adsorptive capacity observed for this oxide (Figure 9) despite its low surface area (Table 4). In addition to that, the particle morphology and band gap energy may also favor the photogeneration of the ( e C B / h V B + ) pairs to promote RhB photodegradation in this system.
Zheng et al. [10] reported a higher degradation rate of RhB (95.0%) for α-MoO3 after only 60 min of visible light exposure. Similarly, Xi et al. [28] observed a photocatalytic performance of 90.2% for α-MoO3 toward the degradation of RhB after 30 min under visible light. On the other hand, Huang et al. [27] obtained a photocatalytic efficiency for α-MoO3 of 91.57% and 91.98 % toward the degradation of RhB dye under visible and UV light during 160 min, respectively. The different photocatalytic efficiency among the catalysts prepared by these authors and the α-MoO3 synthesized in our study might be due to the different morphological and electronic features of the samples, reflecting the differences in the synthesis conditions.
In relation to the hematite (α-Fe2O3) catalyst, the observed photocatalytic performance might be attributed to the low band gap value and the high recombination rate of the electron–hole pairs ( e C B / h V B + ) generated in the process that affect the amount of oxidizing species promoting RhB photodegradation. Some authors reported the lower photocatalytic efficiencies of Fe2O3 in comparison to that for the α-Fe2O3 catalyst synthesized in our work. For instance, Wang et al. [65] reported that the hematite (α-Fe2O3) presented a reasonable efficiency of 42.0% for the degradation of methyl orange dye, after 180 min of reaction under visible light, and the authors attributed it to the morphology of the catalyst particles. A lower degradation rate of 15.4% was achieved by Luo et al. [66] for the degradation of RhB dye after 60 min of reaction using hematite (α-Fe2O3) as a photocatalyst. These authors attributed the catalytic efficiency to the redox property of iron cations ( F e 2 +     F e 3 + ) that favored the recombination of the photogenerated electron–hole pairs ( e C B / h V B + ) .
Taking into account what was mentioned before and based on the adsorption capacity evaluated (Figure 9a), the photocatalytic behavior of both materials prepared in this work can be understood considering the possible indirect mechanism for the photodegradation of RhB.
According to Honorio et al. [67] and Ong et al. [68], the mechanism involves the reactions represented in the following equations (Equations (2)–(12)). In summary, the photogenerated electrons may interact with O2 to produce superoxide anionic radicals ( O 2   ) and finally hydroxyl radicals O H . On the other hand, the photogenerated holes ( h V B + ) react with the water of the medium to give rise hydroxyl radicals O H . The resulting hydroxyl radicals will attack the dye molecules adsorbed on the surface of the photocatalyst to rapidly produce intermediate compounds, which will consequently be converted into environmentally acceptable green compounds as CO2 and H2O (Equations (11) and (12)):
p h o t o c a t a l y s t   h υ   p h o t o c a t a l y s t   ( e C B )   +   ( h V B + )
p h o t o c a t a l y s t ( h V B + )   +   H 2 O     p h o t o c a t a l y s t   +   H +   +   O H
p h t o c a t a l y s t   ( h V B + )   +   O H     p h o t o c a t a l y s t   +   O H  
p h o t o c a t a l y s t ( e V B )   +   O 2     p h o t o c a t a l y s t   +   O 2  
O 2   +   H +     H O 2
H O 2   +   H O 2     H 2 O 2   +   O 2
p h o t o c a t a l y s t ( e C B )   +   H 2 O 2     O H   +   O H
H 2 O 2   +   O 2     O H   +   O H   +   O 2  
H 2 O 2   +   h υ     2 O H
O r g a n i c   c o m p o u n d s   +   O H     I n t e r m e d i a r i e s  
I n t e r m e d i a r i e s     C O 2   +   H 2 O  

3.2.3. Increased Photocatalytic Activity

According to Xiao et al. [22] and Miklos et al. [69], the combination of hydrogen peroxide (H2O2) and ultraviolet (UV) radiation has been applied to oxidize numerous organic pollutants, since H2O2 can increase the formation of hydroxyl radicals ( O H ) to promote photodegradation. However, the formation kinetics of these radicals using only H2O2 and UV radiation can be limited. In this sense, to enhance the generation of hydroxyl radicals ( O H ) from the photocatalysts and therefore, improve the photodegradation of RhB, the photo-Fenton process was used.
The UV–vis spectra of the dye solution (RhB) after the photocatalysis in the presence of H2O2 are illustrated in Figure 9c. The results of the photodegradation in the presence of H2O2 are shown in Figure 9d. It is possible to observe that after 15 min of photocatalysis using catalysts/H2O2/visible light, a satisfactory increase in the degradation percentage of the dye was observed in comparison to the tests performed in the absence of H2O2 (Figure 9b). It is also possible noting that, without photocatalysts (H2O2/visible light), a low degradation rate of RhB was achieved (Figure 9b). This result may be associated with the low amount of hydroxyl radicals ( O H ) produced during the process, which indicates a limitation of the hydrogen peroxide activity in Fenton methodology.
When the molybdenite (α-MoO3) is combined with Fenton reagent (H2O2) and visible light (Figure 9c), an increase in 5.1% in the photodegradation rate of the dye was observed compared to that seen for the α-MoO3/visible light system (Figure 9b). In this case, the presence of the photocatalyst enhances the H2O2 decomposition and consequently, produced more hydroxyl radicals ( O H ) to promote dye degradation. The results indicate that the α-MoO3 synthesized in our work presents a promising Fenton and photon-Fenton efficiency as compared to the results reported for α-MoO3 by other authors [70,71,72].
For the α-Fe2O3 sample, a higher efficiency was achieved after 15 min, reaching 100% of the photodegradation of RhB (Figure 9d). The catalytic efficiency obtained for α-Fe2O3 in the presence of H2O2 is much higher than that observed without H2O2 (Figure 9d). This result can be attributed an improvement of hydroxyl radicals ( O H ) generated by the decomposition of H2O2 promoted by the Fe2+ cation, which is regenerated by the reaction between Fe3+ and the photogenerated electrons ( e C B ) and from the reaction of holes ( h B V + ) with the water molecules present on the catalyst surface. According to the literature, hydrogen peroxide can also be catalyzed by the Fe3+ ion, but the degradation of organic pollutants by the photon-Fenton reagent (Fe3+/H2O2) is much slower than Fe2+/H2O2 reagent, due to the lower reactivity of iron (III) with respect to H2O2 [66,69]. Different authors have also investigated the efficiency of the Fenton and photo-Fenton process toward the degradation of different organic contaminants using hematite [20,22]. For instance, Zhang et al. [20] obtained a 94.8% RhB degradation using Fe2O3/H2O2 after 180 min under irradiation. Xiao et al. [22] obtained a photodegradation efficiency of 98% of red acid G (ARG) dye using α-Fe2O2/H2O2/vis system after 90 min of light exposure. According to these authors, the high percentage yield observed for the α-Fe2O2/H2O2/vis system resulted from a synergistic effect existing among H2O2, photocatalyst and irradiation, besides the high surface area of the catalyst that led in an increase in large amount of active sites exposed on the surface.
Based on what was mentioned above, the use of H2O2 is one of the main factors to increase the photogenerated hydroxyl radicals ( O H ) and then enhance the photodegradation rate of the organic dye. Therefore, we evidenced that the recombination of the electron–hole pairs in this work was effectively suppressed and more oxidizing radicals ( O H ) were produced in the dye/catalysts/H2O2/visible irradiation (Figure 9c) in comparison to the common photocatalysis dye/catalysts/visible light (Figure 9b). Additionally, the combination of all these results showed that a significant improvement of the photocatalytic properties of the synthesized oxide materials was achieved.

4. Conclusions

α-MoO3 and α-Fe2O3 catalysts were successfully synthesized at a low temperature using a Pechini method, showing to be effective for the preparation of different materials. Monophased and well crystallized samples were obtained after calcinations at 550 °C, with different structural symmetries (orthorhombic Pbnm for α-MoO3, and rhombohedral R3c-type for α-Fe2O3) as indicated by XRD results and confirmed by Raman and IR spectroscopy. The particles morphology, specific surface areas and band gap energies (evidenced by BET, granulometric analysis and UV–vis spectroscopy) differed according to the composition and strongly affected the photocatalytic properties. A higher catalytic activity toward RhB photodegradation was observed for α-MoO3 (93.3%) in the absence of H2O2. However, the addition of H2O2 to the photocatalytic systems promoted a faster RhB photodegradation, especially for α-Fe2O3 with 100% of efficiency after 15 min of reaction. The efficiency of the photocatalytic processes was strongly related to the mechanism that involves heterogeneous photocatalysis, the indirect mechanism. Our findings suggest that the visible light-driven photocatalysis using the α-Fe2O3 as catalyst might be considered more advantageous in comparison to other processes reported in the literature due to its economic viability and environmental sustainability, since the sun light can be readily applied in the process. In addition to that, the photocatalytic process can promote the complete degradation of organic pollutants (mineralization of these compounds in environmentally acceptable green compounds, CO2 and H2O), decreasing their toxicity. As a consequence, the studied systems are promising candidates for the rapid treatment of wastewater contaminated by persistent organic pollutants.

Author Contributions

Conceptualization, H.B.S.; methodology, H.B.S.; validation, H.B.S.; formal analysis: H.B.S., R.R.M. and A.L.M.d.O.; investigation, H.B.S., J.J.N.d.S. and L.C.; resources: G.A.N., J.M.F. and H.d.L.L.; writing—original draft, H.B.S.; writing—review and editing, H.B.S., R.R.M, L.C., A.L.M.d.O and H.d.L.L.; visualization, H.B.S., R.R.M., L.C., A.L.M.d.O. and H.d.L.L.; funding acquisition, H.d.L.L.; supervision, H.d.L.L. All authors have read and agreed to the published version of the manuscript.

Funding

This work was funded by Coordenação de Aperfeiçoamento de Pessoa de Nível Superior (CAPES—PNPD/UFCG), grant 88882.314956/2019-01.

Acknowledgments

The authors acknowledge the Brazilian research funding agencies (Coordenação de Aperfeiçoamento de Pessoa de Nível Superior—CAPES, Conselho Nacional de Desenvolvimento Científico e Tecnológico—CNPq, and UFCG for the support). H.B.S. would like to thank to PNPD/CAPES (grant 88882.314956/2019-01), LaNano-IFPB for the BET measurements and NPE-LACOM for the photocatalysis resources. R.R.M. Would like to thank CNPq (308822/2018-8 and 420004/2018-1). A.L.M.O acknowledges PNPD/CAPES (grant 88882.317938/2019-01).

Conflicts of Interest

The authors declare no conflict of interest.

References

  1. Gupta, K.; Khatri, O.P. Fast and efficient adsorptive removal of organic dyes and active pharmaceutical ingredient by microporous carbon: Effect of molecular size and charge. Chem. Eng. J. 2019, 378, 122218. [Google Scholar] [CrossRef]
  2. Tkaczyk, A.; Mitrowska, K.; Posyniak, A. Synthetic organic dyes as contaminants of the aquatic environment and their implications for ecosystems: A review. Sci. Total Environ. 2020, 717, 137222. [Google Scholar] [CrossRef] [PubMed]
  3. Hasanpour, M.; Hatami, M. Photocatalytic performance of aerogels for organic dyes removal from wastewaters: Review study. J. Mol. Liq. 2020, 309, 113094. [Google Scholar] [CrossRef]
  4. Santos, D.H.S.; Duarte, J.L.S.; Tavares, M.G.R.; Tavares, M.G.; Friedrich, L.C.; Meili, L.; Pimentel, W.R.O.; Tonholo, J.; Zanta, C.L.P.S. Electrochemical degradation and toxicity evaluation of reactive dyes mixture and real textile effluent over DSA® electrodes. Chem. Eng. Process. Process Intensif. 2020, 153, 107940. [Google Scholar] [CrossRef]
  5. Sundaran, S.P.; Reshmi, C.R.; Sagitha, P.; Manaf, O.; Sujith, A. Multifunctional graphene oxide loaded nanofibrous membrane for removal of dyes and coliform from water. J. Environ. Manag. 2019, 240, 494–503. [Google Scholar] [CrossRef]
  6. Puri, C.; Sumana, G. Highly effective adsorption of crystal violet dye from contaminated water using graphene oxide intercalated montmorillonite nanocomposite. Appl. Clay Sci. 2018, 166, 102–112. [Google Scholar] [CrossRef]
  7. Nie, G.; Xiao, L. New insight into wastewater treatment by activation of sulfite with photosensitive organic dyes under visible light irradiation. Chem. Eng. J. 2020, 389, 123446. [Google Scholar] [CrossRef]
  8. Wetchakun, K.; Wetchakun, N.; Sakulsermsuk, S. An overview of solar/visible light-driven heterogeneous photocatalysis for water purification: TiO2-and ZnO-based photocatalysts used in suspension photoreactors. J. Ind. Eng. Chem. 2019, 71, 19–49. [Google Scholar] [CrossRef]
  9. Youssef, Z.; Colombeau, L.; Yesmurzayeva, N.; Baros, F.; Vanderesse, R.; Hamieh, T.; Toufaily, J.; Frochot, C.; Roques-Carmes, T.; Acherar, S. Dye-sensitized nanoparticles for heterogeneous photocatalysis: Cases studies with TiO2, ZnO, fullerene and graphene for water purification. Dye. Pigment. 2018, 159, 49–71. [Google Scholar] [CrossRef]
  10. Zheng, B.; Wang, Z.; Wang, X.; Chen, Y. Enhanced photocatalytic properties of defect-rich α-MoO3 nanoflakes by cavitation and pitting effect. J. Hazard. Mater. 2019, 378, 120753. [Google Scholar] [CrossRef]
  11. Desseigne, M.; Dirany, N.; Chevallier, V.; Arab, M. Shape dependence of photosensitive properties of WO3 oxide for photocatalysis under solar light irradiation. Appl. Surf. Sci. 2019, 483, 313–323. [Google Scholar] [CrossRef]
  12. Leite, R.S.; Santos, A.M.C.; Severo, L.L.; Duarte Neto, J.F.; Castellano, L.R.C.; Neves, G.A.; Lira, H.L.; Menezes, R.R. Photocatalytic degradation of dyes and microorganism inactivation using solution blow spun silver-modified titania fibers. Ceram. Int. 2020, 46, 13482–13490. [Google Scholar] [CrossRef]
  13. Lops, C.; Ancona, A.; Di Cesare, K.; Dumontel, B.; Garino, N.; Canavese, G.; Hérnandez, S.; Cauda, V. Sonophotocatalytic degradation mechanisms of Rhodamine B dye via radicals generation by micro- and nano-particles of ZnO. Appl. Catal. B Environ. 2019, 243, 629–640. [Google Scholar] [CrossRef] [PubMed]
  14. Karunakaran, C.; Sujatha, M.P.; Gomathisankar, P. Photoreduction of chromium(VI) on ZrO2 and ZnS surfaces. Mon. Chem. Chem. Mon. 2009, 140, 1269. [Google Scholar] [CrossRef]
  15. Ren, W.; Wan, C.; Li, Z.; Liu, X.; Zhang, R.; Yang, X.; Lee, D.-J. Functional CdS nanocomposites recovered from biomineralization treatment of sulfate wastewater and its applications in the perspective of photocatalysis and electrochemistry. Sci. Total Environ. 2020, 742, 140646. [Google Scholar] [CrossRef]
  16. Zhang, H.; Gao, Y.; Zhu, G.; Li, B.; Gou, J.; Cheng, X. Synthesis of PbS/TiO2 nano-tubes photoelectrode and its enhanced visible light driven photocatalytic performance and mechanism for purification of 4-chlorobenzoic acid. Sep. Purif. Technol. 2019, 227, 115697. [Google Scholar] [CrossRef]
  17. Abdelkader, E.; Nadjia, L.; Naceur, B.; Noureddine, B. SnO2 foam grain-shaped nanoparticles: Synthesis, characterization and UVA light induced photocatalysis. J. Alloys Compd. 2016, 679, 408–419. [Google Scholar] [CrossRef]
  18. Shanenkov, I.; Sivkov, A.; Ivashutenko, A.; Medvedeva, T.; Shchetinin, I. High-energy plasma dynamic synthesis of multiphase iron oxides containing Fe3O4 and ε-Fe2O3 with possibility of controlling their phase composition. J. Alloys Compd. 2019, 774, 637–645. [Google Scholar] [CrossRef]
  19. AlSalka, Y.; Granone, L.I.; Ramadan, W.; Hakki, A.; Dillert, R.; Bahnemann, D.W. Iron-based photocatalytic and photoelectrocatalytic nano-structures: Facts, perspectives, and expectations. Appl. Catal. B Environ. 2019, 244, 1065–1095. [Google Scholar] [CrossRef]
  20. Zhang, Y.; Zhang, N.; Wang, T.; Huang, H.; Chen, Y.; Li, Z.; Zou, Z. Heterogeneous degradation of organic contaminants in the photo-Fenton reaction employing pure cubic β-Fe2O3. Appl. Catal. B Environ. 2019, 245, 410–419. [Google Scholar] [CrossRef]
  21. Merazga, A.; Al-Zahrani, J.; Al-Baradi, A.; Omer, B.; Badawi, A.; Al-Omairy, S. Optical band-gap of reduced graphene oxide/TiO2 composite and performance of associated dye-sensitized solar cells. Mater. Sci. Eng. B 2020, 259, 114581. [Google Scholar] [CrossRef]
  22. Xiao, C.; Li, J.; Zhang, G. Synthesis of stable burger-like α-Fe2O3 catalysts: Formation mechanism and excellent photo-Fenton catalytic performance. J. Clean. Prod. 2018, 180, 550–559. [Google Scholar] [CrossRef]
  23. Pizarro, F.; Olivares, M.; Valenzuela, C.; Brito, A.; Weinborn, V.; Flores, S.; Arredondo, M. The effect of proteins from animal source foods on heme iron bioavailability in humans. Food Chem. 2016, 196, 733–738. [Google Scholar] [CrossRef] [PubMed]
  24. Zhu, Y.; Yao, Y.; Luo, Z.; Pan, C.; Yang, J.; Fang, Y.; Deng, H.; Liu, C.; Tan, Q.; Liu, F.; et al. Nanostructured MoO3 for Efficient Energy and Environmental Catalysis. Molecules 2019, 25, 18. [Google Scholar] [CrossRef] [PubMed] [Green Version]
  25. Zhen, Y.; Wang, J.; Fu, F.; Fu, W.; Liang, Y. The Novel Z-Scheme Ternary-Component Ag/AgI/α-MoO3 Catalyst with Excellent Visible-Light Photocatalytic Oxidative Desulfurization Performance for Model Fuel. Nanomaterials 2019, 9, 1054. [Google Scholar] [CrossRef] [Green Version]
  26. Boukhachem, A.; Mokhtari, M.; Benameur, N.; Ziouche, A.; Martínez, M.; Petkova, P.; Ghamnia, M.; Cobo, A.; Zergoug, M.; Amlouk, M. Structural optical magnetic properties of Co doped α-MoO3 sprayed thin films. Sens. Actuators A Phys. 2017, 253, 198–209. [Google Scholar] [CrossRef]
  27. Huang, L.; Fang, W.; Yang, Y.; Wu, J.; Yu, H.; Dong, X.; Wang, T.; Liu, Z.; Zhao, B. Three-dimensional MoO3 nanoflowers assembled with nanosheets for rhodamine B degradation under visible light. Mater. Res. Bull. 2018, 108, 38–45. [Google Scholar] [CrossRef]
  28. Xi, Q.; Liu, J.; Wu, Z.; Bi, H.; Li, Z.; Zhu, K.; Zhuang, J.; Chen, J.; Lu, S.; Huang, Y.; et al. In-situ fabrication of MoO3 nanobelts decorated with MoO2 nanoparticles and their enhanced photocatalytic performance. Appl. Surf. Sci. 2019, 480, 427–437. [Google Scholar] [CrossRef]
  29. Mathevula, L.E.; Noto, L.L.; Mothudi, B.M.; Chithambo, M.; Dhlamini, M.S. Structural and optical properties of sol-gel derived α-Fe2O3 nanoparticles. J. Lumin. 2017, 192, 879–887. [Google Scholar] [CrossRef]
  30. Trpkov, D.; Panjan, M.; Kopanja, L.; Tadić, M. Hydrothermal synthesis, morphology, magnetic properties and self-assembly of hierarchical α-Fe2O3 (hematite) mushroom-, cube- and sphere-like superstructures. Appl. Surf. Sci. 2018, 457, 427–438. [Google Scholar] [CrossRef]
  31. Mallesh, S.; Narsimulu, D.; Kim, K.H. High coercivity in α-Fe2O3 nanostructures synthesized by surfactant-free microwave-assisted solvothermal method. Phys. Lett. A 2020, 384, 126038. [Google Scholar] [CrossRef]
  32. Mirzaei, A.; Janghorban, K.; Hashemi, B.; Bonyani, M.; Leonardi, S.G.; Neri, G. Highly stable and selective ethanol sensor based on α-Fe2O3 nanoparticles prepared by Pechini sol–gel method. Ceram. Int. 2016, 42, 6136–6144. [Google Scholar] [CrossRef]
  33. Chantelle, L.; Oliveira, A.L.M.; Kennedy, B.J.; Maul, J.; Silva, M.R.S.; Duarte, T.M.; Albuquerque, A.R.; Sambrano, J.R.; Landers, R.; Siu-Li, M.; et al. Probing the Site-Selective Doping in SrSnO3:Eu Oxides and Its Impact on the Crystal and Electronic Structures Using Synchrotron Radiation and DFT Simulations. Inorg. Chem. 2020, 59, 7666–7680. [Google Scholar] [CrossRef]
  34. Chen, H.-S. Identification of Rhodamine 6g and Rhodamine B dyes present in ballpoint pen inks using high-performance liquid chromatography and UV-Vis spectrometry. Forensic Sci. J. 2007, 6, 21–37. [Google Scholar]
  35. Jinisha, R.; Gandhimathi, R.; Ramesh, S.T.; Nidheesh, P.V.; Velmathi, S. Removal of rhodamine B dye from aqueous solution by electro-Fenton process using iron-doped mesoporous silica as a heterogeneous catalyst. Chemosphere 2018, 200, 446–454. [Google Scholar] [CrossRef] [PubMed]
  36. Saruchi; Kumar, V. Adsorption kinetics and isotherms for the removal of rhodamine B dye and Pb+2 ions from aqueous solutions by a hybrid ion-exchanger. Arab. J. Chem. 2019, 12, 316–329. [Google Scholar] [CrossRef]
  37. Pechini, M. Method of Preparing Lead and Alkaline Earth Titanates and Niobates and Coating Method Using the Same to Form a Capacitor. U.S. Patent 3,330,697, 11 July 1967. [Google Scholar]
  38. Wood, D.L.; Tauc, J. Weak Absorption Tails in Amorphous Semiconductors. Phys. Rev. B 1972, 5, 3144–3151. [Google Scholar] [CrossRef]
  39. Brunauer, S.; Emmett, P.H.; Teller, E. Adsorption of Gases in Multimolecular Layers. J. Am. Chem. Soc. 1938, 60, 309–319. [Google Scholar] [CrossRef]
  40. Sales, H.B.; Bouquet, V.; Députier, S.; Ollivier, S.; Gouttefangeas, F.; Guilloux-Viry, M.; Dorcet, V.; Weber, I.T.; Souza, A.; Santos, I.M.G. Sr1−xBaxSnO3 system applied in the photocatalytic discoloration of an azo-dye. Solid State Sci. 2014, 28, 67–73. [Google Scholar] [CrossRef] [Green Version]
  41. Rahman, Q.I.; Ahmad, M.; Misra, S.K.; Lohani, M. Effective photocatalytic degradation of rhodamine B dye by ZnO nanoparticles. Mater. Lett. 2013, 91, 170–174. [Google Scholar] [CrossRef]
  42. Podasca, V.E.; Buruiana, T.; Buruiana, E.C. Photocatalytic degradation of Rhodamine B dye by polymeric films containing ZnO, Ag nanoparticles and polypyrrole. J. Photochem. Photobiol. A Chem. 2019, 371, 188–195. [Google Scholar] [CrossRef]
  43. Layegh, M.; Ghodsi, F.E.; Hadipour, H. Improving the electrochemical response of nanostructured MoO3 electrodes by Co doping: Synthesis and characterization. J. Phys. Chem. Solids 2018, 121, 375–385. [Google Scholar] [CrossRef]
  44. Kim, C.-Y. Atomic structure of hematite (α-Fe2O3) nanocube surface; synchrotron X-ray diffraction study. Nano-Struct. Nano-Objects 2020, 23, 100497. [Google Scholar] [CrossRef]
  45. Maggi, F.; Dossi, S.; Paravan, C.; Galfetti, L.; Rota, R.; Cianfanelli, S.; Marra, G. Iron oxide as solid propellant catalyst: A detailed characterization. Acta Astronaut. 2019, 158, 416–424. [Google Scholar] [CrossRef]
  46. Seguin, L.; Figlarz, M.; Cavagnat, R.; Lassègues, J.-C. Infrared and Raman spectra of MoO3 molybdenum trioxides and MoO3 · xH2O molybdenum trioxide hydrates. Spectrochim. Acta Part A Mol. Biomol. Spectrosc. 1995, 51, 1323–1344. [Google Scholar] [CrossRef]
  47. Jiebing, S.; Rui, X.; Shimin, W.; Wufeng, T.; Hua, T.; Jing, S. Preparation and Characterization of Molybdenum Oxide Thin Films by Sol-Gel Process. J. Sol-Gel Sci. Technol. 2003, 27, 315–319. [Google Scholar] [CrossRef]
  48. Wang, Y.; Muramatsu, A.; Sugimoto, T. FTIR analysis of well-defined α-Fe2O3 particles. Colloids Surf. A Physicochem. Eng. Asp. 1998, 134, 281–297. [Google Scholar] [CrossRef]
  49. Žic, M.; Ristić, M.; Musić, S. Monitoring the hydrothermal precipitation of α-Fe2O3 from concentrated Fe(NO3)3 solutions partially neutralized with NaOH. J. Mol. Struct. 2011, 993, 115–119. [Google Scholar] [CrossRef]
  50. Grigorie, A.C.; Muntean, C.; Stefanescu, M. Obtaining of γ-Fe2O3 nanoparticles by thermal decomposition of polyethyleneglycol–iron nitrate mixtures. Thermochim. Acta 2015, 621, 61–67. [Google Scholar] [CrossRef]
  51. Nazri, G.-A.; Julien, C. Far-infrared and Raman studies of orthorhombic MoO3 single crystal. Solid State Ion. 1992, 53–56, 376–382. [Google Scholar] [CrossRef]
  52. Faria, D.L.A.; Lopes, F.N. Heated goethite and natural hematite: Can Raman spectroscopy be used to differentiate them? Vib. Spectrosc. 2007, 45, 117–121. [Google Scholar] [CrossRef]
  53. Froment, F.; Tournié, A.; Colomban, P. Raman identification of natural red to yellow pigments: Ochre and iron-containing ores. J. Raman Spectrosc. 2008, 39, 560–568. [Google Scholar] [CrossRef]
  54. Lübbe, M.; Gigler, A.M.; Stark, R.W.; Moritz, W. Identification of iron oxide phases in thin films grown on Al2O3(0001) by Raman spectroscopy and X-ray diffraction. Surf. Sci. 2010, 604, 679–685. [Google Scholar] [CrossRef]
  55. Chen, D.; Liu, M.; Yin, L.; Li, T.; Yang, Z.; Li, X.; Fan, B.; Wang, H.; Zhang, R.; Li, Z.; et al. Single-crystalline MoO3 nanoplates: Topochemical synthesis and enhanced ethanol-sensing performance. J. Mater. Chem. 2011, 21, 9332–9342. [Google Scholar] [CrossRef]
  56. Manukyan, K.; Davtyan, D.; Bossert, J.; Kharatyan, S. Direct reduction of ammonium molybdate to elemental molybdenum by combustion reaction. Chem. Eng. J. 2011, 168, 925–930. [Google Scholar] [CrossRef]
  57. Li, L.; Liang, P.; Liu, C.; Zhang, H.; Mitsuzaki, N.; Chen, Z. New method for improving the bulk charge separation of hematite with enhanced water splitting. Int. J. Hydrogen Energy 2019, 44, 4208–4217. [Google Scholar] [CrossRef]
  58. Scanlon, D.O.; Watson, G.W.; Payne, D.J.; Atkinson, G.R.; Egdell, R.G.; Law, D.S.L. Theoretical and Experimental Study of the Electronic Structures of MoO3 and MoO2. J. Phys. Chem. C 2010, 114, 4636–4645. [Google Scholar] [CrossRef]
  59. Amlouk, A.; Boubaker, K.; Amlouk, M.; Bouhafs, M. Study of ytterbium doping effects on structural, mechanical and opto-thermal properties of sprayed ZnO thin films using the Boubaker Polynomials Expansion Scheme (BPES). J. Alloys Compd. 2009, 485, 887–891. [Google Scholar] [CrossRef]
  60. Filatova, E.O.; Konashuk, A.S. Interpretation of the Changing the Band Gap of Al2O3 Depending on Its Crystalline Form: Connection with Different Local Symmetries. J. Phys. Chem. C 2015, 119, 20755–20761. [Google Scholar] [CrossRef]
  61. Marcos-Hernández, M.; Villagrán, D. 11-Mesoporous Composite Nanomaterials for Dye Removal and Other Applications. In Composite Nanoadsorbents; Kyzas, G.Z., Mitropoulos, A.C., Eds.; Micro and Nano Technologies; Elsevier: Amsterdam, The Netherlands, 2019; pp. 265–293. ISBN 978-0-12-814132-8. [Google Scholar]
  62. Muruganandham, M.; Swaminathan, M. Decolourisation of Reactive Orange 4 by Fenton and photo-Fenton oxidation technology. Dye. Pigment. 2004, 63, 315–321. [Google Scholar] [CrossRef]
  63. Xing, Z.; Zhang, J.; Cui, J.; Yin, J.; Zhao, T.; Kuang, J.; Xiu, Z.; Wan, N.; Zhou, W. Recent advances in floating TiO2-based photocatalysts for environmental application. Appl. Catal. B Environ. 2018, 225, 452–467. [Google Scholar] [CrossRef]
  64. Jing, X.; Peng, X.; Sun, X.; Zhou, W.; Wang, W.; Wang, S. Design and synthesis of Mo2C/MoO3 with enhanced visible-light photocatalytic performance for reduction of Cr (VI) and degradation of organic pollutants. Mater. Sci. Semicond. Process. 2019, 100, 262–269. [Google Scholar] [CrossRef]
  65. Wang, Y.; Wang, J.; Deng, R.; Xv, S.; Lv, X.; Zhou, J.; Li, S.; Cao, F.; Qin, G. Preparation and photocatalytic property of porous α-Fe2O3 nanoflowers. Mater. Res. Bull. 2018, 107, 94–99. [Google Scholar] [CrossRef]
  66. Luo, H.; Zhao, Y.; He, D.; Ji, Q.; Cheng, Y.; Zhang, D.; Pan, X. Hydroxylamine-facilitated degradation of rhodamine B (RhB) and p-nitrophenol (PNP) as catalyzed by Fe@Fe2O3 core-shell nanowires. J. Mol. Liq. 2019, 282, 13–22. [Google Scholar] [CrossRef]
  67. Honorio, L.M.C.; de Oliveira, A.L.M.; da Silva Filho, E.C.; Osajima, J.A.; Hakki, A.; Macphee, D.E.; Santos, I.M.G. dos Supporting the photocatalysts on ZrO2: An effective way to enhance the photocatalytic activity of SrSnO3. Appl. Surf. Sci. 2020, 528, 146991. [Google Scholar] [CrossRef]
  68. Ong, C.B.; Ng, L.Y.; Mohammad, A.W. A review of ZnO nanoparticles as solar photocatalysts: Synthesis, mechanisms and applications. Renew. Sustain. Energy Rev. 2018, 81, 536–551. [Google Scholar] [CrossRef]
  69. Miklos, D.B.; Remy, C.; Jekel, M.; Linden, K.G.; Drewes, J.E.; Hübner, U. Evaluation of advanced oxidation processes for water and wastewater treatment—A critical review. Water Res. 2018, 139, 118–131. [Google Scholar] [CrossRef]
  70. Dhanavel, L.; Deogratias, T.; Sivaranjani, S.; Narayanan, V.; Stephen, A. Facile synthesis of 1D/1D ZnO@h-MoO3 for enhanced visible light driven photo degradation of industrial textile effluent. Mater. Lett. 2020, 262, 127049. [Google Scholar] [CrossRef]
  71. Adhikari, S.; Kim, D.-H. Heterojunction C3N4/MoO3 microcomposite for highly efficient photocatalytic oxidation of Rhodamine B. Appl. Surf. Sci. 2020, 511, 145595. [Google Scholar] [CrossRef]
  72. Mohamed, M.M.; Salama, T.M.; Morsy, M.; Shahba, R.M.A.; Mohamed, S.H. Facile strategy of synthesizing α-MoO3−x nanorods boosted as traced by 1% graphene oxide: Efficient visible light photocatalysis and gas sensing applications. Sens. Actuators B Chem. 2019, 299, 126960. [Google Scholar] [CrossRef]
Figure 1. XRD patterns: (a), (b) α-MoO3 and (c) α-Fe2O3 photocatalysts.
Sustainability 12 07393 g001
Figure 2. IR spectra: (a) α-MoO3 and (b) α-Fe2O3 photocatalysts calcined at 550 °C/2 h.
Sustainability 12 07393 g002
Figure 3. Raman spectra: (a) α-MoO3 and (b) α-Fe2O3 photocatalysts obtained at 550 °C/2 h.
Sustainability 12 07393 g003
Figure 4. SEM images: (a,c) α-MoO3 and (b,d) α-Fe2O3 photocatalysts calcined at 550 °C/2 h.
Sustainability 12 07393 g004
Figure 5. UV–vis absorption spectra: (a) α-MoO3 and (b) α-Fe2O3 photocatalysts calcined at 550 °C/2 h.
Sustainability 12 07393 g005
Figure 6. N2 adsorption–desorption isotherms: (a) α-MoO3 and (b) α-Fe2O3 calcined at 550 °C/2 h.
Sustainability 12 07393 g006
Figure 7. Particle size distribution and mean particle diameter (D50): (a) α-MoO3 and (b) α-Fe2O3 photocatalysts calcined at 550 °C/2 h.
Sustainability 12 07393 g007
Figure 8. (a) UV–vis absorption spectra of the Rhodamine B dye (RhB) before and after the photolysis under visible irradiation; and (b) the emission spectrum of the visible light source.
Sustainability 12 07393 g008
Figure 9. (a) Adsorption tests in the dark. The inset indicates the adsorption capacity of the catalysts. (b) UV–visible absorption spectra of RhB before and after photocatalysis in the presence of α-MoO3 and α-Fe2O3. (c) UV–visible absorption spectra of RhB before and after photocatalysis in the presence of α-MoO3/H2O2 and α-Fe2O3/H2O2. (d) Degradation rate of the RhB solution in the presence of light (photolysis), catalysts/light and catalysts/light/H2O2.
Sustainability 12 07393 g009
Table 1. Band positions and attributions of the IR absorption spectrum of α-MoO3.
Band Position (cm−1) Assignments
This WorkSeguin et al. [46]Jiebing et al. [47]
997990995ν(Mo=O)
852876868δ(Mo–O–Mo)
817818818ν(Mo=O)
592603557ν(Mo–O)
487509513ν(Mo–O)
Table 2. Band positions and attributions of the IR absorption spectrum of α-Fe2O3.
Band Position (cm−1) Assignments
This WorkWang et al. [48]Žic et. al. [49]Grigorie et al. [50]
532578571542Fe–O stretching mode
449485461488Fe–O stretching mode
380397 α-Fe2O3
Table 3. Chemical composition of the synthesized photocatalysts.
SampleChemical Composition (%)
MoO3Fe2O3SO3P2O5
α-MoO3830.1160.8
α-Fe2O3100---
Table 4. Specific surface area, average pore diameter and pore volume of the synthesized photocatalysts.
SampleSBET (m2 g−1)Pore Diameter (nm)Pore Volume (cm3 g−1)
α-MoO33.245.804.70 × 10−3
α-Fe2O38.237.391.52 × 10−2

