On the Unbalanced Atmospheric Environmental Performance of Major Cities in China


1
Department of International Trade, Inha University, Inharo100, Nam-gu, Incheon 402-751, Korea
2
Program in Industry Security Governance, Inha University, Inharo 100, Nam-gu, Incheon 402-751, Korea
3
East Asia Environment Research Center, Inha University, Inharo 100, Nam-gu, Incheon 402-751, Korea
*
Authors to whom correspondence should be addressed.
Sustainability 2020, 12(13), 5391; https://doi.org/10.3390/su12135391
Submission received: 11 June 2020
/
Revised: 26 June 2020
/
Accepted: 29 June 2020
/
Published: 3 July 2020
(This article belongs to the Special Issue Energy Efficiency and Urban Climate Adaption)
Abstract
:As the largest emitter of CO2, China has also serious air pollution issues. Is it possible to catch these two rabbits under heterogenetic conditions of urbanization? To answer this, this study examines atmospheric environmental performance (SO2, NOx, and PMs) of 30 major cities in China using streaming data from 2011 to 2017. A non-radial SBM-DEA approach is adopted with a meta-frontier model to evaluate regional heterogeneity in atmospheric environmental management. Our results suggest that pollution prevention and regulation policies encouraged synergic development of most cities in the economy and atmospheric environment. On average, atmospheric environmental efficiency of the cities improved from 0.556 to 0.691. However, significantly unbalanced development exists in the regions, requiring customized policies. Eastern cities achieved continuing improvement owing to stringent air pollutant emission policies. Central cities showed a strong improvement but lacked momentum after they achieved certain targets. Western cities lagged behind in the studying period due to both technology gap as well as weak regulation. Furthermore, we identify heterogeneous paths for inefficient cities to enhance their performance using benchmark information. Economically developed eastern cities, such as Beijing, Fuzhou, are facing an over-supply issue. Reshaping their economic structure may be necessary to attain better environmental performance. Central cities face diversified issues. The emphasis of different cities may vary from stringent emission policies to proactive supply-side transition to achieve strong atmospheric management performance. For under-developed cities, preferential policies for investment and tax incentives may be needed to improve their production scale for higher efficiency.
1. Introduction
China has witnessed the largest global flow of rural–urban migration ever recorded. The urbanization rate increased from 17.6% in 1978 to 59.58% in 2018, through an average annual growth rate of 1.02% [1]. However, the rapid growth of urbanization has severely exacerbated air pollution (mainly SO2, NOx, and particulate matters (PMs)) and caused strongly negative public health effects [2,3]. For example, the 2013 haze event, mainly driven by industrial soot emissions, seriously hit north China and affected more than 800 million people [4,5]. Successful air pollution mitigation can effectively alleviate diseases of local people, such as asthma [6]. Thus, addressing air pollution issues is becoming equivalently important to tackling CO2-related climate change nowadays.
To successfully overcome this increasingly severe air pollution, China introduced the ‘Pollution Prevention and Control Action Plan’ policy in September 2013, targeting SO2, NOx, and PMs that have been driving the country’s air pollution crisis [7]. The plan ambitiously sets the objective to reduce air pollutant emissions by 10% at all the prefecture-level cities as of 2017, with a pledged investment of 1.75 trillion RMB. As major cities of China, such as Beijing, Shanghai, and Guangzhou, introduced an array of air pollution mitigation measures in response to the policy plan, it is perceivable that the total fiscal input in mitigating the air pollution would be even higher. Noting that China is still the biggest developing country, economic development is and will continually be the most important task. Debates have already raised over ‘pros’ and ‘cons’ of such a significant amount of investment in the atmospheric environmental governance. In this context, measuring the atmospheric environmental performance of those mega cities constitutes a meaningful scientific challenge. Regretfully, most studies have so far merely focused on CO2-related governance [8,9], losing sight of air pollution-related environmental management. Few have studied air pollution governance, but they mostly focused exclusively on air pollutant emissions [10,11], which may cause an unbalanced view on economic growth and environmental management.
As China is facing unprecedented challenges from economic downward pressure as well as environmental pressure, more appropriate fine-tuning of these two dimensions constructs the very foundation of long-term sustainability of China. Therefore, it becomes increasingly urgent to conduct a comprehensive evaluation of performance-oriented atmospheric governance. Noting that research on air pollution management in China is still limited [12], to holistically understand air pollution management performance, this study inclusively considers economic development and air pollution prevention by constructing atmospheric environmental efficiency (AEE).
There is a range of methods for environmental efficiency measurement, e.g., the single ratio method [13], life-cycle assessment [14,15], stochastic frontier analysis [16,17], the ecological footprint method [18], and data envelopment analysis (DEA) [19,20,21]. Among the methods, DEA has an advantage of measuring economic environment efficiency and air pollution simultaneously, and thus has been widely used in multi-dimensional sustainability measurement [8,22,23,24,25]. Traditional DEA models [26,27] are, however, limited in that they do not consider the slacks output variables, which is a potential gap to increase desirable output while maintaining input. Thus, the models are incapable of ranking performances of the decision-making units (DMUs) precisely with efficiencies equal to 1. There exist two approaches to overcome this limit: Non-radial directional distance function and slacks-based measure (SBM)-DEA [20]. The non-radial directional distance function may bring flexible in set weight factors for different variables. However, the flexibility also causes the subjectivity issue on the selection of weight factors. In contrast, SBM directly handles “input excess” and “output inefficiency”, projecting each entity to the “farthest” point on the efficient frontier and minimizing the objective function by finding the maximum slacks, which gives more objectively accurate, and thus reliable estimation.
To this end, an array of studies have adopted the SBM-DEA model to address sustainability measurement issues [21,28,29,30,31]. Whereas very few researches have measured air pollution-related efficiency, despite its significance to human health. Nonetheless, those previous studies have demonstrated the feasibility of major cities to mitigate air pollutant emissions [12]. However, prospective paths and regional heterogeneities are still unclear, especially at the city level, as the air pollution prevention plan directly sets emission standards at this level.
Therefore, this paper contributes to the literature in the following ways: First, the paper inclusively measures environmental performance of 30 key cities in China, which are not the largest 30 cities, but the capitals of 30 provinces except Tibet province, taking into consideration of all the three types of air pollutants (SO2, NOx, and PMs) in accordance to the air pollutants prevention plan. The study period ranges from 2011 to 2017, including the period before and end of the policy, which gives a comprehensive view of how those cities evolved in atmospheric pollution management. Second, understanding regional heterogeneity in air pollution management is critical to field-oriented governance. We divide the 30 cities into four groups according to their geospatial location, and investigate their regional heterogeneities using meta-frontier technology. Region-specified policy suggestions will be given. Moreover, China is still suffering an extremely high concentration of PMs, SO2, and NOx, which is causing a substantial number of air pollution-related deaths [3]. Under the second phase promotion policies for ’defending the blue sky’, improving atmospheric performance management becomes increasingly urgent for the nation. To suggest the customized, field-oriented solution, we will further explore optimal paths for the cities to enhance the atmospheric environmental performance using benchmark information.
2. Methods and Data
2.1. Atmospheric Environmental Efficiency
DEA is a commonly used method for constructing environmental performance indicators, as it provides a total-factor efficiency index [32]. In order to introduce the undesirable SBM, the term “environmental production technology” should be defined. Assume that there are j = 1, …, N decision-making units (DMUs). In this study, these DMUs are China’s provincial capital cities. Suppose that each DMU uses an input vector x ∈ Rm to produce jointly a desirable output vector y ∈ Rs and an undesirable output vector b ∈ Rb. Environmental production technology is expressed as:
where T is assumed to satisfy the standard axioms of production theory [32]. Inactivity is always possible, finite amounts of input can produce only finite amounts of output, and input and desirable outputs are often assumed to be freely disposable.
T = {(x, y, b):x can produce (y, b)}
Then, we define an SBM-DEA model as follows. The original SBM-DEA was developed by Tone [33], which considered a single input and a desirable output. To account for air pollutants emissions, undesirable outputs should be included in the original SBM model. Following Cooper et al. [34], the SBM model with undesirable output could be specified. T for N DMUs exhibiting constant return to scale can be expressed as follows:
Based on this technology frontier, we can introduce slack-based measurement of atmospheric environmental efficiency. According to Álvarez et al. [35], we can acquire the optimal solution by solving DEA-type model:
;
index of inputs;
index of desirable outputs;
index of desirable outputs;
slack variables (potential reduction) of inputs;
slack variables (potential expansion) of desirable outputs;
slack variables (potential reduction) of undesirable outputs; and
the sum of weights vector for PPS (The production possibility set) construction linear programming.
The optimal solution corresponds to = 1, with and .
2.2. Meta-Frontier Technology and Its Decomposition
Furthermore, we integrated the concept of meta-frontier with SBM-DEA model to investigate group heterogeneity across various regions. Suppose DMUs can be classified into H groups, due to differences in resources, technologies, and other geological or environmental constraints. The group-frontier technology of group h is defined as:
Assume that Th is specified as a nonparametric production technology. The AEE of group h can be calculated based on the SBM-DEA model. Then, the meta-frontier technologies can be expressed as Tm = {T1 ∪ T2 ∪ · · · ∪ TH}. Assume Nh observations for group h. Then, the SBM model with meta-frontier can be formulated as follows:
Based on the equation, the meta-frontier atmospheric environmental efficiency can be calculated.
Production efficiency under meta-frontier technologies can be decomposed into within-group efficiency and the meta-technology gap (MTG) [36]. The MTG measures the proximity of a group-frontier technology to the meta-frontier. The higher the MTG is, the closer the group-frontier technology is to the efficient meta-frontier. Following [37], we obtain MTG from meta-frontier AEE and grouped-frontier AEE:
2.3. Data Collection
To measure environmental performance, we collected input and output data of 30 provincial capital cities of China for 2011–2017. The cities were divided into four groups: Eastern, central, western, and northeastern cities, according to their geospatial locations [36,38]. Labor (L), capital (K), and energy consumption (E) were selected as input variables, based on previous studies [19]. Gross regional production (GRP) at a constant price was selected as a desirable output. SO2, NOx, and soot (major precursor of PMs) emissions were selected as the undesirable outputs. GRP, labor, capital, and energy consumption were collected from the city statistical yearbook. The capital is expressed by the fixed asset investment based on previous studies [39]. Data for SO2, NOx and soot emissions were extracted from the national environmental statistical yearbook. The data consist of 30 provincial capital cities in China. For balanced panel data, Lasa (the provincial capital city of Tibet with GRP of only 147.8 billion RMB) was excluded because of the scarcity of energy consumption data [24]. Table 1 provides descriptive statistics for the input and output variables for the sample cities.
3. Empirical Results and Discussion
3.1. Atmospheric Environmental Efficiency
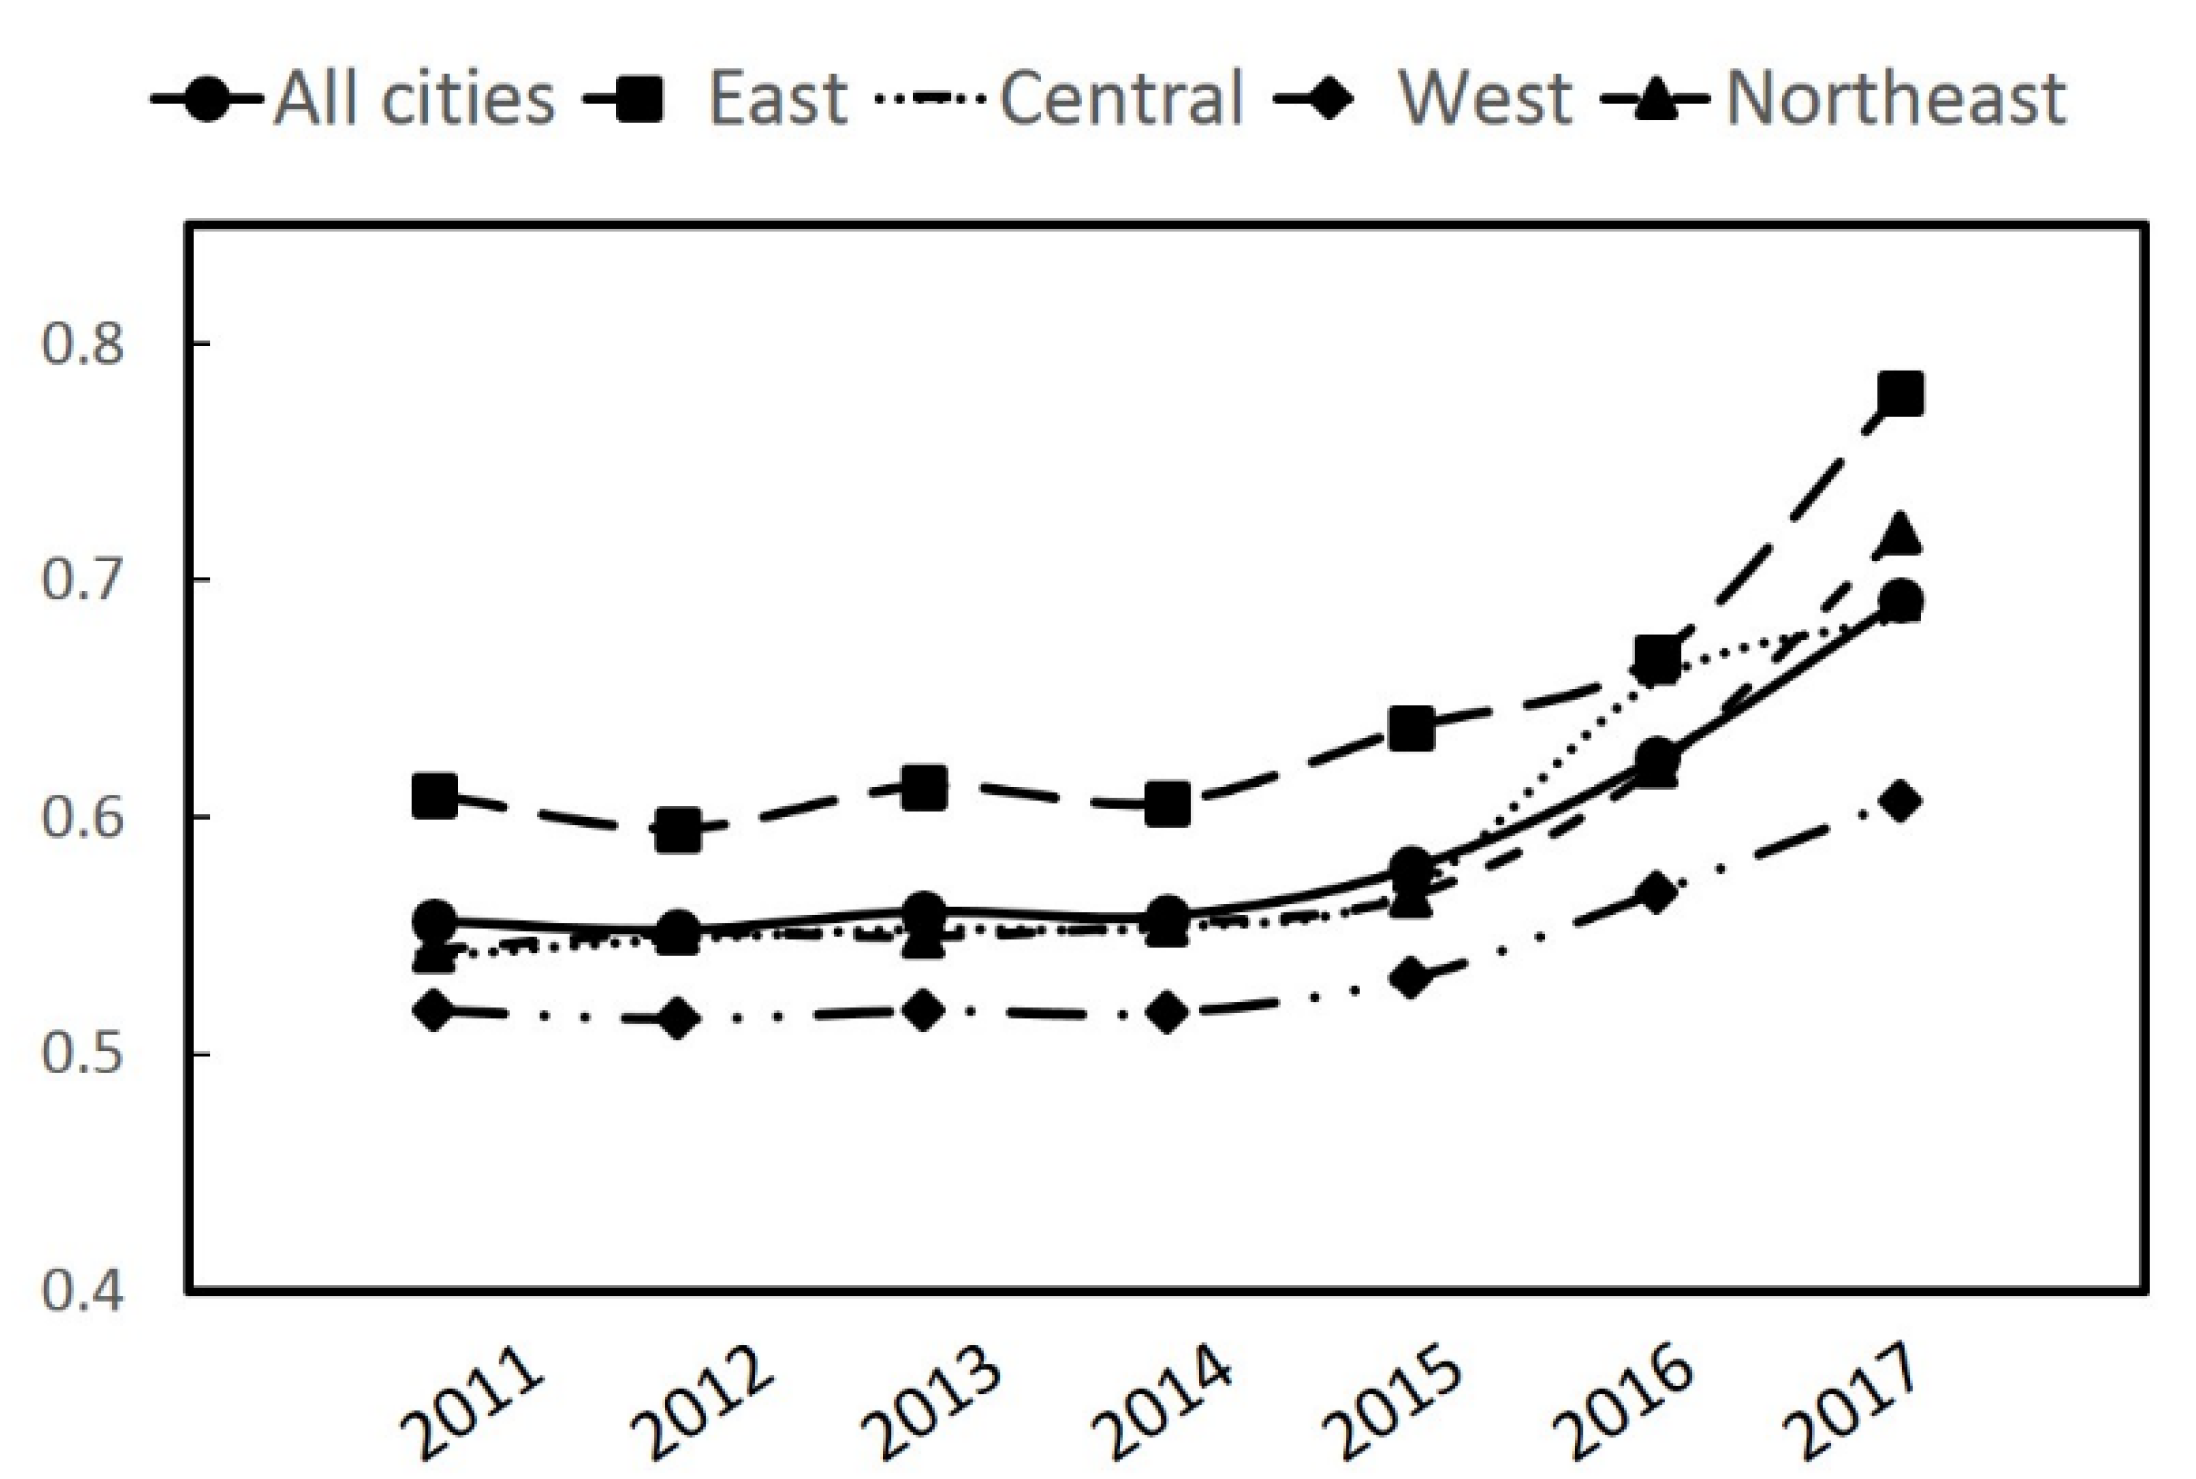
First, we calculated global AEEs based on the SBM-DEA model. Table 2 gives AEE of each city. Figure 1 presents the trend of AEEs of the four groups from 2011 to 2017. Averaged AEE of all the cities showed significant improvement from 0.556 to 0.691. Nonetheless, the result indicated there existed a substantial potential (~31.9%) for those major cities to further improve their performance. The period of 2011–2014 showed negative change in efficiency. Major improvement of the AEE was witnessed during the period of 2014–2017, in line with Porter hypothesis [40], which suggested that stricter environmental regulations increase environmental efficiency and encourage innovation for cleaner technology and industrial processes.
From 2011 to 2017, the four groups of cities showed the following characteristic changes in AEEs. First, western cities showed the lowest AEEs across the period. The group’s averaged AEE showed a slight increase from 0.519 to 0.607. Urumqi, the capital of Xinjiang province, showed a negligible increase of AEE from 0.5407 to 0.5501, suggesting the local government should put more emphasis on its AEE management. Nonetheless, Hohhot, as a neighboring city of Beijing designated for special care on the air condition in Beijing, experienced a remarkable improvement from 0.5737 to unity. Especially, the city increased its efficiency by 32.3% in 2016–2017, which may be mainly because of the special financial support (¥ 3.6 million) from the government to mitigate air pollutants-related pollution compared with 2016 (¥ 1.66 million), which was used to install air pollution control devices to address PM pollution [41,42]. Noting that the incremental investment was a specific appropriation from the central government, it may not result in a sustainable stimulation mechanism of technology improvement. Herein, the local government should find more endogenous paths to sustain its AEE growth.
Besides, with respect to the central cities, averaged AEE increased from 0.542 to 0.684, with an exploding increase from 0.570 to 0.657 for the period of 2015–2016, in line with the early compliance of the cities to the regulation of the ‘Pollution Prevention and Control Action Plan’ policy [10]. Changsha showed the best performance by reaching the efficient frontier in 2016, while Taiyuan showed the least growth. However, their efficiency growth slowed down in the period of 2016–2017. This implied that the efficiency improvement of those cities was mainly driven by the regulations of the central government. Once they met the policy targets set by the central government, their motivation to regulate atmospheric pollutions immediately weakened. Therefore, to sustain the efficiency enhancement of those cities, the central government may tighten atmospheric performance management to those cities. On the other hand, the local governments of these cities should rise their self-consciousness in air pollution prevention and cultivate endogenous momentum for a sustainable improvement of the AEE.
Finally, eastern and northeastern cities showed steady growth after the introduction of the prevention plan in 2013 (see Figure 1). Eastern cities kept a leading position in the AEE. Especially, Beijing, Shanghai, and Guangzhou, as the three biggest cities, saw remarkable efficiency improvement from 0.5884, 0.6452, 0.6038 to 0.9399, 1, 1, respectively, implying successful implementation of air prevention measures in those cities. One critical reason is that the air regulation strategies were prioritized in the eastern region compared with other regions [10]. More stringent emission standards have been implemented in the region, which pushed the region to conduct more efforts to mitigate air pollutants. The strong AEE improvement of the eastern region demonstrated that China has tremendous potential in the synergetic development of economy and environment. Stringent policies can boost both economic and environmental development, instead of harming economic targets. For northeastern cities, their growth mainly occurred in the period of 2015–2017. The surge in AEE followed after the specific air pollution prevention measures by local governments [43], indicating the unreplaceable role of local governments in rolling out concrete actions in improving their AEE.
3.2. Technology Heterogeneities between Regions
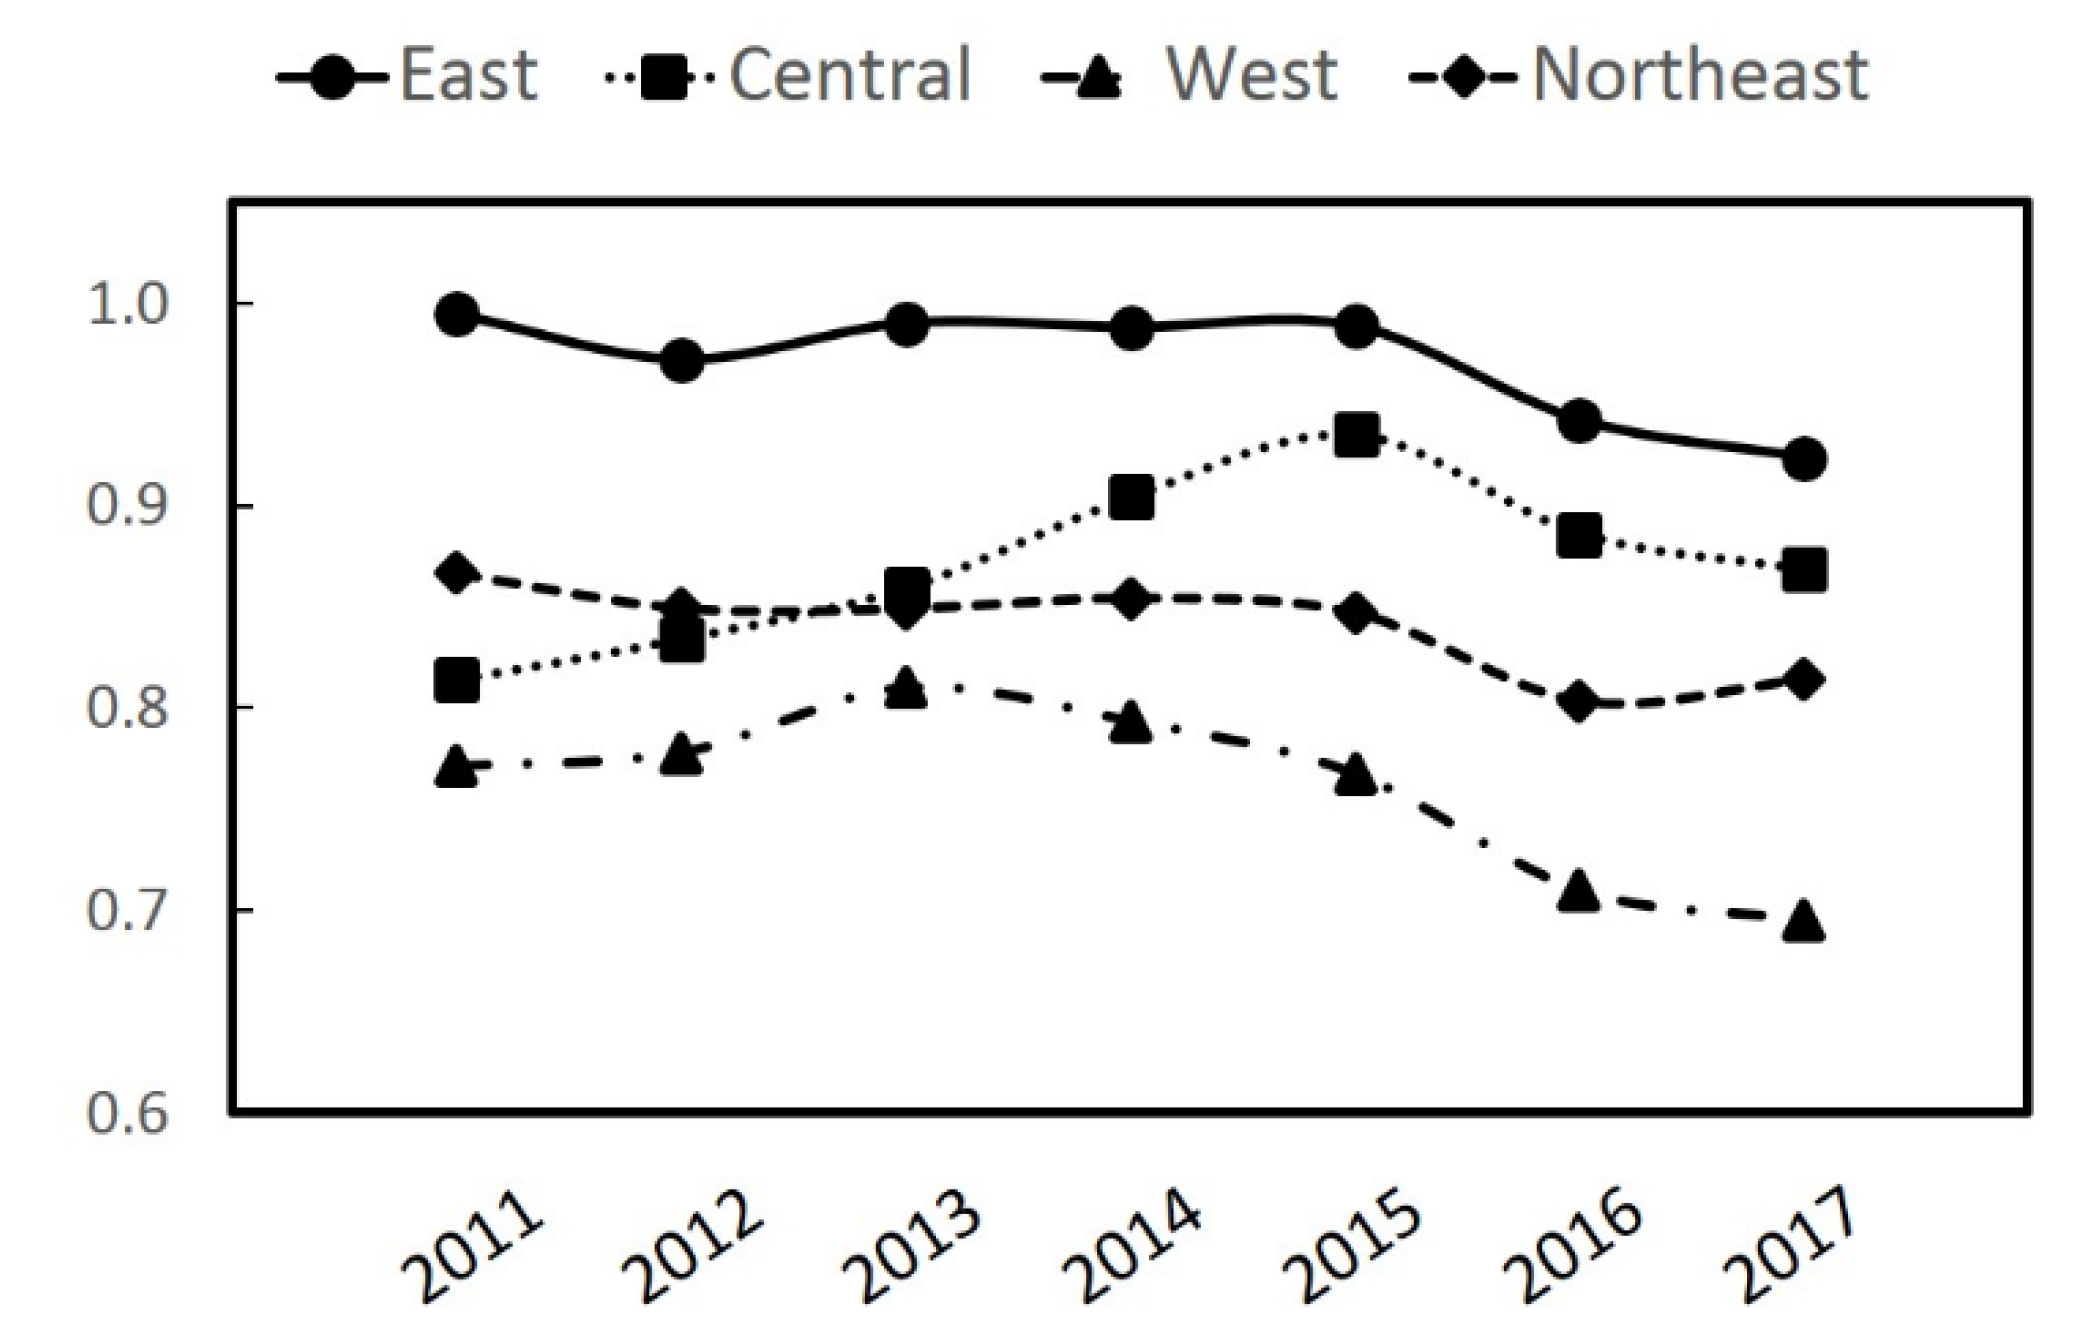
We further explored the MTGs between regions using meta-frontier technology. An MTG indicates the technology gap between each heterogenic group frontier and meta-frontier. The more the MTG closes to 1, the smaller the technology gap is. Table 3 displays MTGs of individual cities, and Figure 2 displays the MTG in each region. The eastern area kept its leading position in the MTG index, indicating that it has the smallest technology gap relative to the meta frontier, in line with a previous finding that the east region led the sustainable growth [36]. In 2011, the MTG of the east reached 99.4%, indicating that there was neglecting the technology gap between the group frontier of the east and the meta frontier. The environmental technologies of eastern cities can represent the most advanced technology in China. However, MTG index of the east trended to lower down starting from 2014, implying the technology gap between the eastern region and the meta-frontier has enlarged since then. However, noting that the eastern region showed significant AEE improvement, this downward MTG curve may imply that other regions have paved different paths toward higher AEE. That is, other regions may experience different technology pathways compared with the eastern region. In this sense, the results indicated that the eastern region should learn from the other regions’ experience to further improve its AEE. Besides, we can see that Shanghai showed a sudden drop in MTG from 1 to 0.6904, ascribing to its procrastination in environmental regulation compared with other cities. The total air pollutant emission of Shanghai mounted to 231.5 kt in 2016, comparing to 100.7 kt emission from Beijing. Nonetheless, the city was able to give fast response to the lagging behind and improved its technology significantly in 2017, its total air pollutant emission dropped to 93.9 kt.
As shown in Figure 2, the average MTGs of central, western, and northeast regions in 2017 were 0.868, 0.695, and 0.814, respectively. The central cities had substantial improvement in their AEE technology. The technology gap of the central cities to the eastern cities shrank from 0.181 in 2011 to 0.055 in 2017. One of the biggest reasons was their catch-up performance in economic output. For instance, Changsha has shown an annual real GDP growth of ~10.7% in the study period. For comparison, the growth of Beijing was only ~7.25%. At the same time, the central cities were also experiencing strict environmental policies comparable to the eastern cities, indicating the effectiveness of the Porter hypothesis in the central region. Whereas the technology gap between the western cities and the most advanced eastern cities even has been growing. Their MTGs continued decreasing, indicating lagging behind of their technology statuses in the atmospheric management. This was in line with previous findings by Yu and Choi [36], suggesting the west region may has not passed the peak point of the environmental Kuznets curve. The west should put more efforts by diverse incentives in their atmospheric related technologies for better environmental management.
3.3. Benchmark for Inefficient Cities
Now, as mentioned above, most cities, especially in the western region, should make more efforts to catch the significant potentials to enhance AEE. How can these cities get the right direction or optimal paths to transform their local economy? SBM-DEA provides benchmark information for inefficient DMUs. These DMUs can learn from those efficient DMUs in terms of management experience, industrial structure, and policy mix to improve their AEEs [29]. For an inefficient DMU to enhance its efficiency, its input target should achieve the value following the equation:
where benchmark i corresponds to the input–output structure of an efficient DMU I, corresponds to the weight value of the efficient DMU, and an inefficient DMU’s target is the projection of the efficient DMU on the frontier.
To determine the set of benchmarks for an inefficient DMU (assuming it is DMU i), one should solve the DEA model as shown in Equation (1). Then, one can get a vector of λ with a dimension of n × 1, where n is the number of DMUs. In the vector, the λ for inefficient DMUs are always zero, while for efficient DMUs, the λ are in the range of [0, +∞). If the λ corresponding to an efficient DMU is not zero, then the DMU is the benchmark for the inefficient DMU. This means that the DMU with non-zero λ is the target of i. i could learn from the non-zero λ DMU and change its input–output structure so that i could become efficient. Correspondingly, if a DMU appears as a benchmark for several inefficient DMUs, the benchmark DMU may have an economic structure that is not only efficient but also reproducible. If an efficient DMU does not appear as a benchmark for other inefficient DMUs, this indicates their economic pattern may drastically differ from that of other cities.
Besides, we can get more information from the magnitude of the λ values. The larger the λ is, the more similar the input–output structure of the inefficient DMU i is to the benchmark DMUs [29].
The λ values also imply the return-to-scale status of each city. There are three possible types of return-to-scale: Constant-return-to-scale (CRS), meaning output increases by the same proportional input change as all, inputs increased-return-to-scale (IRS), meaning output increases by more than the proportional change of inputs, and decreased-return-to-scale (DRS), meaning output increases by less than the proportional change of inputs. If Σλ = 1, the DMU exhibits CRS, meaning that the AEE of a city is at unity. They have efficient input–output structures. When Σλ > 1, a DMU exhibits the DMU is at the state of IRS, indicates that the increasing production scale can increase the DMU’s efficiency score. When Σλ < 1, the DMU exhibits DRS, implying that further increase the production scale of a city will decrease its AEE.
We calculated the benchmark performance of the cities in 2017 to inform the orientation of a city to improve. In deciding reference set cities, we considered benchmarking within group-frontier instead of meta-frontier, as meta-frontier benchmarking may be unrealistic with the existing technology gap between regions. That is to say, inefficient cities are more likely to learn from the neighboring cities within the same group. For instance, Tianjin is more likely to learn AEE management experience from Beijing instead of Changsha, as Tianjin and Beijing have a more similar supply and consumption structure.
From Table 4, Guangzhou stood out as the benchmark of most eastern cities, while Changsha was the benchmark for most central cities, indicating the economic structure of Guangzhou and Changsha were more reproducible. Chengdu and Chongqing were the two prevail benchmarks for western cities. Although Xi’an was an efficient DMU, its economic pattern may drastically differ from that of other cities, such that they were unable to be benchmarks. For northeast cities, only Harbin was inefficient under grouped-frontier, and the results showed that it should learn more ( 0.7901) from Changchun. Thus, the results may indicate that the city has a similar industrial structure to Changchun.
In terms of return-to-scale, results suggested that in the east region, developed cities such as Beijing, Fuzhou, and Nanjing, was facing an over-supply issue, as shown in Table 4. Increasing urbanization in these cities was causing over-concentration of resources, which has led to significant inefficiency. Thus, the governments should address the issue by solutions like reshaping their industrial structure, energy consumption structure, and etc., to reduce the oversupplied resources. In this case, those cities should learn from benchmarks on how to reduce their air pollution emissions efficiently. For example, with a similar economic structure, Guangzhou has substantially lower air pollutant emissions compared with Beijing. According to the Pearl River Delta Clean Air Plan [44], Guangzhou has laid emphasis on air pollution mitigation in both industrial and residential sectors. The city has built several highly efficient municipal solid waste incineration plants, which was used to mitigate air pollutants emissions from household consumption. Beijing may learn from the policy designs to promote cleaner development. While Jinan, with an IRS condition, should increase its production scale while keeping its relatively low air pollutant emissions.
For the central region, Changsha was the most prevailing benchmark. Hefei and Nanchang were in IRS state, and Wuhan was in DRS state. On the one hand, Changsha has proactively pursued high-value manufacturing and developed the service sector, e.g., developing the Changsha Economic and Technological Development Zone, leading to high-quality economic growth. The cities in IRS state may learn from its developing path and make proper adjustments to their economic structure. On the other hand, Changsha has been listed by the Ministry of Ecology and Environment as one of the 47 key regions subject to special limitations for air pollutants. The policy effectively boosted the increase of AEE, indicating stringent policies encouraged efficiency. Therefore, for central cities in the DRS condition, if a higher AEE were to be pursued, the central government of China could further tighten air pollutant emission policies for cities in the central region.
Chengdu and Chongqing were the two prevailing benchmarks for the western cities. The two cities are the core of Cheng (Chengdu)–Yu (Chongqing) economic zone approved by the central government in 2011, thus, received much policy support. Therefore, it is evidenced that economic policy support can effectively improve AEEs of western cities. Most of the cities in the western region were on the group frontier. Inefficient cities were all in an IRS condition. Increasing production scales is likely to encourage higher AEE. Thus, to learn effectively from Chengdu and Chongqing, more preferential policies and tax incentives may be needed in these cities.
4. Conclusions and Implications
China is now in its second phase for ‘defending the blue sky’. Field- and performance-oriented strategies become more and more important in order to efficiently reduce air pollutant emissions. Due to the serious heterogeneous character of the regions, much more differentiated policies become critical to enhance air pollutant management performance for each region. This study adopted an undesirable SBM-DEA approach to analyze the evolution and regional heterogeneity of the atmospheric environmental performance of China’s major cities from 2011 to 2017, providing a holistic view of the achievement of air pollution prevention action and proposing paths for prospective atmospheric management in these cities. We summarized major conclusions and implications as follows.
First, the air prevention plan has substantially improved the atmospheric environmental performance of China’s major cities and bolstered high-quality economic development. Nonetheless, there exists huge potential (up to 31.9% under current technology status) for China to improve its atmospheric environment.
Second, there is significantly unbalanced regional development in terms of AEE. Eastern cities keep a leading role in environmental management. Their success in AEE improvement demonstrated that there a substantial space for other regions to implement more rigorous air pollution management policies. Central and northeastern cities showed a strong catch-up effect in the period of the plan, while western cities lagged behind in the atmospheric management.
Third, large technology gaps between regions exist. The eastern region showed a downward trend due to technology development of other regions. The technology gap between the eastern region and the central region has narrowed since the implementation of the plan, but the gap between the eastern region and the western region has grown, implying the western cities lagged behind in the atmospheric environmental management. Correspondingly, the central government of China should shift its focus to those under-developed western areas and invest more to boost their technology progress in the prospective second-stage environmental protection.
Forth, from the perspective of returns-to-scale, economically developed cities, like Beijing, Wuhan, Fuzhou, Nanjing, showed DRS states, implying they should reduce their economic resources or reshape their input structure to achieve higher AEE. While those cities with low-level of economic development, like Shijiazhuang, Guiyang, Kunming, showed IRS states, indicating they should increase their economic scale by higher investment to achieve higher AEE.
The present work may be subject to some limitations. First, DEA studies are highly sensitive to the selection of input–output indicators [45]. This work used SO2, NOx, and PMs as surrogate indicators of air pollutants, while actual air pollution involves a broader range of pollutants. Thus, the methodological choice may lead to unknown uncertainties in final outcomes. Second, DEA, in its nature, is a deterministic method, which does not consider sampling errors and, therefore, involves biases in the calculation. To this end, we may use the bootstrapping DEA method [28,46] in future works for better presenting efficiency measurement results.
Finally, future studies can extend this work in the following points. First, air pollutant mitigation actions were mostly conducted in the transport sector and the energy supply sector. A sector-based analysis may be helpful in distinguishing performance heterogeneity of different regions at higher resolution. Second, although the central government of China has invested tremendous resources in air pollution prevention, the performance of air quality improvement is still critically low, implying much higher potential to lead the global economy by greener economic development. To this end, it would be interesting to measure the shadow price of different industries in different cities to give practical suggestions to local governments for air pollution mitigation.
Author Contributions
Conceptualization, Y.C. and H.L.; methodology, F.Y.; software, F.Y.; validation, Y.C., F.Y. and H.L.; formal analysis, F.Y.; investigation, Y.C.; resources, H.L.; data curation, F.Y.; writing—original draft preparation, F.Y.; writing—review and editing, Y.C.; visualization, F.Y.; supervision, H.L.; project administration, Y.C.; funding acquisition, Y.C. All authors have read and agreed to the published version of the manuscript.
Funding
This work was supported by the Inha University Research Fun.
Acknowledgments
All authors appreciate the valuable comments by the anonymous referees. Their comments enhanced the quality of paper much highly. We do acknowledge the Sustainable Asia Conference, the annual membership conference for this area of environmental issues.
Conflicts of Interest
The authors declare no conflict of interest.
References
- National Bureau of Statistics. China Statistical Yearbook 2019. Available online: http://www.stats.gov.cn/tjsj/ndsj/2019/indexeh.htm (accessed on 28 June 2020).
- Huang, J.; Pan, X.; Guo, X.; Li, G. Health impact of China’s air pollution prevention and control action plan: An analysis of national air quality monitoring and mortality data. Lancet Planet. Health 2018, 2, e313–e323. [Google Scholar] [CrossRef] [Green Version]
- Health Effects Institute. State Of Global Air Report 2019; Health Effects Institute: Boston, MA, USA, 2019. [Google Scholar]
- Xu, P.; Chen, Y.; Ye, X. Haze, air pollution, and health in China. Lancet 2013, 382, 2067. [Google Scholar] [CrossRef]
- Huang, R.-J.; Zhang, Y.; Bozzetti, C.; Ho, K.-F.; Cao, J.-J.; Han, Y.; Daellenbach, K.R.; Slowik, J.G.; Platt, S.M.; Canonaco, F. High secondary aerosol contribution to particulate pollution during haze events in China. Nature 2014, 514, 218–222. [Google Scholar] [CrossRef] [PubMed] [Green Version]
- Casey, J.A.; Su, J.G.; Henneman, L.R.; Zigler, C.; Neophytou, A.M.; Catalano, R.; Gondalia, R.; Chen, Y.-T.; Kaye, L.; Moyer, S.S. Improved asthma outcomes observed in the vicinity of coal power plant retirement, retrofit and conversion to natural gas. Nat. Energy 2020, 5, 398–408. [Google Scholar] [CrossRef] [PubMed]
- State Council of People’s Republic of China. Air Pollution Prevention Action Plan; State Council of People’s Republic of China: Beijing, China, 2013.
- Lee, H.S.; Choi, Y. Environmental performance evaluation of the Korean manufacturing industry based on sequential DEA. Sustainability 2019, 11, 874. [Google Scholar] [CrossRef] [Green Version]
- Zhang, N.; Yu, K.; Chen, Z. How does urbanization affect carbon dioxide emissions? A cross-country panel data analysis. Energ Policy 2017, 107, 678–687. [Google Scholar]
- Tang, L.; Qu, J.; Mi, Z.; Bo, X.; Chang, X.; Anadon, L.D.; Wang, S.; Xue, X.; Li, S.; Wang, X.; et al. Substantial emission reductions from Chinese power plants after the introduction of ultra-low emissions standards. Nat. Energy 2019, 4, 929–938. [Google Scholar] [CrossRef]
- Zhao, S.; Yu, Y.; Yin, D.; He, J.; Liu, N.; Qu, J.; Xiao, J. Annual and diurnal variations of gaseous and particulate pollutants in 31 provincial capital cities based on in situ air quality monitoring data from China National Environmental Monitoring Center. Environ. Int 2016, 86, 92–106. [Google Scholar] [CrossRef]
- Zhang, N.; Wu, Y.; Choi, Y. Is it feasible for China to enhance its air quality in terms of the efficiency and the regulatory cost of air pollution? Sci Total Environ. 2020, 709, 136149. [Google Scholar] [CrossRef]
- Yin, K.; Wang, R.; An, Q.; Yao, L.; Liang, J. Using eco-efficiency as an indicator for sustainable urban development: A case study of Chinese provincial capital cities. Ecol. Indic. 2014, 36, 665–671. [Google Scholar] [CrossRef]
- Beames, A.; Broekx, S.; Heijungs, R.; Lookman, R.; Boonen, K.; Van Geert, Y.; Dendoncker, K.; Seuntjens, P. Accounting for land-use efficiency and temporal variations between brownfield remediation alternatives in life-cycle assessment. J. Clean. Prod. 2015, 101, 109–117. [Google Scholar] [CrossRef]
- Duan, H.; Hu, M.; Zhang, Y.; Wang, J.; Jiang, W.; Huang, Q.; Li, J. Quantification of carbon emissions of the transport service sector in China by using streamlined life cycle assessment. J. Clean. Prod. 2015, 95, 109–116. [Google Scholar] [CrossRef]
- Baráth, L.; Fertő, I. Heterogeneous technology, scale of land use and technical efficiency: The case of Hungarian crop farms. Land Use Policy 2015, 42, 141–150. [Google Scholar] [CrossRef] [Green Version]
- Choi, Y.; Qi, C. Is South Korea’s emission trading scheme effective? An analysis based on the marginal abatement cost of coal-fueled power plants. Sustainability 2019, 11, 2504. [Google Scholar]
- Cerutti, A.K.; Beccaro, G.L.; Bagliani, M.; Donno, D.; Bounous, G. multifunctional ecological footprint analysis for assessing eco-efficiency: A case study of fruit production systems in Northern Italy. J. Clean. Prod. 2013, 40, 108–117. [Google Scholar] [CrossRef] [Green Version]
- Choi, Y.; Zhang, N.; Zhou, P. Efficiency and abatement costs of energy-related CO2 emissions in China: A slacks-based efficiency measure. Appl. Energy 2012, 98, 198–208. [Google Scholar] [CrossRef]
- Zhou, H.; Yang, Y.; Chen, Y.; Zhu, J. Data envelopment analysis application in sustainability: The origins, development and future directions. Eur. J. Oper. Res. 2018, 264, 1–16. [Google Scholar] [CrossRef]
- Deng, G.; Li, L.; Song, Y. Provincial water use efficiency measurement and factor analysis in China: Based on SBM-DEA model. Ecol. Indic. 2016, 69, 12–18. [Google Scholar] [CrossRef]
- Zhang, N.; Zhou, P.; Choi, Y. Energy efficiency, CO2 emission performance and technology gaps in fossil fuel electricity generation in Korea: A meta-frontier non-radial directional distance functionanalysis. Energy Policy 2013, 56, 653–662. [Google Scholar] [CrossRef]
- Zhang, N.; Choi, Y.; Wang, W. Does energy research funding work? Evidence from the Natural Science Foundation of China using TEI@I method. Technol. Forecast. Soc. Chang. 2019, 144, 369–380. [Google Scholar] [CrossRef]
- Yu, Y.; Choi, Y.; Wei, X.; Chen, Z. Did China’s regional transport industry enjoy better carbon productivity under regulations? J. Clean. Prod. 2017, 165, 777–787. [Google Scholar] [CrossRef]
- Lee, H.; Choi, Y. Greenhouse gas performance of Korean local governments based on non-radial DDF. Technol. Forecast. Soc. Chang. 2018, 135, 13–21. [Google Scholar] [CrossRef]
- Charnes, A.; Cooper, W.W.; Lewin, A.Y.; Morey, R.C.; Rousseau, J. Sensitivity and stability analysis in DEA. Ann. Oper. Res. 1984, 2, 139–156. [Google Scholar] [CrossRef]
- Banker, R.D. Estimating most productive scale size using data envelopment analysis. Eur. J. Oper. Res. 1984, 17, 35–44. [Google Scholar] [CrossRef]
- Lee, H.; Choi, Y.; Seo, H. Comparative analysis of the R&D investment performance of Korean local governments. Technol. Forecast. Soc. Chang. 2020, 157, 120073. [Google Scholar]
- Choi, Y.; Yu, Y.; Lee, H. A Study on the sustainable performance of the steel industry in Korea based on SBM-DEA. Sustainability 2018, 10, 173. [Google Scholar] [CrossRef] [Green Version]
- Mardani, A.; Zavadskas, E.K.; Streimikiene, D.; Jusoh, A.; Khoshnoudi, M. A comprehensive review of data envelopment analysis (DEA) approach in energy efficiency. Renew. Sustain. Energy Rev. 2017, 70, 1298–1322. [Google Scholar] [CrossRef]
- Guo, Y.; Liu, W.; Tian, J.; He, R.; Chen, L. Eco-efficiency assessment of coal-fired combined heat and power plants in Chinese eco-industrial parks. J. Clean. Prod. 2017, 168, 963–972. [Google Scholar] [CrossRef]
- Färe, R.; Grosskopf, S. New Directions: Efficiency and Productivity; Springer Science & Business Media: Berlin/Heidelberg, Germany, 2006; Volume 3. [Google Scholar]
- Tone, A slacks-based measure of efficiency in data envelopment analysis. Eur. J. Oper. Res. 2001, 130, 498–509. [CrossRef] [Green Version]
- Cooper, W.W.; Seiford, L.M.; Tone, K. Data envelopment analysis. In Handbook on Data Envelopment Analysis, 1st ed.; Cooper, W.w., Seiford, L.m., Zhu, J., Eds.; Spring: Berlin/Heidelberg, Germany, 2000; pp. 1–40. [Google Scholar]
- Álvarez, I.; Barbero, J.; Zofío, J.L. A Data Envelopment Analysis Toolbox for MATLAB; Department of Economic Analysis, Universidad Autónoma de Madrid (Spain): Madrid, Spain, 2016. [Google Scholar]
- Yu, Y.; Choi, Y. Measuring environmental performance under regional heterogeneity in China: A metafrontier efficiency analysis. Comput. Econ. 2014, 46, 375–388. [Google Scholar] [CrossRef]
- O’Donnell, C.J.; Rao, D.S.P.; Battese, G.E. Metafrontier frameworks for the study of firm-level efficiencies and technology ratios. Empir. Econ. 2007, 34, 231–255. [Google Scholar] [CrossRef]
- Du, G.; Liu, S.; Lei, N.; Huang, Y. A test of environmental Kuznets curve for haze pollution in China: Evidence from the penal data of 27 capital cities. J. Clean. Prod. 2018, 205, 821–827. [Google Scholar] [CrossRef]
- Wang, J.; Wang, S.; Li, S.; Cai, Q.; Gao, S. Evaluating the energy-environment efficiency and its determinants in Guangdong using a slack-based measure with environmental undesirable outputs and panel data model. Sci. Total Environ. 2019, 663, 878–888. [Google Scholar] [CrossRef] [PubMed]
- Porter, M.E.; Van der Linde, C. Toward a new conception of the environment-competitiveness relationship. J. Econ. Perspect. 1995, 9, 97–118. [Google Scholar] [CrossRef]
- Hohhot Municipal Ecology and Environment Bureau. Annual Report of Ecology and Environment Bureau on Expenditure 2016; Hohhot Municipal Ecology and Environment Bureau: Beijing, China, 2017. (In Chinese)
- Hohhot Municipal Ecology and Environment Bureau. Annual Report of Ecology and Environment Bureau on Expenditure 2017; Hohhot Municipal Ecology and Environment Bureau: Beijing, China, 2018. (In Chinese)
- People’s Government of Jilin. Measures to Promote Ecological Progress in Jilin; People’s Government of Jilin: Changchun, China, 2016. (In Chinese)
- Department of Ecology and Environment of Guangdong Province. The Second Phase (2013–2015) of the Clean Air Action Plan in Pearl River Delta in Guangdong Province; Department of Ecology and Environment of Guangdong Province: Guangzhou, China, 2013. (In Chinese)
- Martín-Gamboa, M.; Iribarren, D.; García-Gusano, D.; Dufour, J. A review of life-cycle approaches coupled with data envelopment analysis within multi-criteria decision analysis for sustainability assessment of energy systems. J. Clean. Prod. 2017, 150, 164–174. [Google Scholar] [CrossRef]
- Assaf, A.; Matawie, K.M. Improving the accuracy of DEA efficiency analysis: A bootstrap application to the health care foodservice industry. Appl. Econ. 2010, 42, 3547–3558. [Google Scholar] [CrossRef]
Figure 1.
The evolution of atmospheric environmental efficiency of the four groups of provincial capitals.
Figure 1.
The evolution of atmospheric environmental efficiency of the four groups of provincial capitals.

Figure 2.
Meta-frontier technology gaps between regions.


Table 1.
Descriptive statistics of inputs and outputs, 2011–2017.
| Variables | Unit | Mean | St Dev | Minimum | Maximum |
|---|---|---|---|---|---|
| Labor | 104 persons | 200.3 | 196.0 | 31.3 | 986.9 |
| Capital | 108 RMB | 4375.5 | 2901.3 | 404.6 | 17,537.0 |
| Energy | 104 Tons of SCE | 3107.6 | 2697.6 | 17.6 | 11,859.0 |
| GRP | 108 RMB | 7043.6 | 5867.8 | 713.3 | 28,617.0 |
| SO2 | Tons | 91,408.7 | 88,165.9 | 512.0 | 586,925.0 |
| NOx | Tons | 77,611.6 | 64,585.3 | 103.0 | 336,028.0 |
| PM | Tons | 56,313.8 | 43,416.4 | 113.0 | 230,995.0 |
Table 2.
Global environmental efficiencies of the 30 provincial capital cities.
| City | 2011 | 2012 | 2013 | 2014 | 2015 | 2016 | 2017 | Average | |
|---|---|---|---|---|---|---|---|---|---|
| Eastern | Beijing | 0.5884 | 0.5922 | 0.6023 | 0.6138 | 0.6454 | 0.7097 | 0.9399 | 0.6702 |
| Fuzhou | 0.5305 | 0.5387 | 0.5221 | 0.5408 | 0.5519 | 0.5779 | 0.5845 | 0.5495 | |
| Guangzhou | 0.6452 | 0.6653 | 0.6437 | 0.6437 | 0.7124 | 0.8740 | 1 | 0.7406 | |
| Haikou | 1 | 0.7868 | 1 | 0.8848 | 1 | 0.8361 | 1 | 0.9297 | |
| Hangzhou | 0.5786 | 0.5851 | 0.5872 | 0.5867 | 0.5983 | 0.6437 | 0.7941 | 0.6248 | |
| Jinan | 0.5180 | 0.5291 | 0.5297 | 0.5408 | 0.5542 | 0.5781 | 0.6119 | 0.5517 | |
| Nanjing | 0.5443 | 0.5541 | 0.5289 | 0.5357 | 0.5531 | 0.5943 | 0.6419 | 0.5646 | |
| Shanghai | 0.6038 | 0.6072 | 0.6134 | 0.6058 | 0.6295 | 0.6904 | 1 | 0.6786 | |
| Shijiazhuang | 0.5397 | 0.5409 | 0.5447 | 0.5438 | 0.5508 | 0.5588 | 0.5894 | 0.5526 | |
| Tianjin | 0.5431 | 0.5492 | 0.5576 | 0.5631 | 0.5806 | 0.6150 | 0.6349 | 0.5776 | |
| Central | Changsha | 0.6232 | 0.6546 | 0.6622 | 0.6765 | 0.7209 | 1 | 1 | 0.7625 |
| Hefei | 0.5238 | 0.5220 | 0.5150 | 0.5213 | 0.5360 | 0.6376 | 0.6434 | 0.5570 | |
| Nanchang | 0.5175 | 0.5302 | 0.5526 | 0.5481 | 0.5656 | 0.6023 | 0.6254 | 0.5631 | |
| Taiyuan | 0.5133 | 0.4976 | 0.4857 | 0.4829 | 0.4862 | 0.5011 | 0.5797 | 0.5066 | |
| Wuhan | 0.5390 | 0.5489 | 0.5656 | 0.5531 | 0.5629 | 0.6132 | 0.6341 | 0.5738 | |
| Zhengzhou | 0.5331 | 0.5403 | 0.5367 | 0.5406 | 0.5478 | 0.5902 | 0.6234 | 0.5589 | |
| Western | Chengdu | 0.5918 | 0.5961 | 0.6059 | 0.6071 | 0.6243 | 0.6455 | 0.6663 | 0.6196 |
| Chongqing | 0.5123 | 0.4850 | 0.4861 | 0.4869 | 0.4998 | 0.5571 | 0.5771 | 0.5149 | |
| Guiyang | 0.4568 | 0.4532 | 0.4806 | 0.4949 | 0.5055 | 0.5219 | 0.5245 | 0.4911 | |
| Hohhot | 0.5737 | 0.5770 | 0.5676 | 0.5702 | 0.6097 | 0.6769 | 1 | 0.6536 | |
| Kunming | 0.4580 | 0.4752 | 0.4786 | 0.5046 | 0.5062 | 0.5282 | 0.5360 | 0.4981 | |
| Lanzhou | 0.4880 | 0.4886 | 0.4832 | 0.4898 | 0.5009 | 0.5223 | 0.5280 | 0.5001 | |
| Nanning | 0.5504 | 0.5374 | 0.5488 | 0.5484 | 0.5555 | 0.5812 | 0.6002 | 0.5603 | |
| Urumqi | 0.5407 | 0.5158 | 0.5110 | 0.5190 | 0.5315 | 0.5422 | 0.5501 | 0.5300 | |
| Xi’an | 0.5614 | 0.5588 | 0.5558 | 0.5571 | 0.5815 | 0.6132 | 0.6122 | 0.5771 | |
| Xining | 0.4737 | 0.4771 | 0.4821 | 0.4960 | 0.5096 | 0.5292 | 0.5383 | 0.5009 | |
| Yinchuan | 0.4992 | 0.5022 | 0.5046 | 0.4210 | 0.4310 | 0.5323 | 0.5455 | 0.4908 | |
| Northeastern | Changchun | 0.5326 | 0.5436 | 0.5291 | 0.5346 | 0.5413 | 0.5742 | 0.6044 | 0.5514 |
| Harbin | 0.5311 | 0.5376 | 0.5417 | 0.5465 | 0.5519 | 0.5528 | 0.5568 | 0.5455 | |
| Shenyang | 0.5678 | 0.5727 | 0.5780 | 0.5834 | 0.6070 | 0.7362 | 1 | 0.6636 |
Table 3.
Meta-frontier technology gaps of the 30 provincial capital cities.
| City | 2011 | 2012 | 2013 | 2014 | 2015 | 2016 | 2017 | Average | |
|---|---|---|---|---|---|---|---|---|---|
| Eastern | Beijing | 1 | 1 | 1 | 1 | 1 | 1 | 1 | 1 |
| Fuzhou | 0.9858 | 0.9827 | 0.9676 | 0.9592 | 0.9584 | 0.9614 | 0.9598 | 0.9678 | |
| Guangzhou | 1 | 1 | 1 | 1 | 1 | 1 | 1 | 1 | |
| Haikou | 1 | 0.7868 | 1 | 1 | 1 | 0.9935 | 1 | 0.9686 | |
| Hangzhou | 0.9999 | 0.9985 | 0.9984 | 0.9958 | 0.9984 | 0.8897 | 0.7941 | 0.9535 | |
| Jinan | 1 | 1 | 0.9972 | 0.9929 | 0.9891 | 0.9934 | 0.9981 | 0.9958 | |
| Nanjing | 0.9891 | 0.9893 | 0.9804 | 0.9816 | 0.9883 | 0.9986 | 1 | 0.9896 | |
| Shanghai | 1 | 1 | 1 | 1 | 1 | 0.6904 | 1 | 0.9558 | |
| Shijiazhuang | 0.9786 | 0.9744 | 0.9698 | 0.9669 | 0.9652 | 0.9662 | 0.8509 | 0.9531 | |
| Tianjin | 0.9909 | 0.9895 | 0.9889 | 0.9842 | 0.9875 | 0.9298 | 0.6349 | 0.9294 | |
| Central | Changsha | 0.6232 | 0.6546 | 0.6622 | 0.8677 | 0.9801 | 1 | 1 | 0.8268 |
| Hefei | 0.9242 | 0.9230 | 0.9112 | 0.9316 | 0.9535 | 0.9411 | 0.9450 | 0.9328 | |
| Nanchang | 0.8691 | 0.8875 | 0.9202 | 0.9322 | 0.9410 | 0.9593 | 0.9633 | 0.9247 | |
| Taiyuan | 0.8327 | 0.8240 | 0.8293 | 0.8269 | 0.8409 | 0.8421 | 0.5797 | 0.7965 | |
| Wuhan | 0.7982 | 0.8574 | 0.9223 | 0.9391 | 0.9498 | 0.6132 | 0.7655 | 0.8351 | |
| Zhengzhou | 0.8350 | 0.8575 | 0.9097 | 0.9274 | 0.9438 | 0.9609 | 0.9574 | 0.9131 | |
| Western | Chengdu | 0.7116 | 0.5961 | 0.7401 | 0.6071 | 0.6243 | 0.6455 | 0.6663 | 0.6559 |
| Chongqing | 0.8409 | 0.8281 | 0.8323 | 0.8373 | 0.8419 | 0.6809 | 0.5771 | 0.7769 | |
| Guiyang | 0.8048 | 0.7724 | 0.8201 | 0.8320 | 0.8308 | 0.8111 | 0.8000 | 0.8102 | |
| Hohhot | 0.5737 | 0.5770 | 0.7257 | 0.7753 | 0.6097 | 0.6769 | 1 | 0.7055 | |
| Kunming | 0.7865 | 0.7961 | 0.7990 | 0.7791 | 0.7734 | 0.7371 | 0.7281 | 0.7713 | |
| Lanzhou | 0.8066 | 0.8269 | 0.8130 | 0.8245 | 0.8237 | 0.7697 | 0.5280 | 0.7703 | |
| Nanning | 0.8626 | 0.8354 | 0.8392 | 0.8401 | 0.8087 | 0.6907 | 0.6002 | 0.7824 | |
| Urumqi | 0.5407 | 0.7783 | 0.7786 | 0.7984 | 0.7248 | 0.5802 | 0.6094 | 0.6872 | |
| Xi’an | 0.8985 | 0.8692 | 0.8681 | 0.8388 | 0.7946 | 0.6132 | 0.6122 | 0.7849 | |
| Xining | 0.8080 | 0.8230 | 0.8385 | 0.8484 | 0.8534 | 0.8029 | 0.7755 | 0.8214 | |
| Yinchuan | 0.8479 | 0.8542 | 0.8539 | 0.7465 | 0.7556 | 0.7989 | 0.7536 | 0.8015 | |
| Northeastern | Changchun | 0.8668 | 0.8374 | 0.8265 | 0.8319 | 0.8334 | 0.6999 | 0.6044 | 0.7858 |
| Harbin | 0.8964 | 0.8849 | 0.8824 | 0.8909 | 0.8751 | 0.8606 | 0.8368 | 0.8753 | |
| Shenyang | 0.8360 | 0.8252 | 0.8380 | 0.8397 | 0.8323 | 0.8484 | 1 | 0.8599 |
Table 4.
Grouped frontier benchmarks for different cities in 2017.
| City | Benchmark (Lambda Value) | Return-to-Scale | |
|---|---|---|---|
| Eastern | Beijing | Guangzhou 2017 (1.1154); Haikou 2017 (1.2486) | DRS |
| Fuzhou | Guangzhou 2017 (0.2064); Haikou 2017 (1.4046); Hangzhou 2017 (0.0612) | DRS | |
| Guangzhou | Guangzhou 2017 (1.0000) | CRS | |
| Haikou | Haikou 2017 (1.0000) | CRS | |
| Hangzhou | Hangzhou 2017 (1.0000) | CRS | |
| Jinan | Guangzhou 2017 (0.3742); Haikou 2017 (0.1539) | IRS | |
| Nanjing | Guangzhou 2017 (0.4545); Haikou 2017 (1.0524) | DRS | |
| Shanghai | Shanghai 2017 (1.0000) | CRS | |
| Shijiazhuang | Guangzhou 2017 (0.0148); Tianjin 2017 (0.3219) | IRS | |
| Tianjin | Tianjin 2017 (1.0000) | CRS | |
| Central | Changsha | Changsha 2017 (1.0000) | CRS |
| Hefei | Changsha 2017 (0.6459) | IRS | |
| Nanchang | Changsha 2017 (0.6759) | IRS | |
| Taiyuan | Taiyuan 2017 (1.0000) | CRS | |
| Wuhan | Changsha 2012 (0.2622); Changsha 2016 (0.7265); Wuhan 2016 (0.2780) | DRS | |
| Zhengzhou | Changsha 2017 (1.0007) | DRS | |
| Western | Chengdu | Chengdu 2017 (1.0000) | CRS |
| Chongqing | Chongqing 2017 (1.0000) | CRS | |
| Guiyang | Chengdu 2017 (0.1077); Nanning 2017 (0.4570) | IRS | |
| Hohhot | Hohhot 2017 (1.0000) | CRS | |
| Kunming | Chengdu 2014 (0.2024); Chengdu 2017 (0.0360); Nanning 2017 (0.5896) | IRS | |
| Lanzhou | Lanzhou 2017 (1.0000) | CRS | |
| Nanning | Nanning 2017 (1.0000) | CRS | |
| Urumqi | Chengdu 2014 (0.1984); Chongqing 2017 (0.0079); Hohhot 2015 (0.1350); Hohhot 2017 (0.2345) | IRS | |
| Xi’an | Xi’an 2017 (1.0000) | CRS | |
| Xining | Chongqing 2017(0.0581); Nanning 2017(0.1102) | IRS | |
| Yinchuan | Chongqing 2017 (0.0853); Hohhot 2017(0.0195) | IRS | |
| Northeastern | Changchun | Changchun 2017 (1.0000) | CRS |
| Harbin | Changchun 2017 (0.7901); Shenyang 2017 (0.2092) | IRS | |
| Shenyang | Shenyang 2017 (1.0000) | CRS |
© 2020 by the authors. Licensee MDPI, Basel, Switzerland. This article is an open access article distributed under the terms and conditions of the Creative Commons Attribution (CC BY) license (http://creativecommons.org/licenses/by/4.0/).
Share and Cite
MDPI and ACS Style
Choi, Y.; Yang, F.; Lee, H. On the Unbalanced Atmospheric Environmental Performance of Major Cities in China. Sustainability 2020, 12, 5391. https://doi.org/10.3390/su12135391
AMA Style
Choi Y, Yang F, Lee H. On the Unbalanced Atmospheric Environmental Performance of Major Cities in China. Sustainability. 2020; 12(13):5391. https://doi.org/10.3390/su12135391
Chicago/Turabian StyleChoi, Yongrok, Fan Yang, and Hyoungsuk Lee. 2020. "On the Unbalanced Atmospheric Environmental Performance of Major Cities in China" Sustainability 12, no. 13: 5391. https://doi.org/10.3390/su12135391
Note that from the first issue of 2016, this journal uses article numbers instead of page numbers. See further details here.