Research on User Influence Model Integrating Personality Traits under Strong Connection

1
Department of Modern Business Research Center, Zhejiang Gongshang University, Hangzhou 310018, China
2
School of Management Science & Engineering, Zhejiang Gongshang University, Hangzhou 310018, China
*
Author to whom correspondence should be addressed.
Sustainability 2020, 12(6), 2217; https://doi.org/10.3390/su12062217
Submission received: 19 February 2020
/
Revised: 9 March 2020
/
Accepted: 10 March 2020
/
Published: 12 March 2020
(This article belongs to the Special Issue Online Reputation and Sustainability)
Abstract
:User influence has always been a major topic in the field of social networking. At present, most of the research focuses on three aspects: topological structure, social-behavioral dimension, and topic dimension and most of them ignore the difference between the audience. These models do not consider the impact of personality differences on user influences. To meet this need, this paper introduces the personality traits factor and proposes a user influence model which integrates personality traits (IPUIM) under a strong connection. The user influence measurement is constructed through the information dimension, structural dimension, and user behavioral dimension. The personality report of the user group is obtained by means of NEO-PI-R (The big five personality inventory, Chinese edition) and machine learning method, and it is integrated into the user influence model. The experiment proves that the model proposed in this paper has good accuracy and applicability in measuring user influence, and can effectively identify the key opinion leaders of different personality trait clusters.
1. Introduction
With the rapid development of online social networks, social software plays an important role in our daily life and work. Social software produces massive data, which provides good conditions for social network research. According to “WeChat Data Report 2017”, WeChat’s DAU (Daily Active User) has reached 900 million. In December 2018, Weibo announced at the Influences Summit that Weibo’s DAU hit more than 200 million. These apps can be divided into two categories according to the strength of social relations [1]. One is weak-tie social software, such as micro-blog and forum. Weak ties are helpful for disseminating information [2] and applying for jobs [1]. The other is strong-tie social software, such as WeChat and QQ. A strong connection has more emotional support [3] and economic value [4].
User influence proposed by Katz and Lazarsfeld means that the individual’s behavior and thoughts are influenced by others [5]. Influence plays a vital role in daily life and decision-making, and mainly works in information dissemination [6], link prediction [7], opinion leader mining [8], and advertising [9]. As the mainstream social software in China, WeChat is a popular platform for users to share information, express themselves, and show their individuality. The user influence of WeChat Moments can also be measured from three aspects: topology, status information, and social behavior. Most of the current influence models only focus on one certain dimension, so the applicability of the model is low. For example, the influence model based on topology only focuses on the nodes and the relationship between nodes, and there is a big difference between the actual information dissemination modes. Therefore, some scholars have proposed to link the influence model with some instances. Some scholars have introduced factors such as emotion [10] and topic clustering [11] to improve the model. We reviewed the current research status of personality traits from the perspectives of personality trait language-behavior feature analysis and personality trait assessment. Human behavior is largely influenced by personality traits. However, there are relatively few related studies about influence model introducing personality factors, the individualization is not fully considered. In daily life, due to other people’s evaluation, social identity, personal likes and dislikes, the influence of the same user on different traits audience varies. The integration of personality traits fully considers the effect of individualized differences on user influence and has an important significance for accurately measuring user influence, which is helpful to opinion leader mining and link prediction.
Therefore, in this paper, we advise a user influence measurement model that incorporates the personality traits to measure the user influence of different trait audience clusters. There are three major steps in building this model: crawling the data of moments, obtaining the personality trait report, and measuring the user influence. After experimenting with WeChat’s dataset, the results show that our method has better accuracy than the other three methods of influence measurement. The main contributions of this paper are as follows:
- In the literature review, we combed the relevant literature on the measurement of personality traits and related literature on influence measurement, providing a solid foundation for the experiment.
- We have integrated three methods of influence measurement to obtain effective basic influences, including information perspective, structural perspective, and behavioral perspective.
- Taking into account the personality differences of the influencers and the audience can improve the accuracy of the influence measurement, which helps obtain the opinion leaders of different traits audiences more accurately. These results will be demonstrated in Section 5.
The rest of the paper is arranged as follows. In Section 2, the relevant literature is reviewed. In Section 3, we describe the influence measurement model that incorporates personality traits. Introducing the method of obtaining personality traits report and the formula for calculating user influence in Section 4. In Section 5, we show our approach to the moments dataset and compare it with other approaches. Finally, we summarize the paper and discuss future works in Section 6.
2. Related Works
2.1. Personality Traits Theory
There are many genres of personality traits theory, among which the Big Five Personality Model is the most widely used. It is described as follows [12]:
Agreeableness (A): Trust, altruism, willingness to help others, etc. High scorers are helpful, tolerant, and good-tempered; low scorers are suspicious, ruthless, and mean.
Conscientiousness (C): Responsibility, self-discipline, rigorous, etc. High scorers are serious, diligent, and responsible, and have a strong sense of time; low scorers are sloppy, disorderly, and have a poor sense of time.
Extroversion (E): Keen on social interaction, optimistic, and active, adventurous, etc. Higher scorers are sociable, talkative, and expressing themselves explicitly, while lower scorers are isolated, uncooperative, and unable to express their feelings.
Neuroticism (N): Anxiety, depression, strong self-awareness, psychological fragility, etc. The high scorers are irascible, insecure, and emotional; the low scorers are calm, rational.
Openness (O): dreamer, rich feelings, strong creative ability, etc. The high scorers are keen on imagination and explore variability; the low scorer is stereotyped, stubborn.
2.2. Influence Theory
1. Influence theory based on the topological structure
Freeman describes the importance of nodes in the network from absolute metrics, relative metrics, and network concentration, and constructs an influence measurement model [13]. Newman proposes the betweenness centrality as a measurement of the node influence on information dissemination [14].
2. Influence theory based on user behavior
Yang and Leskovec propose to focus on people’s social behavior, and build a linear influence measurement model based on it [15]. Romero et al. propose to cut in from the perspective of user interaction behavior, with interactive behaviors such as forwarding, likes, @, comments, etc., as a supplement to the influence measurement [6].
3. Influence theory based on status information
Among them, the topic-based influence measurement is the most mature. Cui et al. find that the influence of the same topic on users is different from person to person. Based on this, they design an influence model according to status information, users, and the relationship between them [16]. Basave et al. find that adding information dimension to influence calculation through text mining and other information analysis methods can effectively improve the accuracy of the model [17].
3. User Influence Model Integrating Personality Traits (IPUIM)
3.1. Definition
Definition 1.
(User U) A collection of users who have registered a unique account on WeChat which can be expressed as , where n is the total number of users.
Definition 2.
(Social network G) An undirected graph in which a WeChat user is a node and a social friend relationship is drawn. Where denotes the shortest path number between node i and node j, denotes the number of nodes k passing through the shortest path, denotes node k, denotes the number of associations of other nodes except node k, d(i, j) represents the shortest path length of node i and node j.
Definition 3.
(Status dataset and interactive data) M is a set of status updated by the collected users, whererefers to the number of statuses updated by user i..pic,. media,. URL represents the number of pictures, short videos, and links. Besides, we use com(i) represents the number of comments received by user i, com(i, k) represents the number of comments from user k @user i, represents the number of likes user i received and like(i, k) represents the number of like from user k to user i.
Definition 4.
(Activity area label i.theme) Activity area label refers to the identification of status content, labeling the status of user i according to keywords, and classifying labels into 8 categories: work, diet, shopping, travel, sports, entertainment, daily life, and others.
Definition 5.
(Basic user influence influence (i, k)) User influence is the ability of individuals to influence others on psychology and behavior in the process of information sharing and interaction. In view of the particularity of moments, we measure the user influence from behavioral dimension Behavior(i, k), information dimension Information (i, k), and structural dimension Struction (i, k).
Definition 6.
(Trait cluster UA, UC, UE, UN, UO) Trait cluster refers to users who represent the same type of personality in the personality trait test results. According to Big Five personality, trait set T can be divided into five categories: openness, extroversion, agreeableness, conscientiousness, and neuroticism. Open clusters can be expressed asUO ={, extroversion cluster UE, agreeableness cluster UA, conscientiousness cluster UC, and neuroticism cluster UN.
Definition 7.
(Personality trait result) The report of a personality trait test consists of five percentages, corresponding to agree ableness, conscientiousness, extroversion, neuroticism, openness. Personality is complex, we propose that everyone has a representative personality and four subsidiary personalities. Eg: User i’s test results are,,,and. Ifis the maximum, then the representative personality is agreeableness A.
3.2. Establishing Model
The experimental process of User Influence Model Integrating Personality Traits (IPUIM) mainly includes data crawling, data preprocessing, status word segmentation processing, constructing feature vector and prediction model, personality assessment, user influence calculation, which is shown in Figure 1.
4. Method of User Influence Measurement
4.1. Personality Traits Assessment
Due to the limitations and subjectivity of NEO-PI-R, in recent years, scholars have proposed machine learning for personality assessment based on textual analysis. Yaekoni obtained the dataset from blogs and found systematic linkages between personality and differences in vocabulary using, Furthermore, he emphasized the value of complementary methods in the study of personality assessment [18]. We crawled the cache database, obtained the social behavior dataset, and assessed some users’ traits by NEO-PI-R, then we used the LIWC dictionary (LIWC, Linguistic Inquiry and Word Count, Which is the text analysis tool based on word measurement in Chinese) to construct feature vectors, refer to Tandera et al. [19], selected the prediction model with the best index to assess the rest of the users. The personality traits prediction flow is shown in Figure 2.
4.2. User Influence Integrating Personality Traits Measurement
Different from the openness of Weibo, WeChat Moments attach great importance to privacy, the interaction behaviors are not visible to non-common friends [20]. Therefore, in the process of data crawling, there is no interaction information of non-mutual friends. To this end, we focus on the interaction behavior between mutual friends, combine the information dimension and structural dimension to measure the basic user influence, and construct a multi-dimensional influence measurement model that is suitable for WeChat. The IPUIM calculation process is shown in Figure 3.
1. Influence on the structural dimension
Generally, influence measurement is based on topological structure, such as node degree, shortest path, and random walk. The higher the node value, the greater the influence, because it maps to the social network to represent a high pass rate. In this paper, betweenness centrality [13] and degree centrality [21] are used to measure the influence of structural dimension.* represents point multiplication.
Betweenness centrality is calculated as Equation (1) shows:
Degree centrality is calculated as Equation (2) shows:
This is an example of an equation:
2. Influence on information dimension
Li et al. find that the form, quality, and classification of information can improve the user influence measurement model and have better accuracy [22]. Vexliard et al. show that user convergence trends will affect user interaction behavior [23]. Therefore, this paper chooses the forms of status expression and topic similarity as the measurement method of the influence on the information dimension.
The form of status expression is calculated as Equation (4) shows:
Topic similarity is calculated as Equation (5) shows:
The influence of information dimension is calculated as Equation (6) shows:
Information(i, k)= Type(k). ∗ Sim(i, k).
3. Influence on the behavioral dimension
According to the strong–weak relationship theory [1], a relationship can judge from interaction frequency, intimacy, and reciprocity. According to Cha et al. [24], user influence can be measured in terms of mutual familiarity and reciprocity. This paper chooses interactive activities and reciprocal behaviors based on the comments and likes in WeChat Moments.
Interaction frequency is calculated as Equation (7):
Reciprocity is calculated as Equation (8):
The influence on behavioral dimension is calculated as Equation (9):
Behavior(i, k) = Inter (i, k). ∗ Rec(i, k).
4. User influence integrating personality traits measurement
According to the literature [25], it is assumed that the information dimension, structural dimension, behavioral dimension, and user influence are linearly related. So the influence of user k on i can be represented as Equation (10), where α + β + γ = 1, α, β, γ are determined by the entropy weight method:
Influence(i, k) = α Struction(i, k) + β Information(i, k) + γ Behavior(i, k).
According to the characteristics of the composite personality, we proposed that the influence integrating personality traits measurement are determined by the percent of the status publisher’s representative personality and the percent of the audience’s corresponding personality (eg: The status publisher’s representative personality is E, his percent of representative personality is , the percent of audience’s corresponding personality is ). Therefore, according to whether they belong to the same type of representative traits, they can be divided into similar cluster influence and different cluster influence, as shown in Equations (11) and (12).
Similar cluster influence (user i is status publisher, user j is audience):
Different cluster influence (user i is status publisher, user k is audience):
Combining a similar cluster influence with different cluster influences, we can get the influence matrix.
5. Experiments
5.1. Data Acquisition
This paper selects 10 WeChat users who come from five trait clusters as the seed nodes voluntarily roots their mobile phones, crawls the data of the cache file in their mobile phone, obtains the logged-in user’s moments, and collects user ID, nickname, status content, comment content, reviewer ID, likes, clicker ID, status display form, and timestamp. Finally, we get 3161 users’ information, 36,799 moments status updated in July 2018. In order to ensure that the collected data can predict the user’s personality traits precisely, we set a threshold of the minimum activity number 30 to filter the moments dataset. The final number of involved users is 562, the amount of status is 22,904, the sum of comments is 11967, and the number of likes is 9920. The collected moments samples are shown in Table 1. The first row in Table 1 represents the information publisher ID. The second row in Table 1 represents the information publishers’ names. The third row in Table 1 shows the text content of the information published by the author. The fourth row in Table 1 shows the thumb up information, including the name and ID of the thumb up user, and so on. The fifth line in Table 1 represents the comment information, including the name, ID, and comment text of the comment user. Line 6 in Table 1 represents the timestamp for this information to be published.
5.2. Personality Report Of User Group
Nowadays, the main personality prediction method relies on the LIWC dictionary, which is based on the user dataset, extracts the user’s linguistic and behavioral characteristics, obtains the feature vectors, and constructs the prediction model. There are three methods to obtain user personality data: self-report, API direct access, and open datasets. Since WeChat does not have an API interface or open dataset for personality, we issue NEO-PI-R to some users to get their personality data. A total of 158 reports are recovered. After removing the users who do not meet the threshold of minimum activities number, 56 valid reports are finally obtained. Personality assessment prediction can be divided into three steps:
Step1: Language feature vectors can be obtained by WeChat V3.0. Behavior feature vectors are constructed based on the number of statuses, the number of media, and the number of comments. Combining the language feature vectors with behavior feature vectors, we can get the feature vectors which are used for personality assessment prediction. Normalizing the NEO-PI-R personality report and feature vectors to avoid the influence of different dimensions on the data analysis.
Step2: Using the Pearson correlation coefficient to represent the correlation between personality assessment score and user’s feature vectors, and the threshold is set to 0.2 to exclude irrelevant and extremely weak correlation eigenvalues. Comparing the correlation features in literature [18,26,27], we screen the common correlation features, make a redundancy test for selected features by Pearson correlation coefficient, and construct the initial correlation feature matrix.
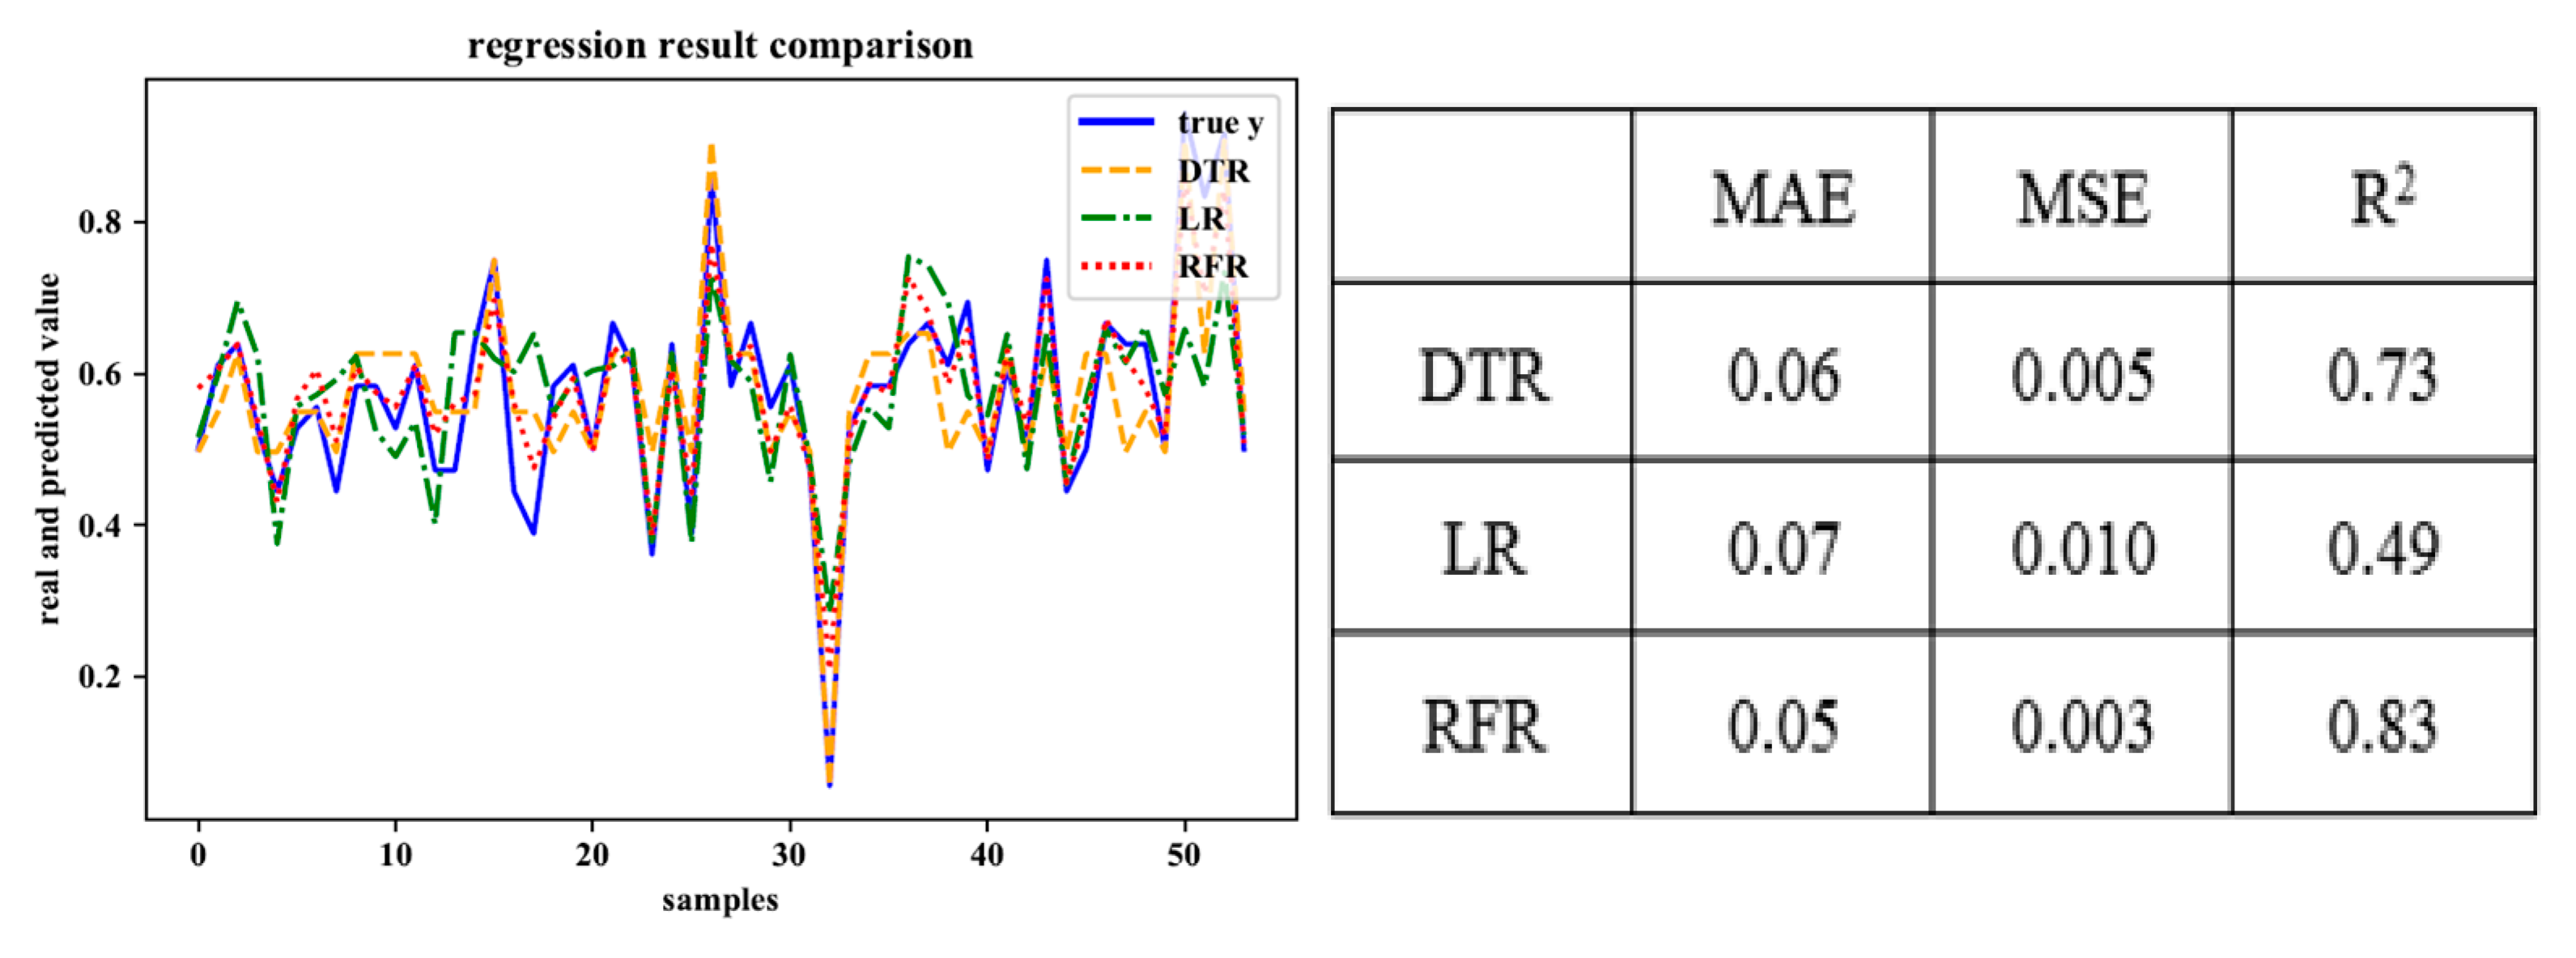
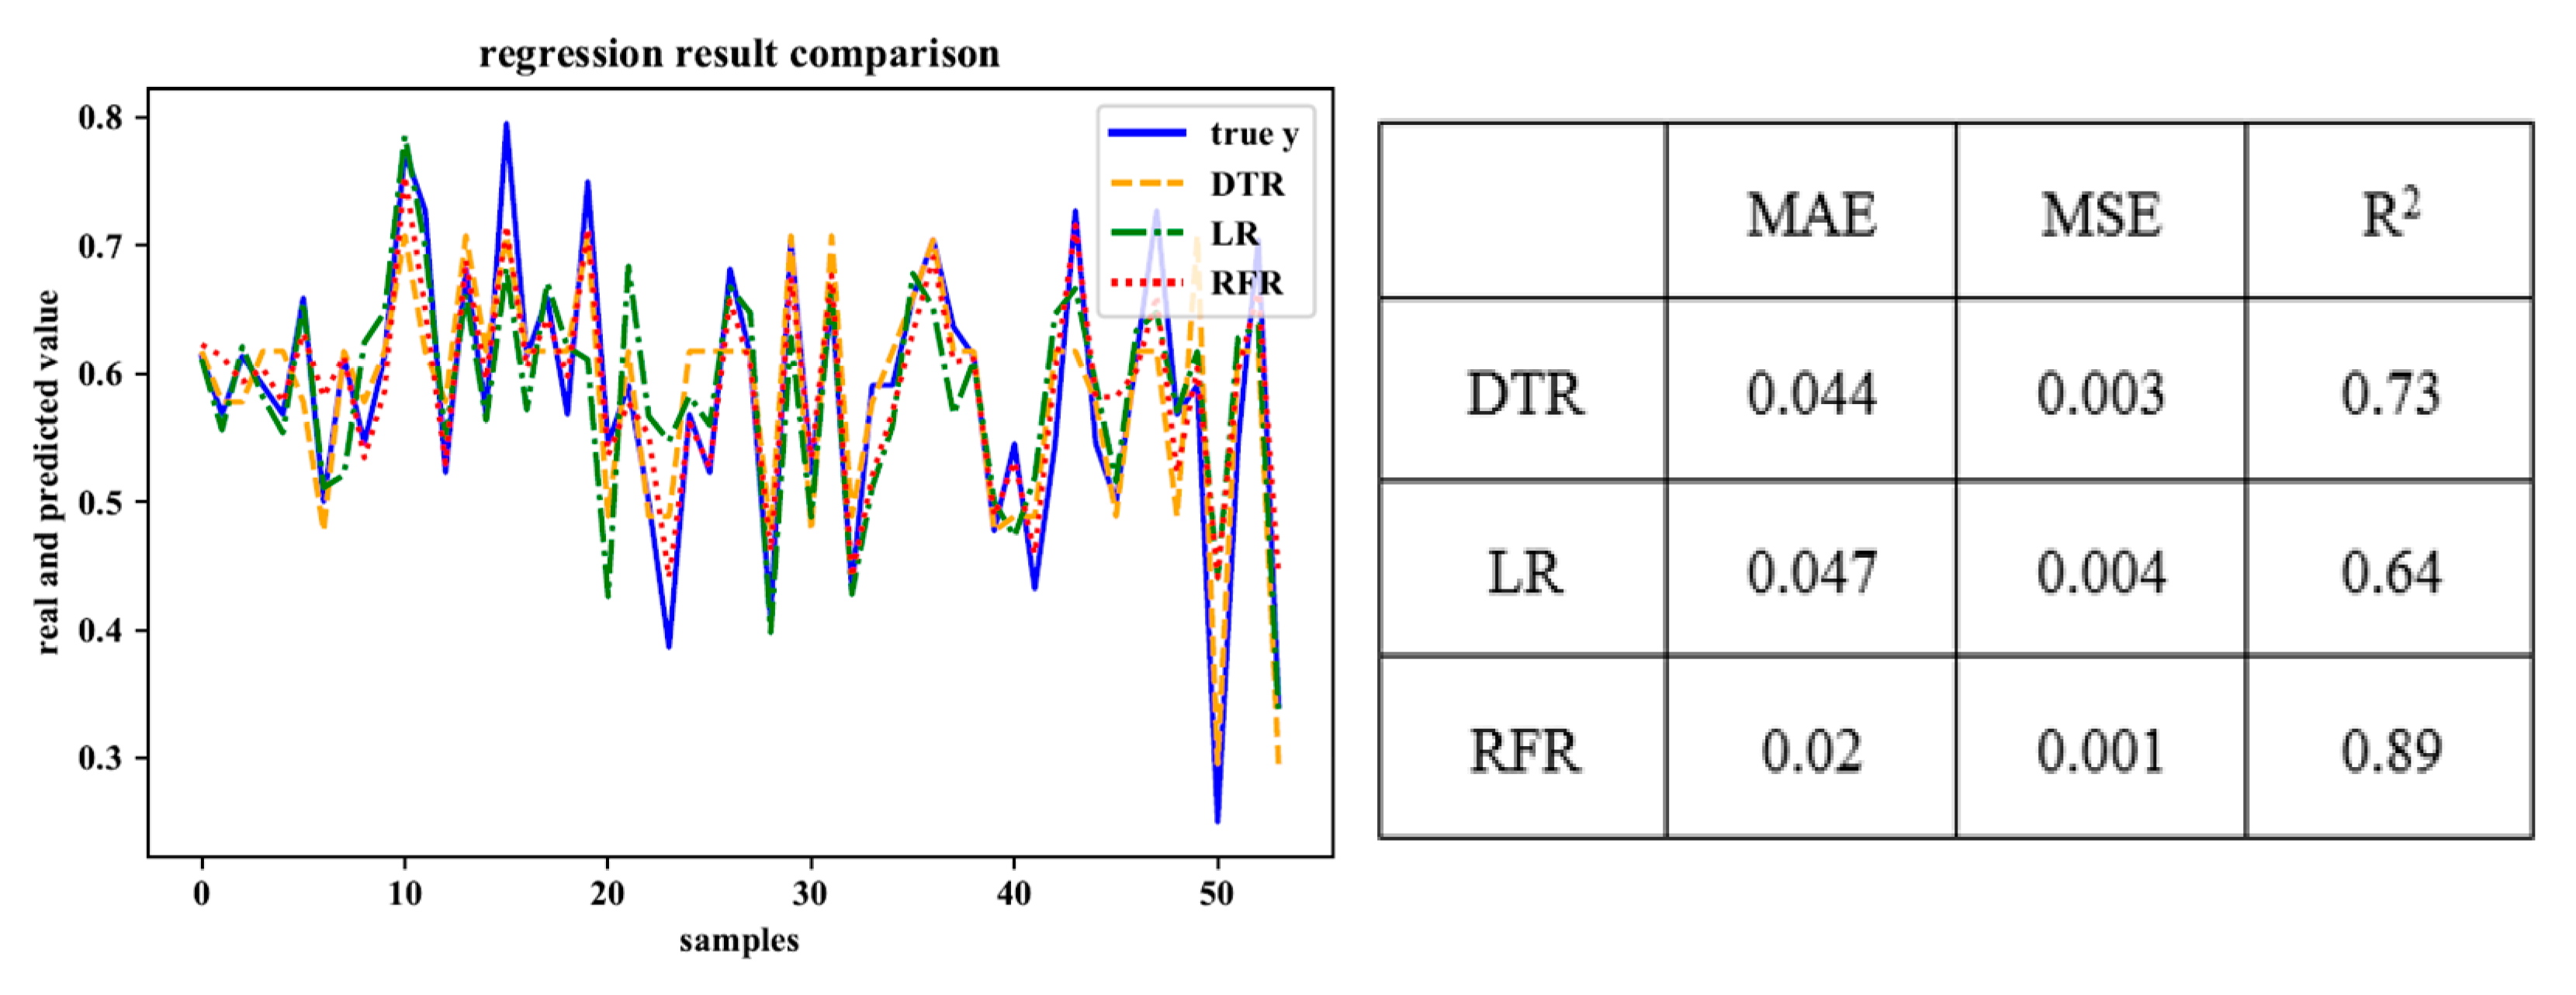
Step3: Setting the language-behavior characteristics as independent variables, user personality traits as dependent variables, we conduct the model-fitting analysis. In order to prevent over-fitting, we control the number of features and use 10 fold cross-validation. Then we compare the prediction of three regression prediction models: multiple linear regression (LR), decision tree regression (DTR), and random forest regression (RFR) with comprehensive indicators and select the best fitting model to complete the personality traits evaluation of the remaining users.
As shown in Figure 4, Figure 5, Figure 6, Figure 7 and Figure 8, the fitting effects of the three models can be roughly seen.
We refer to the three indicators listed in [28], mean absolute error (MAE), mean square error (MSE), and determination coefficient (R2), and use them as evaluation indicators of fitting results. The first two belong to the prediction error index, which is expected to have a smaller value, while R2 belongs to the prediction correlation index which is expected to have a larger value. Finally, we choose RFR as the prediction model to complete the personality traits evaluation of the remaining users.
5.3. Experimental Verification Analysis on IPUIM
5.3.1. Contrast Model and Index Selection
In order to validate the validity and accuracy of the IPUIM, we compare it with the three kinds of influence measurement models, exploit repetition rate, ranking accuracy, and recall rate to evaluate the result of user influence measurement. Three selected influence measurement models are betweenness centrality, author popularity, user influence evaluation method based on topic and node attributes (UIEM). WeChat does not have a status forwarding jump mechanism, so we use betweenness centrality as a measure of influence based on a structural perspective. Betweenness centrality is the most classical structural measurement used to find the influencers in the social network [13], as shown in Equation (1). UIEM is a measurement model based on social convergence theory, which shows that users are more inclined to interact with people similar to themselves [28], we adjusted it to fit WeChat Moments. Author popularity is a common approach that can identify the opinion leaders based on the interaction between visitors and authors [29], as shown in Equation (13):
where cr is the number of comments and likes, cp is the number of status publications. T is 31 days for the dataset that was collected in the whole month of July.
The selected evaluation indicators are listed below. The repetition rate can evaluate the degree of differentiation of different user influence, as shown in Equation (14). The smaller the repetition rate, the higher the model validity and the higher the discrimination of influence. In Equation (14), represents the total number of different influence values, and NF represents the total number of influence values:
Precision and recall are used to evaluate the quality of the results. For the evaluation of the results of user influence calculation, precision is expressed by the ratio of the correct number of TOP-k influencers to the number of TOP-k influencers. So ranking precision of user influence is formulated as Equation (15):
denotes the Top-k user set of user influence after manual ranking, denotes the Top-k user set of user influence after experimental ranking. Tk denotes the number of listed Top-k users. This index can show the degree of coincidence between the experimental ranking dataset and the manual ranking dataset. The larger the value, the more accurate the model is.
Recall indicates the ratio of the correct number of TOP-k influencers to the number of manual listed TOP-k influencers. Ranking recall of user influence is formulated as Equation (16):
where Rank Tk is the number of a total manual listed key opinion leader. This indicator reflects the rate at which all key opinion leaders are mined.
5.3.2. Comparison Based on Traits Cluster
According to the indicators listed in Section 5.3.1, we compare the proposed IPUIM with betweenness centrality, author popularity, UIEM. The comparative results are analyzed as follows.
1. Repetition rate verification
The results of the repetition rate calculation are shown in Table 2. We can see from Table 2 that there is a tendency of homogenization in betweenness centrality and author popularity measurement results, and their repetition rate are both more than 40%. IPUIM performs better in repetition rate than the other three measurement model, which shows that IPUIM has better recognition ability for different individuals’ user influence.
2. Precision and Recall Verification
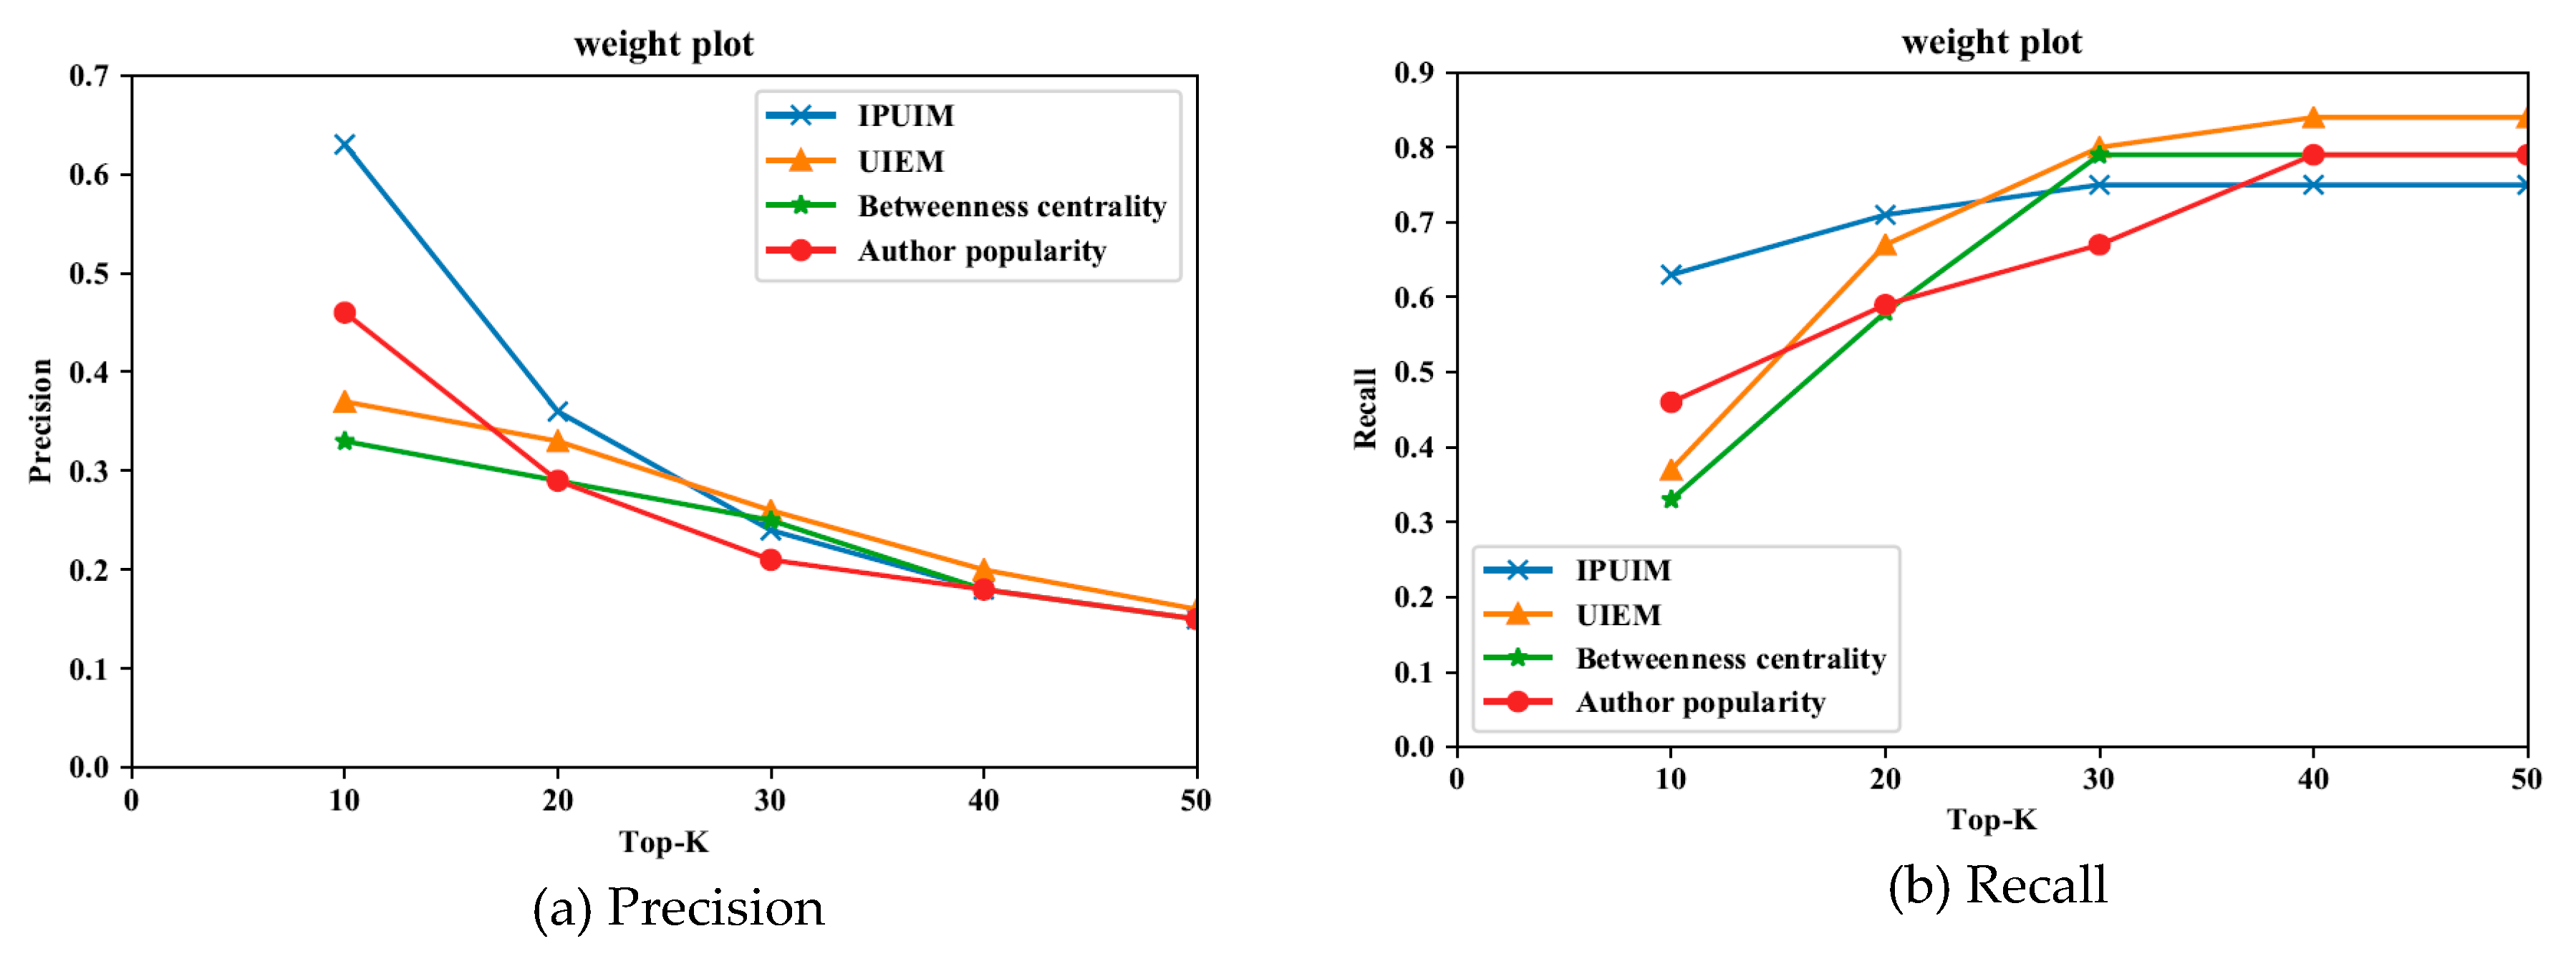
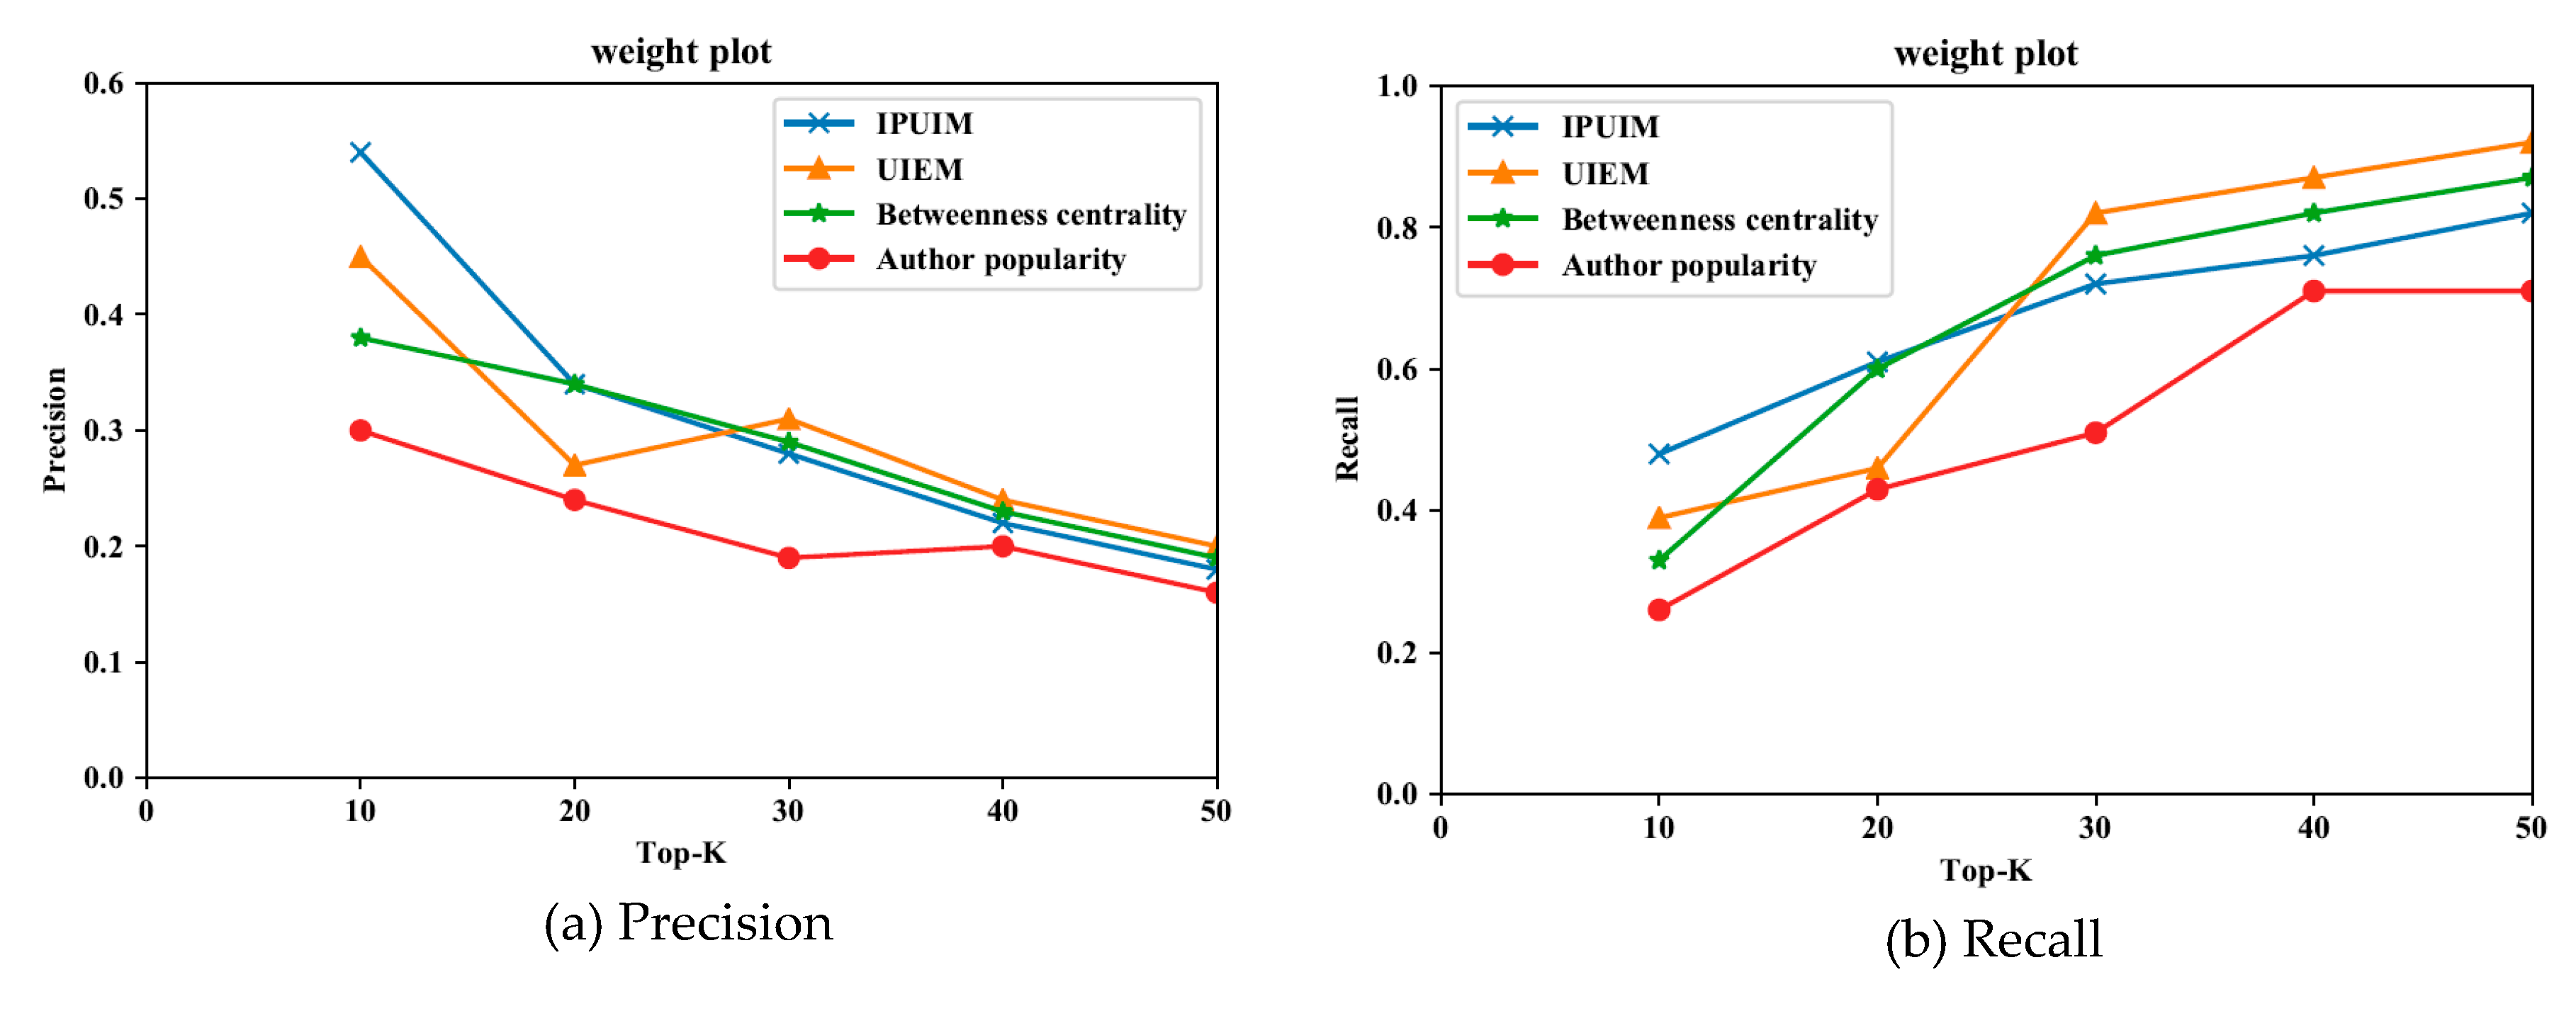
In order to verify the influence of the same user on different audiences, this paper divides the user cluster into five trait clusters according to the representative personality, and compares the precision and recall of different influence models in the personality cluster. We select users with enough links from five personality trait clusters as representatives, which ensures that when they view moments, the number of influencers is sufficient. Subsequently, we invite these users to rate their crawled friends’ influence, the scoring range is 1–10. The higher the score is, the greater the user influence on the scorer. Reference [30] defines the key opinion leader as the user whose influence score is in the top q%, this paper chooses 5%. Finally, our research obtains the scoring result of 2187 relational connections, we verify the four models under top10, 20, 30, 40, 50, compare their precision and recall to evaluate the applicability of models. The precision and recall rates of the four models in different personality trait clusters are obtained by weighted summation of representing users’ key opinion leader mining precision and recall rates. The weight coefficient is determined by , where is the total number of influencers viewed by cluster representatives, is the number of influencers viewed by cluster representatives (user i). The precision and recall rates vary with the number of top-k and are shown in Figure 9, Figure 10, Figure 11, Figure 12 and Figure 13.
According to Figure 9, Figure 10, Figure 11, Figure 12 and Figure 13, we can see that IPUIM performs better than the other three. Besides, we can observe that these models’ precision line become lower and closer between Top-40 and Top-50, because as the number of Top-k increased, fewer and fewer key opinion leaders were found in the unit interval. In other words, with the increment of Top-k, the unit interval’s value density decreases. In addition, in the header Top-k interval, the recall rate of the proposed approach is better than the other three models. Comparing the five pictures above, we can realize the necessity of considering the difference of audience and explore the role of personality traits in user influence.
In addition, we have found some interesting results about personality traits and user influence assessment. Figure 9 and Figure 11 show that precision and recall curves quickly converge, which shows that the role of the personality factor weakens with the increase of Top-k. This phenomenon is somewhat related to the characteristics of A, Ecluster. The high scorers in agreeableness are helpful, tolerant, and good-tempered. Their evaluation of others’ user influence is less affected by personal likes and dislikes. Extroverted people are active and enjoy social activity, when they look for their key opinion leaders, they are less susceptible to personality differences and more inclusive. In Figure 12, we can find that the performance of IPUIM in the N cluster is significantly better than the other three, especially in Top-10 and Top-20 interval, the precision difference is 21% and 18%. This discovery reflects the characteristics of neurotic users such as anxiety depression, impulsiveness, insecurity, and vulnerability to emotions and personal likes and dislikes in the other side. Therefore, when they rate their crawled friends’ influence to find the key opinion leader, personality differences and some emotional factors play an important role in this process.
6. Conclusions and Future Works
In this paper, we present a comprehensive model to calculate the user influence of WeChat status publishers. It comprehensively measures the user influence from three dimensions: structure dimension, behavioral dimension, and information dimension, and realizes the differential measurement of influence due to individual differences by integrating personality traits. We use the complementary method of machine learning and NEO-PI-R to obtain the personality traits report of WeChat users and verify our method on the dataset from WeChat Moments. Comparing with the three user influence measurement model, we exploit repetition rate, ranking accuracy, and recall rate to evaluate the practicability and validity of our approach. This research not only shows the superiority of fusing personality traits and multi-dimensions measurement, but also finds some links between personality traits and user influence assessment. The user clusters are divided into five trait clusters according to the users’ representative personality. We analyzed the manifestation of personality traits in the user influence. Exploring the influence performance of personality traits not only proves the correlation between personality traits and user influence, but also enriches the internal perspective of user influence research, which provides suggestions for exploring the personality traits functionary mechanism and constructing personalized user influence model. We believe that the model proposed in this paper can be widely used in user feature discovery in the social network industry. In our follow-up study, we will conduct experiments with a bigger dataset and focus on both influencer and audience individual factors in the measurement of influence, which can improve the applicability and accuracy of social network impact research. Furthermore, this paper also exposes some research challenges which deserve further discussion. Particularly, those related are as follows:
(1) Explore how to exert the greatest impact on a particular trait cluster, eg: How to help and improve the performance of introverted users and neurotic users.
(2) How to further mine the influence manifestation of introverted users and those who have mild social barriers, and their influence measurement model.
(3) How to measure and differentiate the individual character in the practical application of user influence, such as link prediction, social network information dissemination, commendation systems, and so on.
Author Contributions
Conceptualization, C.J. and F.B.; methodology, C.J., Q.G., Y.F. and F.B.; software, Y.F.; validation, C.J., Q.G., Y.F. and F.B.; formal analysis, F.B.; investigation, Y.F.; data curation, Y.F.; writing—original draft preparation, Q.G., Y.F. and F.B.; writing—review and editing, Q.G. and F.B.; visualization, Q.G.; supervision, F.B.; project administration, F.B.; funding acquisition, C.J. All authors have read and agreed to the published version of the manuscript.
Funding
This research was funded by Zhejiang Provincial Key Project of Philosophy and Social Sciences (Grant No. 16NDJC188YB), Natural Science Foundation of Zhejiang Province (Grant No. LQ20G010002), and the National Science Foundation of China (71571162).
Acknowledgments
The authors also gratefully acknowledge the helpful comments and suggestions of the reviewers and Geyao Li, Yihao Jiang which have improved the presentation.
Conflicts of Interest
The authors declare no conflict of interest.
References
- Granovetter, M.S. The strength of weak ties. In Social Netwks; Elsevier: Amsterdam, The Netherlands, 1973; pp. 347–367. [Google Scholar]
- Granovetter, M. Getting A Job: A Study of Contacts and Careers, 2nd ed.; University of Chicago Press: Chicago, IL, USA, 1994. [Google Scholar]
- Frenzen, J.; Nakamoto, K. Structure, cooperation, and the flow of market information. J. Cons. Res. 1993, 20, 360–375. [Google Scholar] [CrossRef]
- Wellman, B.; Wortley, S. Different strokes from different folks: Community ties and social support. Am. J. Sociol. 1990, 96, 558–588. [Google Scholar] [CrossRef] [Green Version]
- Roshwalb, I. Personal influence: The part played by people in the flow of mass communications. J. Mark. pre-1986 1956, 21, 129. [Google Scholar] [CrossRef]
- Romero, D.M.; Galuba, W.; Asur, S.; Huberman, B.A. Influence and passivity in social media. In Proceedings of the Joint European Conference on Machine Learning and Knowledge Discovery in Databases, Hyderabad, India, 28 March–1 April 2011; pp. 18–33. [Google Scholar]
- Aiello, L.M.; Barrat, A.; Schifanella, R.; Cattuto, C.; Markines, B.; Menczer, F. Friendship prediction and homophily in social media. ACM Trans. Web TWEB 2012, 6, 1–33. [Google Scholar] [CrossRef]
- Tang, J.; Sun, J.; Wang, C.; Yang, Z. Social influence analysis in large-scale networks. In Proceedings of the 15th ACM SIGKDD international conference on Knowledge Discovery and Data Mining, Paris, France, 28 June–1 July 2009; pp. 807–816. [Google Scholar]
- Bakshy, E.; Eckles, D.; Yan, R.; Rosenn, I. Social influence in social advertising: Evidence from field experiments. In Proceedings of the 13th ACM Conference on Electronic Commerce, Valencia, Spain, 4–8 June 2012; pp. 146–161. [Google Scholar]
- Yu, G.; Xiwei, W.; Shimeng, L.; Nan’axue, W. Research on the Influence Model of Social Network Users Based on Emotional Analysis. J. China Soc. Sci. Tech. Inf. 2017, 1139–1147. [Google Scholar]
- Chengcheng, G.; Du Pan, H.M.; Yue, L.; Xueqi, C. Tsk-shell: An algorithm for finding topic-sensitive influential spreaders. J. Comput. Res. Dev. 2017, 54, 361. [Google Scholar]
- McCrae, R.R.; Costa, P.T. The structure of interpersonal traits: Wiggins’s circumplex and the five-factor model. JPSP 1989, 56, 586. [Google Scholar] [CrossRef]
- Freeman, L.C. Centrality in social networks conceptual clarification. Soc. Netw. 1978, 1, 215–239. [Google Scholar] [CrossRef] [Green Version]
- Newman, M.E. A measure of betweenness centrality based on random walks. Soc. Netw. 2005, 27, 39–54. [Google Scholar] [CrossRef] [Green Version]
- Yang, J.; Leskovec, J. Modeling information diffusion in implicit networks. In Proceedings of the 2010 IEEE International Conference on Data Mining, Sydney, Australia, 13–17 December 2010; pp. 599–608. [Google Scholar]
- Cui, P.; Wang, F.; Liu, S.; Ou, M.; Yang, S.; Sun, L. Who should share what? Item-level social influence prediction for users and posts ranking. In Proceedings of the 34th international ACM SIGIR conference on Research and development in Information Retrieval, Beijing, China, 24–28 July 2011; pp. 185–194. [Google Scholar]
- Cano, A.E.; Mazumdar, S.; Ciravegna, F. Social influence analysis in microblogging platforms–a topic-sensitive based approach. Semant. Web 2014, 5, 357–372. [Google Scholar] [CrossRef] [Green Version]
- Yarkoni, T. Personality in 100,000 words: A large-scale analysis of personality and word use among bloggers. J. Res. Personal. 2010, 44, 363–373. [Google Scholar] [CrossRef] [PubMed] [Green Version]
- Tandera, T.; Suhartono, D.; Wongso, R.; Prasetio, Y.L. Personality prediction system from facebook users. Procedia Comput. Sci. 2017, 116, 604–611. [Google Scholar] [CrossRef]
- Guo, X. The Research of Wechat Moments on Interpersonal Communication. Master‘s Thesis, Shandong University, Jinan, China, 2015. [Google Scholar]
- Newman, M.E. The structure and function of complex networks. SIAMR Rev. 2003, 45, 167–256. [Google Scholar] [CrossRef] [Green Version]
- Li, Y.-M.; Lai, C.-Y.; Chen, C.-W. Discovering influencers for marketing in the blogosphere. Inf. Sci. 2011, 181, 5143–5157. [Google Scholar] [CrossRef]
- Vexliard, A. The Peoples Choice. In How the Voter makes up his Mind in a Presidential Campaign; Presses Universitaires de France: Paris, France, 1949; pp. 237–238. [Google Scholar]
- Cha, M.; Haddadi, H.; Benevenuto, F.; Gummadi, K.P. Measuring user influence in twitter: The million follower fallacy. In Proceedings of the Fourth International AAAI Conference on Weblogs and Social Media, Washington, DC, USA, 23–26 May 2010. [Google Scholar]
- Li, Z.; Zhuang, Y. Multidimensional user influence measurement model based on spammer trust punishment. Syst. Eng. Theory Pract. 2017, 37, 1820–1832. [Google Scholar]
- Schwartz, H.A.; Eichstaedt, J.C.; Kern, M.L.; Dziurzynski, L.; Ramones, S.M.; Agrawal, M.; Shah, A.; Kosinski, M.; Stillwell, D.; Seligman, M.E. Personality, gender, and age in the language of social media: The open-vocabulary approach. PLoS ONE 2013, 8, e73791. [Google Scholar] [CrossRef] [PubMed]
- Zhang, L.; Chen, Z.X.; Yang, B. Personality analysis and prediction of social network users. Chin. J. Comput. 2014, 37, 1877–1894. [Google Scholar] [CrossRef]
- Liu, W.; Zhang, M.; Niu, G.; Liu, Y. Weibo user influence evaluation method based on topic and node attributes. In Proceedings of the International Conference on Web Information Systems and Applications, Taiyuan, China, 14–15 September 2018; pp. 382–391. [Google Scholar]
- Mayzlin, D. Promotional chat on the Internet. Mark. Sci. 2006, 25, 155–163. [Google Scholar] [CrossRef] [Green Version]
- Watts, D.J.; Dodds, P.S. Influentials, networks, and public opinion formation. J. Cons. Res. 2007, 34, 441–458. [Google Scholar] [CrossRef]
Figure 1.
The process of IPUIM.

Figure 2.
Personality traits prediction process.

Figure 3.
IPUIM calculation process.

Figure 4.
Fitting results of A cluster.

Figure 5.
Fitting results of C cluster.

Figure 6.
Fitting results of E cluster.

Figure 7.
Fitting results of N cluster.

Figure 8.
Fitting results of O cluster.

Figure 9.
Precision and recall comparisons in A cluster.

Figure 10.
Precision and recall comparisons in C cluster.

Figure 11.
Precision and recall comparisons in E cluster.

Figure 12.
Precision and recall comparisons in N cluster.

Figure 13.
Precision and recall comparisons in O cluster.


Table 1.
Statistical sample table (Part).
| Key | Value | ||
|---|---|---|---|
| Author ID | wxid***hiu11 | ||
| Author Name | In***nd | ||
| Content | Mom, This is Jerry, not rabbit! | ||
| Likes | wxid***zc22, l***bao, wxid***5j21 | ||
| Comments | Id: wxid***5j21 | Name: ***ter | Content: Its ears are so big |
| Id: wxid ***hiu11 | Name: In***nd | Content: Maybe[facepalm] | |
| Id: wxid ***yad22 | Name: 777 | Content:… [Frown] | |
| Timestap | 1531450752 | ||
Table 2.
Repetition rate comparison results.
| Model | IPUIM | UIEM | Betweenness Centrality | Author Popularity |
|---|---|---|---|---|
| Repetition Rate | 1.42% | 29.88% | 41.64% | 68.51% |
© 2020 by the authors. Licensee MDPI, Basel, Switzerland. This article is an open access article distributed under the terms and conditions of the Creative Commons Attribution (CC BY) license (http://creativecommons.org/licenses/by/4.0/).
Share and Cite
MDPI and ACS Style
Ju, C.; Gu, Q.; Fang, Y.; Bao, F. Research on User Influence Model Integrating Personality Traits under Strong Connection. Sustainability 2020, 12, 2217. https://doi.org/10.3390/su12062217
AMA Style
Ju C, Gu Q, Fang Y, Bao F. Research on User Influence Model Integrating Personality Traits under Strong Connection. Sustainability. 2020; 12(6):2217. https://doi.org/10.3390/su12062217
Chicago/Turabian StyleJu, Chunhua, Qiuyang Gu, Yi Fang, and Fuguang Bao. 2020. "Research on User Influence Model Integrating Personality Traits under Strong Connection" Sustainability 12, no. 6: 2217. https://doi.org/10.3390/su12062217
Note that from the first issue of 2016, this journal uses article numbers instead of page numbers. See further details here.