


Dynamic Monitoring of the Ecological Vulnerability for Multi-Type Ecological Functional Areas during 2000–2018
1
School of Architecture and Information Engineering, Shandong Vocational College of Industry, Zibo 256414, China
2
School of Civil Architectural Engineering, Shandong University of Technology, Zibo 255000, China
*
Author to whom correspondence should be addressed.
Sustainability 2022, 14(23), 15987; https://doi.org/10.3390/su142315987
Submission received: 21 October 2022
/
Revised: 24 November 2022
/
Accepted: 28 November 2022
/
Published: 30 November 2022
(This article belongs to the Special Issue Applications of GIS and Remote Sensing for Sustainable Spatial Planning)
Abstract
:Studies that consider both the differences of evaluation systems and index weights among different ecological areas in different study periods for ecological vulnerability evaluation have not been reported yet. In addition, the comparability of vulnerability assessment results among different study areas is poor. This paper proposed a novel quantitative vulnerability evaluation method for multi-type and multi-temporal ecological functional areas using a dynamic weighting method: Three-River Source region grassland–wetland ecological functional area (TRSR), Guiqiandian karst rocky desertification control ecological functional area (GQD), Hunshandake desertification control ecological functional area (HSDK), and Chuandian forest and biodiversity ecological functional area (CD), and then introduced net primary productivity (NPP) to realize the determination of multi-type ecological vulnerability thresholds, which is helpful to compare the vulnerability evaluation results of different ecological functional areas in a unified and comparable level. The proposed novel quantitative vulnerability evaluation method had higher applicability in vulnerability assessment for multi-type ecological functional areas (91.1% for TRSR, 91.9% for HSDK, 91.7% for CD, and 94.2% for GQD) based on the dynamic weight determination method. The determination of vulnerability thresholds based on NPP could provide a comparable level to investigate the spatial distribution patterns of ecological vulnerability in multi-type ecological functional areas for different periods. The average ecological vulnerability of the TRSR, GQD, and CD was classified as mild vulnerability, while that of the HSDK was classified as moderate vulnerability. The research results could provide a novel method for the support of ecological protection for multi-type ecological zones on a national scale.
1. Introduction
The evaluation of the ecological environment vulnerability has become a hot issue in the research of regional environmental evolution and sustainable development under the influence of global climate change [1]. With the rapid developments of the economy, the intensity of the exploitation and utilization of natural resources are also increasing [2]. As a result, the environment of key ecological functional areas in China has been seriously damaged [3]. Especially since the 20th century, with the intensification of environmental problems such as global warming and frequent extreme weather events, loss of species diversity, frequent extreme weather events, and intensified desertification have become increasingly prominent [4]. The comprehensive degradation or even loss of ecological functions poses a great threat to regional and national ecological security, as well as socio-economic sustainable development [5].
Research on ecological vulnerability evaluation that has been conducted both at home and abroad mainly includes two types of index systems: comprehensive index and single index. At present, the pressure–state–response (PSR) models have been widely applied in ecological vulnerability assessment [6]. Zheng [7] analyzed the important factors affecting the vulnerability of the ecosystem in the upper reaches of the Minjiang River and constructed the evaluation index system of the vulnerability of that region based on the SPR model. Zheng et al. [8] constructed a comprehensive index of ecological environment vulnerability to analyze the ecological environment vulnerability characteristics of the Pearl River Delta in different periods based on the pressure–sensitivity–restoration (PSR) model and analytic hierarchy process (AHP). Chang and Cai [9] selected 15 indicators such as elevation, slope, topographic range, and landscape diversity index to evaluate the ecological vulnerability of Poyang County based on the PSR model. A series of studies on ecological vulnerability evaluation and its driving mechanism have also been conducted by many scholars. Adger [10] found that vulnerability was derived from the combined actions of natural and artificial changes in the ecosystems. Liu et al. [11] constructed the ecological vulnerability index in Sanjiang Plain, and then explored the spatial distributions of wetland ecosystem vulnerability. Qiu et al. [12] proposed the ecological vulnerability model of western Hainan Island based on soil erosion index, landscape index, and desertification index, and then determined the dominant factors that affected the ecological vulnerability. Edmonds et al. [13] used the data covering more than 100 countries compiled by the University of Notre Dame in 2016 to construct a new composite climate change vulnerability index. Kantamaneni et al. [14] developed a new Physical Coastal Vulnerability Index (PCVI), and then combined the new Financial Coastal Vulnerability Index (FCVI) to propose a coastal vulnerability composite index. Jin et al. [15] established an indicator system for 23 spatial variables based on the driver–pressure–state–impact–response (DPSIR) framework to calculate the ecological vulnerability index. Chatrabgoun et al. [16] developed a novel mathematical framework to explore the risk and uncertainties associated with frost events and their impacts on yields of vineyards by analyzing the non-linear dependency structure using copula functions as an efficient tool. Goodarzi et al. [17] adopted the developed numerical model to set series of scenario-based simulations in order to investigate the effects of WSP’s geometrical features and implementation of an island retrofitting on the hydraulic performance and treatment efficiency of the WSPs.
During the past decades, scholars have proposed many comprehensive evaluation methods of ecosystem vulnerability, including principal component analysis (PCA) [18,19], AHP, gray correlation method, and entropy weight method. Aspinall and Pearson [20] introduced the theories and technical methods of remote sensing (RS), geographic information science (GIS) and landscape ecology into the field of ecological hydrology to establish the health index system of catchment area, and then systematically evaluated the environmental health and changes at the regional scale. Zheng [21] analyzed the influencing factors of regional ecosystem vulnerability in the upper reaches of Minjiang River and constructed the index system suitable for the ecological evaluation of the study area based on the PSR model, and then analyzed the temporal and spatial change patterns of ecological vulnerability in the study area from multiple angles by using the methods of variation coefficient, gravity center model, and transfer matrix. Fully considering the background characteristics of the ecological environment in the alpine region of the Qinghai–Tibet Plateau, Guo et al. [22] introduced extreme climate factors and human disturbance factors to construct the ecosystem vulnerability evaluation system and reasonably analyzed the temporal and spatial distribution law and driving factors of ecological vulnerability. Zhao [23] analyzed the main causes of ecological vulnerability affecting Central Asia according to the principle of index selection and constructed an index system based on the PSR model. Zhang [24] established the VSD ecological vulnerability evaluation system to analyze the vulnerability status and evolution trend of large-scale (the whole study area) and small-scale (city) areas. Nguyen et al. [25] combined AHP, GIS, and RS to establish a vulnerability assessment framework related to sixteen variables for the largest river system in Vietnam. Zhang et al. [26] constructed the ecological vulnerability index of the Wutai Mountain area based on the PSR model, and then analyzed the spatial and temporal changes in ecological vulnerability of the Wutai Mountain area in four periods by using the PCA, gravity center, and difference analysis methods. Hu et al. [27] used the PSR model to select parameters and used AHP to determine the weights of parameters. In summary, the shortcomings of the above objective methods (such as PCA and entropy weight) were that they could only consider the information of the factor or image itself and ignore the significance of different indicator factors in the ecological vulnerability assessment system. On other hand, the advantage was that these methods could better avoid excessive interference of experts’ subjective consciousness. However, subjective methods (such as AHP and FAHP) could take into account expert experience knowledge in the ecological vulnerability assessment. Although expert experience knowledge is conductive to reflect the significance of different indicators in the vulnerability evaluation system, excessive amplification of expert experience knowledge will interfere with the construction of the index system and the formulation of weights. Net primary productivity (NPP), which is an important index to determine the health status and sustainable development level of ecosystems, can also indicate the sensitivity and vulnerability of regional ecosystems. It is also conducive to the continuous expression of ecological vulnerability in different sub-ecological intervals in space, and it can better confirm the comparability among the vulnerability assessments results of different sub-regions to a certain region.
However, most previous studies were mainly aimed at a single type, and few studies of ecological vulnerability evaluations for multi-type of ecological function zones have been reported yet. In addition, taking into account global changes and human activities, the contribution rate of each factor in the regional ecological vulnerability assessment system changed significantly in different historical periods. Previous studies mostly used the same index weight for vulnerability assessment [28]. Zhang et al. [29] found significant differences in influencing factors and their contribution rates in the ecological degradation of the Yellow River Basin from 1986 to 2013. Zhang et al. [30] proposed an ecological vulnerability evaluation index system reflecting the impact of natural and human stress factors and found that the contribution rates of natural factors to the ecological vulnerability of the Yellow River Basin showed a downward trend from 2001 to 2019. At the same time, due to the differences of the evaluation systems for multi-type ecological functional areas and the index weights in the evaluation system for different historical periods, the ecological vulnerability evaluation results in different ecological areas and historical periods were not comparable. However, fewer studies were conducted to focus on the comparability enhancement of vulnerability assessment results among different study areas. Determining their vulnerability threshold from a scientific standpoint has become a key problem, and it is important to approach this problem in this research field and find solutions to it.
Therefore, this study established the evaluation systems of the TRSR, HSDK, GQD, and CD according to the regional ecological characteristics and proposed the dynamic weight determination method to make the weight assignments for different ecological functional areas and different periods. In addition to that, NPP was introduced to determine the ecological vulnerability thresholds for multi-type ecological functional areas to confirm comparability on a unified level. This proposed novel evaluation method could provide a new approach for the vulnerability assessment for multi-type ecological zones worldwide.
2. Materials and Methods
2.1. Study Area
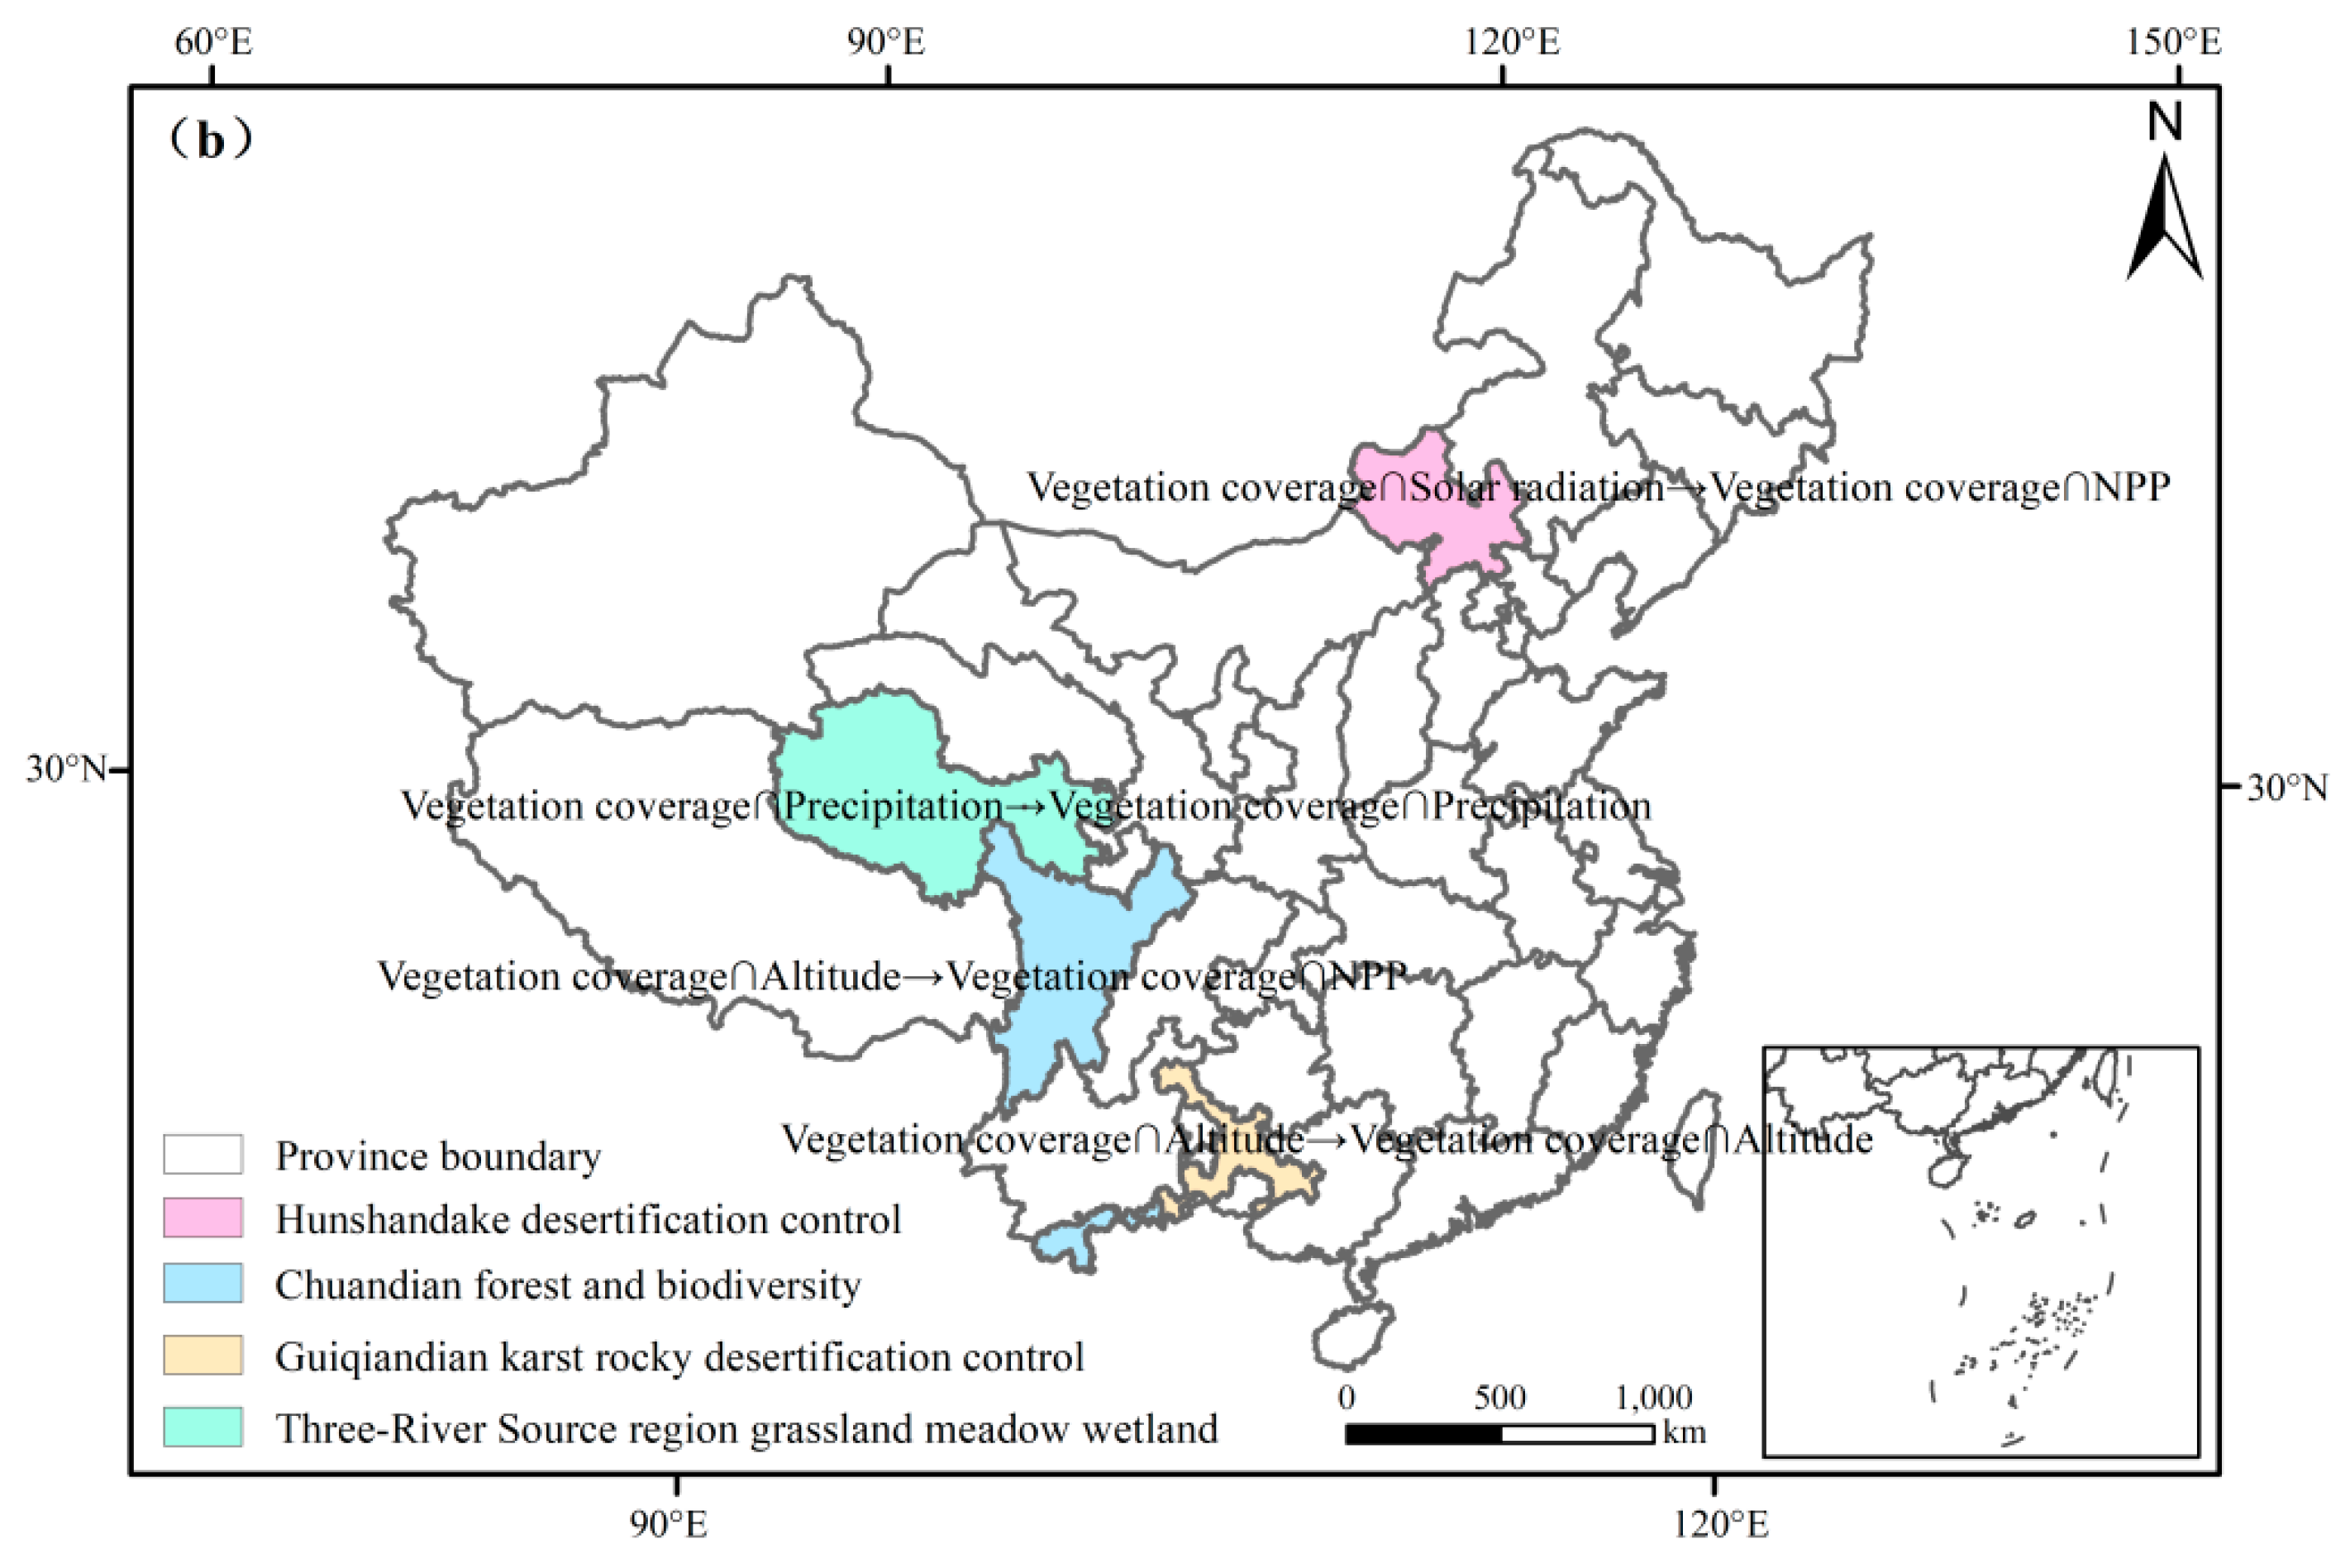
The Three-River Source region grassland–wetland ecological functional area (TRSR) (Figure 1) is located in the southern part of Qinghai Province, at an altitude of 3500–4800 m. The rivers, lakes, and swamps are widely distributed in this region. The climate in this area is typical of that on the Qinghai–Tibet Plateau, which is characterized by distinct dry and wet seasons, long sunshine duration, small annual temperature difference, and larger daily temperature difference. The precipitation is more prevalent in summer, with an average value of 262.2~772.8 mm.
The Hunshandake desertification control ecological functional area (HSDK) is mainly composed of Xilinguole, Inner Mongolia, and Chifeng City, with a total area of 5.3 × 10⁴ km2. Its natural environment belongs to the steppe zone of a temperate semi-arid region, the climate of which is mainly affected by temperate continental monsoons and prevailing west wind. The terrain is sloped downward from southeast to northwest with small fluctuations [31].
The Chuandian forest and biodiversity ecological functional area (CD) is located in the southeastern margin of the Qinghai–Tibet Plateau. The terrain is sloped downward from the northwest to the southeast, with huge topographic relief. The topographic features include plateaus, mountains, plains, hills, sloping valleys, and lakes. The climate can be classified as a monsoon climate, which is characterized by high temperature and abundant precipitation in summer. However, the advance and retreat of the summer monsoon is irregular, which can cause frequent natural disasters such as droughts and floods [32].
The Guiqiandian karst rocky desertification ecological functional area (GQD) is a typical karst development area in China, involving Yunnan, Guizhou, and Guangxi, with an average altitude of 200 m and a total area of about 3.2 × 10⁵ km2. This area is dominated by the typical sub-tropical and tropical monsoon climate. The precipitation and temperature vary significantly with seasons and regions, and the average annual temperature and precipitation show an increasing trend from northwest to southeast. However, due to the vulnerability of the karst environment and the influence of human activities, a series of ecological problems such as soil erosion and rocky desertification have occurred [33,34].
2.2. Data Source
The meteorological data were downloaded from China Meteorological Data Sharing Network. These mainly include daily precipitation (0.1 mm), annual average temperature (°C, 0.1 °C), extreme high temperature (°C, 0.1 °C), extreme low temperature (°C, 0.1 °C), sunshine hours (hour, 0.1 h), accumulated temperature (°C, 0.1 °C), and frost-free period (day, 1 day); the grid datasets (250 m) are obtained through Kriging interpolation with ArcGIS 10.3. The 1:100,000 land use data are from the Institute of Remote Sensing and Digital Earth, Chinese Academy of Sciences. The DEM data derive from the Geospatial Data Cloud Platform with a resolution of 90 m. Land surface indicators, such as humidity index, bare soil index, improved adjusted vegetation index, salinity index, surface temperature, and vegetation coverage were obtained from Landsat images with a resolution of 30 m. The above datasets (accessed on 15 February 2022) can be obtained from the Geospatial Data Cloud Platform (http://www.gscloud.cn/). The annual net primary productivity is derived from MOD17A3 with a spatial resolution of 500 m, which can be freely obtained from NASA EOS (National Aeronautics and Space Administration Earth Observation System). The projection type of all these above datasets is Krasovsky_1940_Albers. All the above factors were resampled into grids with a spatial resolution of 250 m utilizing the ArcGIS 10.3, which all have higher precisions (Table 1, Appendix A).
2.3. Methods
In this paper, the overall technical flowchart is shown in Figure 2.
2.3.1. Comprehensive Index Model
The comprehensive index evaluation method is the superposition of different evaluation indexes for comprehensive calculation. The comprehensive evaluation index of ecological vulnerability requires different indicators to establish a comprehensive evaluation system, and then utilize the weights of different indicators in the system to calculate the comprehensive index.
Considering that different indicators have different contributions to ecosystem vulnerability, it is necessary to introduce the concept of weight and assign different weights to different indicators, so as to highlight the dominant problem of the regional ecological environment. The calculation equation is:
where EVI (ecosystem vulnerability index) is the ecosystem vulnerability index; is index i; is the weight of the i-th index; and n is the number of indicators.
2.3.2. Factor Normalization
Different indicators play different roles in the vulnerability assessment system. The larger the value of some indicators, the more serious the vulnerability, such as extreme precipitation. At the same time, larger values of several other indicators carry less weight on vulnerability, such as NDVI. Thus, the positive and negative normalization equations should be applied according to the action direction of different factors. Considering the dimensional differences between different index factors and their role in the evaluation model, this study uses Equations (2) and (3) to standardize the indicators.
where represents the normalized value of factor i, is the original value of factor i, and and represent the maximum and minimum values of factor i, respectively.
2.3.3. Dynamic Weight Determination Method
With the increasing or decreasing disturbances of climate change and human activity, the roles of different environmental problems in the ecosystem change greatly. Therefore, it is not scientific and reasonable to adopt one single index weight assignment scheme to evaluate the ecological vulnerabilities for different periods. Based on the idea of dynamic weight determination, this study proposes a dynamic weight determination method based on FAHP (Fuzzy Analytic Hierarchy Process), PCA, and the variation coefficient method, and then formulates the dynamic weight assignment schemes for different key ecological functional areas. The coefficient of variation is used to represent the normalized measure of the discrete degree of probability distribution. It can be defined as the ratio of standard deviation to average value, which is used to represent the spatial variation of the indication factor (index layer). The relative importance of each index in the FAHP can be determined by the variation coefficient. The FAHP is utilized to determine the index of target and factor layers to ensure the relative consistency of the index weight assignment scheme for different periods. This method not only considers the spatial differentiation characteristics and the changes in ecological significance for each index in different periods but also avoids the excessive interference of expert knowledge on weight assignment [35,36]. PCA is utilized to deal with multidimensional data to obtain the climate vulnerability in this paper (Figure 3). In addition, ecological vulnerability includes ecological sensitivity (refers to the sensitivity of the ecosystem to the interference of various natural and human activities in the region), ecological resilience (the ability of the system to anticipate, resolve external shocks, and maintain its main functions in the event of a crisis), and ecological pressure (ecological pressure refers to the external interference that endangers the growth and reproduction of individual organisms or populations and the physiological effects it produces) [37].
2.3.4. Geographic Detector
The geographic detector is a model that helps identify the interactions between driving factors on certain geographic phenomenon [38,39,40,41]. This method can be utilized to determine the dominant influencing factors of ecological vulnerability with the factor detector and interactive detector.
The factor detector can be used to detect the spatial differentiation of dependent variables, and the interactive detector can be applied to reveal the explanatory degree of dependent variables with the q value. The equations are as follows:
where h refers to the stratification or partition of independent variable Y and dependent variable X; Nh refers to the number of units in layer h; N represents the number of units throughout the region; and and are the variance of Y value in layer h and the whole region, respectively. Wss refers to the sum of variances for each layer; Tss represents the total variance of the entire region. , the greater the q value, the stronger the interpretation ability of X to Y, and vice versa.
2.3.5. Validation Method
In this paper, the accuracy of different interpolation methods is evaluated by comparing the differences between the predicted values and the measured values of verification stations. In this article, the root mean square error (RMSE) is selected as the evaluation index. RMSE is used to measure the deviation between the estimated value and the predicted value, reflecting the extreme value and sensitivity of the data estimation. RMSE can reflect the overall accuracy of the interpolation results. Generally speaking, the smaller the value of RMSE, the better the interpolation effect and the higher the accuracy of the interpolation model. The equation for RMSE is as follows:
where and represent the predicted value and the measured value, respectively; n is the number of test points.
In this paper, the precision index and the basic error matrices are adopted to test the accuracy of the evaluation results of ecological vulnerability.
where Pu,i represents the user accuracy of inversion category i, PA,j represents the cartographic accuracy of the field observed category j, n is the number of categories, Ci+ is the sum of the inversion category i, C+j is the sum of the field observed category j, and Cij is the number of the inversion category i and the field-observed category j that both occur.
2.3.6. Determinations of the Ecological Vulnerability Thresholds of Multi-Type Ecological Functional Areas in Different Periods Based on NPP
In this paper, NPP was introduced to determine the ecological vulnerability thresholds for multi-type ecological functional areas in different periods, which avoids the randomness of vulnerability threshold definition and also ensures the comparability of the ecological vulnerability among multi-type ecological functional areas in different periods. The detailed processes are as follows:
(1) The NPP of four key ecological functional areas in different periods (2000 and 2018) is divided into four levels (<0.25; 0.25~0.5; 0.5~0.75; >0.75).
(2) The classification datasets of the NPP of four key ecological functional areas in different periods is utilized to obtain the average value of ecological vulnerability index corresponding to different grades.
3. Results
3.1. Ecological Vulnerability Evaluations for Multi-Type Key Ecological Functional Areas
The climate of the TRSR is a typical plateau continental, characterized by low temperatures, scarce precipitation, and strong wind. The area suffers from severe land degradation, such as salinization, soil erosion, and desertification. The HSDK was the source of sandstorms in northern China. It was affected by the temperate continental monsoon climate and natural disasters such as drought, cold currents, desertification, and sandstorms were the main eco-environmental problems. The CD was mainly influenced by a plateau mountainous temperate and sub-tropical monsoon climate, and floods, soil erosion, and droughts were the dominant disaster types. The GQD belongs to a special ecosystem dominated by a karst environment. The karst landform was congenitally developed, which was characterized by more rocks and less soil [42]. Based on the natural characteristics and the dominating ecological environment problems of different key ecological functional areas, the ecological vulnerability evaluation systems of multi-type key functional areas were determined and established referring to relevant scientific research at home and abroad. The vulnerability evaluation systems are shown in Table 2.
3.2. Dynamic Weights for Different Ecological Function Areas
Utilizing the dynamic weight determination method that is composed of FAHP, PCA, and the coefficient of variation method (CV), the index weights of the target layer and index layer were determined by FAHP, while that of the factor layer was made with CV and PCA (for climate vulnerability) (Figure 3). The index weights of the target layer for different types of key ecological functional areas are shown in Table 3, Table 4, Table 5 and Table 6.
3.3. Ecological Vulnerability Evaluation Index and Its Validation
Based on the above evaluation systems and the weights of different evaluation systems, the vulnerability assessment index of different study areas was calculated using the raster calculator tool of ArcGIS 10.3. Then, the determinations of ecological vulnerability threshold in different periods of multi-type ecological function areas were conducted based on NPP. The average values of vulnerability index and the standard deviations were utilized to determine the vulnerability thresholds of multi-type ecological functional areas (Table 7).
In order to validate the accuracy of the novel quantitative vulnerability evaluation method for multi-type ecological functional areas, 270 validation samples (Figure 4, taking the TRSR as an example) were selected from different types of landscape areas by using field measured data, Google Earth, and GF-2 satellite images. After that, the error matrixes of ecological vulnerability index for different types of ecological functional areas (2018) were constructed, shown in Table 8, Table 9, Table 10 and Table 11. The results show that the overall accuracies of the vulnerability evaluation method for multi-type ecological functional areas were 91.1% (TRSR), 91.9% (HSDK), 91.7% (CD), and 94.2% (GQD), respectively, indicating that the proposed novel quantitative vulnerability evaluation method had higher applicability for multi-type ecological zones.
Figure 5a shows that the average ecological vulnerability index of the TRSR is 0.48, which can be classified as mild vulnerability. The ecological vulnerability in the TRSR gradually decreases from north to south, with the northern area being the most vulnerable. Zones of slight and mild vulnerability cover the area of 2.85 × 10⁵ km2, accounting for 67.02%. They are mainly distributed in the southern parts of the TRSR, including southern Geermu City, western and eastern Zhiduo County, southern Maqin County, southern Xiahe County, the middle of Tongren County, and Gonghe County. The zone of moderate vulnerability covers an area of 7.46 × 10⁴ km2, accounting for 17.55%, and is mainly distributed across northern Geermu City, northern Zhiduo County, northwestern Gonghe County, and northern Maqin County. Zones of intensive and severe vulnerability are mostly located in the northwest part with an area of 6.56 × 10⁴ km2, accounting for 15.43%, including the middle of Ulan County and northern Zhiduo County.
Figure 5b shows that the average ecological vulnerability index of the HSDK is 0.35, which belongs to moderate vulnerability. In terms of ecological vulnerability in the southeast of the HSDK, the situation there is better than that in the northwest. The area of slight and mild vulnerability zones is 1.21 × 10⁵ km2, accounting for 72.84%, mainly concentrated in southeastern Xilinhot, southern Jining, northern Chifeng, eastern Chengde, and southern Zhangjiakou. The second largest is the moderately vulnerable area that covers 3.18 × 10⁴ km2, accounting for 19.14% of the total area of the study area. It includes the north of Xilinhaote, the northeast of Jining, the south of Chifeng, and the west of Chengde. The area of intensive and severe vulnerability zones is 1.33 × 10⁴ km2, accounting for 8.02%, and it is mostly concentrated in the western parts, including southern Xilinhaote City and northern Jining City.
Figure 5c shows that the average ecological vulnerability index of the CD is 0.38, which can be classified as mild vulnerability. Its ecological vulnerability index is low in the central area and high in the eastern and western parts, which indicates that the ecological situation in the center of this region is better than that in the east and west. Zones of slight and mild vulnerability cover 2.15 × 10⁵ km2, accounting for 68.60% of the study area. These are widely distributed across the whole study area, including northern Jinghong City, Simao City, Gejiu City, southern Mianyang City, western Maerkang County, southern Kangding County, southern Ya’an City, the center of Xichang City, and northern Zhongdian County. The zone of moderate vulnerability has the second largest area of 6.23 × 10⁴ km2, accounting for 19.86%. It is mostly located in southern Maqin County, northern Kangding County, southern Zhongdian County, northern Jinghong City, and the center of Nujiang Lisu Autonomous County. The regions with intensive and severe vulnerability zones cover 3.62 × 10⁴ km2, accounting for 11.54%. They are scattered throughout the study area, including northern Mianyang City, the middle of Maerkang County, northwestern Yaan City, northwestern Kangding County, and southern Xichang City.
Figure 5d shows that the average ecological vulnerability index of the GQD is 0.30, which belongs to mild vulnerability. The ecological vulnerability index of central GQD is the lowest, followed by that in the southeast, while the western region has a large ecological vulnerability index. Zones of slight and mild vulnerability have the largest area of 5.83 × 10⁴ km2, accounting for 66.39%, and these are mostly concentrated in the south and central parts, including eastern Wenshan County, the center of Baise City, southern Xingyi City, southern Duyun City, southern Hechi City, southern Mashan County, and the center of Liupanshui City. The zone of moderate vulnerability is the second most widely distributed, with an area of 2.21 × 10⁴ km2, accounting for 25.19%, mainly concentrated in southern Wenshan County, central Mashan County, southern Heshan City, northern Duyun City, northern Anshun City, and eastern Bijie City. The area of intensive and severe vulnerability zones is 0.74 × 10⁴ km2, accounting for 8.42% in total, scattered throughout the study area, including southwestern Wenshan County, northern Liupanshui City, northwestern Anshun City, and western Bijie City.
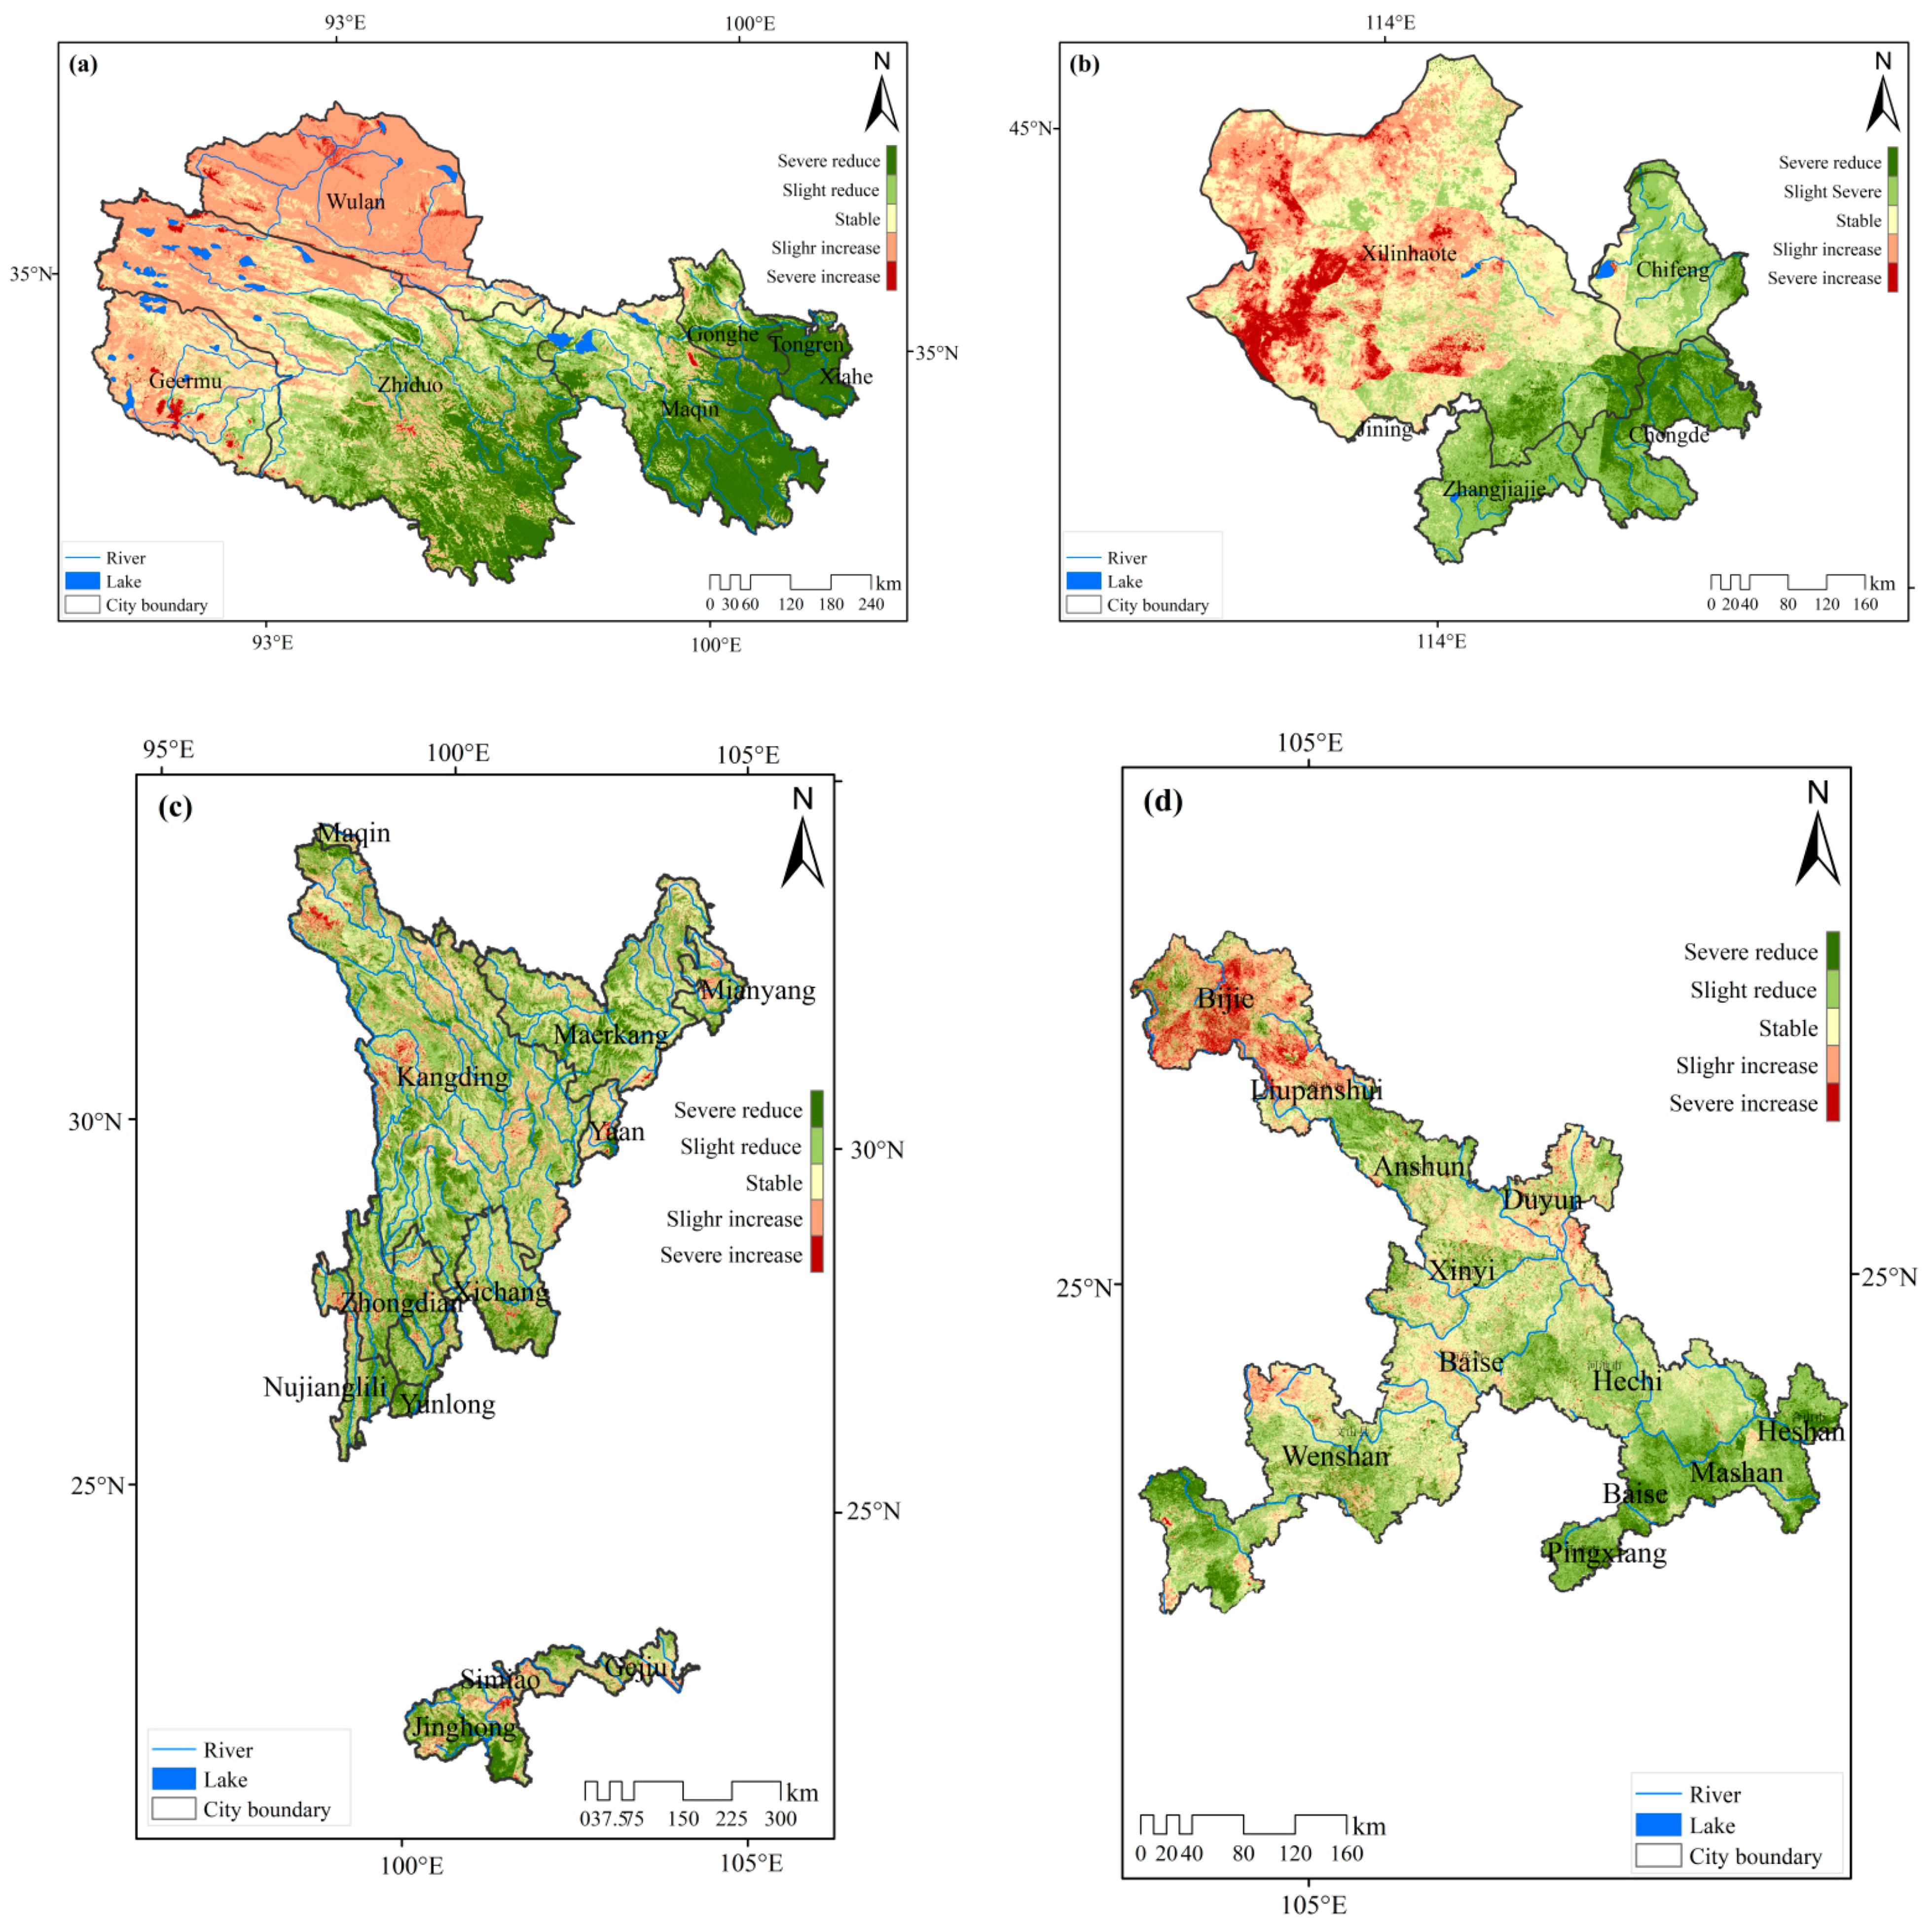
3.4. Change Intensity of Ecological Vulnerability Intensity Changes in Multi-Type Key Functional Areas
This study utilized the Grid calculator of ArcGIS 10.3 to obtain the change intensity of ecological vulnerability. The vulnerability change intensity (CI) was then graded into five categories to further explore the spatial and temporal changes in ecological vulnerability in different types of key functional areas, as shown in Table 12.
During the period of 2000–2018 in the TRSR (Figure 6a), zones of slight increase and severe increase were mostly located in the northwest parts, accounting for 33.64%, including western and northern Geermud City and Wulan County. Slight and severe decrease zones account for 44.19%, which were located in southern Zhiduo County, Maqin County, Xiahe County, Tongren County, and southeastern Gonghe County. The stable zone accounted for 22.17% of the total area, which was concentrated in eastern Geermu City and western Gonghe County.
Between 2000 and 2018, zones of slight and severe increase accounted for 25.87% of the HSDK (Figure 6b), which were concentrated in the northwest of the study area, including northern Jining City and Xilinhaote City. Slight and severe decrease zones accounted for 40.86%, which were located in central Jining City, central and northern Chifeng City, central Chengde City, and Zhangjiakou City. The stable zone accounted for 33.26%, which was scattered through the whole study area, including southwestern Jining City, southeastern Xilinhaote City, and southwestern Chifeng City.
During the same time period in the CD (Figure 6c), the slight and severe increase zones accounted for 21.71%, which were scattered throughout the study area, including southern Mianyang City, western Kangding County, western and southern Yaan City, southwestern Maqin County, southwestern Zhongdian County, southwestern Simao City, and southern Gejiu City. Slight and severe decrease zones accounted for 46.89%, which were mainly distributed across central Maqin County, northern Yaan City, Maerkang County, southern Jinghong City, Yunlong County, and Nujiang Lisi Autonomous Prefecture. The stable zone accounted for 31.40% and was scattered throughout the study area, including northern Mianyang City, northern Kangding County, the middle of Xichang City, and southeastern Yaan City.
Finally, in the same time period in the GQD (Figure 6d), the slight and severe increase zones accounted for 14.62% of the total area, while the slight and severe decrease zones accounted for 52.60%. These were mainly distributed in southwestern Wenshan County, Baise City, Hechi City, southern Xingyi City, southern Duyun City, Mashan County, Heshan City, and Pingxiang City. The stable zone accounted for 32.78% of the total area, which was scattered in the whole study area, including southern Baise City, southern Duyun City, and northeastern Hechi City.
4. Dominant Factors of Ecological Vulnerability for Different Types of Ecological Areas in Different Periods
In order to further investigate the dominant single factors as well as the interactive factors of the change process of ecological vulnerability for multi-type ecological zones in different periods, this study selected eight typical factors, namely vegetation coverage, land use, solar radiation, precipitation, temperature, slope, altitude, and NPP. Utilizing the Geodetector model, the dominant single factors and the interactive factors of multi-type key ecological functional areas were determined.
As shown in Figure 7, the dominant single factor and the dominant interactive factor of the TRSR in 2000 were vegetation coverage and vegetation coverage ∩ precipitation, with q values of 0.60 and 0.84, respectively. In 2018, the dominant single factor and the dominant interactive factor of the study region were vegetation coverage and vegetation coverage ∩ NPP, with q values of 0.95 and 0.97, respectively. The vegetation still played a dominant role in the regional ecosystem evolution, and its contribution rates had been greatly enlarged. For the HSDK in 2000, the dominant single factor and the dominant interactive factor were vegetation coverage and vegetation coverage ∩ solar radiation, with q values of 0.71 and 0.86, respectively. The vegetation and solar radiation contributed greatly to the health of the regional ecosystem. The dominant single factor and the dominant interactive factor of the study region in 2018 were NPP and vegetation coverage ∩ NPP, with q values of 0.91 and 0.98, respectively. With effective implementation of afforestation projects, the dominant role of vegetation in the regional ecosystem has been enhanced. For the CD in 2000, the dominant single factor was vegetation coverage with a q value of 0.79, while the dominant interactive factor was altitude ∩ vegetation coverage with a q value of 0.87. The vegetation and terrain contributed greatly to the ecosystem health. In 2018, the dominant single factor was vegetation coverage with a q value of 0.83, while the dominant interactive factor was NPP ∩ vegetation coverage with a q value of 0.89. For the GQD in 2000, the dominant single factor was solar radiation with a q value of 0.37, while the dominant interactive factor was altitude ∩ vegetation coverage with a q value of 0.66. In 2018, the dominant single factor was precipitation, with a q value of 0.48, while the dominant interactive factor was altitude ∩ vegetation coverage, with a q value of 0.72.
5. Discussion
5.1. Advantages of the Novel Quantitative Vulnerability Evaluation Method
Previous studies have conducted a series of studies on the ecological vulnerability evaluation of single-type ecological areas in a specific historical period, which have achieved certain results [43]. However, few studies on multi-type ecological zones have been reported. In this paper, a complete set of ecological vulnerability evaluation systems oriented to multi-type ecological zones was proposed, which fully considered the differences between regional eco-environmental characteristics and dominant eco-environmental problems. Traditional subjective methods, such as AHP and FAHP, were greatly disturbed by expert experience and knowledge, which led to significant differences in the evaluation results of different studies in the same region [44]. Moreover, objective methods, such as PCA, entropy weight method, and variation coefficient method, could consider the image information features and spatial differentiation characteristics of all the evaluation index, but these ignored the ecological significance of the index itself in the evaluation system [45]. In addition, with the increasing disturbances of natural and artificial factors, the dominant factors of different ecological zones would change [46]. Therefore, the proposed dynamic weight determination method by combining the variation coefficient method, FAHP, and PCA could not only consider the spatial differentiation characteristics and ecological roles of the weight index itself, but it would also help avoid the excessive interference of expert knowledge [47]. Therefore, it could more accurately reflect the importance of each factor in different evaluation systems and different periods. However, there are some significant differences in the evaluation system of multi-type key ecological functional areas, and the index weights in the evaluation system of different periods were also different. Therefore, the ecological vulnerability evaluation results are not comparable. NPP referred to the total amount of organic dry matter accumulated by green plants in unit time and area, which is part of the total organic matter generated by photosynthesis after deducting autotrophic respiration. It was an important indicator of the health status of the ecosystem and sustainable development. In this study, we introduced the NPP to determine the ecological vulnerability thresholds in multi-type ecological zones and different periods. It could indicate the sensitivity and vulnerability of the regional ecosystem to a certain extent, which was helpful for the continuous spatial expression of ecological vulnerability among different ecological zones, while avoiding the arbitrariness of the definition of vulnerability thresholds [48]. This method could ensure the comparability of ecological vulnerability among multi-type ecological zones in different periods [49]. The results show that the ecological vulnerability index evaluation method based on dynamic weighting methods and NPP had high applicability in multi-type key ecological functional areas, which could provide an important reference for the ecological vulnerability evaluation of other regions worldwide.
5.2. Causes of Ecological Vulnerability in Multi-Type Key Ecological Functional Areas
The average ecological vulnerability index of the TRSR was 0.48, which can be classified as mild vulnerability. The TRSR is located in the Qinghai–Tibet Plateau with high altitude, scarce precipitation, and low temperatures. However, the abundant water resources derived from glaciers and melting snow and widely distributed grassland have improved the ecological condition. Zones with serious (intensive and severe) vulnerability were mostly distributed in the northwest of the TRSR, where precipitation was scarce and the wind erosion and desertification were severe [50]. The slight vulnerability zone was located in the source regions of the Yellow River and Lancang River, and in these regions, the surface water resources were abundant, and the vegetation coverage was higher.
The average ecological vulnerability index of the HSDK was 0.35, which is considered moderate vulnerability. Zones of serious vulnerability were mostly concentrated in the western parts, where the evapotranspiration was very large and the Gobi was widely distributed. Meanwhile, frequent sandstorms and low vegetation coverage exacerbated the ecological vulnerability [51,52].
The average ecological vulnerability index of the CD was 0.38, which can be classified as mild vulnerability as a whole. Zones of slight and mild vulnerability were mainly distributed in the south-central regions of the study area. The reason was that in these regions, the vegetation coverage was higher, and there was a sufficient amount of water and heat [53,54]. The intensive and severe vulnerability zones were mostly concentrated in the west and east parts of the study region. In the western parts, the freeze–thaw erosion was severe, and the climate was characterized by low temperature and scarce precipitation [55]. In the eastern parts, the frequent earthquakes caused serious geological disasters, such as debris flow and landslide, which led to severe soil erosion.
The average ecological vulnerability index of the GQD was 0.30, which is considered mild vulnerability as a whole. Zones of serious vulnerability were mainly distributed in the north and west parts, where the rocky desertification was severe.
5.3. Evolution Causes of Ecological Vulnerability in Multi-Type Key Ecological Functional Areas
In 2000, precipitation was the dominant single factor in the ecological functional area of the TRSR, and in 2018, vegetation cover was the dominant factor. This was because during the past decades, a series of ecological protection measures, such as afforestation, prohibition of deforestation, and returning farmland to forest and grassland, had been effectively implemented, which achieved remarkable results with large area restorations of forest and grassland and strengthened the ecosystem diversity and species diversity [56].
Between 2000 and 2018, the dominant factor in the HSDK was vegetation. In this functional area, the climate was characterized by sandstorms, drought, scarce precipitation, and extremely high temperature, which directly affected and limited the growth and recovery of the regional plant ecosystem and further accelerated the degradation process of grassland and forest land [57].
The dominant factor of the CD was vegetation and altitude. In this study region, the plateaus and mountains are widely distributed, so that the climate and the natural environment are both significantly influenced by the altitude and topographic features. The vertical climate types were characterized by abundant orographic precipitation and large temperature difference. In addition, there was rich ecological diversity and various types of vegetation [58].
The dominant factors for the GQD in 2000 were solar radiation and precipitation, while those of 2018 were precipitation, altitude, and vegetation coverage. Since 2003, the implementations of rocky desertification control projects and closed tackling and reforestation (CTRF) have greatly improved the conditions of vegetation. The increasing precipitation with climate change had positive influences on the local ecological environment and microclimate, which became the dominant factors affecting the regional ecosystem [59].
6. Conclusions
Fully considering the geographical and climatic characteristics of multi-type key ecological functional areas, a set of ecological vulnerability evaluation systems oriented to different ecological functional areas was constructed, and a novel dynamic weight determination method was proposed to determine the index weights. Finally, the NPP was introduced to determine the vulnerability thresholds for multi-type ecological zones in different periods. The temporal and spatial changes in ecological vulnerability and its driving mechanisms were explored based on Geodetector. The main results are as follows:
(1) The novel quantitative vulnerability evaluation method for multi-type ecological functional areas had higher applicability for multi-type key ecological functional areas, and the evaluation precisions were 91.3% (TRSR), 92.6% (HSDK), 89.9% (GQD), and 90.8% (CD), respectively.
(2) The proposed dynamic weight determination method could better consider the difference of contribution rate of factors in the vulnerability evaluation system for different periods. In addition, the introduction of NPP to determine the vulnerability thresholds could confirm the comparability of the assessment results among different study regions at a more unified level than previous studies.
(3) The average ecological vulnerability of the TRSR, GQD, and CD can be classified as mild vulnerability, while that of the HSDK can be considered moderate vulnerability.
(4) There were significant differences in the dominant factors of ecological vulnerability for multi-type ecological functional areas in different periods, namely, precipitation and vegetation in the TRSR (2000→2018, unchanged), vegetation and solar radiation (2000) to vegetation (2018) in the HSDK, solar radiation, vegetation, and altitude (2000) to precipitation, vegetation, and altitude (2018) in the GQD, and vegetation and altitude (2000) to vegetation (2018) in the CD.
Author Contributions
Conceptualization, methodology, and writing—original draft preparation, X.Y. investigation, supervision, project administration, and funding acquisition, B.G. All authors have read and agreed to the published version of the manuscript.
Funding
This work was supported by the National Natural Science Foundation of China (grant no. 42101306 and 42171413); Natural Science Foundation of Shandong Province (grant no. ZR2021MD047); Open Fund of Key Laboratory of Urban Land Resources Monitoring and Simulation, Ministry of Natural Resources (grant no. KF-2020-05-001), the Open Fund of the Key Laboratory of National Geographic Census and Monitoring, Ministry of Natural Resources (MNR) (2020NGCM02), and the Major Project of High Resolution Earth Observation System of China (grant no. GFZX0404130304).
Institutional Review Board Statement
Not applicable.
Informed Consent Statement
Not applicable.
Data Availability Statement
Not applicable.
Conflicts of Interest
The authors declare no conflict of interest.
Appendix A
| Data | Source |
| Daily precipitation | China Meteorological Data Sharing Network (http://www.nmic.cn/, accessed on 15 February 2022) |
| Annual average temperature | |
| Extreme high temperature | |
| Extreme low temperature | |
| Sunshine hours | |
| Accumulated temperature | |
| Frost-free period | |
| DEM | Geospatial Data Cloud Platform (http://www.gscloud.cn/, accessed on 10 February 2022) |
| Humidity index | Geospatial Data Cloud Platform (Landsat images) (http://www.gscloud.cn/, accessed on 15 February 2022) |
| Bare soil index | |
| Improved adjusted vegetation index | |
| Salinity index, surface temperature | |
| vegetation coverage | |
| Annual net primary productivity | National Aeronautics and Space Administration Earth Observation System (MOD17A3) (https://www.nasa.gov/, accessed on 12 February 2022) |
References
- Che, L.G. Assessment of Eco-Environmental Vulnerability over Guangxi Beibu Gulf Economic Zone; Guangxi Teachers Education University: Nanning, China, 2013. [Google Scholar]
- Zhou, J.K.; Chen, Q.R.; Qi, P.; Liu, Z.G. Study on the supply and demand matching for policies related to the coordinated development of high haze industries such as thermal power industry and economy in the Beijing–Tianjin–Hebei region. Energy Rep. 2022, 8, 502–512. [Google Scholar] [CrossRef]
- Tang, Q.X.; Li, S.K.; Xie, R.Z.; Zhang, J.X.; Ren, T.Z.; Lin, T.; Gao, S.J. Effects of Conservation Tillage on Crop Yield: A Case Study in the Part of Typical Ecological Zones in China. Agric. Sci. China 2011, 10, 860–866. [Google Scholar] [CrossRef]
- Schmitt, J.; Offermann, F.; Söder, M.; Frühauf, C.; Finger, R. Extreme weather events cause significant crop yield losses at the farm level in German agriculture. Food Policy 2022, 112, 102359. [Google Scholar] [CrossRef]
- Schilling, J.; Freier, K.P.; Hertig, E.; Scheffran, J. Climate change, vulnerability and adaptation in North Africa with focus on Morocco. Agric. Ecosyst. Environ. 2012, 156, 12–26. [Google Scholar] [CrossRef]
- Yao, X.J.; Hu, Y.; Li, J.L.; Jiang, D. Construction of ecological security pattern based on ‘Pressure-state-response model’ in Linquan county of Anhui Province. J. Anhui Agric. Univ. 2020, 47, 538–546. [Google Scholar] [CrossRef]
- Zheng, J. Study on the Ecological Fragility in the Upper Reaches of Minjiang River Based on PSR Model; Chengdu University of Information Technology: Chengdu, China, 2016. [Google Scholar]
- Zheng, H.L.; Wang, Y.H.; Ma, W. Evaluation of eco-environmental vulnerability of Pearl River Delta based on PSR model. Bull. Soil Water Conserv. 2022, 42, 210–217. [Google Scholar] [CrossRef]
- Chang, Y.H.; Cai, H.S. Dynamic assessment of multi-scale eco-environmental vulnerability based on SRP model in Poyang County. Acta Agric. Univ. Jiangxiensis 2022, 44, 245–260. [Google Scholar] [CrossRef]
- Adger, W.N. Vulnerability. Glob. Environ. Chang. 2006, 16, 268–281. [Google Scholar] [CrossRef]
- Liu, Z.Q.; Liu, Y.H.; Lu, X.G. Ecological fragility of wetlands in Sanjiang Plain. Chin. J. Appl. Ecol. 2001, 12, 241–244. [Google Scholar] [CrossRef]
- Qiu, P.H.; Xu, S.J.; Xie, G.Z. Analysis on the ecological vulnerability of the western Hainan Island based on its landscape pattern and ecosystem sensitivity. Acta Ecol. Sin. 2007, 27, 1258–1267. [Google Scholar]
- Edmonds, H.K.; Lovell, J.E.; Lovell, C.A.K. A new composite climate change vulnerability index. Ecol. Indic. 2020, 117, 106529. [Google Scholar] [CrossRef]
- Kantamaneni, K.; Phillips, M.; Thomas, T.; Jenkins, R. Assessing coastal vulnerability: Development of a combined physical and economic index. Ocean Coast. Manag. 2018, 158, 164–175. [Google Scholar] [CrossRef]
- Jin, Y.; Li, A.R.; Bian, J.H.; Lei, G.B.; Muhammad, K. Spatiotemporal analysis of ecological vulnerability along Bangladesh-China-India-Myanmar economic corridor through a grid level prototype model. Ecol. Indic. 2021, 120, 106933. [Google Scholar] [CrossRef]
- Chatrabgoun, O.; Karimi, R.; Daneshkhah, A.; Abolfathi, S.; Nouri, H.; Esmaeilbeigi, M. Copula-based probabilistic assessment of intensity and duration of cold episodes: A case study of Malayer vineyard region. Agric. For. Meteorol. 2020, 295, 108150. [Google Scholar] [CrossRef]
- Goodarzi, D.; Mohammadian, A.; Pearson, J.; Abolfathi, S. Numerical modelling of hydraulic efficiency and pollution transport in waste stabilization ponds. Ecol. Eng. 2022, 182, 106702. [Google Scholar] [CrossRef]
- Noori, R.; Ghiasi, B.; Salehi, S.; Bidhendi, M.E.; Raeisi, A.; Partani, S.; Meysami, R.; Mahdian, M.; Hosseinzadeh, M.; Abolfathi, S. An efficient data driven-based model for prediction of the total sediment load in rivers. Hydrology 2022, 9, 36. [Google Scholar] [CrossRef]
- Donnelly, J.; Abolfathi, S.; Pearson, J.; Chatrabgoun, O.; Daneshkhah, A. Gaussian process emulation of spatio-temporal outputs of a 2D inland flood model. Water Res. 2022, 225, 119100. [Google Scholar] [CrossRef] [PubMed]
- Aspinall, R.; Pearson, D. Integrated geographical assessment of environmental condition in water catchments: Linking landscape ecology, environmental modelling and GIS. J. Environ. Manag. 2000, 59, 299–319. [Google Scholar] [CrossRef]
- Tang, Q.; Wang, J.M.; Jing, Z.R.; Yan, Y.L.; Niu, H.B. Response of ecological vulnerability to land use change in a resource-based city. Chin. Resour. Policy 2022, 74, 102324. [Google Scholar] [CrossRef]
- Guo, B.; Jiang, L.; Fan, Y.W. Analysis of spatial and temporal changes and its driving mechanism of ecological vulnerability of alpine ecosystem in Qinghai Tibet Plateau. Ecol. Sci. 2018, 37, 96–106. [Google Scholar] [CrossRef]
- Zhao, Y. Evaluation and Zoning of Ecological Vulnerability in Central Asia; Beijing Forestry University: Beijing, China, 2019. [Google Scholar] [CrossRef]
- Zhang, Q. The Impact Assessment of Ecological Environment Vulnerability Based on Land Use/Cover Change in Changbai Mountain Area; Yanbian University: Yanji, China, 2019. [Google Scholar]
- Nguyen, A.K.; Liou, Y.-A.; Li, M.-H.; Tran, T.A. Zoning eco-environmental vulnerability for environmental management and protection. Ecol. Indic. 2016, 69, 100–117. [Google Scholar] [CrossRef]
- Zhang, H.L.; Wu, P.S.; Hou, Y.J. Ecological vulnerability evaluation and Its Temporal and Spatial Changes in Wutai Mountain Area. J. Ecol. Rural Environ. 2020, 36, 1026–1035. [Google Scholar] [CrossRef]
- Hu, X.J.; Ma, C.M.; Huang, P.; Guo, X. Ecological vulnerability assessment based on AHP-PSR method and analysis of its single parameter sensitivity and spatial autocorrelation for ecological protection—A case of Weifang City, China. Ecol. Indic. 2021, 125, 107464. [Google Scholar] [CrossRef]
- Blancas, F.J.; Contreras, I.; Ramírez-Hurtado, J.M. Constructing a composite indicator with multiplicative aggregation under the objective of ranking alternatives. J. Oper. Res. Soc. 2013, 64, 668–678. [Google Scholar] [CrossRef]
- Zhang, Q.; Wang, G.; Yuan, R.Y.; Singh, V.P.; Wu, W.H.; Wang, D.Z. Dynamic responses of ecological vulnerability to land cover shifts over the Yellow River Basin, China. Ecol. Indic. 2022, 144, 109554. [Google Scholar] [CrossRef]
- Zhang, X.Y.; Liu, K.; Wang, S.D.; Wu, T.X.; Li, X.K.; Wang, J.N.; Wang, D.C.; Zhu, H.T.; Tan, C.; Ji, Y.H. Spatiotemporal evolution of ecological vulnerability in the Yellow River Basin under ecological restoration initiatives. Ecol. Indic. 2022, 135, 108586. [Google Scholar] [CrossRef]
- Yuan, Z.H.; Sa, C.L.; Yin, S. Research on vegetation phenological changes in the Otindag sandy land Based on MODIS NDVI and EVI. China Environ. Sci. 2021, 41, 5254–5263. [Google Scholar] [CrossRef]
- Liu, J. Sichuan Yunnan Image in Yhe Travel Writings by Foreigners in the 19th and 20th Century; Yunnan University: Kunming, China, 2017. [Google Scholar]
- Ma, B.X.; Jing, J.L.; Xu, Y.; He, H.C.; Liu, B. Spatial-temporal changes of NPP and its relationship with climate change in karst areas of Yunnan, Guizhou and Guangxi from 2000 to 2019. Ecol. Environ. Sci. 2021, 30, 2285–2293. [Google Scholar] [CrossRef]
- Guo, B.; Yang, F.; Fan, J.F.; Lu, Y.F. The changes of spatiotemporal pattern of rocky desertification and its dominant driving factors in typical karst mountainous areas under the background of global change. Remote Sens. 2022, 14, 2351. [Google Scholar] [CrossRef]
- Heger, W.T.; van Andel, T. A social-ecological perspective on ecosystem vulnerability for the invasive creeper coralita (Antigonon leptopus) in the Caribbean: A review. Glob. Ecol. Conserv. 2019, 18, e00605. [Google Scholar] [CrossRef]
- Zhang, Q.; Yuan, R.; Singh, V.P.; Xu, C.-Y.; Fan, K.; Shen, Z.; Wang, G.; Zhao, J. Dynamic vulnerability of ecological systems to climate changes across the Qinghai-Tibet Plateau, China. Ecol. Indic. 2022, 134, 108483. [Google Scholar] [CrossRef]
- Chen, J.; Wang, S.S.; Zou, Y.T. Construction of an ecological security pattern based on ecosystem sensitivity and the importance of ecological services: A case study of the Guanzhong Plain urban agglomeration, China. Ecol. Indic. 2022, 136, 108688. [Google Scholar] [CrossRef]
- Wang, J.F.; Xu, C.D. Geodetector: Principle and prospective. Acta Ecol. Sin. 2017, 72, 116–134. [Google Scholar] [CrossRef]
- Guo, B.; Yang, F.; Fan, Y.W.; Zang, W.Q. The dominant driving factors of rocky desertification and their variations in typical mountainous karst areas of Southwest China in the context of global change. Catena 2023, 220, 106674. [Google Scholar] [CrossRef]
- Guo, B.; Yang, F.; Li, J.L.; Lu, Y.F. A novel-optimal monitoring index of rocky desertification based on feature space model and red edge indices that derived from sentinel-2 MSI image. Geomat. Nat. Hazards Risk 2022, 13, 1571–1592. [Google Scholar] [CrossRef]
- Yao, K.; Zhou, B.; He, L.; Liu, B.; Luo, H.; Liu, D.L.; Li, Y.X. Changes in soil erosion in the upper reaches of the Minjiang River based on geo-detector. Res. Soil Water Conserv. 2022, 29, 85–91. [Google Scholar] [CrossRef]
- Xiang, J.W.; Li, X.M.; Xiao, R.B.; Wang, Y. Effects of land use transition on ecological vulnerability in poverty-stricken mountainous areas of China: A complex network approach. J. Environ. Manag. 2021, 297, 113206. [Google Scholar] [CrossRef]
- Gong, J.; Jin, T.T.; Cao, E.J.; Wang, S.M.; Yan, L.L. Is ecological vulnerability assessment based on the VSD model and AHP-Entropy method useful for loessial forest landscape protection and adaptative management? A case study of Ziwuling Mountain Region. China.Ecol. Indic. 2022, 143, 109379. [Google Scholar] [CrossRef]
- Zhang, Y.; Qi, W.; Zhou, C.; Ding, M.; Liu, L.; Gao, J.; Bai, W.; Wang, Z.; Zheng, D. Spatial and temporal variability in the net primary production of alpine grassland on the Tibetan Plateau since 1982. J. Geogr. Sci. 2014, 24, 269–287. [Google Scholar] [CrossRef]
- Ma, C.X. Construction of multi-factor city remote sensing ecological environmental quality index-A case study of Tongchuan City. Stand. Surv. Mapp. 2021, 37, 17–23. [Google Scholar]
- Boori, M.S.; Choudhary, K.; Paringer, R.; Kupriyanov, A. Using RS/GIS for spatiotemporal ecological vulnerability analysis based on DPSIR framework in the Republic of Tatarstan, Russia. Ecol. Inform. 2022, 67, 101490. [Google Scholar] [CrossRef]
- Cai, X.R.; Li, Z.Q.; Liang, Y.Q. Tempo-spatial changes of ecological vulnerability in the arid area based on ordered weighted average model. Ecol. Indic. 2022, 133, 108398. [Google Scholar] [CrossRef]
- Jiang, Y.J.; Shi, B.; Su, G.J.; Lu, Y.; Li, Q.Q.; Meng, J.; Ding, Y.P.; Song, S.S.; Dai, L.W. Spatiotemporal analysis of ecological vulnerability in the Tibet Autonomous Region based on a pressure-state-response-management framework. Ecol. Indic. 2021, 130, 108054. [Google Scholar] [CrossRef]
- Yang, X.; Liu, S.; Jia, C.; Liu, Y.; Yu, C.C. Vulnerability assessment and management planning for the ecological environment in urban wetlands. J. Environ. Manag. 2021, 298, 113540. [Google Scholar] [CrossRef]
- Lin, X.; Zhao, H.B.; Zhang, S.W.; Li, X.Y.; Gao, W.L.; Ren, Z.Y.; Luo, M. Effects of animal grazing on vegetation biomass and soil moisture on a typical steppe in Inner Mongolia, China. Ecohydrology 2022, 15, e2350. [Google Scholar] [CrossRef]
- Chen, Z.Q.; Zhang, J.; Zhang, Y.L.; Liu, R. Spatio-temporal patterns variation of ecological vulnerability in Otindag Sandy Land based on a vulnerability scoping diagram. Arid Zone Res. 2021, 38, 1464–1473. [Google Scholar] [CrossRef]
- Lalyer, C.R.; Sigsgaard, L.; Giese, B. Ecological vulnerability analysis for suppression of Drosophila suzukii by gene drives. Glob. Ecol. Conserv. 2021, 32, e01883. [Google Scholar] [CrossRef]
- Liu, Y.M.; Yang, S.N.; Han, C.L. Variability in regional ecological vulnerability: A case study of Sichuan Province, China. Int. J. Disaster Risk Sci. 2020, 11, 696–708. [Google Scholar] [CrossRef]
- John, F.; Toth, R.; Frank, K.; Groeneveld, J.; Müller, B. Ecological vulnerability through Insurance? Potential unintended consequences of Livestock drought insurance. Ecol. Econ. 2019, 157, 357–368. [Google Scholar] [CrossRef]
- Luo, M.; Zhang, S.W.; Huang, L.; Liu, Z.Q.; Yang, L.; Li, R.S.; Lin, X. Temporal and Spatial Changes of Ecological Environment Quality Based on RSEI: A Case Study in Ulan Mulun River Basin, China. Sustainability 2022, 14, 13232. [Google Scholar] [CrossRef]
- Wang, S.; Zhang, S.W.; Lin, X.; Li, X.Y.; Li, R.S.; Zhao, X.Y.; Liu, M.M. Response of soil water and carbon storage to short-term grazing prohibition in arid and semi-arid grasslands of China. J. Arid Environ. 2022, 202, 104754. [Google Scholar] [CrossRef]
- Qi, D.H.; Yang, H.X.; Lu, Q.; Chu, J.M.; Gan, H.H.; Zhao, S.; Chen, J.W.; Xu, X.Q. Biodiversity of plant communities and its environmental interpretation in the Otindag Sandy Land, China. J. Desert Res. 2021, 41, 65–77. [Google Scholar] [CrossRef]
- Peng, Y.T.; Welden, N.; Renaud, F.G. A framework for integrating ecosystem services indicators into vulnerability and risk assessments of deltaic social-ecological systems. J. Environ. Manag. 2022, 326, 116682. [Google Scholar] [CrossRef]
- Sun, T.T.; Lin, W.P.; Chen, G.S.; Guo, P.P.; Zeng, Y. Wetland ecosystem health assessment through integrating remote sensing and inventory data with an assessment model for the Hangzhou Bay, China. Sci. Total Environ. 2016, 566, 627–640. [Google Scholar] [CrossRef] [PubMed]
Figure 1.
Location of the study area.

Figure 2.
Overall technical flowchart of this study.

Figure 3.
Dynamic weight determination method.

Figure 4.
Spatial distributions of validation samples.

Figure 5.
Spatial patterns of ecological vulnerability for multi-type key functional areas. (a) Three-River Source region grassland meadow wetland ecological functional area; (b) Hunshandake desertification control ecological functional area; (c) Chuandian forest and biodiversity ecological functional area; and (d) Guiqiandian karst rocky desertification control ecological functional area.

Figure 6.
Change intensity of ecological vulnerability in multi-type key functional areas. (a) Three-River Source region grassland meadow wetland ecological functional area; (b) Hunshandake desertification control ecological functional area; (c) Chuandian forest and biodiversity ecological functional area; and (d) Guiqiandian karst rocky desertification control ecological functional area.

Figure 7.
Dominant factors and interactive factors of different types of key ecological functional areas in 2000 and 2018. (a) Dominant single factor; (b) dominant interactive factor.
Figure 7.
Dominant factors and interactive factors of different types of key ecological functional areas in 2000 and 2018. (a) Dominant single factor; (b) dominant interactive factor.


Table 1.
The descriptions of the evaluation factors.
| Evaluation Factor | Data Source | Equations | Approach | Overall Accuracy | RMSE |
|---|---|---|---|---|---|
| Annual mean temperature | 823 meteorological stations | Geostatistical Analyst | 91.2% | 0.657 | |
| Annual precipitation | 93.4% | 0.964 | |||
| Variation coefficient of annual precipitation | 89.7% | 1.012 | |||
| Variation coefficient of annual mean temperature | 90.8% | 1.354 | |||
| Extreme high-temperature days | 93.6% | 0.458 | |||
| Extreme low-temperature days | 88.6% | 0.653 | |||
| Proportion of erosive rainfall | 85.4% | 0.854 | |||
| Accumulated temperature (>10 °C) | 88.2% | 0.697 | |||
| Sunshine hours | 93.7% | 0.324 | |||
| Frost-free period | 96.3% | 0.328 | |||
| Humidity index | Landsat images | Raster Calculator | 96.1% | 0.425 | |
| Surface albedo | 90.9% | 0.357 | |||
| Land surface temperature | 86.9% | 0.247 | |||
| Bare soil index | 94.4% | 0.358 | |||
| Desertification index | 91.5% | 0.688 | |||
| Salinization index | 90.8% | 0.665 | |||
| Rock exposure index | 86.2% | 0.987 | |||
| Altitude | SRTM DEM | -- | -- | -- | |
| Slope | -- | -- | -- | ||
| Topographic relief | Zonal Statistics | 96.0% | 0.632 | ||
| Lithology | Geological and hydrological map | -- | -- | -- | |
| Water resources | Land use data | -- | -- | -- | |
| Water network density | -- | -- | -- | ||
| Vegetation coverage | MODIS NDVI | Raster Calculator | 86.7% | 0.359 | |
| Landscape Diversity index | Land use data | -- | -- | ||
| Landscape fragmentation index | -- | -- | |||
| Human activity intensity index | Land use data | 93.1% | 0.257 |
Note: Bblue, Bgreen, Bred, Bnir, Bswir1, and Bswir2 are the band reflectance of blue, green, red, swir1, and swir2, respectively; is the atmospheric transmittance; is the land surface emissivity; T10 is the radiance temperature of thermal infrared B10(K); C and D refer to the intermediate parameter; Ta is the average action temperature of the atmosphere (K); Td refers to the average daily temperature (°C); Pd refers to the daily precipitation (mm); refers to the standard deviation of temperature; refers to the average value of temperature; refers to the standard deviation of precipitation; refers to the average value of precipitation; dsunh refers to the daily sunshine duration (hour); nTL>2 °C refers to the day with daily minimum temperature larger than 2 °C; Ni refers to the patch number of landscape type i; Ai refers to the total area of landscape type i; and Pi refers to the area ratio of landscape type i. RMSE is the root mean square error.
Table 2.
Evaluation system of ecological function areas in different study areas.
| Target Layer | Index Layer | Factor Layer | A | B | C | D | Direction | |
|---|---|---|---|---|---|---|---|---|
| Ecological vulnerability | Ecological sensitivity | Climate | Annual mean temperature | √ | √ | √ | √ | Negative |
| Annual precipitation | √ | √ | √ | √ | Negative | |||
| Variation coefficient of annual precipitation | × | × | √ | √ | Positive | |||
| Variation coefficient of annual mean temperature | √ | √ | × | × | Positive | |||
| Extreme high-temperature days | × | √ | √ | √ | Positive | |||
| Extreme low-temperature days | √ | √ | × | × | Positive | |||
| Proportion of erosive rainfall | × | × | √ | √ | Positive | |||
| Accumulated temperature (>10 °C) | √ | √ | √ | √ | Negative | |||
| Sunshine hours | √ | √ | × | × | Negative | |||
| Frost-free period | √ | √ | × | × | Negative | |||
| Soil | Humidity index | √ | √ | √ | √ | Negative | ||
| Surface albedo | √ | √ | √ | √ | Positive | |||
| Land surface temperature | √ | √ | × | × | Positive | |||
| Bare soil index | √ | √ | √ | √ | Positive | |||
| Desertification index | √ | √ | × | × | Positive | |||
| Salinization index | √ | √ | × | × | Positive | |||
| Rock exposure index | × | × | × | √ | Positive | |||
| Terrain | Altitude | √ | √ | √ | √ | Positive | ||
| Slope | √ | √ | √ | √ | Positive | |||
| Topographic relief | √ | √ | √ | √ | Positive | |||
| Geology | Lithology | × | × | × | √ | -- | ||
| Water | Water resources | √ | √ | √ | √ | Negative | ||
| Water network density | √ | √ | √ | √ | Negative | |||
| Ecological resilience | Vegetation | Vegetation coverage | √ | √ | √ | √ | Negative | |
| Ecological pressure | Land use | Landscape diversity index | √ | √ | √ | √ | Negative | |
| Landscape fragmentation index | √ | √ | √ | √ | Positive | |||
| Social development | Human activity intensity index | √ | √ | √ | √ | Positive | ||
Note: A refers to the Three-River Source region grassland, meadow, and wetland ecological functional area; B refers to the Hunshandake desertification control ecological functional area; C refers to the Chuandian forest and biodiversity ecological functional area; and D refers to the Guiqiandian karst rocky desertification control ecological functional area.
Table 3.
Dynamic evaluation table of index weights in the TRSR.
| Target Layer | Index Layer | Factor Layer | Weights of 2000 | Weights of 2018 | |
|---|---|---|---|---|---|
| Ecological vulnerability | Ecological sensitivity (0.4) | Climate (0.19) | Annual mean temperature | PCA | PCA |
| Annual precipitation | |||||
| Variation coefficient of annual mean temperature | |||||
| Extreme low-temperature days | |||||
| Accumulated temperature (>10 °C) | |||||
| Sunshine hours | |||||
| Frost-free period | |||||
| Soil (0.31) | Humidity index | 0.13 | 0.08 | ||
| Surface albedo | 0.12 | 0.26 | |||
| Land surface temperature | 0.13 | 0.14 | |||
| Bare soil index | 0.07 | 0.05 | |||
| Desertification index | 0.34 | 0.14 | |||
| Salinization index | 0.21 | 0.33 | |||
| Terrain (0.21) | Altitude | 0.16 | 0.16 | ||
| Slope | 0.47 | 0.47 | |||
| Topographic relief | 0.37 | 0.37 | |||
| Water (0.29) | Water resources | 0.6 | 0.50 | ||
| Water network density | 0.4 | 0.50 | |||
| Ecological resilience (0.25) | Vegetation (1.0) | Vegetation coverage | 1.0 | 1.0 | |
| Ecological pressure (0.35) | Land use (0.6) | Landscape diversity index | 0.6 | 0.5 | |
| Landscape fragmentation index | 0.4 | 0.5 | |||
| Social development (0.4) | Human activity intensity index | 1.0 | 1.0 | ||
Table 4.
Dynamic evaluation table of index weights in the HSDK.
| Target Layer | Index Layer | Factor Layer | Weights of 2000 | Weights of 2018 | |
|---|---|---|---|---|---|
| Ecological vulnerability | Ecological sensitivity (0.35) | Climate (0.19) | Annual mean temperature | PCA | PCA |
| Annual precipitation | |||||
| Variation coefficient of annual mean temperature | |||||
| Extreme high-temperature days | |||||
| Extreme low-temperature days | |||||
| Accumulated temperature (>10 °C) | |||||
| Sunshine hours | |||||
| Frost-free period | |||||
| Soil (0.37) | Humidity index | 0.24 | 0.04 | ||
| Surface albedo | 0.08 | 0.21 | |||
| Land surface temperature | 0.17 | 0.12 | |||
| Bare soil index | 0.17 | 0.10 | |||
| Desertification index | 0.1 | 0.16 | |||
| Salinization index | 0.24 | 0.37 | |||
| Terrain (0.15) | Altitude | 0.09 | 0.09 | ||
| Slope | 0.51 | 0.51 | |||
| Topographic relief | 0.40 | 0.40 | |||
| Water (0.29) | Water resources | 0.7 | 0.6 | ||
| Water network density | 0.3 | 0.4 | |||
| Ecological resilience (0.35) | Vegetation (1.0) | Vegetation coverage | 1.0 | 1.0 | |
| Ecological pressure (0.3) | Land use (0.5) | Landscape diversity index | 0.6 | 0.5 | |
| Landscape fragmentation index | 0.4 | 0.5 | |||
| Social development (0.5) | Human activity intensity index | 1.0 | 1.0 | ||
Table 5.
Dynamic evaluation table of index weights in the CD.
| Target Layer | Index Layer | Factor Layer | Weights of 2000 | Weights of 2018 | |
|---|---|---|---|---|---|
| Ecological vulnerability | Ecological sensitivity (0.4) | Climate (0.15) | Annual mean temperature | PCA | PCA |
| Annual precipitation | |||||
| Variation coefficient of annual precipitation | |||||
| Extreme high-temperature days | |||||
| Proportion of erosive rainfall | |||||
| Accumulated temperature (>10 °C) | |||||
| Soil (0.37) | Humidity index | 0.31 | 0.11 | ||
| Surface albedo | 0.53 | 0.56 | |||
| Bare soil index | 0.16 | 0.33 | |||
| Terrain (0.28) | Altitude | 0.26 | 0.26 | ||
| Slope | 0.38 | 0.38 | |||
| Topographic relief | 0.36 | 0.36 | |||
| Water (0.20) | Water resources | 0.7 | 0.6 | ||
| Water network density | 0.3 | 0.4 | |||
| Ecological resilience (0.35) | Vegetation (1.0) | Vegetation coverage | 1.00 | 1.00 | |
| Ecological pressure (0.25) | Land use (0.4) | Landscape diversity index | 0.50 | 0.50 | |
| Landscape fragmentation index | 0.50 | 0.50 | |||
| Social development (0.6) | Human activity intensity index | 1.00 | 1.00 | ||
Table 6.
Dynamic evaluation table of index weights in the GQD.
| Target Layer | Index Layer | Factor Layer | Weights of 2000 | Weights of 2018 | |
|---|---|---|---|---|---|
| Ecological vulnerability | Ecological sensitivity (0.4) | Climate (0.11) | Annual mean temperature | PCA | PCA |
| Annual precipitation | |||||
| Variation coefficient of annual precipitation | |||||
| Extreme high-temperature days | |||||
| Proportion of erosive rainfall | |||||
| Accumulated temperature (>10 °C) | |||||
| Soil (0.29) | Humidity index | 0.32 | 0.21 | ||
| Surface albedo | 0.26 | 0.17 | |||
| Bare soil index | 0.30 | 0.32 | |||
| Rock exposure index | 0.12 | 0.30 | |||
| Terrain (0.25) | Altitude | 0.36 | 0.36 | ||
| Slope | 0.37 | 0.37 | |||
| Topographic relief | 0.27 | 0.27 | |||
| Geology (0.14) | lithology | 1.00 | 1.00 | ||
| Water (0.21) | Water resources | 0.7 | 0.6 | ||
| Water network density | 0.3 | 0.4 | |||
| Ecological resilience (0.3) | Vegetation (1.0) | Vegetation coverage | 1.00 | 1.00 | |
| Ecological pressure (0.3) | Land use (0.55) | Landscape diversity index | 0.50 | 0.50 | |
| Landscape fragmentation index | 0.50 | 0.50 | |||
| Social development (0.45) | Human activity intensity index | 1.00 | 1.00 | ||
Table 7.
Thresholds of ecological vulnerability for multi-type ecological functional areas in different periods.
Table 7.
Thresholds of ecological vulnerability for multi-type ecological functional areas in different periods.
| Levels of Vulnerability | TRSR | GQD | CD | HSDK | ||||
|---|---|---|---|---|---|---|---|---|
| (2000) | (2018) | (2000) | (2018) | (2000) | (2018) | (2000) | (2018) | |
| Slight vulnerability | <0.49 | <0.36 | <0.27 | <0.25 | <0.31 | <0.36 | <0.26 | <0.36 |
| Mild vulnerability | 0.49–0.51 | 0.36–0.49 | 0.27–0.33 | 0.25–0.31 | 0.31–0.47 | 0.36–0.44 | 0.26–0.35 | 0.36–0.48 |
| Moderate vulnerability | 0.51–0.56 | 0.49–0.54 | 0.33–0.39 | 0.31–0.35 | 0.47–0.51 | 0.44–0.49 | 0.35–0.40 | 0.48–0.51 |
| Intensive vulnerability | 0.56–0.59 | 0.54–0.58 | 0.39–0.47 | 0.35–0.38 | 0.51–0.55 | 0.49–0.51 | 0.40–0.44 | 0.51–0.53 |
| Severe vulnerability | >0.59 | >0.58 | >0.47 | >0.38 | >0.55 | >0.51 | >0.44 | >0.53 |
Table 8.
Error matrix of ecological vulnerability index for the TRSR.
| Vulnerability Levels | Slight | Mild | Moderate | Intensive | Severe | Sum |
|---|---|---|---|---|---|---|
| Slight | 63 | 1 | 2 | 1 | 1 | 68 |
| Mild | 1 | 54 | 1 | 2 | 2 | 60 |
| Moderate | 1 | 0 | 49 | 1 | 1 | 52 |
| Intensive | 2 | 1 | 2 | 42 | 0 | 47 |
| Severe | 2 | 1 | 1 | 1 | 38 | 43 |
| Sum | 69 | 57 | 55 | 47 | 42 | 270 |
Table 9.
Error matrix of ecological vulnerability index for the HSDK.
| Vulnerability Levels | Slight | Mild | Moderate | Intensive | Severe | Sum |
|---|---|---|---|---|---|---|
| Slight | 70 | 2 | 0 | 1 | 1 | 74 |
| Mild | 2 | 60 | 1 | 1 | 2 | 66 |
| Moderate | 1 | 1 | 53 | 0 | 1 | 56 |
| Intensive | 1 | 2 | 2 | 46 | 2 | 53 |
| Severe | 2 | 0 | 1 | 2 | 58 | 63 |
| Sum | 76 | 65 | 57 | 50 | 64 | 312 |
Table 10.
Error matrix of ecological vulnerability index for Hunshandake desertification control ecological functional area.
Table 10.
Error matrix of ecological vulnerability index for Hunshandake desertification control ecological functional area.
| Vulnerability Levels | Slight | Mild | Moderate | Intensive | Severe | Sum |
|---|---|---|---|---|---|---|
| Slight | 75 | 1 | 2 | 2 | 2 | 82 |
| Mild | 1 | 66 | 1 | 0 | 1 | 69 |
| Moderate | 0 | 2 | 54 | 2 | 1 | 59 |
| Intensive | 2 | 1 | 2 | 51 | 0 | 56 |
| Severe | 2 | 1 | 1 | 2 | 42 | 48 |
| Sum | 80 | 71 | 60 | 57 | 46 | 314 |
Table 11.
Error matrix of ecological vulnerability index for the GQD.
| Vulnerability Levels | Slight | Mild | Moderate | Intensive | Severe | Sum |
|---|---|---|---|---|---|---|
| Slight | 78 | 0 | 1 | 3 | 1 | 83 |
| Mild | 2 | 74 | 0 | 1 | 1 | 78 |
| Moderate | 1 | 1 | 64 | 0 | 2 | 68 |
| Intensive | 2 | 2 | 1 | 85 | 0 | 90 |
| Severe | 0 | 1 | 2 | 1 | 56 | 60 |
| Sum | 83 | 78 | 68 | 90 | 60 | 379 |
Table 12.
Level thresholds of ecological vulnerability change intensity.
| Levels | Severe Decrease | Slight Decrease | Stable | Slight Increase | Severe Increase |
|---|---|---|---|---|---|
| CI | CI ≤ −0.02 | −0.02 < CI ≤ −0.01 | 0.01 < CI ≤ 0.01 | 0.01 < CI ≤ 0.02 | CI > 0.02 |
Publisher’s Note: MDPI stays neutral with regard to jurisdictional claims in published maps and institutional affiliations. |
© 2022 by the authors. Licensee MDPI, Basel, Switzerland. This article is an open access article distributed under the terms and conditions of the Creative Commons Attribution (CC BY) license (https://creativecommons.org/licenses/by/4.0/).
Share and Cite
MDPI and ACS Style
Yuan, X.; Guo, B. Dynamic Monitoring of the Ecological Vulnerability for Multi-Type Ecological Functional Areas during 2000–2018. Sustainability 2022, 14, 15987. https://doi.org/10.3390/su142315987
AMA Style
Yuan X, Guo B. Dynamic Monitoring of the Ecological Vulnerability for Multi-Type Ecological Functional Areas during 2000–2018. Sustainability. 2022; 14(23):15987. https://doi.org/10.3390/su142315987
Chicago/Turabian StyleYuan, Xingming, and Bing Guo. 2022. "Dynamic Monitoring of the Ecological Vulnerability for Multi-Type Ecological Functional Areas during 2000–2018" Sustainability 14, no. 23: 15987. https://doi.org/10.3390/su142315987
Note that from the first issue of 2016, this journal uses article numbers instead of page numbers. See further details here.