


Evaluation of Geological Disaster Sensitivity in Shuicheng District Based on the WOE-RF Model

1
School of Civil Engineering and Architecture, Guizhou Minzu University, Guiyang 550025, China
2
State Key Laboratory of Geological Disaster Prevention and Geological Environment Protection, Chengdu University of Technology, Chengdu 610059, China
3
School of Information Science and Technology, Chengdu University of Technology, Chengdu 610059, China
*
Author to whom correspondence should be addressed.
Sustainability 2022, 14(23), 16247; https://doi.org/10.3390/su142316247
Submission received: 19 October 2022
/
Revised: 1 December 2022
/
Accepted: 2 December 2022
/
Published: 5 December 2022
(This article belongs to the Special Issue Applications of GIS and Remote Sensing for Sustainable Spatial Planning)
Abstract
:To improve the prevention and control of geological disasters in Shuicheng District, 10 environmental factors—slope, slope direction, curvature, NDVI, stratum lithology, distance from fault, distance from river system, annual average rainfall, distance from road and land use—were selected as evaluation indicators by integrating factors such as landform, basic geology, hydrometeorology and engineering activities. Based on the weight of evidence, random forest, support vector machine and BP neural network algorithms were introduced to build WOE-RF, WOE-SVM and WOE-BPNN models. The sensitivity of Shuicheng District to geological disasters was evaluated using the GIS platform, and the region was divided into areas of extremely high, high, medium, low and extremely low sensitivity to geological disasters. By comparing and analyzing the ROC curve and the distribution law of the sensitivity index, the AUC evaluation accuracy of the WOE-RF, WOE-SVM and WOE-BPNN models was 0.836, 0.807 and 0.753, respectively; the WOE-RF model was shown to be the most effective. In the WOE-RF model, the extremely high-, high-, medium-, low- and extremely low-sensitivity areas accounted for 15.9%, 16.9%, 19.3%, 21.0% and 26.9% of the study area, respectively. The extremely high- and high-sensitivity areas are mainly concentrated in areas with large slopes, broken rock masses, river systems and intensive human engineering activity. These research results are consistent with the actual situation and can provide a reference for the prevention and control of geological disasters in this and similar mountainous areas.
1. Introduction
Geological disasters pose a significant threat to the safety of building facilities and the lives and property of residents. Geological disasters occur frequently in Shuicheng District, the most prominent and harmful of which is landslide. Geological disaster sensitivity and risk assessment can effectively analyze the characteristics of regional geological disasters and provide a scientific basis for land use planning and the prevention and reduction of disasters.
Geological disaster sensitivity evaluation refers to the evaluation of the trend of geological disasters based on the environmental characteristics of past disasters and determination of the probability of geological disasters. At present, geological disaster sensitivity evaluation models mainly include probability statistical models and machine learning models. Probability statistical models include the frequency ratio model [1], informational value model [2,3] and certainty factor model [4,5], etc. Machine learning models include the logistic regression model [6,7], neural network model [8], support vector machine model [9,10] and random forest model [11,12], etc. Combining two or more models has become a popular evaluation approach in recent years.
Compared with other binary statistical models (such as the information value and certainty factor models), the weight of evidence model has the advantage that it not only considers the positive weight obtained by the sufficient rate of disaster occurrence but also considers the negative weight obtained by the necessary rate of disaster occurrence; thus, the final weight considers the two factors comprehensively [13]. In addition, in existing research on geological disasters in Shuicheng District, the research objectives are generally the most harmful single geological disasters, such as extremely large landslides [14,15]. In view of this, our paper attempts to analyze geological disasters in Shuicheng District from the regional perspective. On the basis of the evidence, we combine the random forest, support vector machine and BP neural network algorithms to build the WOE-RF, WOE-SVM and WOE-BPNN models and, through a comparative study of each model, discuss the disaster sensitivity evaluation model applicable to Shuicheng District.
2. Materials and Methods
2.1. Study Area
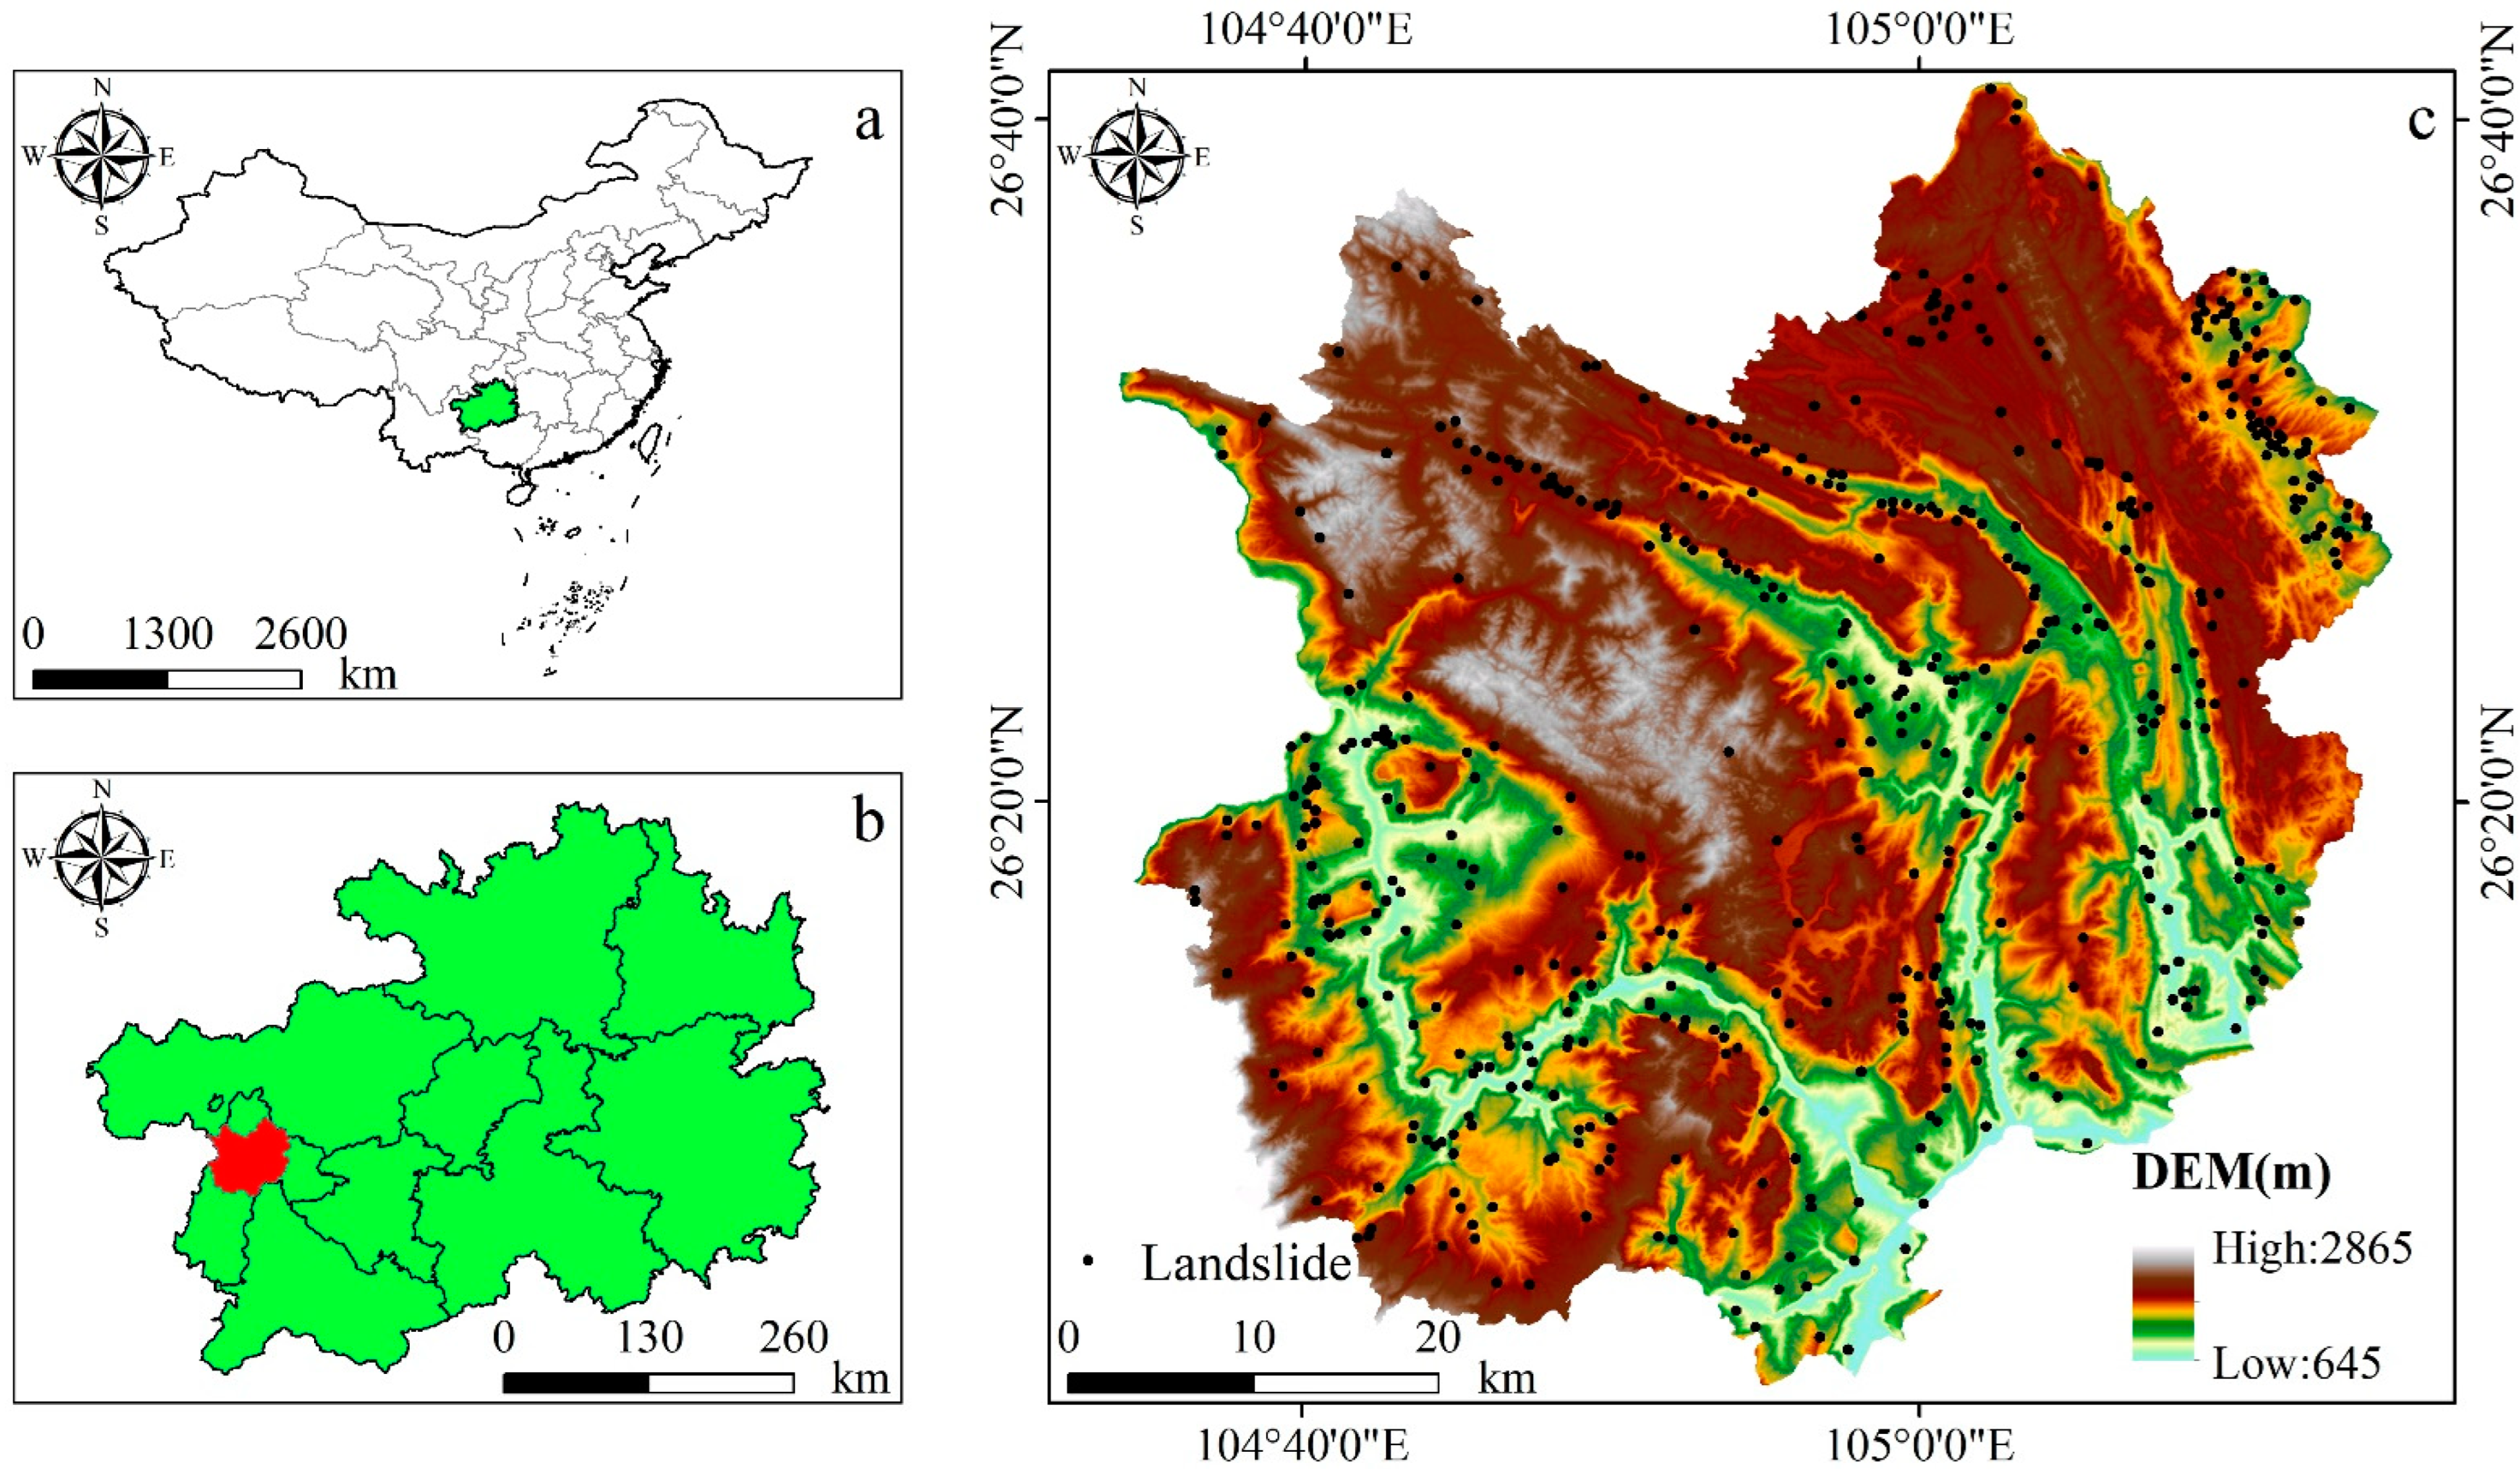
Shuicheng District is subordinate to Liupanshui City, Guizhou Province, China, with geographical coordinates ranging between 104°34′~105°15′ E and 26°02′~26°55′ N, covering a total area of 3054.92 km2. The study area has a plateau monsoon climate with an annual average temperature of 15 °C and an annual average rainfall of 1300 mm. The river belongs to the Sancha River basin of the Yangtze River system and the Beipan River basin of the Pearl River system. The terrain in the area fluctuates significantly, with an altitude of 645~2865.2 m. The landform is dominated by mountains, in addition to hills, valleys and basins. The overall terrain is high in the northwest and low in the southeast; folds and faults are developed, tectonic activities are strong, and the rock and soil associations are complex and diverse. Landslides in the area are mainly small- and medium-sized, and most of them are soil landslides; 533 landslide points were determined using a geological disaster survey and remote sensing interpretation; their spatial distribution is shown in Figure 1.
2.2. Data Sources
The basic data in this paper include landslide data and landslide influencing factor data. Landslide influencing factor data is composed of terrain, geology, remote sensing, hydrometeorology and engineering activity data. The data sources for this paper are shown in Table 1.
2.3. Landslide Influencing Factors
The occurrence of geological disasters is influenced by various environmental factors. From previous research and existing data, the elevation, slope, aspect, curvature, roughness, undulation, terrain humidity index, NDVI, stratum age, lithology, distance from fault, distance from water system, annual average rainfall, distance from road and land use were determined. The results are shown in Table 2 (D1–D15 represent the above environmental factors). When the correlation coefficient |R| is > 0.3, it is considered that there is a strong correlation between environmental factors. The correlation coefficients between elevation and distance from the river system and average annual rainfall were 0.41 and 0.51, respectively. Therefore, the elevation factor was discarded. The correlation coefficients between slope and roughness, fluctuation and the terrain humidity index were 0.90, 0.93 and 0.44, respectively. The correlation coefficient between curvature and the topographic moisture index was −0.46, and the correlation coefficient between fluctuation and the topographic humidity index was −0.36. Because roughness and topographic moisture index were extracted on the basis of slope, the three factors of roughness, fluctuation degree and terrain humidity index were excluded. The correlation coefficient between stratigraphic age and lithology was 0.69, and the stratigraphic age factor was discarded. To ensure the mutual independence of the various environmental factors and the reliability of the evaluation results, the 10 eligible environmental factors were selected as the evaluation indicators, as shown in Figure 2.
Slope affects the stress distribution of the slope body and plays an important role in the distribution and volume of surface water runoff and loose deposits on the slope. The intersecting relationship between the aspect and the structural planes, such as the rock layer and joint fissure, forms different types of slope structures, which govern the spatial distribution of geological disasters and the failure mode of slopes. Curvature indicates the unevenness of terrain and affects the erosion and deposition of terrain surface materials. The above three environmental factors can be directly extracted from DEM data. Vegetation distribution has a certain impact on the distribution of geological disasters. The normalized difference vegetation index (NDVI) can be utilized to represent vegetation distribution. The NDVI value is obtained using radiometric calibration, atmospheric correction and band calculation of Landsat-8 images in the study area via ENVI software. Rainfall infiltration increases the gravity of the slope, softens the rock–soil interface, and induces geological disasters. The annual average rainfall provides a stable reflection of regional annual rainfall. Geological disasters often develop to a greater extent in particular strata, and different types and scales of geological disasters are triggered in different strata lithologies. Geological structures such as faults destroy the original structure of the rock mass, resulting in the fragmentation of the rock mass and the development of joint fissures. Cutting and scouring by the water system can easily create high and steep slopes and loose deposits, which increase the possibility of slope instability. Human engineering activities, such as road construction and land utilization, have transformed and destroyed the original landform and geological environment and, to a certain extent, have affected the frequency of geological disasters. The Euclidean distance tool was used in ArcGIS to obtain the distances from faults, water systems and roads. For the continuous environmental factors, we adopted the natural discontinuity classification method (Jenks) [16], which can classify similar values and maximize the difference between different types of values. For discrete environmental factors, inherent classification was adopted: the slope direction was divided into eight directions and flat according to the azimuth angle; the formation lithology was divided into hard rock, relatively hard rock, alternating soft and hard rock, soft rock and relatively soft rock according to the degree of hardness; and land use type was divided into five categories: cropland, forest, grass, water and artificial.
2.4. Methods
2.4.1. Technical Process
First, using functional modules of the ArcGIS software such as cropping, projection and resampling, the projection coordinates of each environmental factor were unified as CGCS2000_GK_Zone_18. The grid cell was selected as the basic evaluation unit to improve evaluation efficiency and meet the accuracy requirements. The grid cell size was calculated using the following formula [17]:
where Gs is the grid cell size (m) and S is the scale denominator. Because the geographical base map scale selected for this paper was 1:50,000, combined with Formula (1), the evaluation unit was a 30 m × 30 m grid, with 3,350,033 grid cells in the total study area.
Then, for the 533 landslide points in Shuicheng District, an equal number of nonlandslide points were randomly selected outside the 1 km range; the two constituted a total sample point. Combined with environmental factors and total sample points, the evidence weight of each environmental factor layer was calculated and assigned to the total sample points and the total grid points of the study area for quantitative processing. Finally, 70% of the assigned total sample points were selected as training samples to participate in the training of each model. The sensitivity index of the total grid points in the study area was predicted according to the training results, and then the geohazard sensitivity zoning of each model was drawn. The remaining 30% of the sample points were used as test samples to compare and test the accuracy of each model.
2.4.2. Weight of Evidence (WOE)
The weight of evidence model is a quantitative evaluation method based on Bayesian statistics and integrates various evidence layer factors to predict the probability of disaster occurrence. The calculation formula is as follows:
In this formula, Npix1 represents the area within the environmental factor level, Npix2 represents the area of a disaster outside the environmental factor level, Npix3 represents the area with no disasters within this environmental factor level, Npix4 represents the area outside the environmental factor level, and indicate the positive and negative correlation weights of the evidence factor and the difference between them is the contrast Wfi, which indicates the weight of disaster occurrence in each classification state of the evidence level factors.
2.4.3. Random Forest (RF)
Random forest is an ensemble learning algorithm with a decision tree as the basic unit. The first step is to select m training samples from the original training set to establish a decision tree model, then randomly select n subsets of features from each sample and select the optimal features to grow the nodes. The final result is obtained by voting on each decision tree. The formula is as follows:
where Z(x) represents the random forest model, Yi(x) is a single decision tree model, U is the output variable and I is the explicit function. Each decision tree randomly selects some samples and some features, which avoids the overfitting of the model to some extent and provides good noise resistance.
2.4.4. Support Vector Machine (SVM)
The SVM is a binary classification model that aims to solve the separated hyperplane with the largest class interval so that the support vector is as far from this hyperplane as possible to achieve a better classification effect, as shown in the equation:
In this formula, f(x) is the regression function of the SVM, φ(x) is a nonlinear mapping function, ω is the weight vector and θ is the bias term. For high-dimensional nonlinear mapping functions, the kernel function is used, instead of calculating its inner product, to reduce the complexity of the algorithm [18]. The radial basis kernel function (RBF) is selected to construct the SVM model as follows:
where x and y are the input vector and the width parameter of the RBF kernel function, respectively.
2.4.5. BP Neural Network (BPNN)
The BP neural network is an error backpropagation algorithm consisting of the input layer, hidden layer and output layer, which can minimize the error between the predicted value and the true value by adjustment of the weights [19]. The calculation formula is as follows:
In the formula, vp is the p-th output, ω1 is the weight of i-number neurons in the input layer to q-number neurons in the hidden layer, ω2 is the weight of q-neurons in the hidden layer to p-neurons in the output layer, bq is the offset value of the q-number neurons in the hidden layer, a1 is the number of neurons in the input layer and a2 is the number of hidden layer neurons.
3. Results and Discussion
3.1. Calculation Results of WOE
The weight of evidence under each classification state was obtained using Formulas (2)–(4); the results are shown in Table 3.
3.2. Prediction Sensitivity of RF, SVM and BPNN
For the RF model, the random forest classifier algorithm of the scikit-learn library was called in Python language, and the samples were imported into the model and trained after evidence weight assignment. For the SVM and BPNN models, the samples were imported into IBM SPSS modeler 18.0 software for model training after evidence weight assignment. The geodisaster sensitivity indexes of the total grid points in the study area were predicted according to the training results for each model, and then the corresponding WOE-RF, WOE-SVM and WOE-BPNN result layers were generated using the ArcGIS point-to-grid tool. The natural discontinuity classification method was used to divide these into extremely high-, high-, medium-, low- and extremely low-sensitivity areas. The geological disaster sensitivity zoning provided by each model is shown in Figure 3.
3.3. Receiver Operating Characteristic Curves
At present, the generally recognized model evaluation index is the receiver operating characteristic (ROC) curve. Its vertical axis is the true positive rate (sensitivity), which describes the probability that the model is actually a geological disaster and that the model is judged to be a geological disaster. The horizontal axis is the false positive rate (1 − specificity), which describes the probability that the model is judged to be a nongeological disaster. The area under the ROC curve is the AUC value, which is in the range of 0~1. The closer it is to 1, the better the prediction effect of the model. When it is 0.5~0.6, 0.6~0.7, 0.7~0.8, 0.8~0.9 and 0.9~1.0, this means that the prediction effect fails, is poor, is general, is good and is especially good, respectively. It can be seen from Figure 4 that the AUC evaluation accuracy of WOE-RF, WOE-SVM and WOE-BPNN was 0.836, 0.807 and 0.753, respectively; WOE-RF had the best accuracy, indicating that it is more suitable for the sensitivity evaluation of land disasters in Shuicheng District.
3.4. Distribution Law of the Disaster Sensitivity Index
The mean value (Mean) and standard deviation (SD) represent the average level and dispersion of the sensitivity index distribution, respectively, which can be used to analyze the uncertainty of the prediction results of different models [20]. For all the models, the sensitivity index was divided into 100 intervals, the number of grids of different intervals were counted and the mean and standard deviation of the sensitivity index distribution were calculated. The results are shown in Figure 5. The mean value and standard deviation of each sensitivity index were sorted as follows: Mean(WOE-SVM) > Mean(WOE-RF) > Mean(WOE-BPNN), SD(WOE-RF) > SD(WOE-BPNN) > SD(WOE-SVM). Of these, the WOE-RF model had a small mean value and a large standard deviation, which distinguished the disaster sensitivity in the study area relatively well. From combining the ROC curve and the sensitivity index rule, we found that the WOE-RF model had higher accuracy and lower uncertainty.
4. Conclusions
Taking geological disasters in Shuicheng District as the research objective, a geological disaster sensitivity evaluation system was established by screening 10 environmental factors that met the independence test, such as slope. Based on the quantification of evidence weight assignment, the corresponding geological disaster sensitivity zoning was established using random forest, support vector machine and BP neural network algorithms.
Comparing the area under the ROC curve (AUC) and the distribution law of the sensitivity index of each model, the WOE-RF model was shown to have higher prediction accuracy and lower uncertainty than the WOE-SVM and WOE-BPNN models, and is therefore more suitable for use in studies evaluating sensitivity to urban land disasters.
The areas in the study area that are extremely and highly sensitive to geological disasters are mainly distributed in Bide Town, Huale Town, Yushe Town, Shaomi Town, Miluo Town, Aga Town, Guobuga Township, Duge Town, Jichang Town, Houchang Township and other parts of the area. The terrain in these areas is steep, the rock mass is broken, the river system is cut and there is intensive human engineering activity, which destroys the structure of the slope rock mass, alters the stress of the original slope, leading to slope instability and then causing geological disasters such as landslides and ground collapse. The terrain slope of the medium-sensitivity area is fairly large, and it is some distance from the river system. The stability of the rock mass under the action of the geological structure is poor, and therefore the possibility of geological disasters is medium. The low- and extremely low-sensitivity areas are flat, the terrain slope is not undulated, and there is little damage to the geological structure of the rock mass, reducing the probability of geological disasters.
Author Contributions
Z.Z. and Z.Q. performed the analysis, prepared the data, tables, and figures, and wrote the majority of the first draft of the paper. Y.W, X.Z. and L.W. contributed with paper review and editing. Conceptualization, Z.Z. and Z.Q.; Writing—original draft preparation, Z.Z. and Z.Q.; Data curation, Z.Z. and Y.W.; Formal analysis, Z.Z.; Supervision, Z.Q.; Validation, X.Z. and L.W. All authors have read and agreed to the published version of the manuscript.
Funding
This study was supported by Guizhou Science and Technology Foundation, China (Grant nos. [2019]1173 and [2014]7387).
Institutional Review Board Statement
Not applicable.
Informed Consent Statement
Not applicable.
Data Availability Statement
The datasets used or analyzed during the current study are available from the corresponding author on reasonable request.
Acknowledgments
The authors are grateful to editors and reviewers for their enthusiastic help and valuable comments. All authors contributed meaningfully to this study.
Conflicts of Interest
The authors declare no conflict of interest.
References
- Fan, H.; Lu, Y.; Hu, Y.; Fang, J.; Lv, C.; Xu, C.; Feng, X.; Liu, Y. A Landslide Susceptibility Evaluation of Highway Disasters Based on the Frequency Ratio Coupling Model. Sustainability 2022, 14, 7740. [Google Scholar] [CrossRef]
- Zhang, X.; Zhang, C.; Meng, H.; Wang, P.; Li, H. Landslide susceptibility assessment of new Jing-Zhang high-speed railway based on GIS and information value model. J. Geomech. 2018, 24, 96–105. [Google Scholar]
- Ba, Q.; Chen, Y.; Deng, S.; Wu, Q.; Yang, J.; Zhang, J. An Improved Information Value Model Based on Gray Clustering for Landslide Susceptibility Mapping. ISPRS Int. J. Geo-Inf. 2017, 6, 18. [Google Scholar] [CrossRef]
- Fan, W.; Wei, X.S.; Cao, Y.B.; Zheng, B. Landslide susceptibility assessment using the certainty factor and analytic hierarchy process. J. Mt. Sci. 2017, 14, 906–925. [Google Scholar] [CrossRef]
- Devkota, K.C.; Regmi, A.D.; Pourghasemi, H.R.; Yoshida, K.; Pradhan, B.; Ryu, I.C.; Dhital, M.R.; Althuwaynee, O.F. Landslide susceptibility mapping using certainty factor, index of entropy and logistic regression models in GIS and their comparison at Mugling-Narayanghat road section in Nepal Himalaya. Nat. Hazards 2013, 65, 135–165. [Google Scholar] [CrossRef]
- Huangfu, W.; Wu, W.; Zhou, X.; Lin, Z.; Zhang, G.; Chen, R.; Song, Y.; Lang, T.; Qin, Y.; Ou, P.; et al. Landslide Geo-Hazard Risk Mapping Using Logistic Regression Modeling in Guixi, Jiangxi, China. Sustainability 2021, 13, 4830. [Google Scholar] [CrossRef]
- Chen, T.; Niu, R.; Jia, X. A comparison of information value and logistic regression models in landslide susceptibility mapping by using GIS. Environ. Earth Sci. 2016, 75, 1–16. [Google Scholar] [CrossRef]
- Pradhan, B.; Lee, S. Regional landslide susceptibility analysis using back-propagation neural network model at Cameron Highland, Malaysia. Landslides 2010, 7, 13–30. [Google Scholar] [CrossRef]
- Xie, W.; Nie, W.; Saffari, P.; Robledo, L.F.; Descote, P.; Jian, W. Landslide hazard assessment based on Bayesian optimization–support vector machine in Nanping City, China. Nat. Hazards 2021, 109, 931–948. [Google Scholar] [CrossRef]
- Tien Bui, D.; Shahabi, H.; Shirzadi, A.; Chapi, K.; Alizadeh, M.; Chen, W.; Mohammadi, A.; Ahmad, B.B.; Panahi, M.; Hong, H.; et al. Landslide Detection and Susceptibility Mapping by AIRSAR Data Using Support Vector Machine and Index of Entropy Models in Cameron Highlands, Malaysia. Remote Sens. 2018, 10, 1527. [Google Scholar] [CrossRef] [Green Version]
- Kim, J.C.; Lee, S.; Jung, H.S.; Lee, S. Landslide susceptibility mapping using random forest and boosted tree models in Pyeong-Chang, Korea. Geocarto Int. 2018, 33, 1000–1015. [Google Scholar] [CrossRef]
- Sun, D.; Wen, H.; Wang, D.; Xu, J. A random forest model of landslide susceptibility mapping based on hyperparameter optimization using Bayes algorithm. Geomorphology 2020, 362, 107201. [Google Scholar] [CrossRef]
- Xu, C.; Xu, X.; Yu, G. The Yushu earthquake triggered landslide hazard evaluation based on weight of evidence method. Seismol. Geol. 2013, 35, 151–164. [Google Scholar]
- Li, H.; Shi, W.; Zhu, Y.; Peng, X. Study on the formation mechanism of “7:23” catastrophic landslide in Shuicheng County, Guizhou Province, China. J. Nat. Disasters 2020, 29, 188–198. [Google Scholar]
- Zheng, G.; Xu, Q.; Liu, X.; Li, Y.; Dong, X.; Ju, N.; Guo, C. The Jichang landslide on July 23, 2019 in Shuicheng, Guizhou:characteristics and failure mechanism. J. Eng. Geol. 2020, 28, 541–556. [Google Scholar]
- Huang, F.; Cao, Z.; Jiang, S.; Zhou, C.; Huang, J.; Guo, Z. Landslide susceptibility prediction based on a semi-supervised multiple-layer perceptron model. Landslides 2020, 17, 2919–2930. [Google Scholar] [CrossRef]
- Li, J.; Zhou, C. Appropriate grid size for terrain based landslide risk assessment in Lantau island, Hong Kong. Natl. Remote Sens. Bull. 2003, 7, 86–92. [Google Scholar]
- Xie, W.; Li, X.; Jian, W.; Yang, Y.; Liu, H.; Robledo, L.F.; Nie, W. A novel hybrid method for landslide susceptibility mapping-based geodetector and machine learning cluster: A case of Xiaojin county, China. ISPRS Int. J. Geo-Inf. 2021, 10, 93. [Google Scholar] [CrossRef]
- Wang, Z.; Wang, L.; Huang, G.; Han, Q.; Xu, F.; Yue, C. Research on multisource heterogeneous data fusion algorithm of landslide monitoring based on BP neural network. J. Geomech. 2020, 26, 575–582. [Google Scholar] [CrossRef]
- Li, W.; Fan, X.; Huang, F.; Wu, X.; Yin, K.; Chang, Z. Uncertainties of landslide susceptibility modeling under different environmental factor connections and prediction models. Earth Sci. 2021, 46, 3777–3795. [Google Scholar]
Figure 1.
Location of the study area and landslide distribution: (a) the geographical location of Guizhou Province in China, (b) the geographical location of Shuicheng District in Guizhou Province, and (c) the distribution of landslides and elevation in Shuicheng District.
Figure 1.
Location of the study area and landslide distribution: (a) the geographical location of Guizhou Province in China, (b) the geographical location of Shuicheng District in Guizhou Province, and (c) the distribution of landslides and elevation in Shuicheng District.

Figure 2.
Environmental factors: (a) slope, (b) aspect, (c) curvature, (d) NDVI, (e) formation lithology, (f) distance from fault, (g) distance from river system, (h) distance from road and (i) land use. (annual average rainfall omitted).
Figure 2.
Environmental factors: (a) slope, (b) aspect, (c) curvature, (d) NDVI, (e) formation lithology, (f) distance from fault, (g) distance from river system, (h) distance from road and (i) land use. (annual average rainfall omitted).

Figure 3.
Geological disaster sensitivity zoning provided by each model: (a) WOE-RF, (b) WOE-SVM, (c) WOE-BPNN model.
Figure 3.
Geological disaster sensitivity zoning provided by each model: (a) WOE-RF, (b) WOE-SVM, (c) WOE-BPNN model.

Figure 4.
The ROC curve of each model.

Figure 5.
The sensitivity exponential distribution for each model.


Table 1.
Data sources.
| Database | Data Sources |
|---|---|
| DEM, Landsat-8 image | Geospatial data cloud (https://www.gscloud.cn, accessed on 10 January 2022) |
| Fault distribution, Lithological distribution | National Geological Data Center (https://www.ngac.org.cn, accessed on 17 January 2022) |
| Distribution of geological disasters, Annual average rainfall | Resources and environment science and data center of Chinese Academy of Sciences (https://www.resdc.cn, accessed on 1 February 2022) |
| River system distribution, Road distribution | National Geographic Information Resources Directory Service System (https://www.webmap.cn, accessed on 5 February 2022) |
| Land use | Globeland30 dataset (http://www.globallandcover.com, accessed on 6 February 2022) |
Table 2.
Correlation coefficient matrix of the environmental factors.
| Factors | D1 | D2 | D3 | D4 | D5 | D6 | D7 | D8 | D9 | D10 | D11 | D12 | D13 | D14 | D15 |
|---|---|---|---|---|---|---|---|---|---|---|---|---|---|---|---|
| D1 | 1.00 | ||||||||||||||
| D2 | −0.17 | 1.00 | |||||||||||||
| D3 | −0.03 | 0.03 | 1.00 | ||||||||||||
| D4 | 0.11 | 0.04 | 0.00 | 1.00 | |||||||||||
| D5 | −0.17 | 0.90 | 0.03 | 0.03 | 1.00 | ||||||||||
| D6 | −0.17 | 0.93 | 0.03 | 0.03 | 0.91 | 1.00 | |||||||||
| D7 | −0.13 | −0.44 | −0.01 | −0.46 | −0.32 | −0.36 | 1.00 | ||||||||
| D8 | 0.20 | 0.09 | −0.07 | 0.08 | 0.03 | 0.08 | −0.15 | 1.00 | |||||||
| D9 | 0.02 | 0.00 | −0.02 | 0.01 | 0.01 | 0.00 | −0.01 | −0.08 | 1.00 | ||||||
| D10 | −0.07 | −0.07 | −0.01 | −0.01 | −0.05 | −0.07 | 0.03 | −0.10 | 0.69 | 1.00 | |||||
| D11 | −0.25 | 0.03 | −0.01 | 0.00 | 0.01 | 0.01 | −0.01 | −0.09 | 0.07 | 0.19 | 1.00 | ||||
| D12 | 0.41 | −0.08 | −0.02 | 0.03 | −0.08 | −0.08 | −0.07 | 0.09 | −0.09 | −0.07 | −0.07 | 1.00 | |||
| D13 | 0.51 | −0.09 | −0.07 | 0.01 | −0.10 | −0.09 | −0.06 | 0.21 | −0.24 | −0.21 | −0.08 | 0.24 | 1.00 | ||
| D14 | 0.13 | 0.05 | −0.01 | 0.02 | 0.04 | 0.06 | −0.08 | 0.11 | 0.05 | 0.02 | 0.02 | 0.11 | 0.12 | 1.00 | |
| D15 | 0.00 | 0.04 | 0.00 | −0.01 | 0.06 | 0.06 | 0.02 | −0.11 | −0.04 | −0.02 | −0.06 | 0.01 | −0.01 | 0.00 | 1.00 |
Table 3.
Classification and weight of evidence for each environmental factor.
| Environmental Factor | Data Type | Factor Classification | WOE | Environmental Factor | Data Type | Factor Classification | WOE |
|---|---|---|---|---|---|---|---|
| Slope | Successive type | 0°~11° | −0.568 | Formation lithology | Discrete type | Hard rock | −0.184 |
| 11°~19° | −0.097 | Relatively hard rock | −0.981 | ||||
| 19°~27° | 0.004 | Relatively soft rock | 0.601 | ||||
| 27°~38° | 0.380 | Soft and hard rock | 0.378 | ||||
| 38°~71° | 0.637 | Soft rock | 0.890 | ||||
| Aspect | Discrete type | Flat | −0.191 | Distance from fault | Successive type | 0~1.3 km | 0.637 |
| North | −0.213 | 1.3~2.8 km | 0.270 | ||||
| Northeast | −0.122 | 2.8~4.8 km | −0.096 | ||||
| East | −0.068 | 4.8~7.4 km | −0.336 | ||||
| Southeast | 0.052 | 7.4~12.9 km | −0.520 | ||||
| South | 0.167 | Distance from river system | Successive type | 0~0.5 km | 0.359 | ||
| Southwest | 0.220 | 0.5~1 km | 0.365 | ||||
| West | −0.033 | 1~1.7 km | −0.461 | ||||
| Northwest | −0.037 | 1.7~2.5 km | −1.136 | ||||
| 2.5~4.6 km | −1.192 | ||||||
| Curvature | Successive type | −10.8~−1 | −0.502 | Annual average rainfall | Successive type | 1005~1107 mm | −1.089 |
| −1~−0.3 | −0.227 | 1107~1156 mm | −0.590 | ||||
| −0.3~0.3 | 0.284 | 1156~1194 mm | 0.336 | ||||
| 0.3~1.1 | −0.166 | 1194~1238 mm | 0.533 | ||||
| 1.1~9.6 | 0.382 | 1238~1352 mm | 0.576 | ||||
| NDVI | Successive type | −1~0 | −0.296 | Distance from the road | Successive type | 0~0.2 km | 0.641 |
| 0~0.31 | 0.694 | 0.2~0.5 km | −0.211 | ||||
| 0.31~0.45 | 0.250 | 0.5~0.7 km | −0.353 | ||||
| 0.45~0.59 | 0.069 | 0.7~1.1 km | −0.456 | ||||
| 0.59~1 | −0.812 | 1.1~2.1 km | −1.026 | ||||
| Land use | Discrete type | Cropland | 0.582 | ||||
| Forest | −0.704 | ||||||
| Grass | 0.101 | ||||||
| Water | −1.121 | ||||||
| Artificial | 0.646 |
Publisher’s Note: MDPI stays neutral with regard to jurisdictional claims in published maps and institutional affiliations. |
© 2022 by the authors. Licensee MDPI, Basel, Switzerland. This article is an open access article distributed under the terms and conditions of the Creative Commons Attribution (CC BY) license (https://creativecommons.org/licenses/by/4.0/).
Share and Cite
MDPI and ACS Style
Zhang, Z.; Qian, Z.; Wei, Y.; Zhu, X.; Wang, L. Evaluation of Geological Disaster Sensitivity in Shuicheng District Based on the WOE-RF Model. Sustainability 2022, 14, 16247. https://doi.org/10.3390/su142316247
AMA Style
Zhang Z, Qian Z, Wei Y, Zhu X, Wang L. Evaluation of Geological Disaster Sensitivity in Shuicheng District Based on the WOE-RF Model. Sustainability. 2022; 14(23):16247. https://doi.org/10.3390/su142316247
Chicago/Turabian StyleZhang, Zefang, Zhikuan Qian, Yong Wei, Xing Zhu, and Linjun Wang. 2022. "Evaluation of Geological Disaster Sensitivity in Shuicheng District Based on the WOE-RF Model" Sustainability 14, no. 23: 16247. https://doi.org/10.3390/su142316247
Note that from the first issue of 2016, this journal uses article numbers instead of page numbers. See further details here.