
Impact of Uneven Flow Wastewater Distribution on the Technological Efficiency of a Sequencing Batch Reactor


Department of Environmental Engineering and Chemistry, Rzeszow University of Technology, 35-959 Rzeszów, Poland
Sustainability 2022, 14(4), 2405; https://doi.org/10.3390/su14042405
Submission received: 24 January 2022
/
Revised: 15 February 2022
/
Accepted: 16 February 2022
/
Published: 19 February 2022
(This article belongs to the Special Issue Advances in Technologies for Wastewater Treatment and Reuse)
Abstract
:Variability in the load of pollutants significantly influences the efficiency of activated sludge technology in municipal wastewater treatment plants, both in terms of flow systems and in sequencing batch reactors (SBR). Diversified inflow of wastewater to the treatment plant has a significant impact on the technological efficiency of sequencing batch reactors. Additionally, this problem is intensified in technological systems in which there is no storage tank for raw wastewater. It is assumed, however, that the flexible operation of an SBR reactor allows it to be easily adapted to a variable load of pollutants. The aim of the article is to present the effects of uneven wastewater inflow on the operation of sequencing batch reactors using the example of the wastewater treatment plant in Rabka-Zdrój (Poland). The conducted research has shown that, in wastewater treatment plants, the use of sequencing batch reactors as an independent element of biological wastewater treatment does not always ensure a high degree of pollutant removal in the event of a very uneven wastewater inflow. Therefore, the use treated wastewater equalizing tanks is recommended, which can additionally clean residual contaminants from wastewater.
1. Introduction
Among the currently used biological wastewater treatment systems, the most dominant are systems based on activated sludge technology, which have proven to be economical and efficient, and have therefore gained widespread acceptance [1,2,3]. Activated sludge technology is most often implemented in wastewater treatment plants (WWTP) as a flow-through method [4]. To date, a number of technological systems have been developed that enable the removal of carbon, nitrogen, and phosphorus compounds from wastewater using this method. These systems, such as Bardenpho, A/O, and A2/O, are known and commonly used most often in large WWTPs [5,6,7,8,9]. Despite their high efficiency, they have a number of conditions that significantly limit the possibilities of their use [10,11]. An alternative to flow-through activated sludge methods are SBR reactors. The concept of SBR technology consists in wastewater treatment using the activated sludge method, where the biological treatment processes and the separation of activated sludge from treated wastewater take place in the same tank in a sequencing mode, and the treated wastewater is discharged from the chamber in a batch manner (batch operation) [12,13,14]. Sequencing technology determines the nature of the reactor’s operation [15,16]. The principle of operation of an SBR reactor is based on the periodic repetition of the following phases, forming the full cycle of operation: (1) filling; (2) aeration/mixing-reaction; (3) sedimentation; (4) decantation and the so-called idle phase; (5) including the time between the end of decantation and the start of the next filling [12,16]. As a result of the variable aerobic–anaerobic conditions, it is possible to remove organic carbon, nitrogen, and phosphorus compounds from the wastewater through mineralization, nitrification, denitrification, and biological dephosphatation processes [13,14,17,18]. This method has been successfully and widely used for about thirty years in the treatment of municipal and industrial wastewaters [19,20]. Compared to flow systems, the use of SBR reactors allows, in some cases, to significantly intensify individual wastewater treatment processes and minimize the drawbacks of conventional systems. For this reason, SBR reactors are becoming competitive with conventional flow reactors [15,21,22]. In addition to the classic solution of SBR technology, there are a number of unconventional solutions, called modified SBRs [23,24,25,26,27,28,29].
The variability of the load of pollutants has a significant impact on the efficiency of activated sludge technology [4]. In large municipal facilities, the peak flow and the associated high pollutant loads are dispersed. In the case of small and medium-sized wastewater treatment plants, such rapid changes in flow rate and in the concentration of pollutants in wastewater, due to the short retention times, may cause a deterioration of biological treatment efficiency, which, in turn, translates into a worse quality of treated wastewater [30,31]. Due to the nature of their operation, SBR reactors can demonstrate resistance to both rapid changes in the concentration of pollutants in incoming wastewater, and large fluctuations in their inflow. It is assumed that the flexible operation of an SBR reactor allows it to be easily adapted to a variable load of pollutants. Hydraulic underloads and over-loads, resulting from uneven inflow in batch systems, can be minimized by using a retention-equalization tank in the technological system of the treatment plant [32], or a variable work cycle [12], or by changing the raw wastewater dosage in a continuous or semi-continuous manner [14,33,34,35]. Retention tanks in SBR technology are most often used to minimize the unevenness of the wastewater inflow and fulfil the role of equalizing tanks and equalize the conditions and compositions of wastewater directed to the batch reactor. The use of retention tanks protects the SBR treatment plant against the effects of so-called hydraulic and organic shock, but increases costs [36]. In the absence of retention tanks, the operation of batch reactors may be disturbed, which results in an unstable wastewater treatment process.
The aim of the article is to present the effects of uneven wastewater inflow on the operation of sequencing batch reactors using the example of the wastewater treatment plant in Rabka-Zdrój (Poland). The novelty of the study is the comparison of the operation and efficiency of two SBR reactors in the wastewater treatment plant depending on uneven wastewater inflow.
2. Materials and Methods
2.1. Characteristics of the Rabka-Zdrój WWTP
Rabka-Zdrój is a spa and tourist town located in Poland (Lesser Poland Voivodeship), situated on the border of two mountain ranges, the Gorce and Beskid Wyspowy, at the mouth of the Poniczanki, Słonki and Skomielnianka streams to the River Raba. The city is inhabited by over 12 thousand residents. The number of tourists visiting the city fluctuates and is around ten (or more) thousand people during the year.
The mechanical and biological wastewater treatment plant in Rabka-Zdrój is designed for the treatment of municipal wastewater in the amount of Qd_proj = 8700 m3/d, Qdmax_proj = 10,140 m3/d, Qhmax_proj = 725.5 m3/h and 32,600 PE (population equivalent). The vast majority of the wastewater flows through gravity sanitary collectors, and small amounts are brought in by means of slurry tankers. The technological system of the treatment plant consists of 2 mechanical screens, a horizontal aerated grit chamber, a wastewater pumping station, two SBR reactors, and a pond equalizing the outflow of treated wastewater. The treated wastewater flows into the River Raba, which is a right tributary of the Vistula River (the Baltic Sea catchment area). The sludge part of the Rabka-Zdrój WWTP consists of a gravity sludge thickener, thickened sludge pumping station, sludge storage tank, belt filter press, and installation for sludge hygienization with CaO burnt lime (Figure 1). The permissible concentrations of pollutants in the treated wastewater cannot exceed the following parameters: BOD5 = 15.0 g O2/m3 (biological oxygen demand), COD = 125.0 g O2/m3 (chemical oxygen demand), TSS = 35.0 g/m3 (total suspended solids), TN = 15.0 g N/m3 (total nitrogen) and TP = 2.0 g P/m3 (total phosphorus) (water permit).
2.2. Sequencing Batch Reactor in the Rabka-Zdrój WWTP
SBR reactors are concrete tanks with a diameter of 32 m and an active depth of 6.5 m. The active volume of each of the reactors is 5225 m3. Each reactor is equipped with the following equipment:
- -
- Fine bubble aeration system with 1560 disc diffusers;
- -
- Two submersible mixers with a capacity of 10 kW;
- -
- Decanter of treated wastewater with a capacity of 1450 m3/h;
- -
- Excess sludge pump with a power of 9.0 kW and a capacity of 162 m3.
For the supplementary chemical precipitation of phosphorus, a PIX113 type coagulant (iron(III) sulfate) is used, which is dosed directly into the SBR reactors, near the place where the mixers are installed.
Two rotary blowers with a capacity of 5100 m3/h and an engine power of 160 kW each are used for the aeration of SBR reactors. From the blower station, the air is led through one above-ground compressed air line, which is divided into two pipes, supplying air to the grate installed in each of the SBR reactors. These pipes are equipped with gate valves, and shut off the air supply during phases of the purification cycle in which aeration must be eliminated (anoxic phase, sedimentation phase, decantation phase, idle phase). The parameter controlling the operation of the blower in the aeration phases may be the oxygen concentration, which is measured using an oxygen probe that is installed in each SBR reactor. Each of the reactors is equipped with equipment for measuring the level of wastewater, dissolved oxygen concentration, temperature, redox potential, sludge density and an emergency overflow, with discharge to the pumping station of sanitary and delivered wastewater. In each reactor, a bottom drain is installed, which enables the complete emptying of the reactor and the directing of its contents to a collecting well by wastewater pump. The biological logic reactors work in parallel. Their work cycle depends on the amount of wastewater delivered to the treatment plant. The operating cycle of each reactor runs automatically. All technological equipment—including the decanter, mixers, and aeration system—are controlled from a technological switchboard and also have the possibility of manual control, which allows any operation regime to be entered for each piece of equipment. The equipment is controlled automatically in a time cycle or as a function of the amount of wastewater flowing into the facility. It is also possible to automatically change or correct the cyclogram in the event of rapid and intensive inflow of wastewater to the treatment plant. When the amount of wastewater does not exceed Qd = 8700 m3/d, the basic cycle time tC = 8 h is used. In the case of an increase in wastewater inflow, the cycle time is reduced to tC = 6 h. The basic time cycle of the sequencing batch reactor consists of four phases: 4 h filling (including: 2.25 h mixing–denitrification and biological dephosphatation; 1.75 h aeration–nitrification), 2 h aeration (nitrification), 1 h sedimentation, 1 h decantation. In the case of a 6 h cycle, the filling phase is shortened to 3 h and the aeration phase to 1 h (Table 1).
2.3. Analitycal and Statistical Methods
The analysis of the impact of the variability of the wastewater inflow on the operation and efficiency of the Rabka-Zdrój WWTP was carried out in a multi-criteria manner, based on the operating results for the full research year.
An analysis of the daily wastewater inflow (Qd) to the treatment plant was carried out (number of measurements n = 365).
A detailed analysis of the hydraulic indicators of SBR1 and SBR2 sequencing batch reactor operations was performed—flow rate (Q), reactor filling phase volume (VF), and decanting factor (fD).
The following parameters were considered: the irregularity coefficient a (Equation (1)) and the relative amplitude A (Equation (2)) for individual SBR reactors [37].
a = V_max/V_min
A = (V_max − V_min)/V_av
V_min, V_max, V_av are minimum, maximum, and average values, respectively.
The α coefficient is a measure of the irregularity of the VF wastewater inflow to the SBR reactor in relation to the proportionality of the maximum and minimum flows in the considered time period. Relative amplitude, A, on the other hand, determines the relation of the range to the mean value and informs the variability of the wastewater inflow.
Basic descriptive statistics were determined—position measures (mean, minimum, maximum value) and dispersion measures (standard deviation SD, coefficient of variation (CV)) for daily flow Qd, flow rate (Q), and the volume of the batch reactor filling phase (VF) for the SBR1 and SBR2 reactors.
In order to determine the efficiency of wastewater treatment in SBR reactors, measurements of pollutant removal in the SBR1 and SBR2 reactors (working in parallel) were carried out. These tests were performed twice a month and included a 24-measurement series (n = 24), which checked the quality of the raw wastewater flowing into the SBR1 and SBR2 reactors and the treated wastewater from the SBR1 and SBR2 reactor outflow (pH, COD, BOD5, TSS, N-NH4, TN, and TP) and the technological parameters of the activated sludge (MLSS—mixed liquor suspended solids). Wastewater tests were carried out in accordance with Polish standards. The content of activated sludge biomass (MLSS) in the reactor was determined using the gravimetric method. SBR1 and SBR2 reactors were compared in terms of hydraulic conditions and technological parameters (F/M ratio—food-to-microorganisms ratio, OLR—organic loading rate) and the efficiency of pollutants removal from wastewater. Based on the test results, the removal efficiency (RE%) of the pollution was determined using Equation (3).
RE% = 100 × (X_in − X_out)/X_in %
X_in—value of pollution indicator for raw wastewater, g/m3;
X_out—value of pollution indicator for treated wastewater, g/m3.
Statistical analyses were performed to identify the major cause and effect relationships. One-dimensional linear correlations were used in order to simplify the analyses, which were carried out in Excel 2016. As for many of the examined properties, no normal distribution was obtained, and the statistical method without distribution was used. Pearson’s correlation coefficient (r) was used to obtain linear estimates. Pearson’s r always ranges from −1 to +1, with −1 being a perfect negative correlation and +1 being a perfect positive correlation; 0 means no relationship. In turn, non-linear relationships were assessed by regression analysis. Correlations were considered statistically significant at the 95% confidence interval (p < 0.05). The Stanisz scale was used to assess the degree of dependence between the features [38].
Multiple regression analysis was used to assess the effect of pollutant load flowing to the SBR reactor on the concentration of pollutants in the outlet of the SBR reactor. The purpose of regression analysis is to investigate the relationship between multiple independent variables and the dependent variable, which must be numerical in nature.
The analysis of differences in the mean values of the obtained wastewater treatment parameters in SBR1 and SBR2 reactors was based on the Mann–Whitney U test. A significance level of α = 0.05 was adopted for the study.
3. Results and Discussion
3.1. Characteristics of the Wastewater Inflow to SBR Reactors
In the analyzed research facility, the inflow of wastewater was very diversified. The daily flow ranged from 3769 to 10,994 m3/d, with an average value for the period under consideration at the level of Qdav = 7075 ± 1887.7 m3/d. Compared to other wastewater systems in Poland [30,39,40,41], the course of the daily flow variability to the wastewater treatment plant in Rabka-Zdrój was mild, but with noticeable extremes above 10,000 m3/d. This resulted from the characteristics of the catchment area from which the municipal wastewater flows into the treatment plant. The coefficient of variation of the wastewater inflow to the treatment plant in the analyzed period was 0.27. The amount of wastewater in the rainy season was harmonized with rainfall (Figure 2), although no statistically significant correlation between the observed Qd flow and the amount of atmospheric precipitation in the catchment area was found. The wastewater treatment plant operated with a variable inflow of wastewater at the level from 43.3% to 126.4%, and on average was 81.3% of the planned capacity Qd_proj. In annual terms, the most frequently occurring flows were in the range of 5000–6000 m3/d (80 days) and 6000–7000 m3/d (64 days). The treatment plant has a significant hydraulic reserve, although there were wastewater flows higher than Qdmax_proj. Daily flows, Qd, higher than the designed maximum daily flow, Qdmax_proj, occurred 33 times during the year, i.e., 9% of observations. On the other hand, the lowest flows below 50% of the computational load, Qdav_proj, occurred for only 15 days (approx. 4% of observations).
The high unevenness of the wastewater inflow to the Rabka-Zdrój WWTP is associated with increased tourist traffic in the summer period, and with it the increasing share of the amount of wastewater from unsewered accommodation buildings used periodically. Rabka-Zdrój and the surrounding towns constitute an attractive tourist region, hence there is a dynamic increase in the number of people visiting this area during the summer or winter seasons. Similar observations are recorded in the case of other treatment plants for health resorts and tourist destinations [39,42,43].
The unevenness of the wastewater inflow to the treatment plant translated to a large extent into the hydraulic operating conditions of the SBR1 and SBR2 reactors. The daily amount of wastewater treated in the individual batch reactors in a 24 h cycle was also very irregular (Figure 2). The flow rate in the SBR1 reactor ranged from 625.4 m3/d to 1404.3 m3/d, with the average value being Qd_SBR1 = 971.4 ± 177.1 m3/d. In the case of the SBR2 reactor, the average value of the flow rate was Qd_SBR2 = 970.4 ± 177.6 m3/d, with the range from 595.3 m3/d to 1403.1 m3/d.
The coefficient of variation for the flows in both the first and the second reactors was 0.18. The difference of wastewater flows between the reactors ranged from 0.5 to 202.9 m3/d. The average difference between the amount of wastewater supplied to the SBR1 and SBR2 reactors was 45.8 ± 39.2 m3/d, which accounted for approx. 5% of the average wastewater flow rate to the reactors.
In the analyzed period, SBR reactors operated in a very uneven manner. The amount of wastewater supplied during one VF cycle was 470.7–1557.7 and 253.2–1722.2 m3/cycle, respectively, in SBR1 and SBR2 (Figure 3). In turn, the average VF inflow was similar in the reactors and amounted to 981.8 ± 177.1 m3/cycle (SBR1) and 970.4 ± 177.6 m3/cycle (SBR2), respectively. The irregularity coefficient a was at the level of 3.31 and 6.8, while the relative amplitude (A) reached values of 1.1 and 1.5, for the SBR1 and SBR2 reactors, respectively. The frequency of specific reactor filling volumes was estimated from the histogram. The most frequently appearing volumes of the VF filling phase in the SBR1 and SBR2 reactors were in the range of 750–1000 and 1000–1250 m3/cycle (Figure 4). The average hydraulic load of SBR reactors during the cycle was approx. 75% of the design value, being 1305 m3/cycle, therefore the hydraulic load of the reactors was unstable. The value of the CV for VF in the reactors was similar for the reactors and amounted to 1.26 (SBR1) and 1.27 (SBR2). The irregular volume of VF wastewater pumped to the reactors during the day resulted from the cyclogram of the system operation. The SBR1 reactor was filled at 2, 10 and 18 o’clock, while the SBR2 reactor was filled at 6, 14 and 22 o’clock with the standard cycle of 8 h. In turn, with the cycle shortened to 6 h, the filling was at 1, 7, 13 and 19 (SBR1) and at 4, 10, 16 and 22 (SBR2).
The SBR2 reactor operated with a much greater unevenness of wastewater inflow in each cycle, which resulted, inter alia, from wastewater inflow at night and in the afternoon during the so-called daily peak inflow of wastewater. The reactor filling dynamics were not stable. Sudden or rapid inflows of wastewater to the reactors were noted, as a result of which there were frequent changes in the cyclogram from 8 h to 6 h and vice versa after regulating the inflow of wastewater to the treatment plant. The hydraulic unevenness of SBR reactors was a direct result of the lack of a raw wastewater tank in the technological system.
Variable hydraulic conditions of SBR reactors influenced the dynamics of the decanting factor (fD). The range of the fD factor was 0.09–0.30 and 0.05–0.33, respectively, in SBR1 and SBR2 (Figure 5). The average ratio was 0.19 for both reactors and accounted for 76% of the calculation value, which was fD_proj = 0.25. Knowledge of the range of changes of the fD factor allows for optimal planning of the dynamics of inflow to SBR reactors, taking the nature of activated sludge sedimentation into account. The sludge volume index is related to the decanting factor [12]. By changing the fD factor, the amount of wastewater fed to the SBR reactor can be increased or decreased. Accordingly, the reaction phases (tR) should be lengthened or shortened, and then the cycle time (tC) [44]. A statistically significant relationship was found between the wastewater inflow and the filling level in the reactor, thanks to which it was possible to predict its active capacity and relatively fast and flexible change of the operating cycle time.
3.2. The Load of Pollutants in the Wastewater Flowing into the SBR Reactors
The quality of wastewater flowing into individual SBR reactors was significantly differentiated, as shown in Table 2. The nature of the wastewater corresponded to the parameters of municipal wastewater [9,45]. No high concentrations of organic compounds and biogenic compounds were found. A review of the literature shows cases of the inflow of wastewater with a high concentration of pollutants [40,46,47].
Data aggregation shows that the parameters of the wastewater depended on the time of wastewater inflow to the treatment plant and, consequently, to individual SBR reactors. The concentrations of the pollution indicators were characterized by considerable fluctuations, as evidenced by the high value of CV > 0.3. The obtained values of the CV of pollutant concentrations in wastewater were comparable to the values given by Chmielowski et al. [46], Czarnota and Masłoń [48], and Szczerbińska et al. [49], although there are cases of higher variability of the composition of wastewater [40].
Due to the lack of a retention tank in the technological system, the SBR reactors were supplied with wastewater of a different physicochemical composition. The Mann–Whitney-U test unambiguously showed statistically significant differences between the mean values of the pollution indexes (BOD5, COD, TN, TSS, TP), which proves that the flowing wastewater to the reactors was different. Thus, the SBR1 and SBR2 reactors were operated under different hydraulic conditions and with a different substrate load. Analysis of the results showed a relationship between the volume of VF wastewater flowing into the SBR reactor and the concentration of pollutants (Figure 6).
The parameters of wastewater flowing into the SBR2 reactor were more dependent on the amount of wastewater than in the case of the SBR1 reactor. This results directly from the cyclogram of the SBR2 reactor, because the inflow of wastewater occurred at night and in the afternoon during the so-called daily peak of the wastewater inflow. It also confirms that the quality of wastewater changes dynamically during the day [50], with the greatest variability observed in the case of COD, TN, and TP [51]. The structure of the pollutant load in household–domestic wastewater depends on many factors, e.g., the activity of the inhabitants. Therefore, we can observe, for example, a weekend effect, in which the pollutant load in the wastewater is about 10% lower than on the other days of the week [52]. In the treatment plant in question, a typical profile of pollutants flowing into the treatment plant and then directly to the batch reactors is observed.
Changes in the amount of wastewater flowing to the SBR reactor and different concentrations of individual pollutants translated into the size of pollutant loads in particular cycles (Figure 7).
The distribution of organic pollutant loads expressed by the BOD5 index fluctuated in the range of 118.9–348.7 kg O2/cycle (SBR1) and 97.5–357.9 kg O2/cycle (SBR2). The COD load per cycle was 207.3–909.6 kg O2/cycle and 195.0–727.8 kg O2/cycle, respectively for SBR1 and SBR2. The total suspended solids loading ranged from 137.1–579.3 kg/cycle in SBR1 and 108.5–587.1 kg/cycle in SBR2. The loads of biogenic compounds between the batch reactors showed a significant difference. The N-NH4 load was 4.1–23.8 kg N/cycle and 5.8–24.3 kg N/cycle in SBR1 and SBR2, respectively. In turn, the load of total nitrogen reached the values of 10.5–53.3 kg N/cycle (SBR1) and 16.0–51.0 kg N/cycle (SBR2). The range of total phosphorus loads in the inflow was 2.2–12.0 kg P/cycle and 2.2–11.8 kg P/cycle in SBR1 and SBR2, respectively. The variability of pollutant loads flowing to the reactor was comparable, on the level of 30–40%. The Mann–Whitney-U test clearly showed statistically significant differences between the mean values of pollution indicators (BOD5, COD, TN, TSS and TP), which proves that the pollutant loads flowing into the reactors were not comparable.
On the basis of the data, the mutual correlation of the tested parameters in the inflow to the SBR reactors was determined, creating a correlation matrix (Table 3). The values of the co-factors indicate a significant influence of raw wastewater parameters on the shaping of the variability of the pollutant load flowing into the batch reactor during the cycle, while significant differences were found between the SBR1 and SBR2 reactors.
3.3. Influence of Uneven Wastewater Inflow on Technological Parameters of Sequencing Batch Reactors
Based on the analysis of the quantity and quality of wastewater flowing to individual SBR reactors, it should be clearly stated that SBR reactors operated at a different substrate load (Table 4), as a result of which a different efficiency of removing pollutants from wastewater was obtained.
The high concentration range of MLSS in SBR reactors resulted from a very variable hydraulic load. There is a visible increase in the amount of activated sludge and its age in the autumn and winter season to counteract the effects of low temperatures. There are differences in the values of the biomass concentration in both reactors, but these are not significant differences, they only result from the natural process variability in the current operation of the reactors. Nevertheless, the biomass concentration of activated sludge in the reactors remained at the level of 2–4 kg/m3, which is typical for batch systems [14,53]. The analysis of the results showed a cause-and-effect relationship between the amount of wastewater flowing into the reactors and the technological parameters. SBR1 and SBR2 reactors operated with a wide range of OLR and F/M ratio values. The Mann-Whitney U test showed a statistically significant difference between the average values of OLR per cycle and F/M ratio per cycle, so these two reactors should be considered as completely separate technological systems for biological wastewater treatment. The spread of these values was relatively wide. The F/M ratio is the key parameter tested in activated sludge processes [10]. For domestic wastewater treatment with nitrification requirement, the F/M ratio should be 0.05 to 0.1. For domestic wastewater treatment without nitrification, the F/M ratio should be between 0.15 and 0.4 [14]. Additionally, attention should be paid to the possibility of the formation of a different biocenosis of activated sludge in the SBR1 and SBR2 reactors. Lee et al. [54] showed that the continuous supply of incoming wastewater containing different species of bacteria to activated sludge reactors can influence the population of microorganisms and the temporal dynamics of the bacterial community. The SBR reactor can adapt to different pollutant loads through the gradual acclimatization of biomass, which ensures the stability of the wastewater treatment process, even in a system where the F/M ratio is low [55]. The pH value of the wastewater does not change much (7.0–7.6) and is not a technological problem for biological reactors. In the case of temperature, on the other hand, large fluctuations are observed, related to the climatic conditions typical for piedmont villages. The differences between the reactors are small, and the dynamics of changes relates to the annual variability, with minimum temperatures in winter at the level of 5–6 degrees Celsius, which may hinder the operation of biological processes and may reduce the rate of nitrification.
3.4. Assessment of the Efficiency of Sequencing Batch Reactors
The qualitative characteristics of raw and treated wastewater in SBR1 and SBR2 reactors are shown in Figure 8, and the correlation matrix of various parameters is given in Table 2. The applied cyclogram of the sequencing batch reactor operation in the Rabka-Zdrój WWTP enables the integrated removal of carbon, nitrogen and phosphorus compounds. The combination of aerobic and anoxic conditions allows for classical nitrification and further denitrification. On the other hand, the use of anaerobic conditions during the filling of the batch reactor, followed by the aerobic conditions enable the removal of phosphorus by the EBPR process (enhanced biological phosphorus removal).
The concentration of organic substances determined by the BOD5 and COD indexes in the outlet from the SBR1 reactor was 0.16–52.0 g O2/m3 and 0.8–162.0 g O2/m3, respectively. On the other hand, the value of pollution indicators in treated wastewater in the SBR2 reactor fluctuated in the range of 2.2–68.0 g O2/dm3 (BOD5) and 8.8–160.0 g O2/m3 (COD). The BOD5 and COD removal efficiency was 78.3–99.9% and 70.8–99.6% in SBR1 and 65.1–98.8% and 59.4–98.5% in SBR2, respectively. The unevenness of the wastewater inflow to the SBR reactors significantly influences the removal of the suspension from the wastewater. The TSS concentration in the outflow of the SBR1 and SBR2 reactors was 2.2–124.0 g/m3 and 2.0–165.0 g/m3. The total suspended solids removal efficiency was 54.9–99.3% (SBR1) and 26.3–99.3% (SBR2). The high content of total suspended solids in the reactor effluent is a direct result of the contamination of the first phase of the tapping during decantation. In such cases, it becomes advisable to recirculate a certain volume of wastewater discharged during the decantation phase to the beginning of the technological system of the wastewater treatment plant [12]. The nitrification process took place in a very diverse manner, albeit to a high degree. Technological parameters were favorable for the implementation of nitrification. MLSS concentrations greater than 2 kg/m3 are commonly used for nitrification, and higher MLSS concentrations are often required at low wastewater temperatures (≤15 °C). As MLSS concentration increases, the SBR F/M ratio decreases. While F/M ≤ 0.08 promotes nitrification [14]. Efficiency of ammoniacal nitrogen oxidation was noted at the level of 87.9–99.8% and 91.9–99.8% in the SBR1 and SBR2 reactors, respectively. The concentration of N-NH4+ in the outflow from the SBR1 and SBR2 reactors was 0.03–1.7 g N/m3 and 0.03–2.2 g N/m3. Consequently, the concentration of total nitrogen in treated wastewater reached the level of 1.1–9.3 g N/m3 (SBR1) and 0.9–12.4 g N/m3 (SBR2). Thus, the efficiency of TN removal was 71.4–97.1% and 58.1–96.4% in the SBR1 and SBR2 reactors, respectively. For comparison, in the Sokółka WWTP (Qd av = 6000 m3/d) in the SBR reactor, 98.7% nitrification of ammonium nitrogen and 90.4% removal of total nitrogen from wastewater were obtained with a 9.5 h cycle of operation [56]; in the Hajnówka WWTP (Qd av = 6000 m3/d), 95.6% nitrification and 91.5% nitrogen removal were recorded in the SBR reactor [57]; in the Olecko WWTP (Qd av = 3600 m3/d) in the SBR reactor with a 12 h cycle (including 4.7 h nitrification and 3.1 h denitrification) the efficiency of total nitrogen removal was 87.6–98.3%, and the average was 92.6% [58].
In terms of the EBPR process, phosphorus removal from wastewater was recorded at the level of 24.9–95.1% (SBR1) and 70.4–95.3% (SBR2), with the quality of treated wastewater being 0.25–3.4 g P/m3 and 0.21–4.8, respectively g P/m3. For comparison, in other wastewater treatment plants in Poland, the removal of phosphorus from wastewater in SBR reactors was achieved: 96.4% (the Hajnówka WWTP) [57], 87.2–98.9% (the Olecko WWTP) [58], and 95.1% (the Sokółka WWTP) [56]. The qualitative characteristics of wastewater, in terms of organic compounds, nitrogen and phosphorus, favor the occurrence of efficient processes of removing biogenic compounds, because their concentrations in raw wastewater are much lower than those observed in typical municipal wastewater, e.g., BOD5 or total phosphorus (Table 1). This is undoubtedly due to the large dilution of the wastewater flowing into the treatment plant at different times of the day.
However, other factors, such as the inflow of industrial and non-sanitary wastewater, mean that such low concentrations of organic compounds are not observed. The influence of non-domestic wastewater is also evidenced by the increased presence of pollutants that are difficult to decompose, resulting in values of the COD/BOD5 ratio > 2. In the inflow to the reactors, the average value of the COD/BOD5 ratio was 3.9 ± 3.1 (SBR1) and 3.8 ± 1.7 (SBR2). Noteworthy is the very high variability of the COD/BOD5 ratio, which, determined with the coefficient of variation, was as high as 15.3 and 7.2 in SBR1 and SBR2, respectively. As a consequence, the relationship between BOD5 and total nitrogen and total phosphorus is high, clearly favoring biological removal of biogenic compounds, largely due to their assimilation to the synthesized biomass.
The influence of the OLR on the efficiency of pollutant removal is shown in Figure 9. Statistically significant relationships were found between the load of organic pollutants in the reactor and the efficiency of nitrogen removal from the wastewater. In the remaining cases, the dependencies were very weak or moderate (r < 0.5).
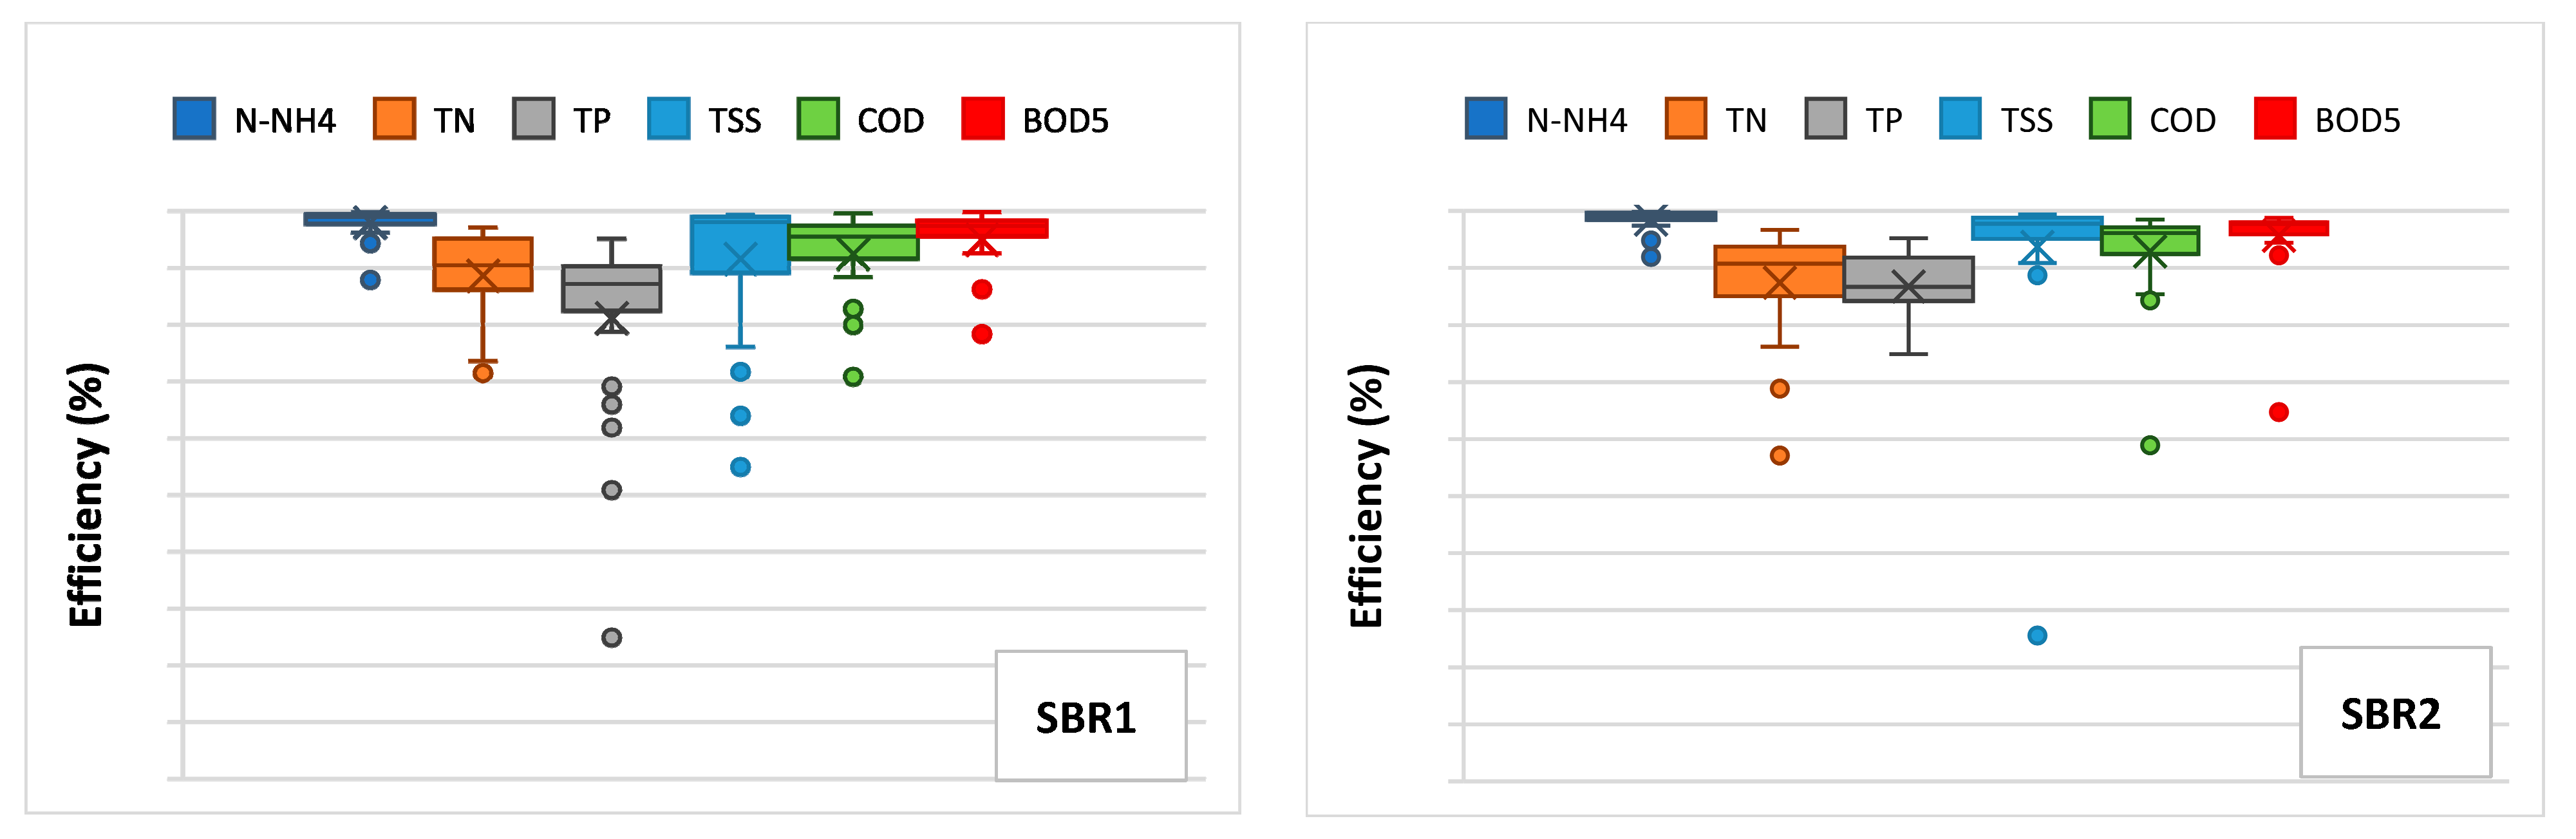
The quality parameters of the wastewater treated in the SBR1 reactor indicate a lower dispersion in comparison with the outflow from the SBR2 system. The unevenness of the pollutant loads flowing into the SBR reactors translated into irregular qualitative characteristics of the treated wastewater. This is reflected in the values of the coefficients of variation for the concentrations of pollutants in the effluent–from 0.6 to 1.48 (SBR1) and from 0.7 to 1.66 (SBR2). These are very large values compared to other values given in the literature. For example, the CV coefficient for concentrations of pollutants in treated wastewater was 0.23–0.6 in the Kolbuszowa Dolna WWTP (Qdav = 3600 m3/d) [46], 0.26–0.97 in the Gorlice WWTP (Qdav = 10,750 m3/d) [40]. Figure 10 presents a statistical comparison of the obtained results of the efficiency of removing pollutants from wastewater in SBR reactors in the Rabka-Zdrój WWTP. The results are presented in the form of a box plot showing the mean value, median (Q2), lower quartile (Q1), upper quartile (Q3), lower and upper extreme observations. On the basis of the obtained results, after discarding extreme and outlier observations, it was observed that the SBR1 reactor is characterized by a higher stability of removing pollutants from wastewater than the SBR2 reactor.
Statistical analysis of the results showed that the concentration of pollutants in the outflow of the SBR reactor can be described with the use of a linear model (Table 5).
The analysis of the results clearly shows that diversified inflow of wastewater affects the technological efficiency of sequencing batch reactors. Additionally, this problem is intensified because the technological system does not include a storage tank for raw wastewater. On the one hand, flexible operation of SBR reactors is observed in terms of the inflow of various amounts of wastewater, even rapid flows with a value above Qdmax, on the other hand, a deterioration in the quality of treated wastewater is observed. This is due to several reasons. First of all, the dynamics of the wastewater inflow to individual SBR reactors means that in SBR1 and SBR2 reactors different microbiological conditions may prevail, i.e., a different population of microorganisms is generated. Different types of biocenosis in activated sludge are responsible for the speed of wastewater treatment processes. Secondly, various loads of pollutants flow into SBR reactors, as a result of which one of them is more often burdened with a greater load of pollutants than the other, which results in deterioration of the efficiency of the processes of removing pollutants from wastewater, e.g., nitrification. In this case, the SBR reactor operation cyclogram is not adapted to the load of pollutants. It is also possible for the sedimentation properties of the activated sludge to deteriorate and for foam to form on the surface. Third, the irregular inflow of wastewater produces a different filling level of the SBR reactor. The height of the activated sludge layer influences the oxygenation capacity in fine bubble aeration systems. This also translates into the efficiency of oxygenation and electricity consumption. In this case, it is necessary to properly model and control the aeration system in the SBR reactor [59,60] In the case of rapid and intensive inflows of wastewater to the wastewater treatment plant, there was a change in the 8 h cycle to the 6 h cycle in SBR reactors, which is a compensation for the buffer capacity of the facility. However, at that time, cases of deterioration in the efficiency of total suspended solids removal from wastewater were observed. The analysis of the SBR system issues shows that knowledge of the dynamics of the wastewater inflow to the treatment plant allows optimization of the operation of SBR reactors, and the prediction of the wastewater inflow allows for a simple change of the reactor cyclogram [37]. The forecast of wastewater inflow to the treatment plant is of great importance for the optimization of SBR reactors [41]. In order to minimize the effects of uneven wastewater inflow to the SBR reactor, it is reasonable to adjust the cyclogram and the method of filling to short-term daily, as well as long-term and even seasonal changes in the composition of wastewater and pollutant load (1), adapting to organic shock loading caused by changes in the organic and/or hydraulic load by changing the cycle time, the length of the individual phases of the process, the aeration time and the VF factor to the current needs (2).
The analysis of the results showed that in the Rabka-Zdrój WWTP, sequencing batch reactors as an independent element of biological wastewater treatment do not ensure the required degree of pollutant removal in terms of the water permit. Therefore, in the technological system, an equalizing tank for treated wastewater (L = 80 m, B = 34 m, Hactive = 0.8 m) is used, which is an additional stage of wastewater treatment. The purpose of the equalizing tank is to eliminate the shock discharge of a large amount of wastewater flowing out of SBR reactors in a short-term (usually approx. 1 h) decantation phase and their even discharge to the receiver, equalizing the quality of wastewater discharged from two reactors in subsequent cycles of their operation and keeping the residual suspended solids in the wastewater discharged from SBR reactors during the first decantation phase or in the event of decanter failure. Therefore, the equalizing tank is a safety buffer against the excessive outflow of wastewater from the treatment plant to the receiver. It is also a checkpoint for the compliance of the wastewater treatment plant with the conditions of the water-legal permit. A disadvantage of the equalizing tank operation is the necessity to clean the bottom of sediment once a year on average. Due to the use of an equalizing tank, the treatment plant meets the requirements of the water permit for treated wastewater.
4. Conclusions
The research has shown that diversified inflow of wastewater to the treatment plant has a significant impact on the technological efficiency of sequencing batch reactors. Additionally, this problem is intensified in technological systems in which there is no storage tank for raw wastewater, as is the case in the in the Rabka-Zdrój WWTP.
SBR reactors were characterized by flexible operation in terms of inflow of various amounts of wastewater, even sudden flows with a value above Qdmax; however, a deterioration in the removal of pollutants from wastewater and a deterioration in the quality of treated wastewater were observed. Large fluctuations in the wastewater inflow were not equalized, as a result of which a shock charge could occur in SBR reactors. In the case of rapid and intensive inflows of wastewater to the wastewater treatment plant, there was a change of the 8 h cycle to the 6 h cycle in SBR reactors, which is a compensation for the buffering capacity of the facility.
The conducted research has shown that in wastewater treatment plants the use of sequencing batch reactors as an independent element of biological wastewater treatment does not always ensure a high degree of pollutant removal in the event of a very uneven wastewater inflow. Therefore, it is recommended to use treated wastewater equalizing tanks, which can additionally clean residual contaminants from the wastewater.
Funding
The study was carried out in the framework of the statutory funds for research, financedby the Ministry of Science and Higher Education.
Institutional Review Board Statement
Not applicable.
Informed Consent Statement
Not applicable.
Data Availability Statement
Not applicable.
Acknowledgments
The kind help from the staff of the Department of Water Works and Sewage Ltd. in Rabka-Zdrój (Poland) is gratefully acknowledged.
Conflicts of Interest
The author declares no conflict of interest.
References
- Moretti, C.J.; Das, D.; Kistner, B.T.; Gullicks, H.; Hung, Y.-T. Activated Sludge and Other Aerobic Suspended Culture Processes. Water 2011, 3, 806–818. [Google Scholar] [CrossRef]
- Machineni, L. Review on biological wastewater treatment and resources recovery: Attached and suspended growth systems. Water Sci. Technol. 2019, 80, 2013–2026. [Google Scholar] [CrossRef] [PubMed]
- Goffi, A.S.; Trojan, F.; de Lima, J.D.; Lizot, M.; Thesari, S.S. Economic feasibility for selecting wastewater treatment systems. Water Sci. Technol. 2019, 78, 2518–2531. [Google Scholar] [CrossRef] [PubMed]
- Ghangrekar, M.M.; Behera, M. Suspended Growth Treatment Processes. In Comprehensive Water Quality and Purification; Ahuja, S., Ed.; Elsevier: Amsterdam, The Netherlands, 2014; pp. 74–89. [Google Scholar] [CrossRef]
- Ontiveros, G.A.; Campanella, E.A. Environmental performance of biological nutrient removal processes from a life cycle perspective. Bioresour. Technol. 2013, 150, 506–512. [Google Scholar] [CrossRef]
- Orhon, D. Evolution of the activated sludge process: The first 50 years. J. Chem. Technol. Biol. 2015, 90, 608–640. [Google Scholar] [CrossRef]
- Kim, M.; Nakhla, G.; Keleman, M. Modeling the impact of food wastes on wastewater treatment plants. J. Environ. Manag. 2019, 237, 2344–2358. [Google Scholar] [CrossRef] [PubMed]
- Zhang, S.H.; Huang, Z.J.; Lu, S.J.; Zheng, J.; Zhang, X.X. Nutrients removal and bacterial community structure for low C/N municipal wastewater using a modified anaerobic/anoxic/oxic (mA2/O) process in North China. Bioresour. Technol. 2017, 243, 975–985. [Google Scholar] [CrossRef]
- Karczmarczyk, A.; Bus, A.; Baryła, A. Assessment of the Efficiency, Environmental and Economic Effects of Compact Type On-Site Wastewater Treatment Plants—Results from Random Testing. Sustainability 2021, 13, 982. [Google Scholar] [CrossRef]
- Henze, M.; van Loosdrecht, M.C.M.; Ekama, G.A.; Brdjanovic, D. Biological Wastewater Treatment: Principles, Modeling, and Design; IWA Publishing: London, UK, 2008. [Google Scholar] [CrossRef] [Green Version]
- Hauduc, H.; Rieger, L.; Oehmen, A.; van Loosdrecht, M.C.; Comeau, Y.; Héduit, A.; Vanrolleghem, P.A.; Gillot, S. Critical review of activated sludge modeling: State of process knowledge, modeling concepts, and limitations. Biotechnol. Bioeng. 2013, 110, 24–46. [Google Scholar] [CrossRef]
- Wilderer, P.A.; Irvine, R.L.; Gronszy, M.C. Sequencing Batch Reactor Technology; IWA Scientific and Technical Report No. 10; IWA Publishing: London, UK, 2001. [Google Scholar]
- Artan, N.; Orhon, D. Mechanism and Design of Sequencing Batch Reactors for Nutrient Removal; Scientific and Technical Report Series, No. 19; IWA Publishing: London, UK, 2005. [Google Scholar]
- Gerardi, M. Troubleshooting the Sequencing Batch Reactor; John Wiley and Sons, Inc.: New York, NY, USA, 2010. [Google Scholar]
- Tomaszek, J.A. Comparison between Sequencing Batch and Continuous Flow Activated Sludge Systems. In Chemistry for the Protection of the Environment 4. Environmental Science Research; Mournighan, R., Dudzińska, M.R., Barich, J., Gonzalez, M.A., Black, R.K., Eds.; Springer: Boston, MA, USA, 2005; Volume 59. [Google Scholar] [CrossRef]
- Dutta, A.; Sarkar, S. Sequencing Batch Reactor for Wastewater Treatment: Recent Advances. Curr. Pollut. Rep. 2015, 1, 177–190. [Google Scholar] [CrossRef]
- Smyth, M.; Horan, N.J. Sequence Batch Reactors–past, present and future. In Proceedings of the 8th European Waste Water Management Conference, Manchester, UK, 7–8 October 2014. [Google Scholar]
- Steinmetz, H.; Wiese, J.; Schmitt, T.G. Efficiency of SBR technology in municipal wastewater treatment plants. Water Sci. Technol. 2002, 46, 293–299. [Google Scholar] [CrossRef]
- Al-Rekabi, W.S.; Qiang, H.; Qiang, W.W. Review on Sequencing Batch Reactors. Pak. J. Nutr. 2007, 6, 11–19. [Google Scholar]
- Mahvi, A.H. Sequencing batch reactor: A promising technology in wastewater treatment. J. Environ. Health Sci. 2008, 5, 79–90. [Google Scholar]
- Benavides-Sanchez, J.; Vuono, M.; Dionisi, D. Model-based comparison of sequencing batch reactors and continuous-flow activated sludge processes for biological wastewater treatment. Comput. Chem. Eng. 2021, 144, 107127. [Google Scholar] [CrossRef]
- Khalaf, A.; Ibrahim, W.A.; Fayed, M.; Eloffy, M.G. Comparison between the performance of activated sludge and sequence batch reactor systems for dairy wastewater treatment under different operating conditions. Alex. Eng. J. 2021, 60, 1433–1445. [Google Scholar] [CrossRef]
- Masłoń, A.; Tomaszek, J.A. A study on the use of the BioBall® as a biofilm carrier in a sequencing batch reactor. Bioresour. Technol. 2015, 196, 577–585. [Google Scholar] [CrossRef]
- Podedworna, J.; Zubrowska-Sudol, M.; Sytek-Szmeichel, K.; Gnida, A.; Surmacz-Górska, J.; Marciocha, D. Impact of multiple wastewater feedings on the efficiency of nutrient removal in an IFAS-MBSBBR: Number of feedings vs. efficiency of nutrient removal. Water Sci. Technol. 2016, 74, 1457–1468. [Google Scholar] [CrossRef]
- Zhang, J.; Zhang, L.; Miao, Y.; Sun, Y.; Li, X.; Zhang, Q.; Peng, Y. Feasibility of in situ enriching anammox bacteria in a sequencing batch biofilm reactor (SBBR) for enhancing nitrogen removal of real domestic wastewater. Chem. Eng. J. 2018, 352, 847–854. [Google Scholar] [CrossRef]
- Chen, W.; Lu, Y.; Jin, Q.; Zhang, M.; Wu, J. A novel feedforward control strategy for simultaneous nitrification and denitrification (SND) in aerobic granular sludge sequential batch reactor (AGS-SBR). J. Environ. Manag. 2020, 260, 110103. [Google Scholar] [CrossRef]
- Li, D.; Zhang, S.; Li, S.; Zeng, H.; Zhang, J. Aerobic granular sludge operation and nutrients removal mechanism in a novel configuration reactor combined sequencing batch reactor and continuous-flow reactor. Bioresour. Technol. 2019, 292, 122024. [Google Scholar] [CrossRef]
- Czarnota, J.; Masłoń, A.; Zdeb, M.; Łagód, G. The Impact of Different Powdered Mineral Materials on Selected Properties of Aerobic Granular Sludge. Molecules 2020, 25, 386. [Google Scholar] [CrossRef] [Green Version]
- He, W.; Wang, Q.; Zhu, Y.; Wang, K.; Mao, J.; Xue, X.; Shi, Y. Innovative technology of municipal wastewater treatment for rapid sludge sedimentation and enhancing pollutants removal with nano-material. Bioresour. Technol. 2021, 324, 124675. [Google Scholar] [CrossRef] [PubMed]
- Nowobilska-Majewska, E.; Bugajski, P.M. The Analysis of the Amount of Pollutants in Wastewater after Mechanical Treatment in the Aspect of their Susceptibility to Biodegradation in the Treatment Plant in Nowy Targ. J. Ecol. Eng. 2019, 20, 135–143. [Google Scholar] [CrossRef]
- Bugajski, P.M.; Pawełek, J.; Jóźwiakowska, K. The Interdependence of Organic and Biogenic Pollutants Concentrations in the Aspect of their Susceptibility to Biodegradation – A Case Study. J. Ecol. Eng. 2021, 22, 138–147. [Google Scholar] [CrossRef]
- Mucha, Z.; Kułakowski, P. Turbidity measurements as a tool of monitoring and control of the SBR effluent at the small wastewater treatment plant–preliminary study. Arch. Environ. Prot. 2016, 42, 33–36. [Google Scholar] [CrossRef] [Green Version]
- Puig, S.; Vives, M.T.; Corominas, L.; Balaguer, M.; Colprim, J. Wastewater nitrogen removal in SBRs, applying a step-feed strategy: From lab-scale to pilot-plant operation. Water Sci. Technol. 2004, 50, 89–96. [Google Scholar] [CrossRef]
- Mahvi, A.; Mesdaghinia, A.; Karakani, F. Feasibility of continuous flow sequencing batch reactor in domestic wastewater treatment. J. Appl. Sci. 2005, 1, 348–353. [Google Scholar] [CrossRef]
- Simon, J.; Wiese, J.; Steinmetz, H. A comparison of continuous flow and sequencing batch reactor plants concerning integrated operation of sewer systems and wastewater treatment plants. Water Sci. Technol. 2006, 54, 241–248. [Google Scholar] [CrossRef]
- Jafarinejad, S. Cost estimation and economical evaluation of three configurations of activated sludge process for a wastewater treatment plant (WWTP) using simulation. Appl. Water Sci. 2017, 7, 2513–2521. [Google Scholar] [CrossRef] [Green Version]
- Masłoń, A. The dynamics of wastewater flow to the wastewater treatment plant in the aspect of the sequencing batch reactors functioning. Instal 2017, 10, 57–62. (In Polish) [Google Scholar]
- Stanisz, A. An Affordable Statistic Course with the Use of STATISTICA PL on the Examples of Tom 1 Medicine. Basic Statistics; Publisher: Cracow, Poland, 2006. (In Polish) [Google Scholar]
- Chmielowski, K.; Satora, S.; Wałega, A. The efficiency of the sewage treatment based on the example of the sewage treatment plant for the city of Krynica-Zdrój. Infr. Ecol. Rural Areas 2009, 9, 73–83. (In Polish) [Google Scholar]
- Masłoń, A. Dual system of wastewater treatment in the Gorlice WWTP. Gas Water Sanit. Eng. 2015, 8, 295–300. (In Polish) [Google Scholar] [CrossRef]
- Bartkowska, I. Variation of purified wastewater effluent. Ecol. Eng. 2016, 48, 1–8. (In Polish) [Google Scholar] [CrossRef] [Green Version]
- Widera, D.; Pawęska, K. Characteristics of the wastewater inflow to the wastewater treatment plant in the tourist resort. Ecol. Eng. 2018, 19, 53–60. [Google Scholar] [CrossRef] [Green Version]
- Wąsik, E.; Chmielowski, K.; Młyński, D.; Bedla, B. Selected aspects of functioning of the sewage sludge treatment plant in Szczawnica in terms of receiver water quality. Ecol. Eng. 2017, 18, 41–51. [Google Scholar] [CrossRef]
- Masłoń, A. Hydraulic operating conditions of sequencing batch reactor. Gas Water Sanit. Eng. 2017, 12, 496–500. (In Polish) [Google Scholar] [CrossRef]
- Chmielowski, K.; Bugajski, P.; Kaczor, G. Comparative analysis of the quality of sewage discharged from selected agglomeration sewerage systems. J. Water Land Dev. 2016, 30, 35–42. [Google Scholar] [CrossRef]
- Chmielowski, K.; Bugajski, P.; Kaczor, G. Compositional analysis of the sewage incoming to and discharged from the sewage treatment plant in Kolbuszowa Dolna. J. Ecol. Eng. 2016, 17, 9–16. [Google Scholar] [CrossRef] [Green Version]
- Orchowski, M.; Masłoń, A.; Heidrich, Z. Energy consumption of the Sandomierz wastewater treatment plant. Gas Water Sanit. Eng. 2018, 2, 68–73. (In Polish) [Google Scholar] [CrossRef]
- Czarnota, J.; Masłoń, A. Analysis of technological effectiveness of wastewater treatment plant in Nisko. JCEEA 2015, 62, 75–86. [Google Scholar] [CrossRef]
- Szczerbińska, N.; Gałczyńska, M.; Ulas, K.; Burczyk, P.; Mikołajczak, M.; Busko, M. Efficiency of sewage treatment plant in Gryfino. Water Environ. Rural Areas 2018, 18, 85–98. (In Polish) [Google Scholar]
- Langergraber, G.; Alex, J.; Weissenbacher, N.; Woerner, D.; Ahnert, M.; Frehmann, T.; Halft, N.; Hobus, I.; Plattes, M.; Spering, V.; et al. Generation of diurnal variation for influent data for dynamic simulation. Water Sci. Technol. 2008, 57, 1483–1486. [Google Scholar] [CrossRef] [PubMed]
- Dzubur, A.; Serdarevic, A. Daily influent variation for dynamic modeling of wastewater treatment plants. Coupled Syst. Mech. 2020, 9, 111–123. [Google Scholar] [CrossRef]
- Martin, C.; Vanrolleghem, P.A. Analysing, completing, and generating influent data for WWTP modelling: A critical review. Environ. Model. Softw. 2014, 60, 188–201. [Google Scholar] [CrossRef] [Green Version]
- Masłoń, A.; Tomaszek, J.A. Sequencing Batch Reactors. Fundamentals of Technology, Design Principles and Examples of Applications; Publishing House Seidel Przywecki: Warszawa, Poland, 2017. [Google Scholar]
- Lee, S.-H.; Kang, H.-J.; Park, H.-D. Influence of influent wastewater communities on temporal variation of activated sludge communities. Water Res. 2015, 73, 132–144. [Google Scholar] [CrossRef] [PubMed]
- Fernandes, H.; Jungles, M.K.; Hoffmann, H.; Antonio, R.V.; Costa, R.H. Full-scale sequencing batch reactor (SBR) for domestic wastewater: Performance and diversity of microbial communities. Bioresour. Technol. 2013, 132, 262–268. [Google Scholar] [CrossRef] [Green Version]
- Ignatowicz, K.; Struk-Sokołowska, J.; Kazimierowicz, J. Assessment of the removal of carbon, nitrogen and phosphorus in municipal wastewater treatment plants in Sokółka. Econ. Environ. 2013, 4, 158–168. [Google Scholar]
- Bartkowska, I.; Dzienis, L.; Wawrentowicz, D. Effectiveness of wastewater treatment plants in Hajnówka and its modernization proposal. Ecol. Eng. 2011, 24, 226–235. [Google Scholar]
- Bartkowska, I.; Klaus, W. Performance analysis of sewage sludge treatment plant working in the SBR system. Econ. Environ. 2013, 4, 107–117. [Google Scholar]
- Piotrowski, R.; Ujazdowski, T. Designing Control Strategies of Aeration System in Biological WWTP. Energies 2020, 13, 3619. [Google Scholar] [CrossRef]
- Zaburko, J.; Głowienka, R.; Widomski, M.K.; Szulżyk-Cieplak, J.; Babko, R.; Łagód, G. Modeling of the Aeration System of a Sequencing Batch Reactor. J. Ecol. Eng. 2020, 21, 249–256. [Google Scholar] [CrossRef]
Figure 1.
Technological scheme of the wastewater treatment plant.
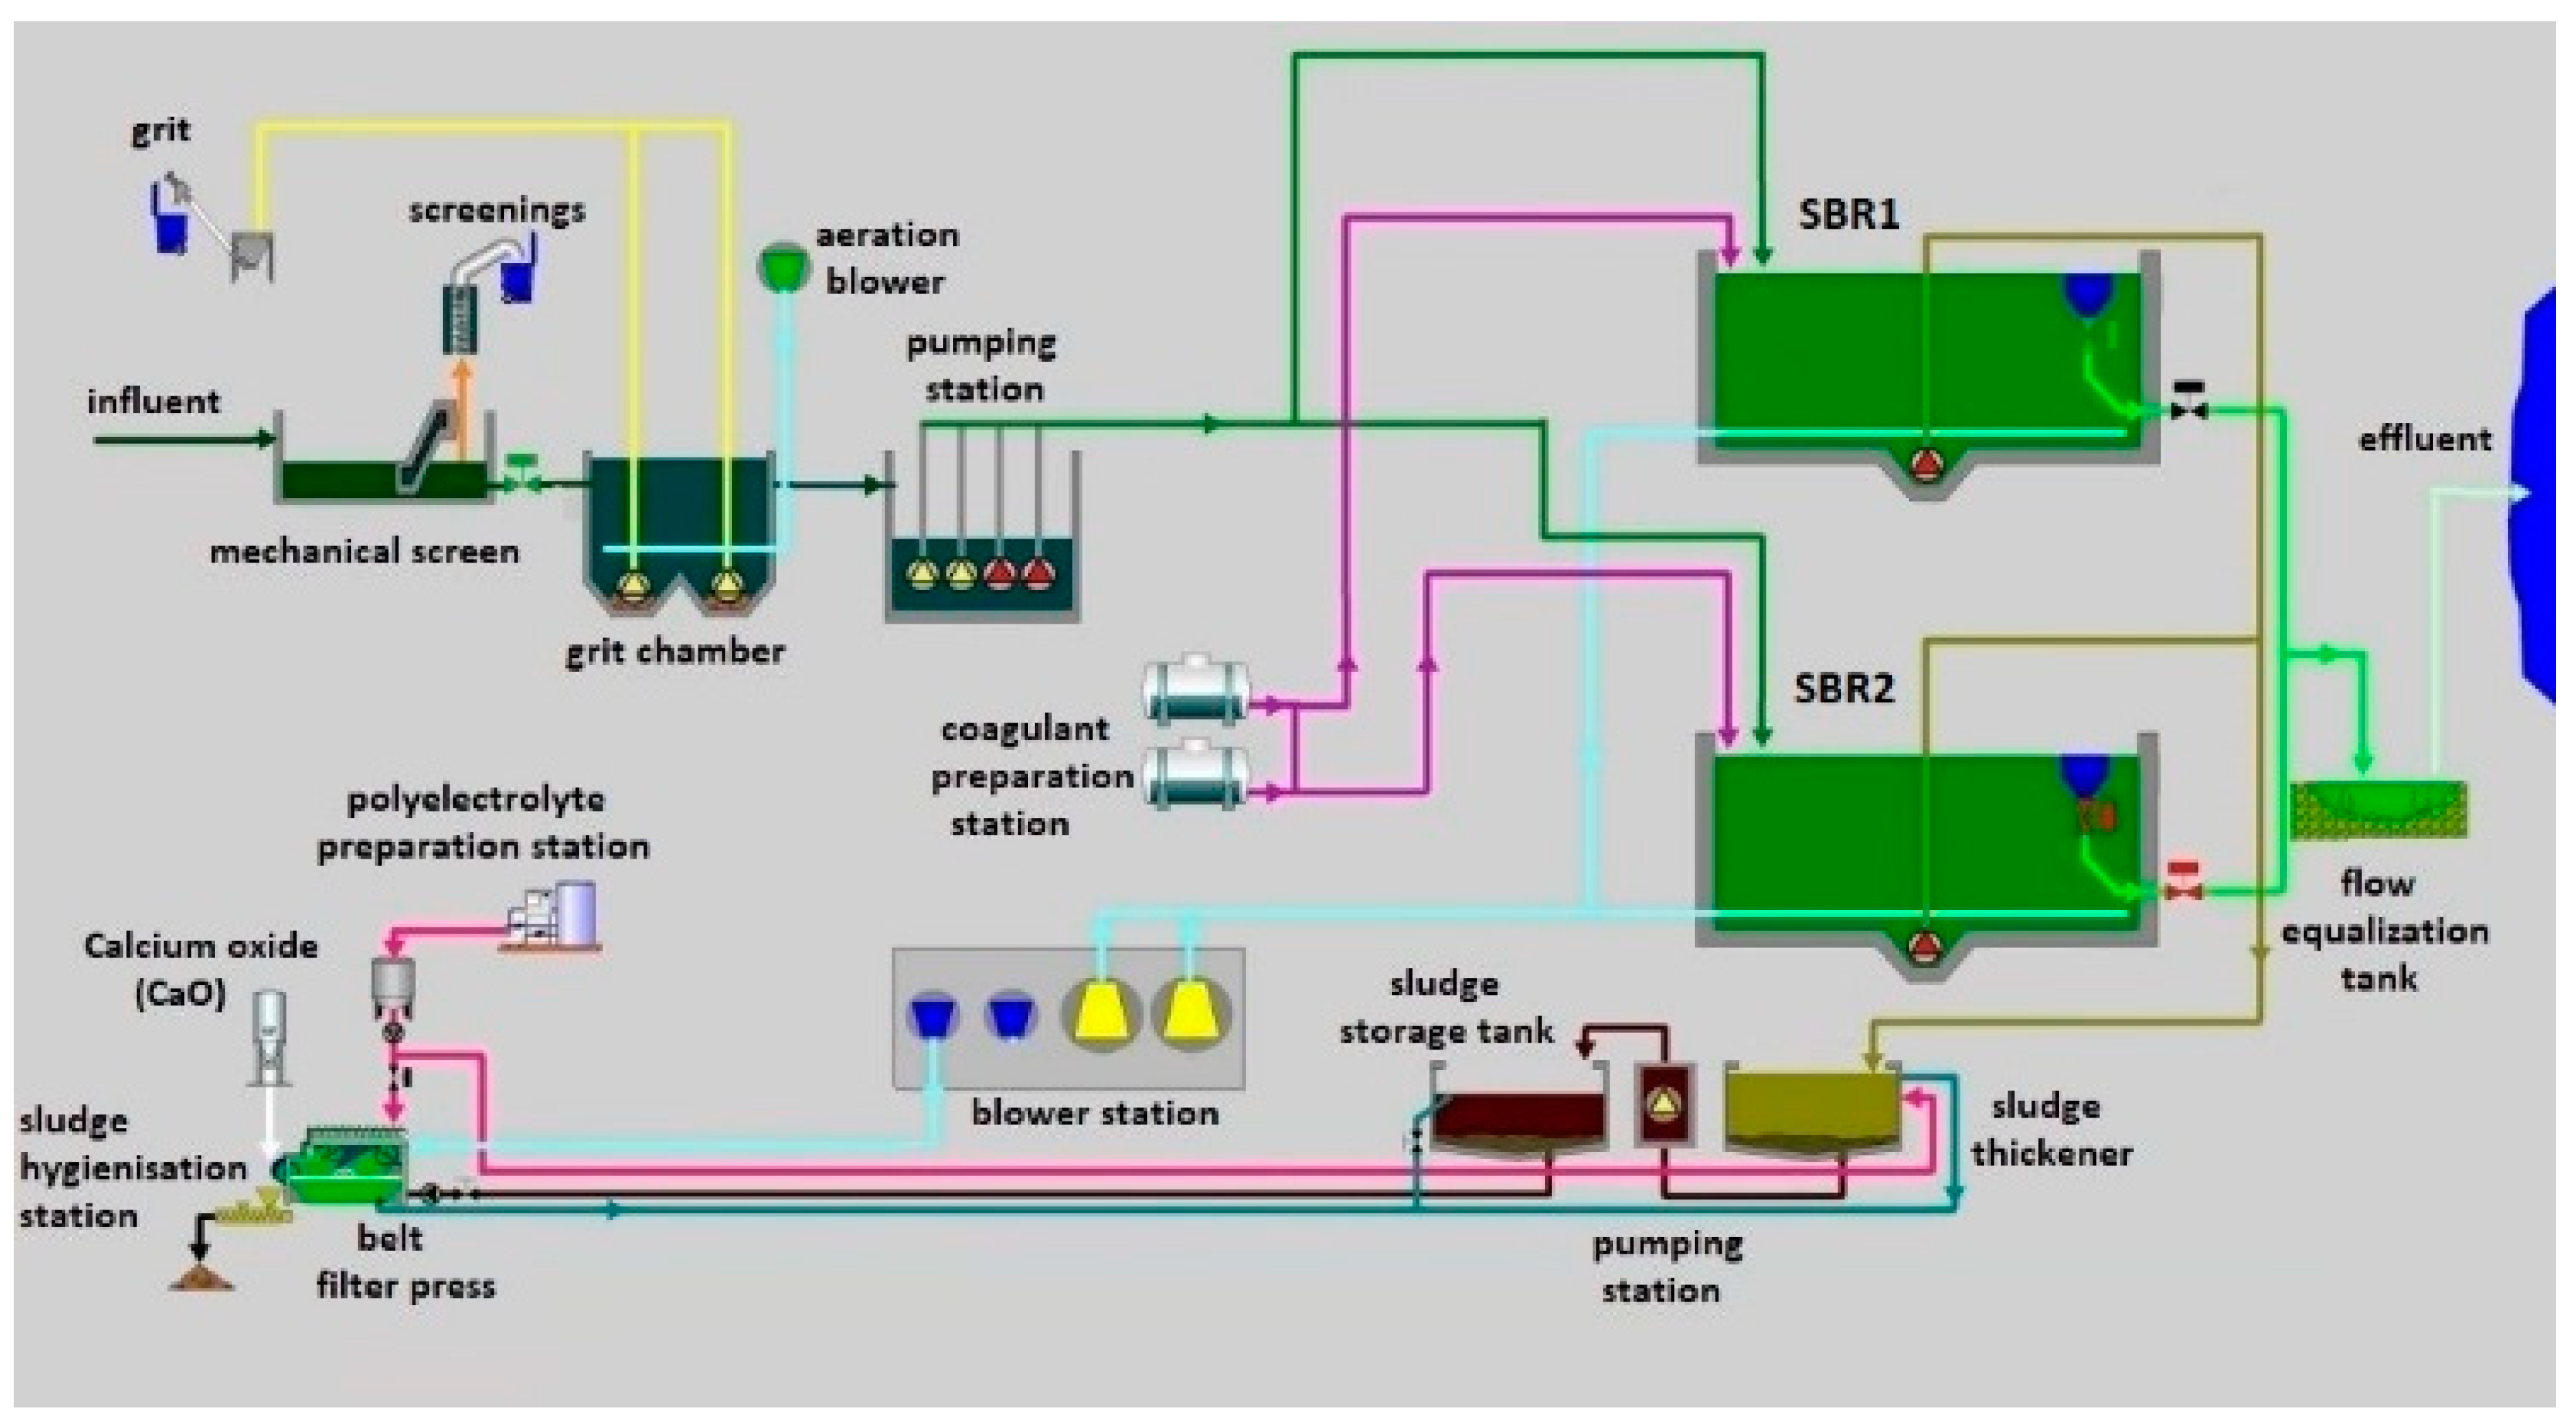
Figure 2.
The daily flow of wastewater to WWTP in Rabka-Zdrój and daily flow of wastewater to sequencing batch reactors.
Figure 2.
The daily flow of wastewater to WWTP in Rabka-Zdrój and daily flow of wastewater to sequencing batch reactors.
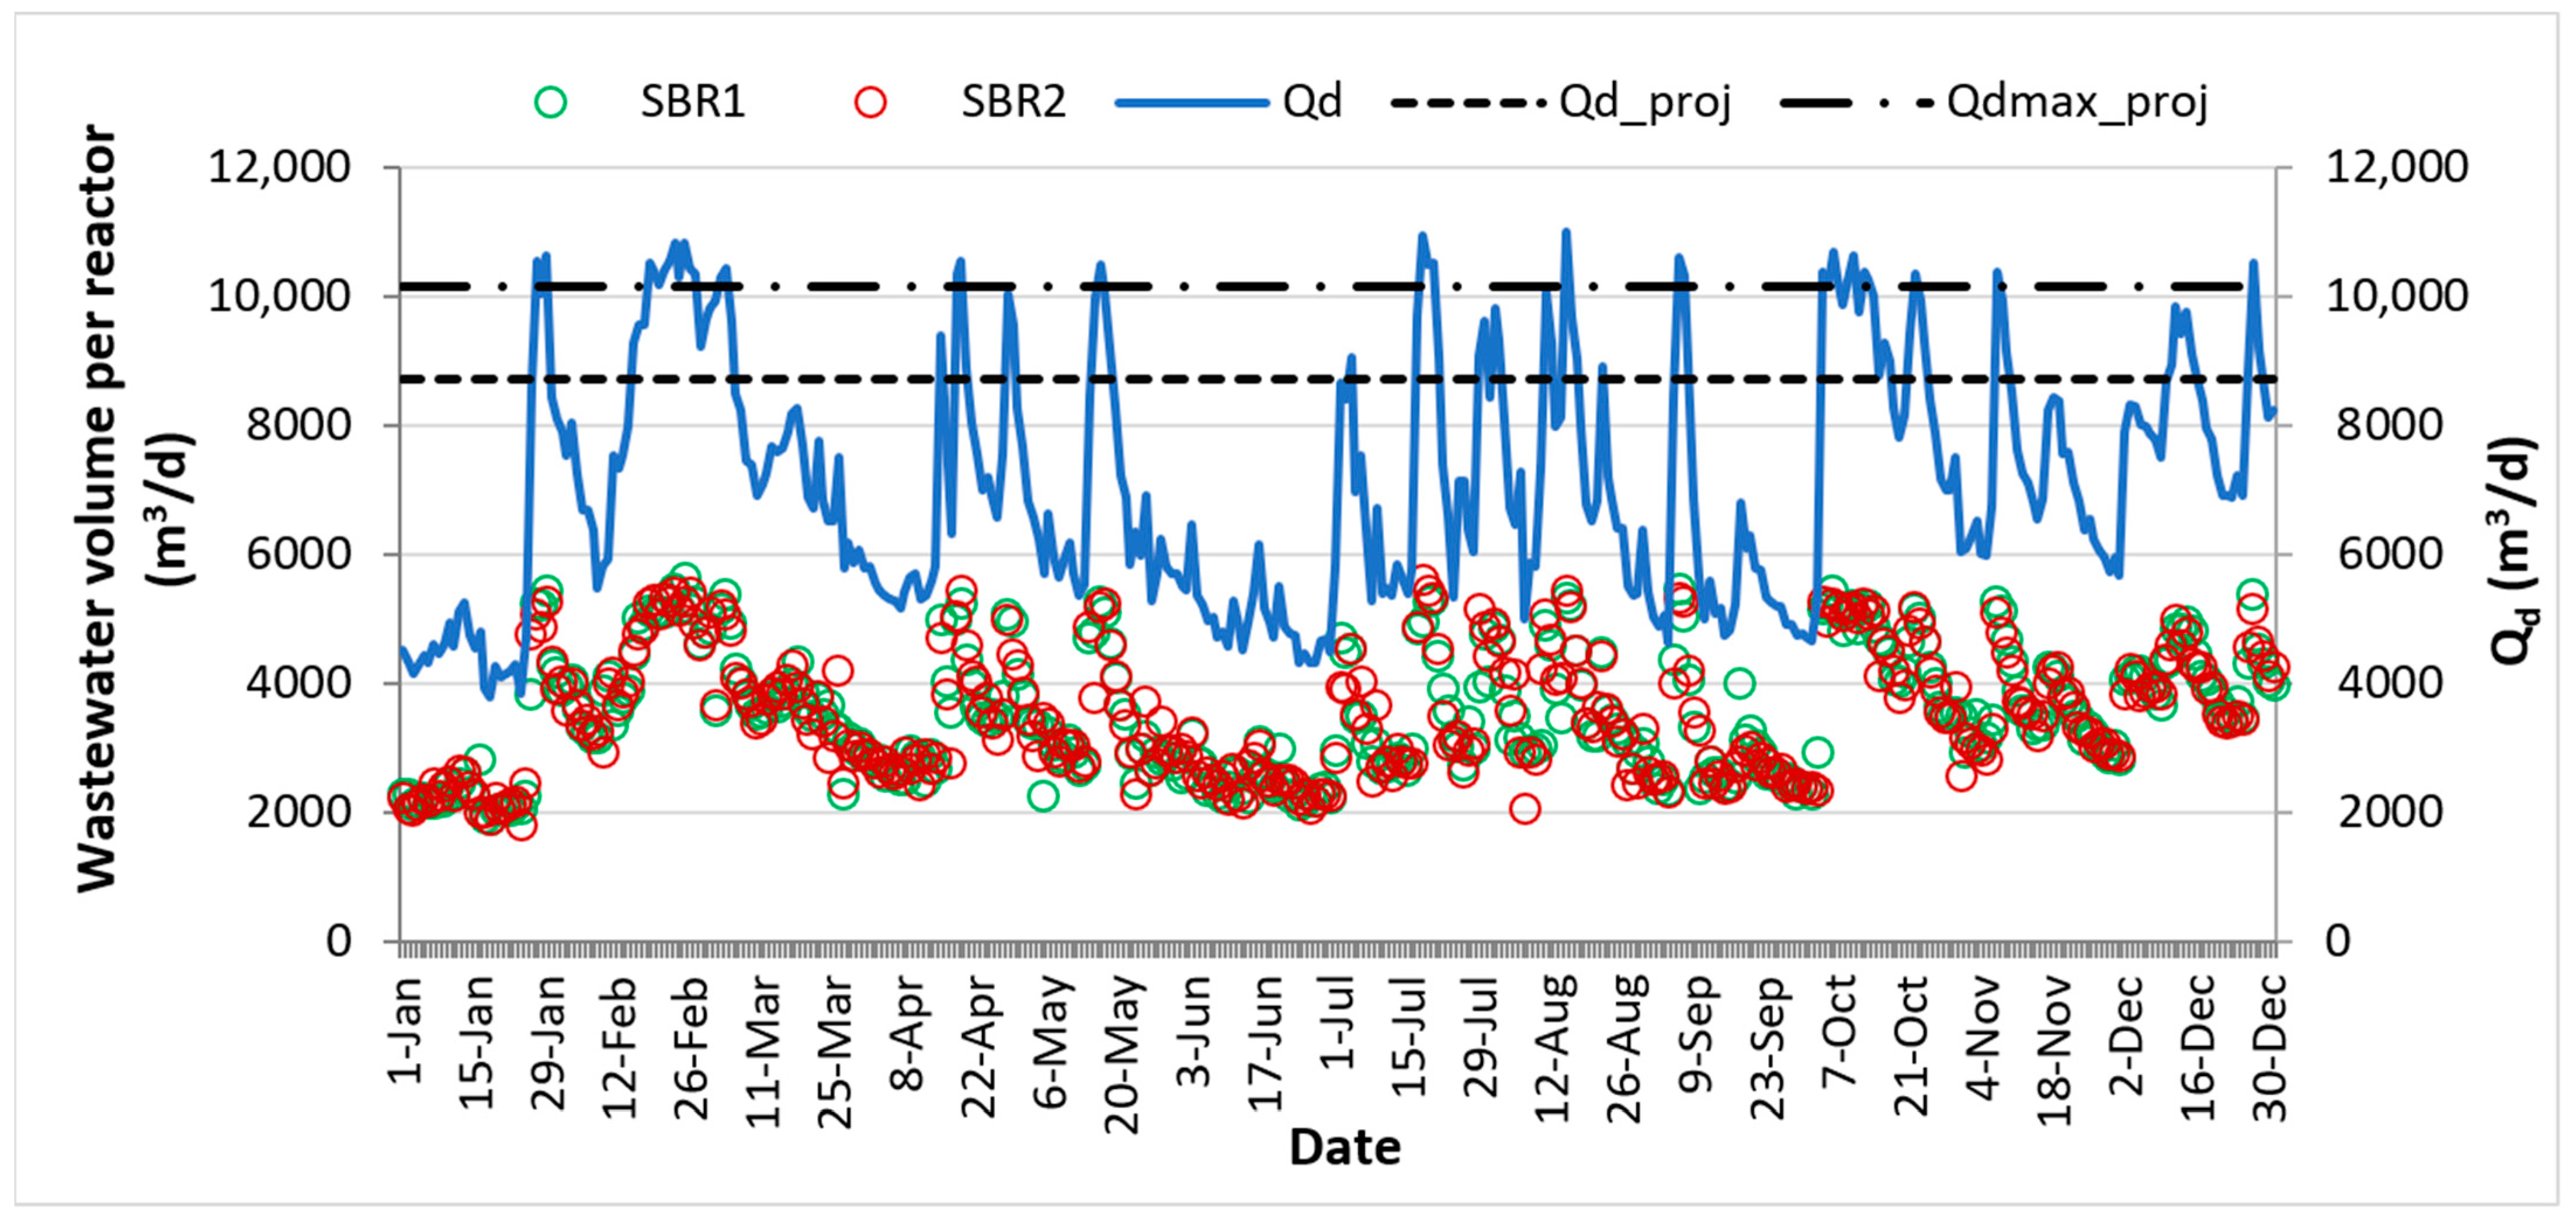
Figure 3.
Volume of filling phase of reactors SBR1 and SBR2 in each cycle during the study.

Figure 4.
Histogram of fill volume of SBR1 and SBR2 reactor.
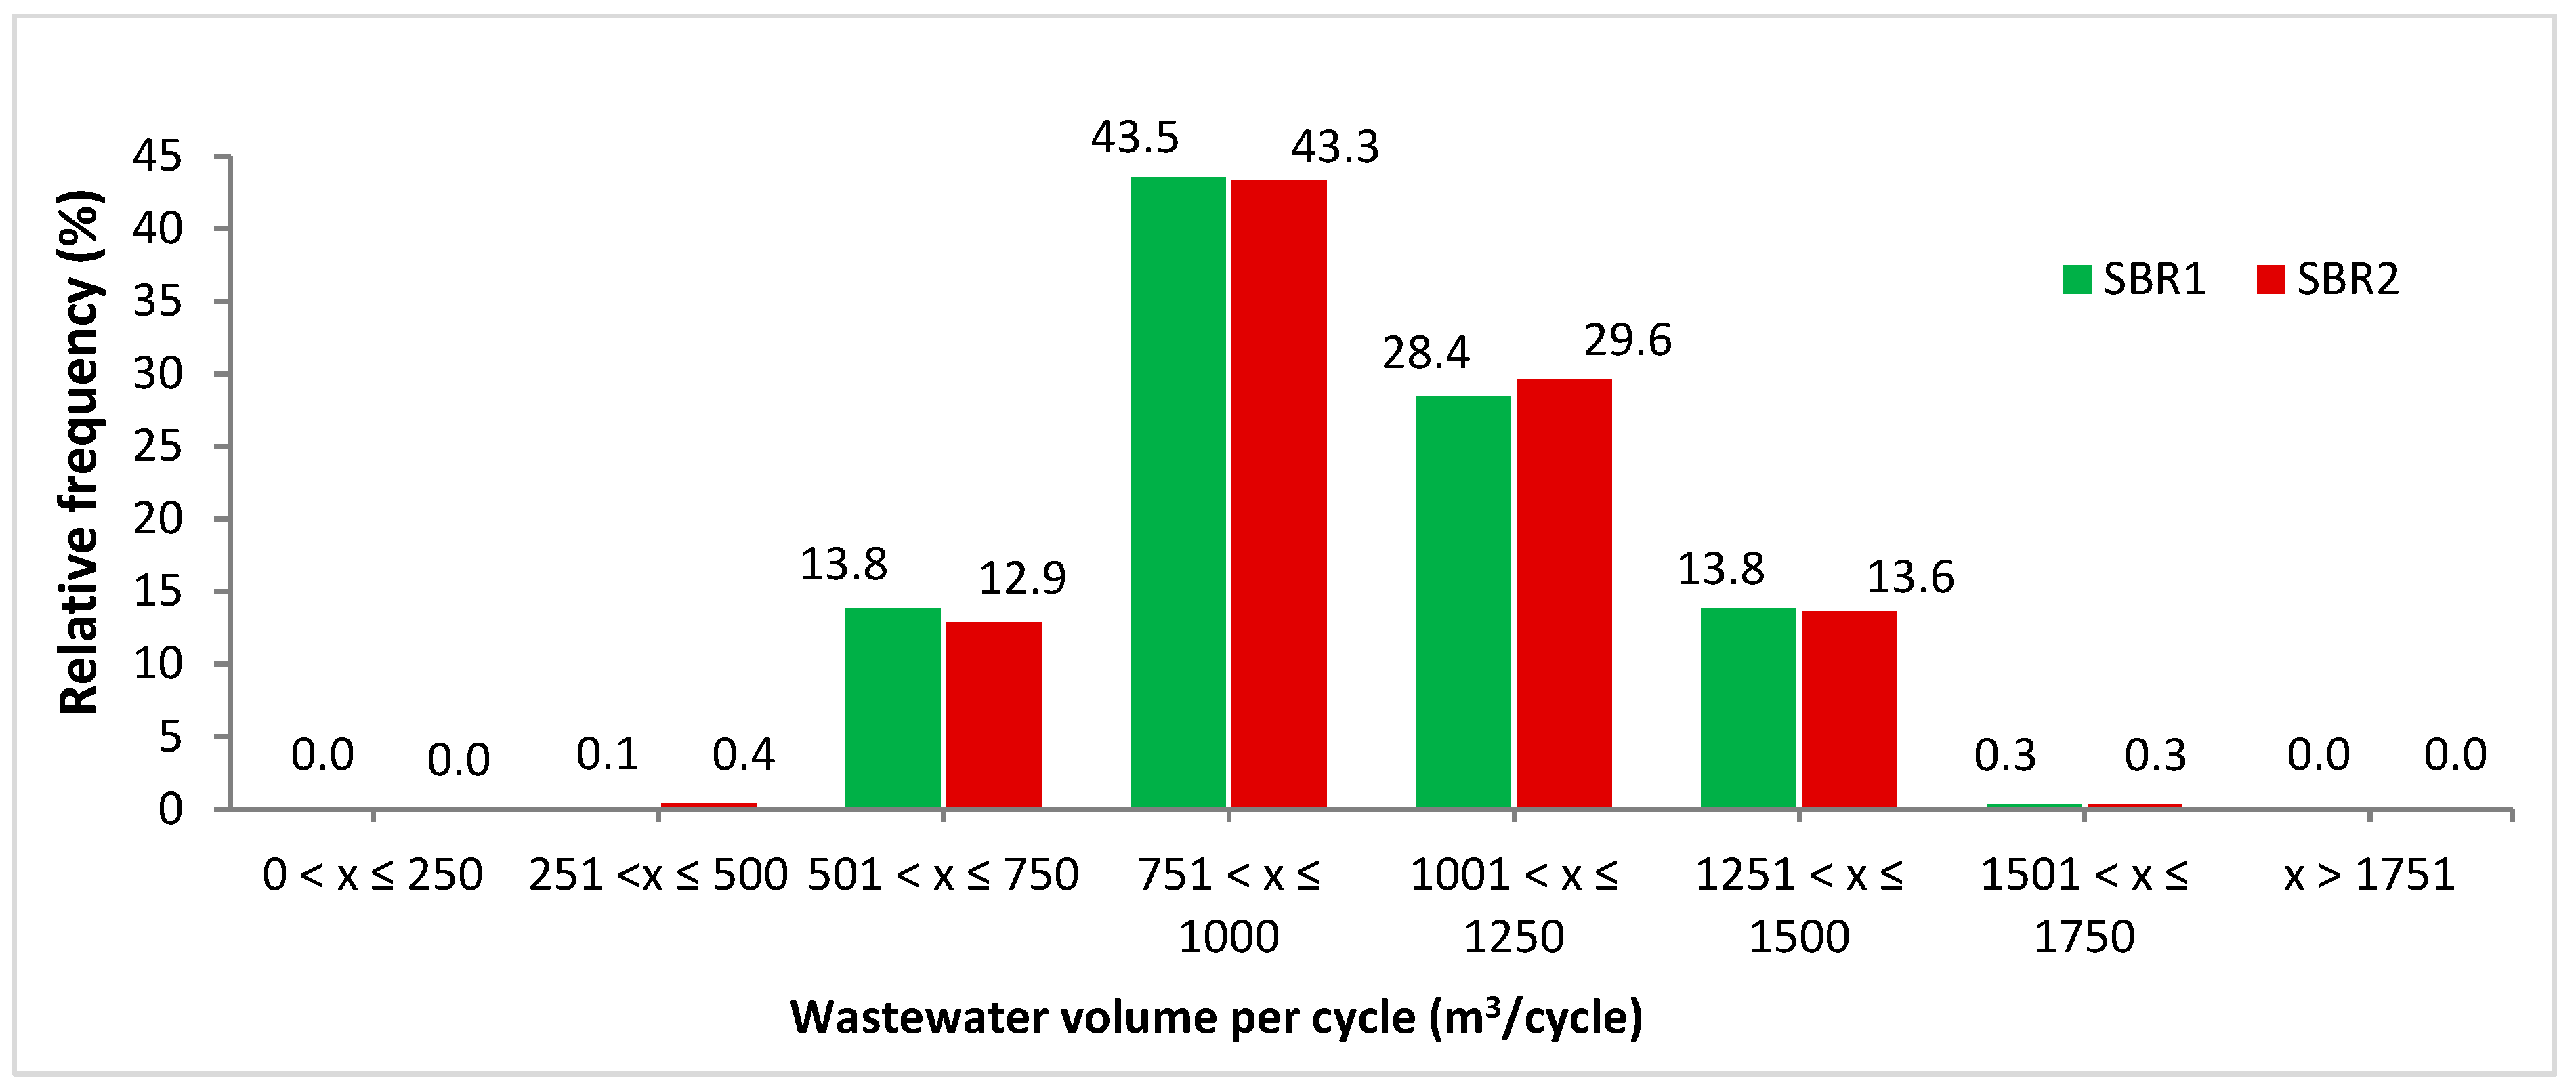
Figure 5.
Influence of wastewater flow to the SBR reactor on the change of the decanting factor.

Figure 6.
The relationship between the volume of VF wastewater flowing into the SBR reactor and the concentration of pollutants in the wastewater.
Figure 6.
The relationship between the volume of VF wastewater flowing into the SBR reactor and the concentration of pollutants in the wastewater.
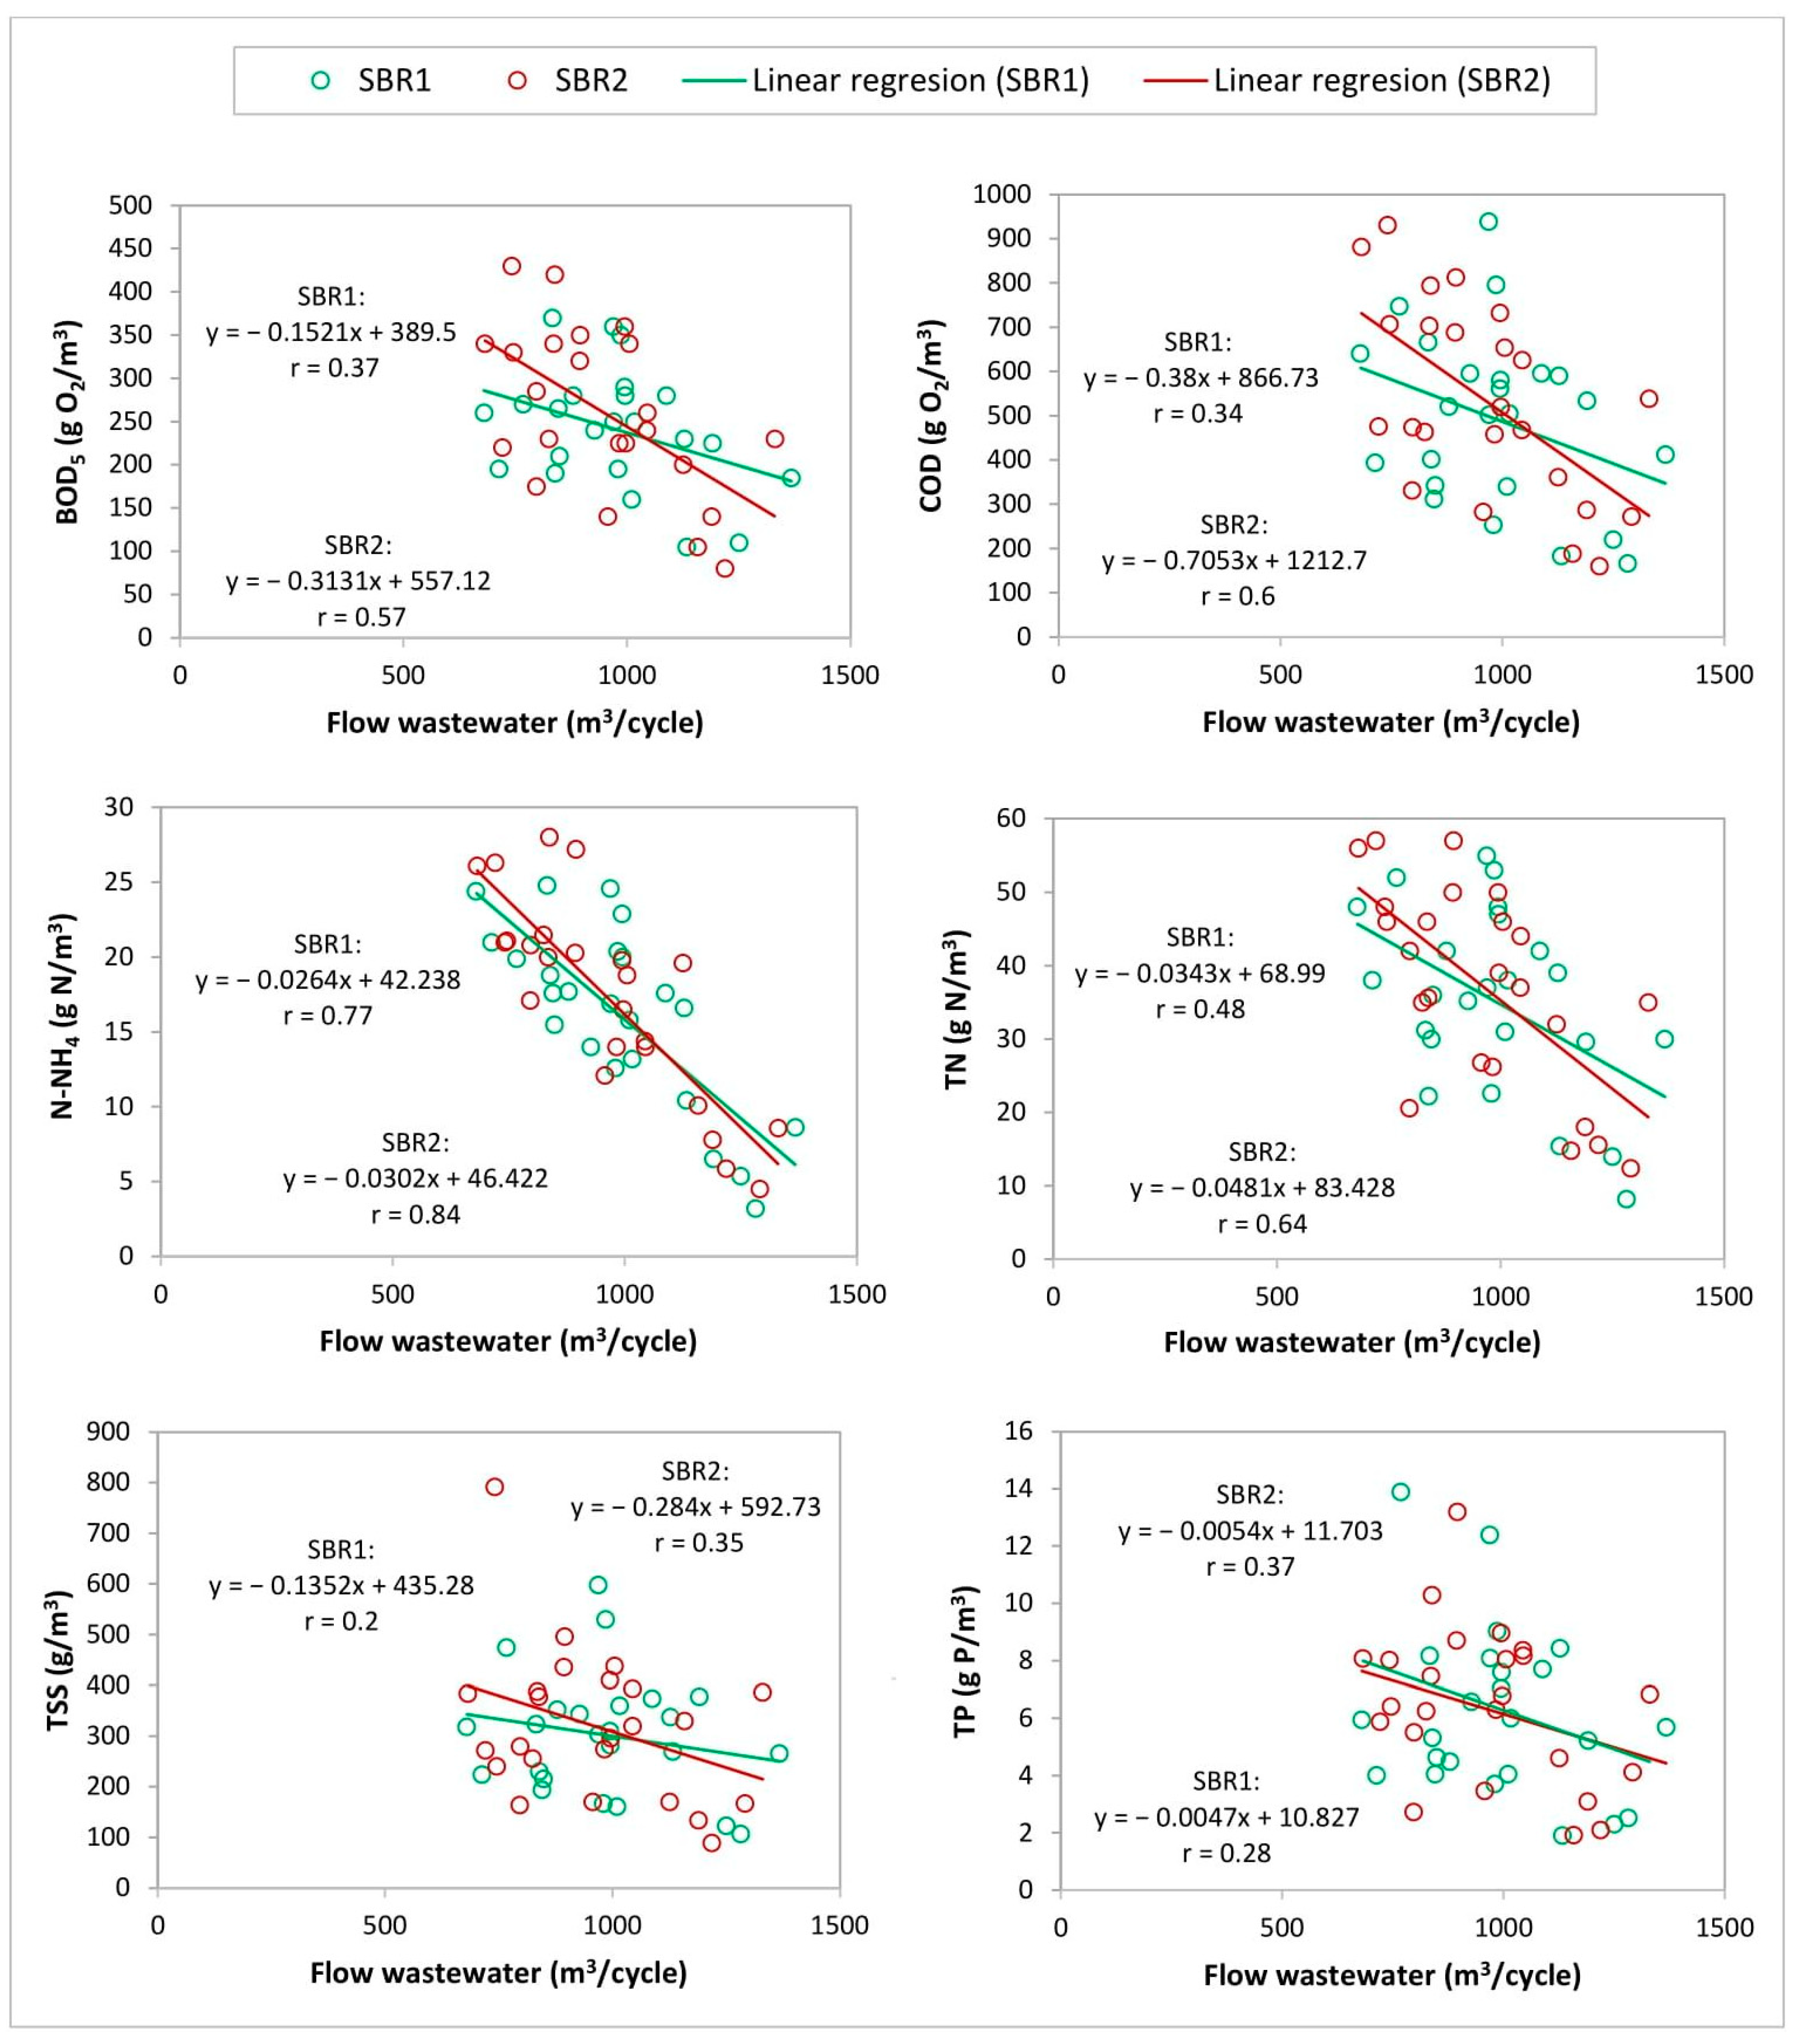
Figure 7.
The course of pollutant loads in the wastewater flowing to SBR reactors during the cycle.
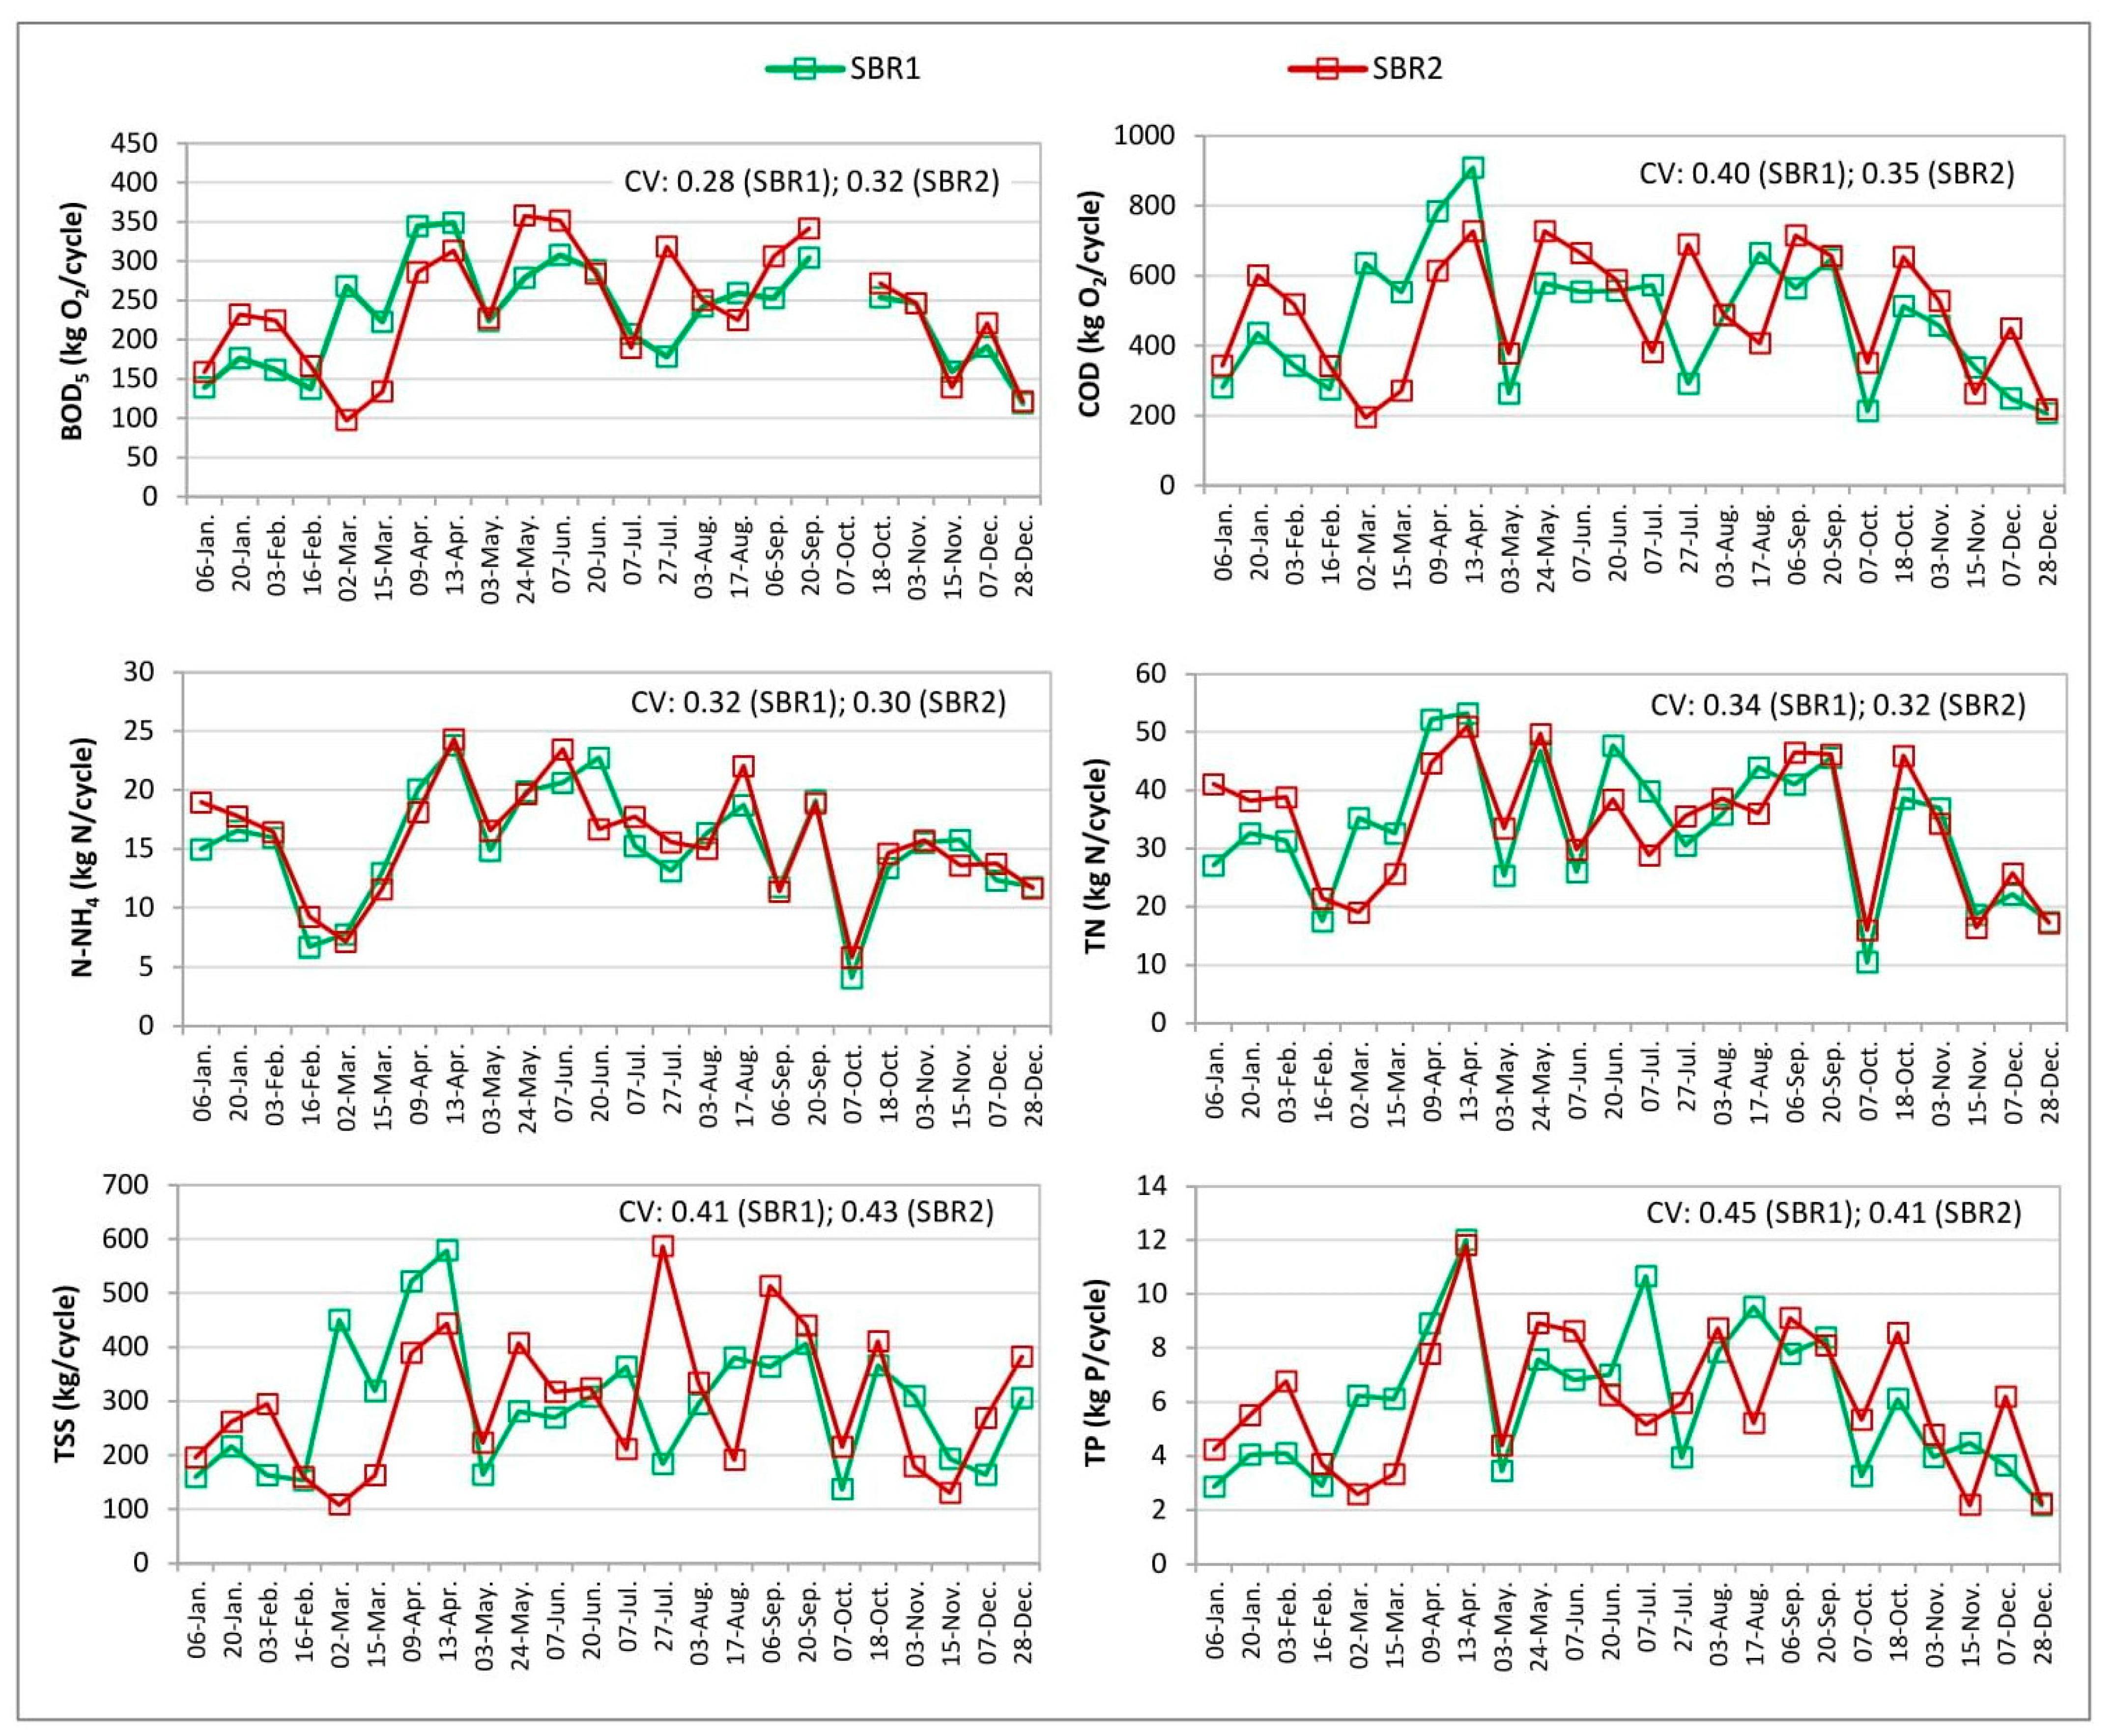
Figure 8.
The course of the variability of wastewater treatment in SBR1 and SBR2 reactors.

Figure 9.
Influence of OLR load on the efficiency of pollutants removal from wastewater in SBR1 and SBR2 reactors.
Figure 9.
Influence of OLR load on the efficiency of pollutants removal from wastewater in SBR1 and SBR2 reactors.
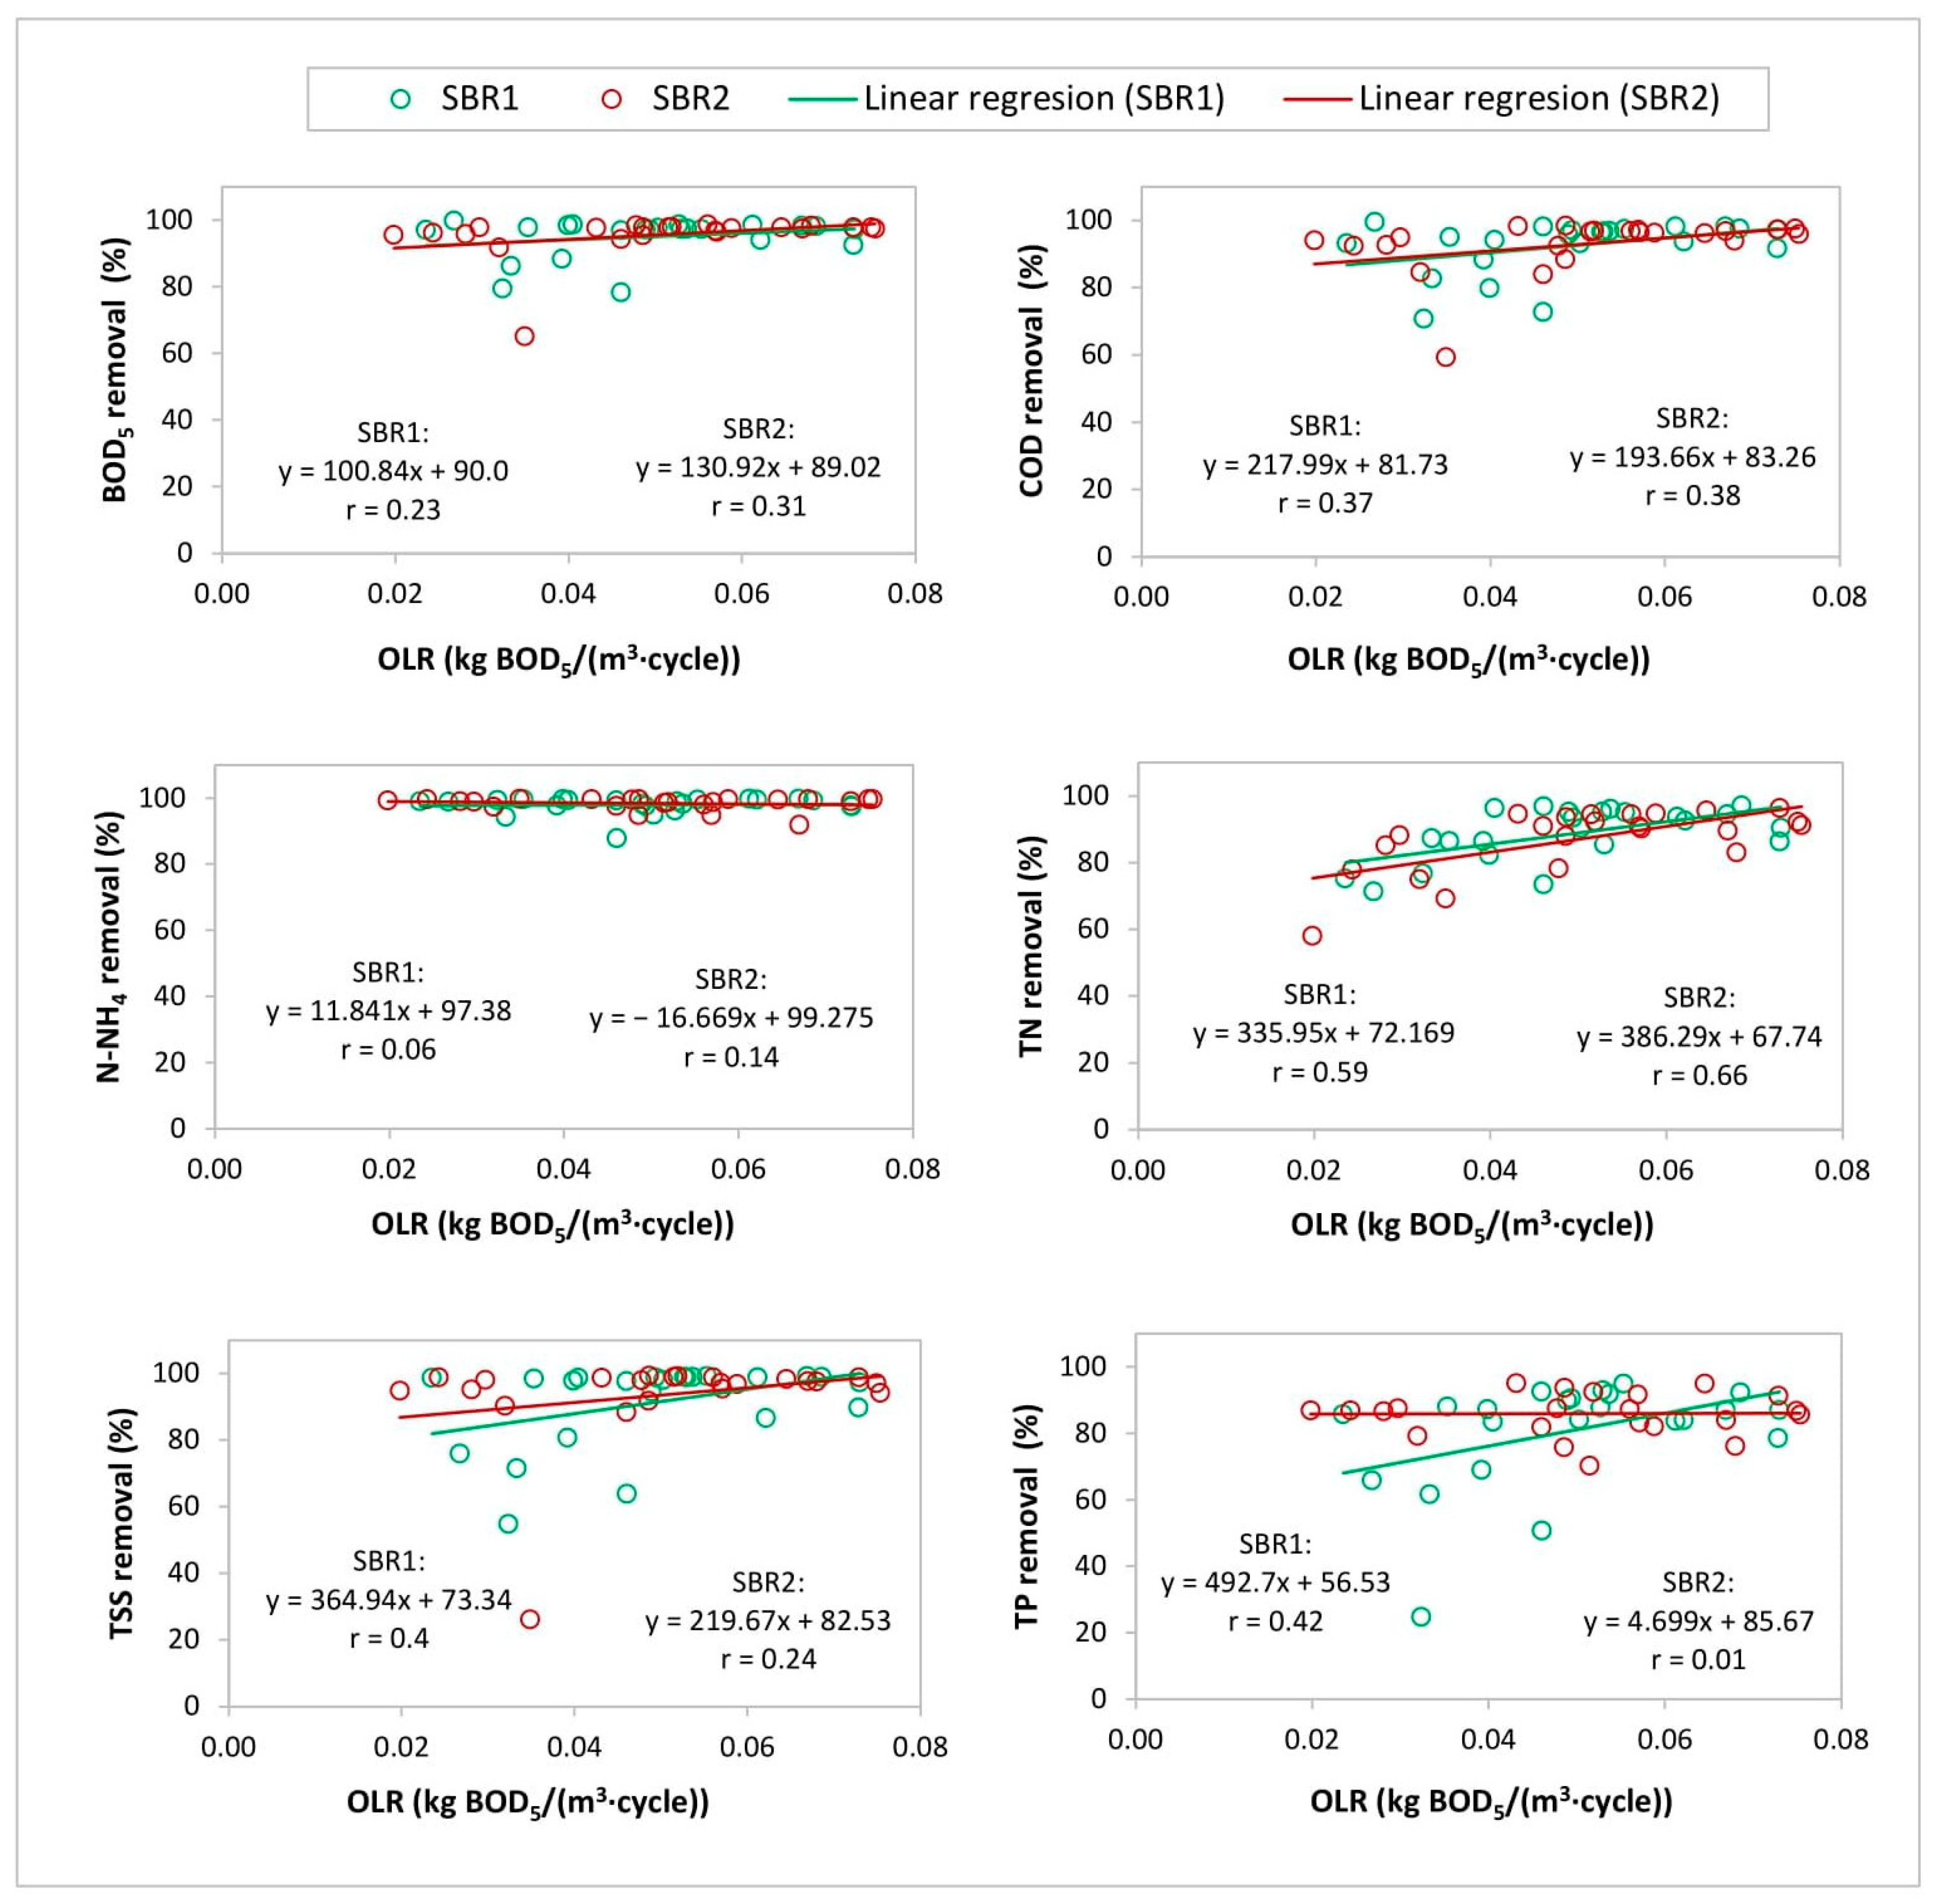
Figure 10.
Statistical comparison of wastewater treatment efficiency in SBR1 and SBR2.

Table 1.
Distribution of the operational cycles of SBR reactors.
| 8 h Cycle | ||||||||||||||||||||
| Filling | ||||||||||||||||||||
| Anoxic stirring | ||||||||||||||||||||
| Aeration | ||||||||||||||||||||
| Settling | ||||||||||||||||||||
| Decantation | ||||||||||||||||||||
| Hour of cycle | 0 | 1 | 2 | 3 | 4 | 5 | 6 | 7 | 8 | |||||||||||
| 6 h Cycle | ||||||||||||||||||||
| Filling | ||||||||||||||||||||
| Anoxic stirring | ||||||||||||||||||||
| Aeration | ||||||||||||||||||||
| Settling | ||||||||||||||||||||
| Decantation | ||||||||||||||||||||
| Hour of cycle | 0 | 1 | 2 | 3 | 4 | 5 | 6 | |||||||||||||
Table 2.
The quality of raw wastewater flowing into SBR1 and SBR2 reactors during the study.
| Parameter | SBR1 | SBR2 | ||||||||
|---|---|---|---|---|---|---|---|---|---|---|
| Min. | Max. | Average | SD | CV | Min. | Max. | Average | SD | CV | |
| pH | 7.0 | 7.6 | 7.3 | 0.1 | 0.02 | 7.0 | 7.6 | 7.3 | 0.1 | 0.02 |
| COD (g O2/m3) | 166.0 | 939.0 | 491.7 | 196.8 | 0.40 | 160.0 | 931.0 | 533.7 | 220.0 | 0.41 |
| BOD5 (g O2/m3) | 105.0 | 370.0 | 241.3 | 69.1 | 0.29 | 80.0 | 430.0 | 260.2 | 96.1 | 0.37 |
| TSS (g/m3) | 107.0 | 598.0 | 301.8 | 120.0 | 0.40 | 89.0 | 792.0 | 319.3 | 148.7 | 0.47 |
| TN (g N/m3) | 8.2 | 55.0 | 35.2 | 12.5 | 0.36 | 12.4 | 57.0 | 37.1 | 13.8 | 0.37 |
| N-NH4 (g N/m3) | 3.2 | 24.8 | 16.2 | 6.0 | 0.37 | 4.5 | 28.0 | 17.3 | 6.7 | 0.39 |
| N-NO2 (g N/m3) | 0.07 | 0.24 | 0.12 | 0.04 | 0.36 | 0.06 | 0.24 | 0.12 | 0.05 | 0.37 |
| N-NO3 (g N/m3) | 0.25 | 2.88 | 0.83 | 0.78 | 0.94 | 0.20 | 2.80 | 0.79 | 0.78 | 0.99 |
| P-PO4 (g P/m3) | 1.02 | 4.89 | 2.5 | 1.1 | 0.47 | 0.54 | 6.57 | 2.7 | 1.3 | 0.49 |
| TP (g P/m3) | 1.92 | 13.9 | 6.2 | 2.9 | 0.44 | 1.94 | 13.2 | 6.5 | 2.7 | 0.42 |
Table 3.
Pearson correlation matrix for pollutant loads in the inflow and outflow from the SBR reactor during the cycle. A strong correlation is shown in blue, and a very strong correlation in orange (α = 0.05).
Table 3.
Pearson correlation matrix for pollutant loads in the inflow and outflow from the SBR reactor during the cycle. A strong correlation is shown in blue, and a very strong correlation in orange (α = 0.05).
| Input load (kg/cycle) | Output load (kg/cycle) | ||||||||||||
| BOD5 | COD | TSS | TN | N-NH4 | TP | BOD5 | COD | TSS | TN | N-NH4 | TP | ||
| Input load | BOD5 | 1 | |||||||||||
| (kg/cycle) | COD | 0.882 | 1 | ||||||||||
| TSS | 0.771 | 0.908 | 1 | ||||||||||
| TN | 0.813 | 0.880 | 0.783 | 1 | |||||||||
| N-NH4 | 0.634 | 0.618 | 0.445 | 0.709 | 1 | ||||||||
| TP | 0.775 | 0.909 | 0.807 | 0.815 | 0.596 | 1 | |||||||
| Output load (kg/cycle) | BOD5 | 0.007 | 0.192 | 0.095 | 0.205 | 0.184 | 0.033 | 1 | |||||
| COD | −0.098 | 0.037 | 0.026 | 0.044 | 0.026 | −0.098 | 0.944 | 1 | |||||
| TSS | −0.144 | 0.061 | −0.033 | 0.074 | 0.030 | −0.088 | 0.938 | 0.900 | 1 | ||||
| TN | −0.076 | 0.143 | 0.173 | 0.064 | 0.009 | −0.070 | 0.761 | 0.485 | 0.808 | 1 | |||
| N-NH4 | 0.059 | 0.155 | 0.113 | 0.140 | 0.086 | 0.056 | 0.700 | 0.696 | 0.631 | 0.507 | 1 | ||
| TP | 0.071 | 0.278 | 0.131 | 0.277 | 0.273 | 0.152 | 0.901 | 0.841 | 0.914 | 0.775 | 0.656 | 1 | |
| Input load (kg/cycle) | Output load (kg/cycle) | ||||||||||||
| BOD5 | COD | TSS | TN | N-NH4 | TP | BOD5 | COD | TSS | TN | N-NH4 | TP | ||
| Input load | BOD5 | 1 | |||||||||||
| (kg/cycle) | COD | 0.953 | 1 | ||||||||||
| TSS | 0.738 | 0.778 | 1 | ||||||||||
| TN | 0.765 | 0.822 | 0.625 | 1 | |||||||||
| N-NH4 | 0.624 | 0.563 | 0.296 | 0.646 | 1 | ||||||||
| TP | 0.852 | 0.875 | 0.690 | 0.797 | 0.543 | 1 | |||||||
| Output load (kg/cycle) | BOD5 | −0.283 | −0.229 | −0.250 | 0.142 | 0.139 | −0.174 | 1 | |||||
| COD | −0.365 | −0.298 | −0.281 | 0.041 | −0.062 | −0.219 | 0.925 | 1 | |||||
| TSS | −0.268 | −0.211 | −0.227 | 0.131 | 0.106 | −0.172 | 0.988 | 0.938 | 1 | ||||
| TN | −0.486 | −0.389 | −0.276 | −0.179 | −0.232 | −0.305 | 0.481 | 0.763 | 0.481 | 1 | |||
| N-NH4 | 0.239 | 0.301 | 0.214 | 0.408 | 0.405 | 0.463 | 0.006 | 0.014 | −0.051 | 0.017 | 1 | ||
| TP | 0.014 | 0.060 | 0.061 | 0.368 | 0.403 | 0.091 | 0.881 | 0.784 | 0.888 | 0.388 | 0.206 | 1 | |
Table 4.
Technological parameter of SBR reactors under different organic loading.
| Parameter | SBR1 | SBR2 | ||||||||
|---|---|---|---|---|---|---|---|---|---|---|
| Min. | Max. | Average | SD | CV | Min. | Max. | Average | SD | CV | |
| HRT (h) | 0.96 | 2.21 | 1.4 | 0.3 | 0.25 | 0.95 | 2.1 | 1.5 | 0.4 | 0.25 |
| MLSS (kg/m3) | 1.98 | 3.27 | 2.5 | 0.4 | 0.14 | 1.96 | 3.29 | 2.48 | 0.3 | 0.14 |
| OLR (kg BOD5/m3·d) | 0.060 | 0.164 | 0.118 | 0.03 | 0.28 | 0.040 | 0.181 | 0.121 | 0.04 | 0.31 |
| F/M ratio (kg BOD5/kg MLSS·d) | 0.022 | 0.071 | 0.048 | 0.015 | 0.31 | 0.013 | 0.085 | 0.05 | 0.017 | 0.35 |
| OLR per cycle (g BOD5/m3 ·cycle) | 23.5 | 73.0 | 49.1 | 14.1 | 0.29 | 19.8 | 75.3 | 50.3 | 16.4 | 0.33 |
| F/M ratio (g BOD5/kg MLSS·cycle) | 10.6 | 31.5 | 20.0 | 6.0 | 0.30 | 6.8 | 31.9 | 20.5 | 7.1 | 0.35 |
HRT—hydraulic retention time, OLR—organic loading rate, F/M ratio—food-to-microorganisms ratio, MLSS—mixed liquor suspended solids.
Table 5.
Statistical model for determining the concentration of pollutants in the outflow of the SBR reactor.
Table 5.
Statistical model for determining the concentration of pollutants in the outflow of the SBR reactor.
| Parameter | Statistical Model | |
|---|---|---|
| SBR1 | SBR2 | |
| BOD5 | Y = 0.048x1 − 0.21x2 + 8.46 | Y = 0.051x1 − 0.18x2 + 3.22 |
| COD | Y = 0.23x1 − 0.45x2 + 10.44 | Y = 0.26x1 − 0.51x2 + 12.61 |
| TSS | Y = 0.06x1 + 0.02x2 − 28.16 | Y = 0.05x1 + 0.015x2 − 34.25 |
| TN | Y = 0.01x1 − 0.07x2 + 0.88 | Y = 0.012x1 − 0.1x2 + 0.66 |
| N-NH4 | Y = 0.01x1 − 0.64x2 + 1.14 | Y = 0.01x1 − 0.58x2 + 064 |
| TP | Y = 0.01x1 − 1.6x2 + 0.43 | Y = 0.01x1 − 1.3x2 + 0.56 |
Y—concentration of pollutants in the wastewater outflow from the SBR reactor (g/m3); x1—wastewater inflow to the SBR reactor (m3/cycle); x2—concentration of pollutants in the wastewater inflow to the SBR reactor (g/m3).
Publisher’s Note: MDPI stays neutral with regard to jurisdictional claims in published maps and institutional affiliations. |
© 2022 by the author. Licensee MDPI, Basel, Switzerland. This article is an open access article distributed under the terms and conditions of the Creative Commons Attribution (CC BY) license (https://creativecommons.org/licenses/by/4.0/).
Share and Cite
MDPI and ACS Style
Masłoń, A. Impact of Uneven Flow Wastewater Distribution on the Technological Efficiency of a Sequencing Batch Reactor. Sustainability 2022, 14, 2405. https://doi.org/10.3390/su14042405
AMA Style
Masłoń A. Impact of Uneven Flow Wastewater Distribution on the Technological Efficiency of a Sequencing Batch Reactor. Sustainability. 2022; 14(4):2405. https://doi.org/10.3390/su14042405
Chicago/Turabian StyleMasłoń, Adam. 2022. "Impact of Uneven Flow Wastewater Distribution on the Technological Efficiency of a Sequencing Batch Reactor" Sustainability 14, no. 4: 2405. https://doi.org/10.3390/su14042405
Note that from the first issue of 2016, this journal uses article numbers instead of page numbers. See further details here.