Article

Climate Change Impact on the Distribution of Forest Species in the Brazilian Amazon

by
Ingrid Lana Lima de Morais
1,
Alexandra Amaro de Lima
2,
Ivinne Nara Lobato dos Santos
1,
Carlos Meneses
3,
Rogério Freire da Silva
3,
Ricardo Lopes
4,
Santiago Linorio Ferreyra Ramos
5,
Ananda Virginia de Aguiar
6,
Marcos Silveira Wrege
6 and
Maria Teresa Gomes Lopes
1,*
1
Faculty of Agricultural Sciences, Federal University of Amazonas, Avenue Rodrigo Otávio, 3000, Manaus 69060-000, AM, Brazil
2
Institute of Technology and Education Galileo of Amazon, Avenue Joaquim Nabuco, 1950, Manaus 69020-030, AM, Brazil
3
Graduate Program in Agricultural Sciences, Department of Biology, Center for Biological and Health Sciences, State University of Paraíba, Campina Grande 58429-500, PB, Brazil
4
Embrapa Western Amazon, Route AM 10, Km 29, s/n, C.P. 319, Manaus 69010-970, AM, Brazil
5
Institute of Exact Sciences and Technology, Federal University of Amazonas, Nossa Senhora do Rosário, 3863, Itacoatiara 69103-128, AM, Brazil
6
Pollen Laboratory, Embrapa Florestas, Km 111, BR 476, CP. 319, Colombo 83411-000, PR, Brazil
*
Author to whom correspondence should be addressed.
Sustainability 2024, 16(8), 3458; https://doi.org/10.3390/su16083458
Submission received: 31 January 2024 / Revised: 9 April 2024 / Accepted: 11 April 2024 / Published: 20 April 2024

Abstract

:
Studies using ecological niche models highlight the vulnerability of forest species to climate change. This work aimed to analyze the distribution of timber species Aspidosperma desmanthum, Cariniana micranta, Clarisia racemosa, Couratari oblongifolia, and Vouchysia guianensis, which are targets of deforestation, to predict the impacts of climate change and identify areas for their conservation in the Amazon. For this purpose, 37 environmental variables were used, including climatic and edaphic factors. The models were fitted using five algorithms, and their performance was evaluated by the metrics Area Under the Curve (AUC), True Skill Statistic, and Sorensen Index. The deforestation analysis was conducted using data accumulated over a period of 14 years. The study indicated that under the most pessimistic predictions, considering continued high emissions of greenhouse gases (GHGs) from the use of fossil fuels, SSP5–8.5, potential habitat loss for the studied species was more significant. Analyses of the species show that the Western Amazon has a greater climatic suitability area for the conservation of its genetic resources. Further study of the accumulated deforestation over 14 years showed a reduction in area for all species. Therefore, in situ conservation policies and deforestation reduction are recommended for the perpetuation of the analyzed forest species.

1. Introduction

The Amazonian ecosystem has an important role in the conservation of biodiversity and the regulation of the global climate because it is home to the largest rainforest, which has been intensively devastated [1,2]. The maintenance and conservation of biodiversity have been the biggest challenges in the last few decades [3,4,5]. The loss and fragmentation of biodiversity are related to factors such as deforestation, fires, the spread of invasive and/or exotic species, and anthropic activities, especially those influencing climate change [6,7].
Deforestation in the Amazon promotes environmental degradation and consequently the reduction in species and natural resources in the region [8]. During 2022, the increase in deforestation in the Brazilian Amazon was about 12,480 km2, presenting an increase of 2.3% compared to 2021 (12,188 km2) [9]. The rainforest is highly heterogeneous and considered a complex system, which makes it difficult to conduct species monitoring and to obtain more information about mortality, growing and natural regeneration, and climate change impacts [10,11,12].
Several studies highlight the vulnerability of forest species to climate change [13], including changes in the region’s rainfall regime leading to much more intense and longer dry and rainy seasons, which can cause changes in the distribution of these species within an ecosystem [14,15,16], causing changes in its natural habitat. The vulnerability of these areas to land use and climate change has significant implications for their conservation and management, as well as the impact of climate change on the natural ecosystem comprehension [17,18]. The tree species have genetically specific characteristics that may limit their capacity to adapt quickly to environmental changes, from the long cycle of vegetative growth until the period of reproduction and seed formation [19].
Another way of monitoring these changes is through ecological niche models (ENMs). These models allow monitoring on temporal and spatial scales to predict the distribution of species and habitats in future scenarios [20,21,22]. We were able to identify the presence areas of and deduce the relevant holes in economics, culture, and forest ecosystems [23].
To predict the geographic distribution of bats in Europe and Asia, a study performed in the ENMTML package used climatic and landscape relationships. The results showed that the effects of climate, land use, and cover changes made the presence of the studied species more fragmented [24]. ENM application is an important tool for evaluating the threat status of species.
The objective of this study was to analyze the potential distribution of Amazonian timber forest species, Aspidosperma desmanthum Benth. ex Müll. Arg., Cariniana micranta Ducke, Clarisia racemosa Ruiz & Pav., Couratari oblongifolia Ducke & Knuth, and Vouchysia guianensis Aubl.; present the effect of global climate changes in the studied area under the current period and future scenarios; and identify the areas with more climatic suitability for species conservation.

2. Materials and Methods

2.1. Study Area

In this study, occurrence and distribution analyses of the species A. desmanthum, C. micranta, C. racemosa, C. oblongifolia, and V. guianensis were carried out. The tree species data were obtained from the Environmental Information Reference Center (CRIA) database via the SpeciesLink network (https://specieslink.net/; accessed on 1 March 2023), the Global Biodiversity Information Facility database (GBIF, https://www.gbif.org/; accessed on 1 March 2023), and the Botanical Information and Ecology Network database (BIEN) version 1.2.6, available in R software version 4.2. (https://bien.nceas.ucsb.edu/bien/biendata; accessed on 1 March 2023) [25].
For modeling, this study used data from South America; however, the results were limited to the Brazilian Amazon. Furthermore, the scientific name verification of all the species was carried out through the platform Tropicos (https://www.tropicos.org/name/Search?name=; accessed on 1 March 2023). The concentration of these occurrence points was analyzed using kernel density estimation (KDE), obtained through the extension of the interpolation “Heat Map” Epanechnikov and a 1° radius (~111 km) in QGIS version 3.22.8.

2.2. Environmental Variables

Ecological niche model (ENM) development was carried out using 37 environmental variables, of which 19 corresponded to bioclimatic variables and 9 to edaphic ones (Table S1). The climate data were obtained from WorldClim version 2.1, covering a temporal interval of 30 years (1970–2000) and using 9000 to 60,000 meteorological stations [26]. Bioclimatic variables combined include minimum, mean, and maximum temperatures and precipitation, available on the WorldClim dataset (https://www.worldclim.org/; accessed on 1 March 2023) at a temporal resolution of 2.5 min or ~0.041° (~4 km2 per pixel).
Climate data predictions utilized averages from the projections of the sixth Intergovernmental Panel on Climate Changes (IPCC) report of the atmospheric circulating models HadGEM-GC31-LL [27], IPSL-CM6Ä-LR [27], and MIROC6 [28] for two periods: 2021–2040 and 2041–2060. In addition, two Shared Socioeconomic Pathways (SSPs) were considered: SSP2–4.5, which predicts a temperature rise of 2.5 °C, and SSP5–8.5, with a prediction of a global temperature rise of 3 °C by 2060 [26,29].
The effect of edaphic variables was represented using two soil depths (0–20 cm, 20–40 cm) for a total of 18 variables considering soil chemical and physical properties (Table S1). The data used were from the Harmonized World Soil Database at a spatial resolution of 1 km2 (30 s) (version 2.0; [30]) (https://www.fao.org/documents/card/en/c/cc3823en; accessed on 1 March 2023). Edaphic variables were used to improve the modeling process for ENMs since soil attributes may be prevalent as determinants in modeling plant species [31,32,33,34]. Furthermore, the spatial resolution of these variables was reduced to 2.5 min, or ~0041° (~4 km2 per pixel), the same resolution as climatic data.

2.3. Creation and Predictor Modeling Analysis

All the simulations were carried out in the ENMTML Ecological Niche Models at the MetaLand EcologyLab package [20] from RStudio software version 4.3.2, an integrated tool of R software (version 4.2), and when utilizing the tool, it was necessary to extend the Rtools extent (version 4.2). The ENMTML package provides models with different methodologies developed in the ENM field, which are divided into preprocessing, processing, and postprocessing, and it offers different kinds of algorithms to create individual and combined ecological niche models (Table S1).
In the first stage, known as preprocessing, georeferenced occurrence points were checked, along with the environmental variables. Despite the rigorous verification of data presence, these data often showed sampling bias due to sampling concentration in easily accessible locations. Thus, to decrease spatial data autocorrelation, the extension from an occurrence site was reduced to 5 km, through the argument “thin_occ” [20] using the “spThin” [35] package. In order to avoid sampling bias, the data were partitioned into 4 folds through the K-fold, and the validation was carried out according to the total number of folds [36].
The climate variable data present a high collinearity, which is undesirable during the modeling process [37]. To reduce this collinearity, principal component analysis (PCA) was carried out, and fourteen principal components were selected, namely those with more contribution to the analysis, such as the environmental layer, which explains >95% of variation from the original data [20,34,37].
Due to the lack of absence occurrence of the studied species, the geographical and environmental combination methodology [38] was used to allocate pseudo-absence and backgrounds. To relocate the backgrounds, they were delimited in a buffer of 50 km around the presence points, and all the sites without similarity with the presence points were extracted as possible backgrounds to select pseudo-absence. These sites, without similarity, were grouped by K-mean and used to select a representative sample [39]. Additionally, in order to maintain homogeneity in the distribution of pseudo-absences, we determined that the number of pseudo-absences would be the same as the presence number [40].
In the processing stage, thirteen algorithms available in the ENMTML package were tested, and the analysis of the average metric values of AUC, TSS, and Sorensen for each algorithm was performed, considering the five studied species. Then, five best-performing algorithms were selected. Thus, the fit of the consensus model was carried out through the algorithms: Random Forest (RDF), Boosted Regression Trees (BRT), Support Vector Machine (SVM), Bayesian Gaussian Process (GAU), and Maximum Entropy Default (MXD). The consensus model was based on the PCA method, which uses the first principal component to generate the final map [41].
In the postprocessing stage, a predictive performance evaluation of the consensus model was carried out using the following metrics: Area Under the Curve (AUC) [36], True Skill Statistic (TSS) [42], and Sorensen Index [43]. The suitability range establishment was performed by the threshold value TSS [42]. Cell values equal to 1 indicate the suitability area; on the other hand, 0 indicates the unsuitability area for the studied species. Models that presented metric values above 0.7 were considered satisfactory [41,42].

2.4. Loss Analysis of the Environmental Suitability Areas Due to Deforestation

The area loss due to accumulated deforestation for 14 years (2008–2022) was quantified as potential occurrence areas for the species A. desmanthum, C. micrantha, C. oblongifolia, C. racemosa, and V. guianensis in the Brazilian Amazon, with the intention of subtracting these areas due to the probability of the occurrence of these species decreasing in deforested areas. To do so, accumulated deforestation data were based on [9] from the Monitoring Project of Legal Amazon Deforestation by Satellite (PRODES) (terrabrasilis.dpi.inpe.br/downloads/#cat_5; accessed on 1 March 2023).

3. Results

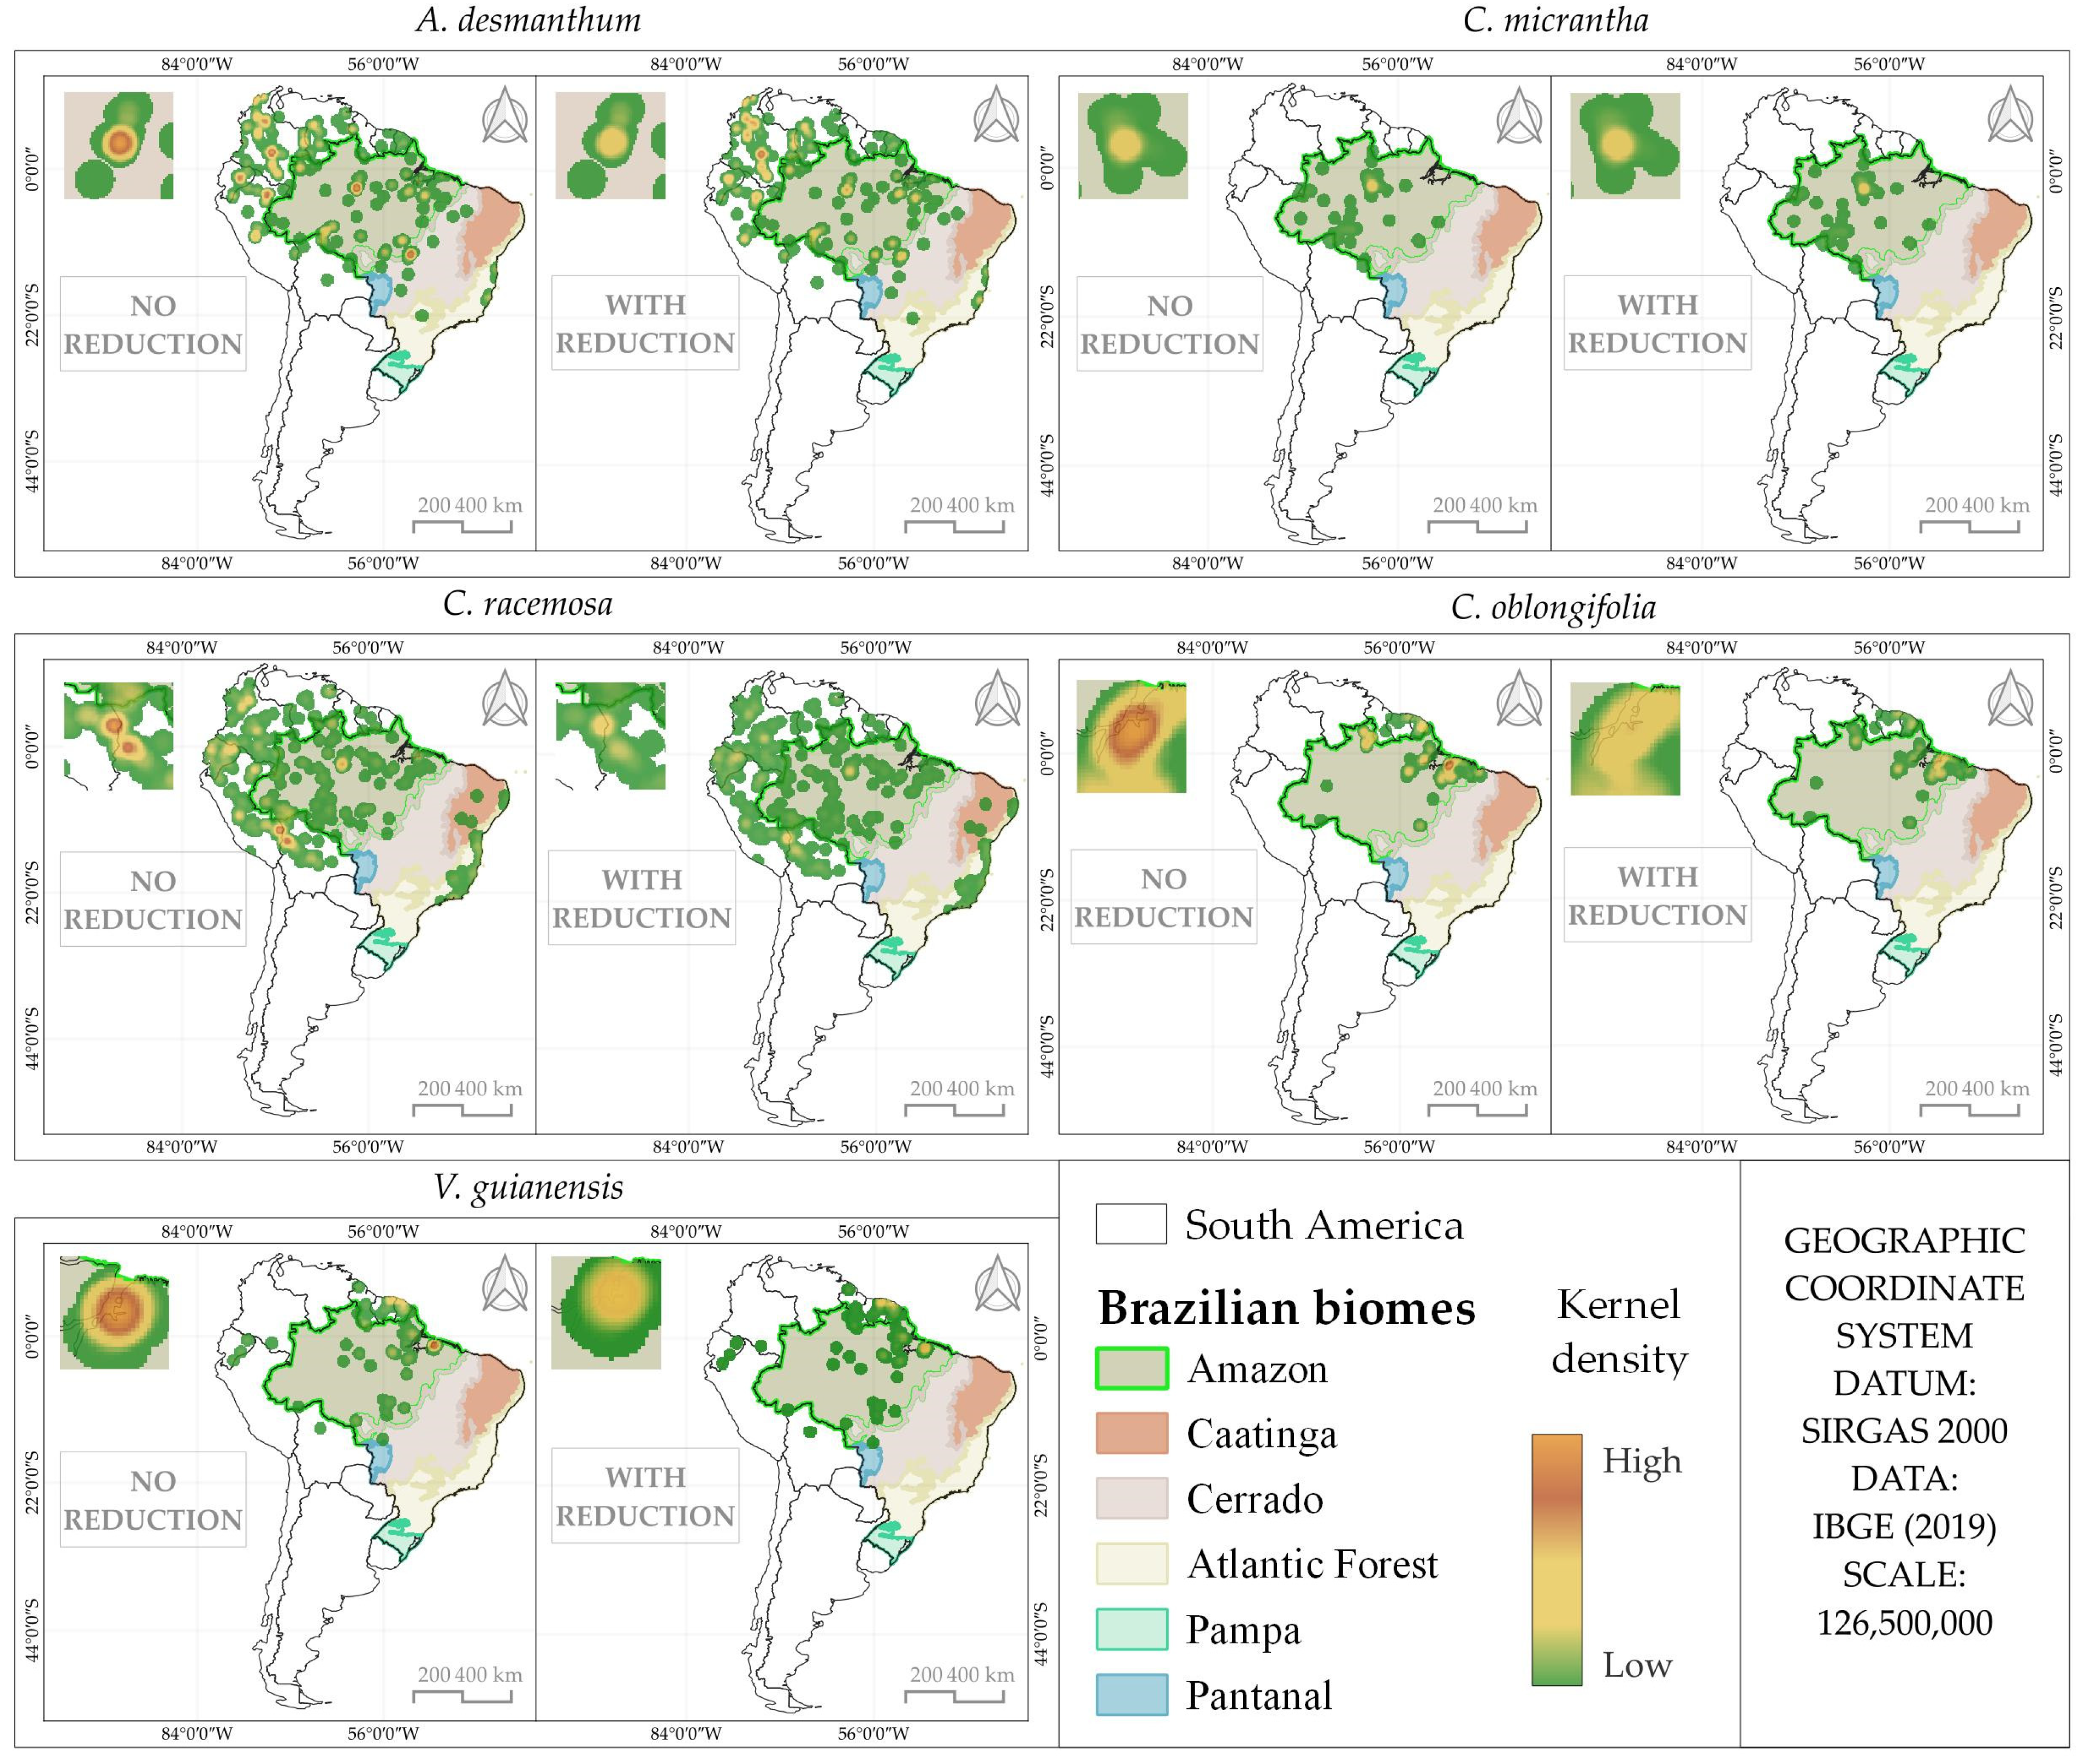
3.1. Distribution Analysis of Species Occurrence

After the species occurrence data were manually cleaned, there were 249 occurrence points for A. desmanthum, 120 points for C. micranta, 852 points for C. racemosa, 110 points for C. oblongifolia, and 115 occurrence points for V. guianensis (Table 1). These points are distributed in countries that are part of the International Amazon; however, it was observed that the concentration is located in the Brazilian Amazon (Figure 1).
Despite the notorious reduction in occurrence points sampled after the manual cleaning of data, it was observed that some of these occurrence points were concentrated in easy locations, which is undesirable. The concentration of records may generate sampling bias, which influences the model performance, creating an underestimation or overestimation in modeling and, consequently, an increase in high spatial autocorrelation [35,44,45].
After the application of a spatial reduction of 5 km through the spThin packages to the species, it was observed that there was a spatial reduction among occurrence points, which decreased their autocorrelation. It was possible to identify the species A. desmanthum, C. micrantha, C. racemosa, C. oblongifolia, and V. guianensis, which presented a reduction of 18%, 52%, 47%, 35%, and 35%, respectively, in the occurrence points (Table 1). This reduction was observed near roads, research institutions, and regions that comprise the International Amazon. The spatial reduction did not exclude the sites that presented new conditions but decreased point agglomeration in the site. Likewise, a reduction can be observed in Figure 1, where the KDE is essentially based on color density; the orange color indicates high density, and the green color indicates low density of occurrence points within a 111 km radius.

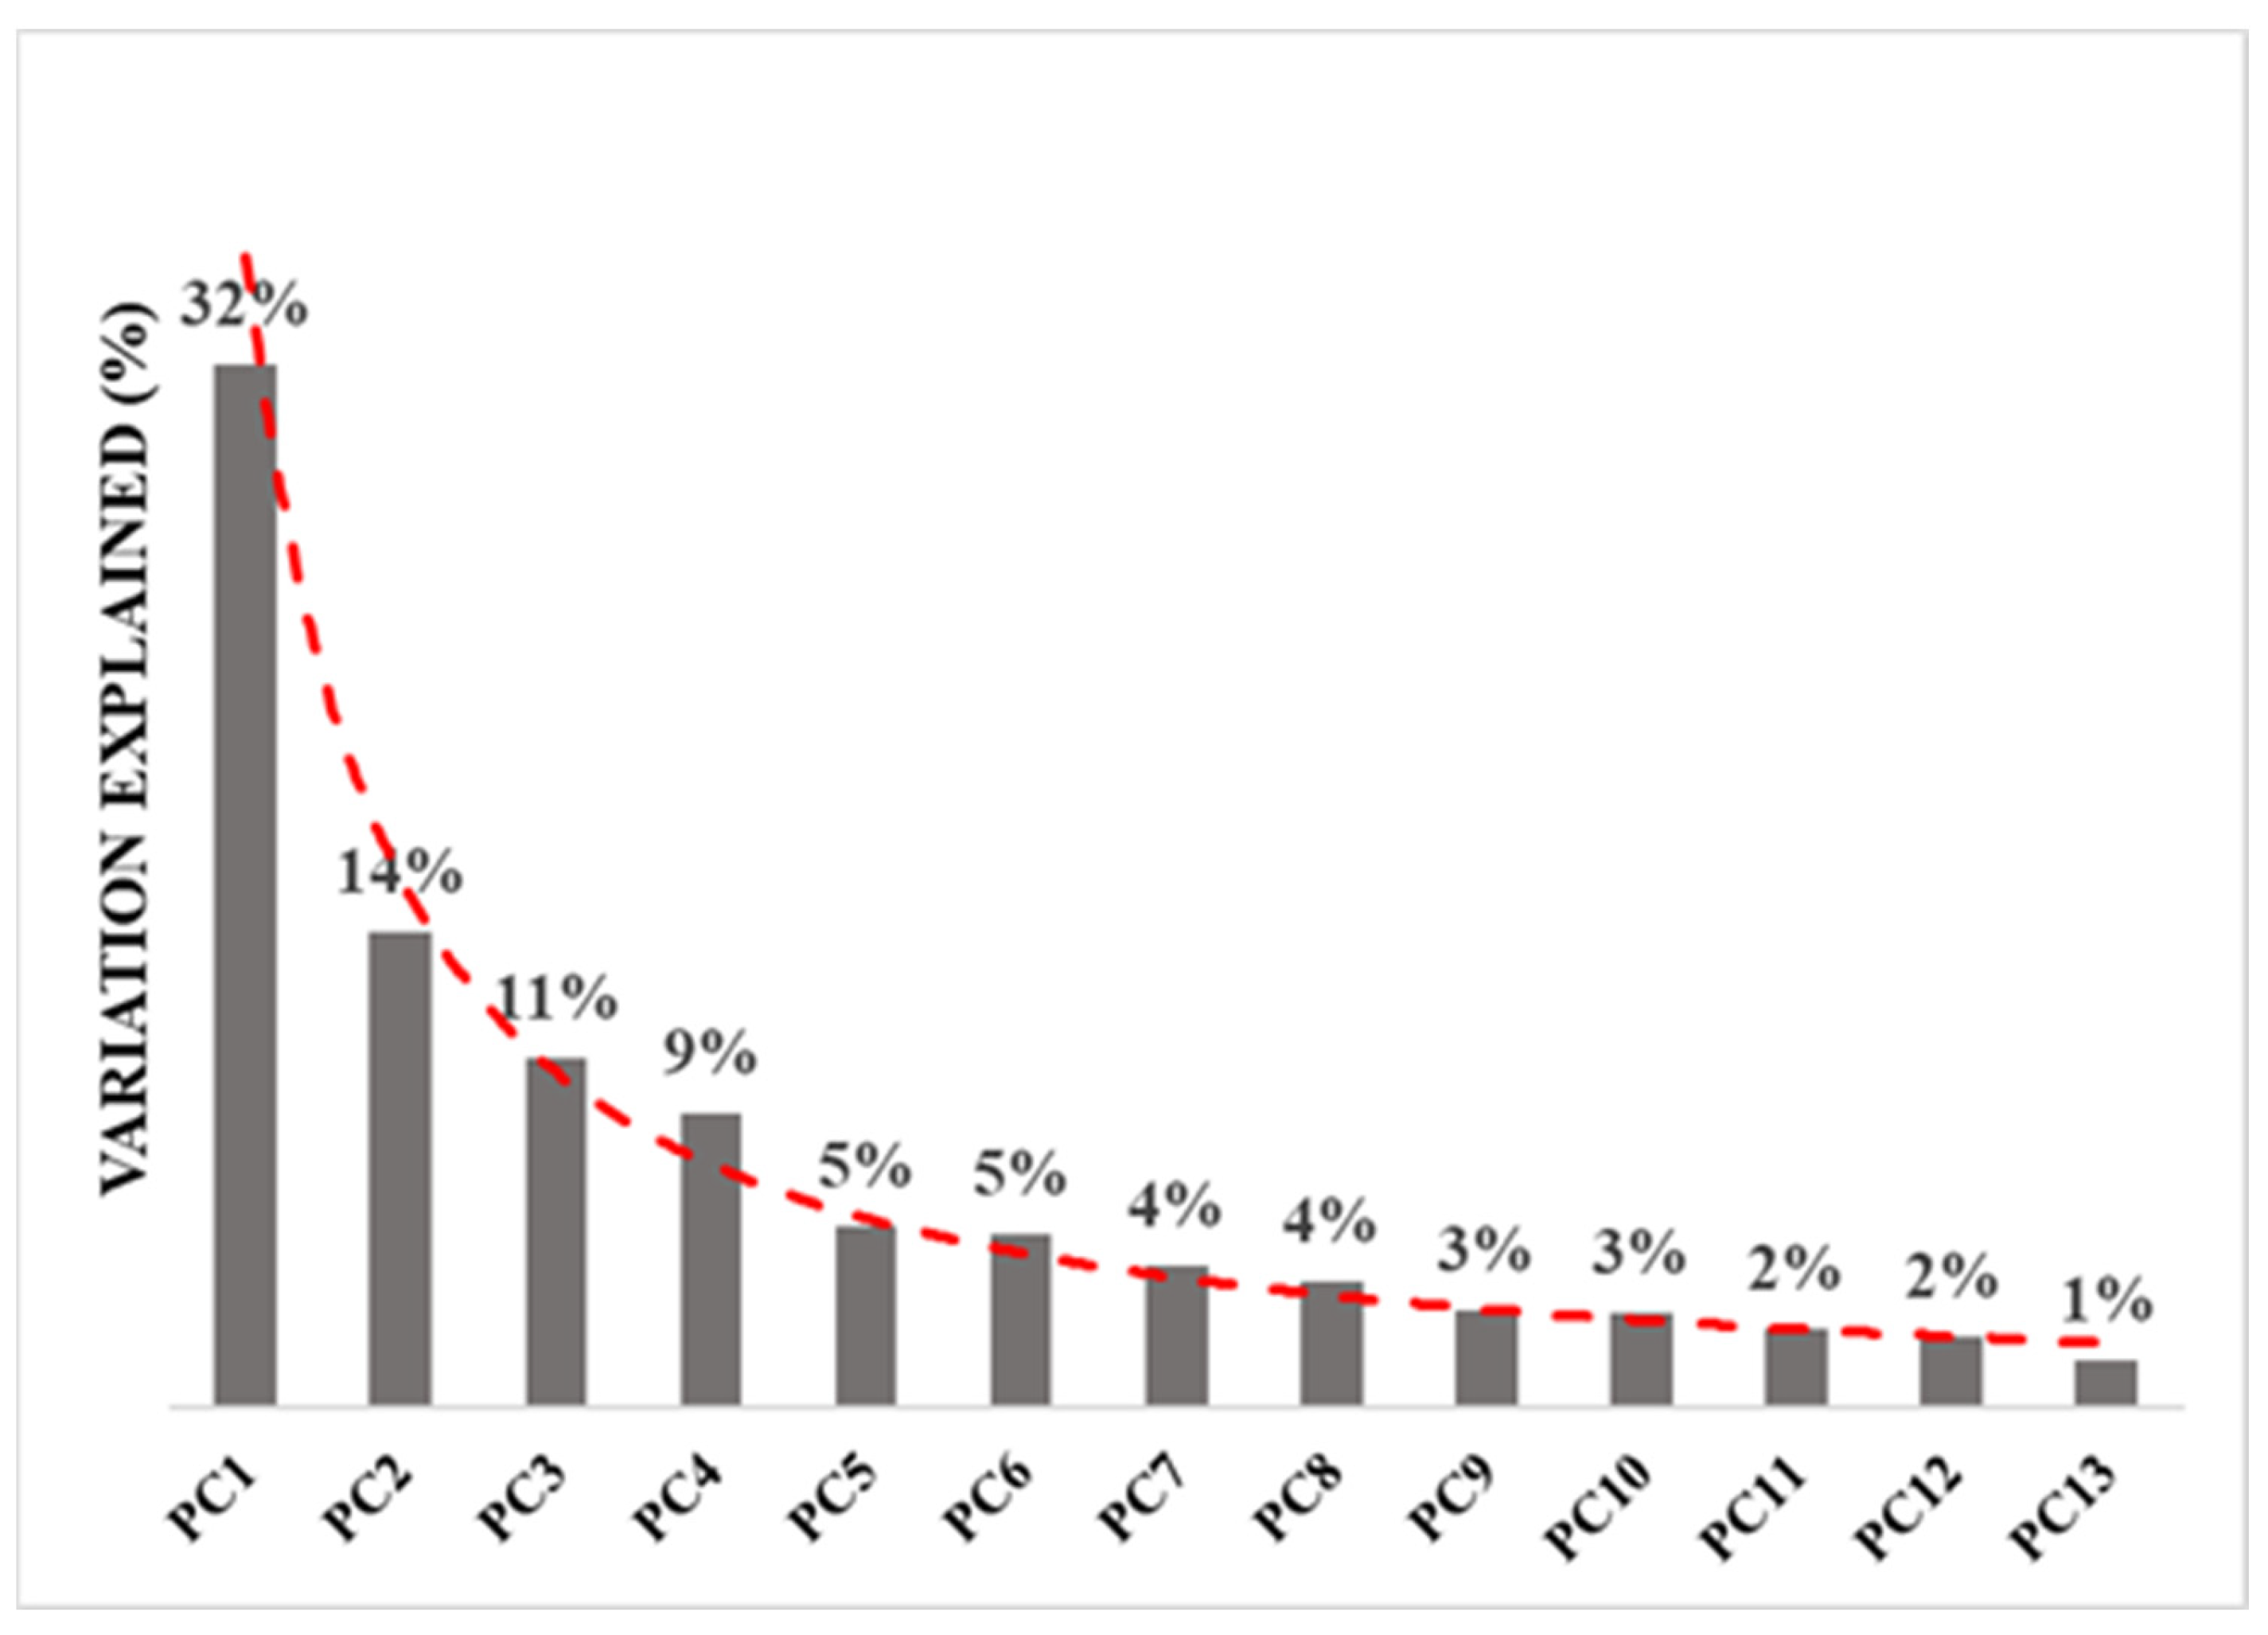
3.2. Environmental Variable Analysis

A principal component analysis (PCA) was carried out using the available dataset and generated 37 new environmental variables [46]. Among the principal components (PCs) generated, the first fourteen were selected, representing 97% of the entire variability data. The first and second PCs were those that best explained the variation, representing 32% and 14%, respectively, of the entire variability dataset (Figure 2).
In an analysis of the variation in the environmental data used and the eigenvectors that make up PC1, temperature seasonality was the most significant variable among the environmental variables, with the highest eigenvector (eigenvector = 0.2432). In PC2, the most significant eigenvector was the sand content for depth intervals of 0–20 m below the surface, presenting values around 0.3383. Among the most expressive eigenvector values for the fourteen PCs are those according to edaphic features, precipitation, and temperature.
Temperature seasonality refers to regular variations and predicted temperatures throughout the year, with increase or decrease periods of analysis. This variable plays an important role in the occurrence and distribution of forest species, as it influences plant growth, phenology, dormancy, and survival [47]. Concerning edaphic features, sand contents are an important element in the ability of rainwater to percolate; consequently, they affect water retention for plants as well as the availability of nutrients in the soil [48].

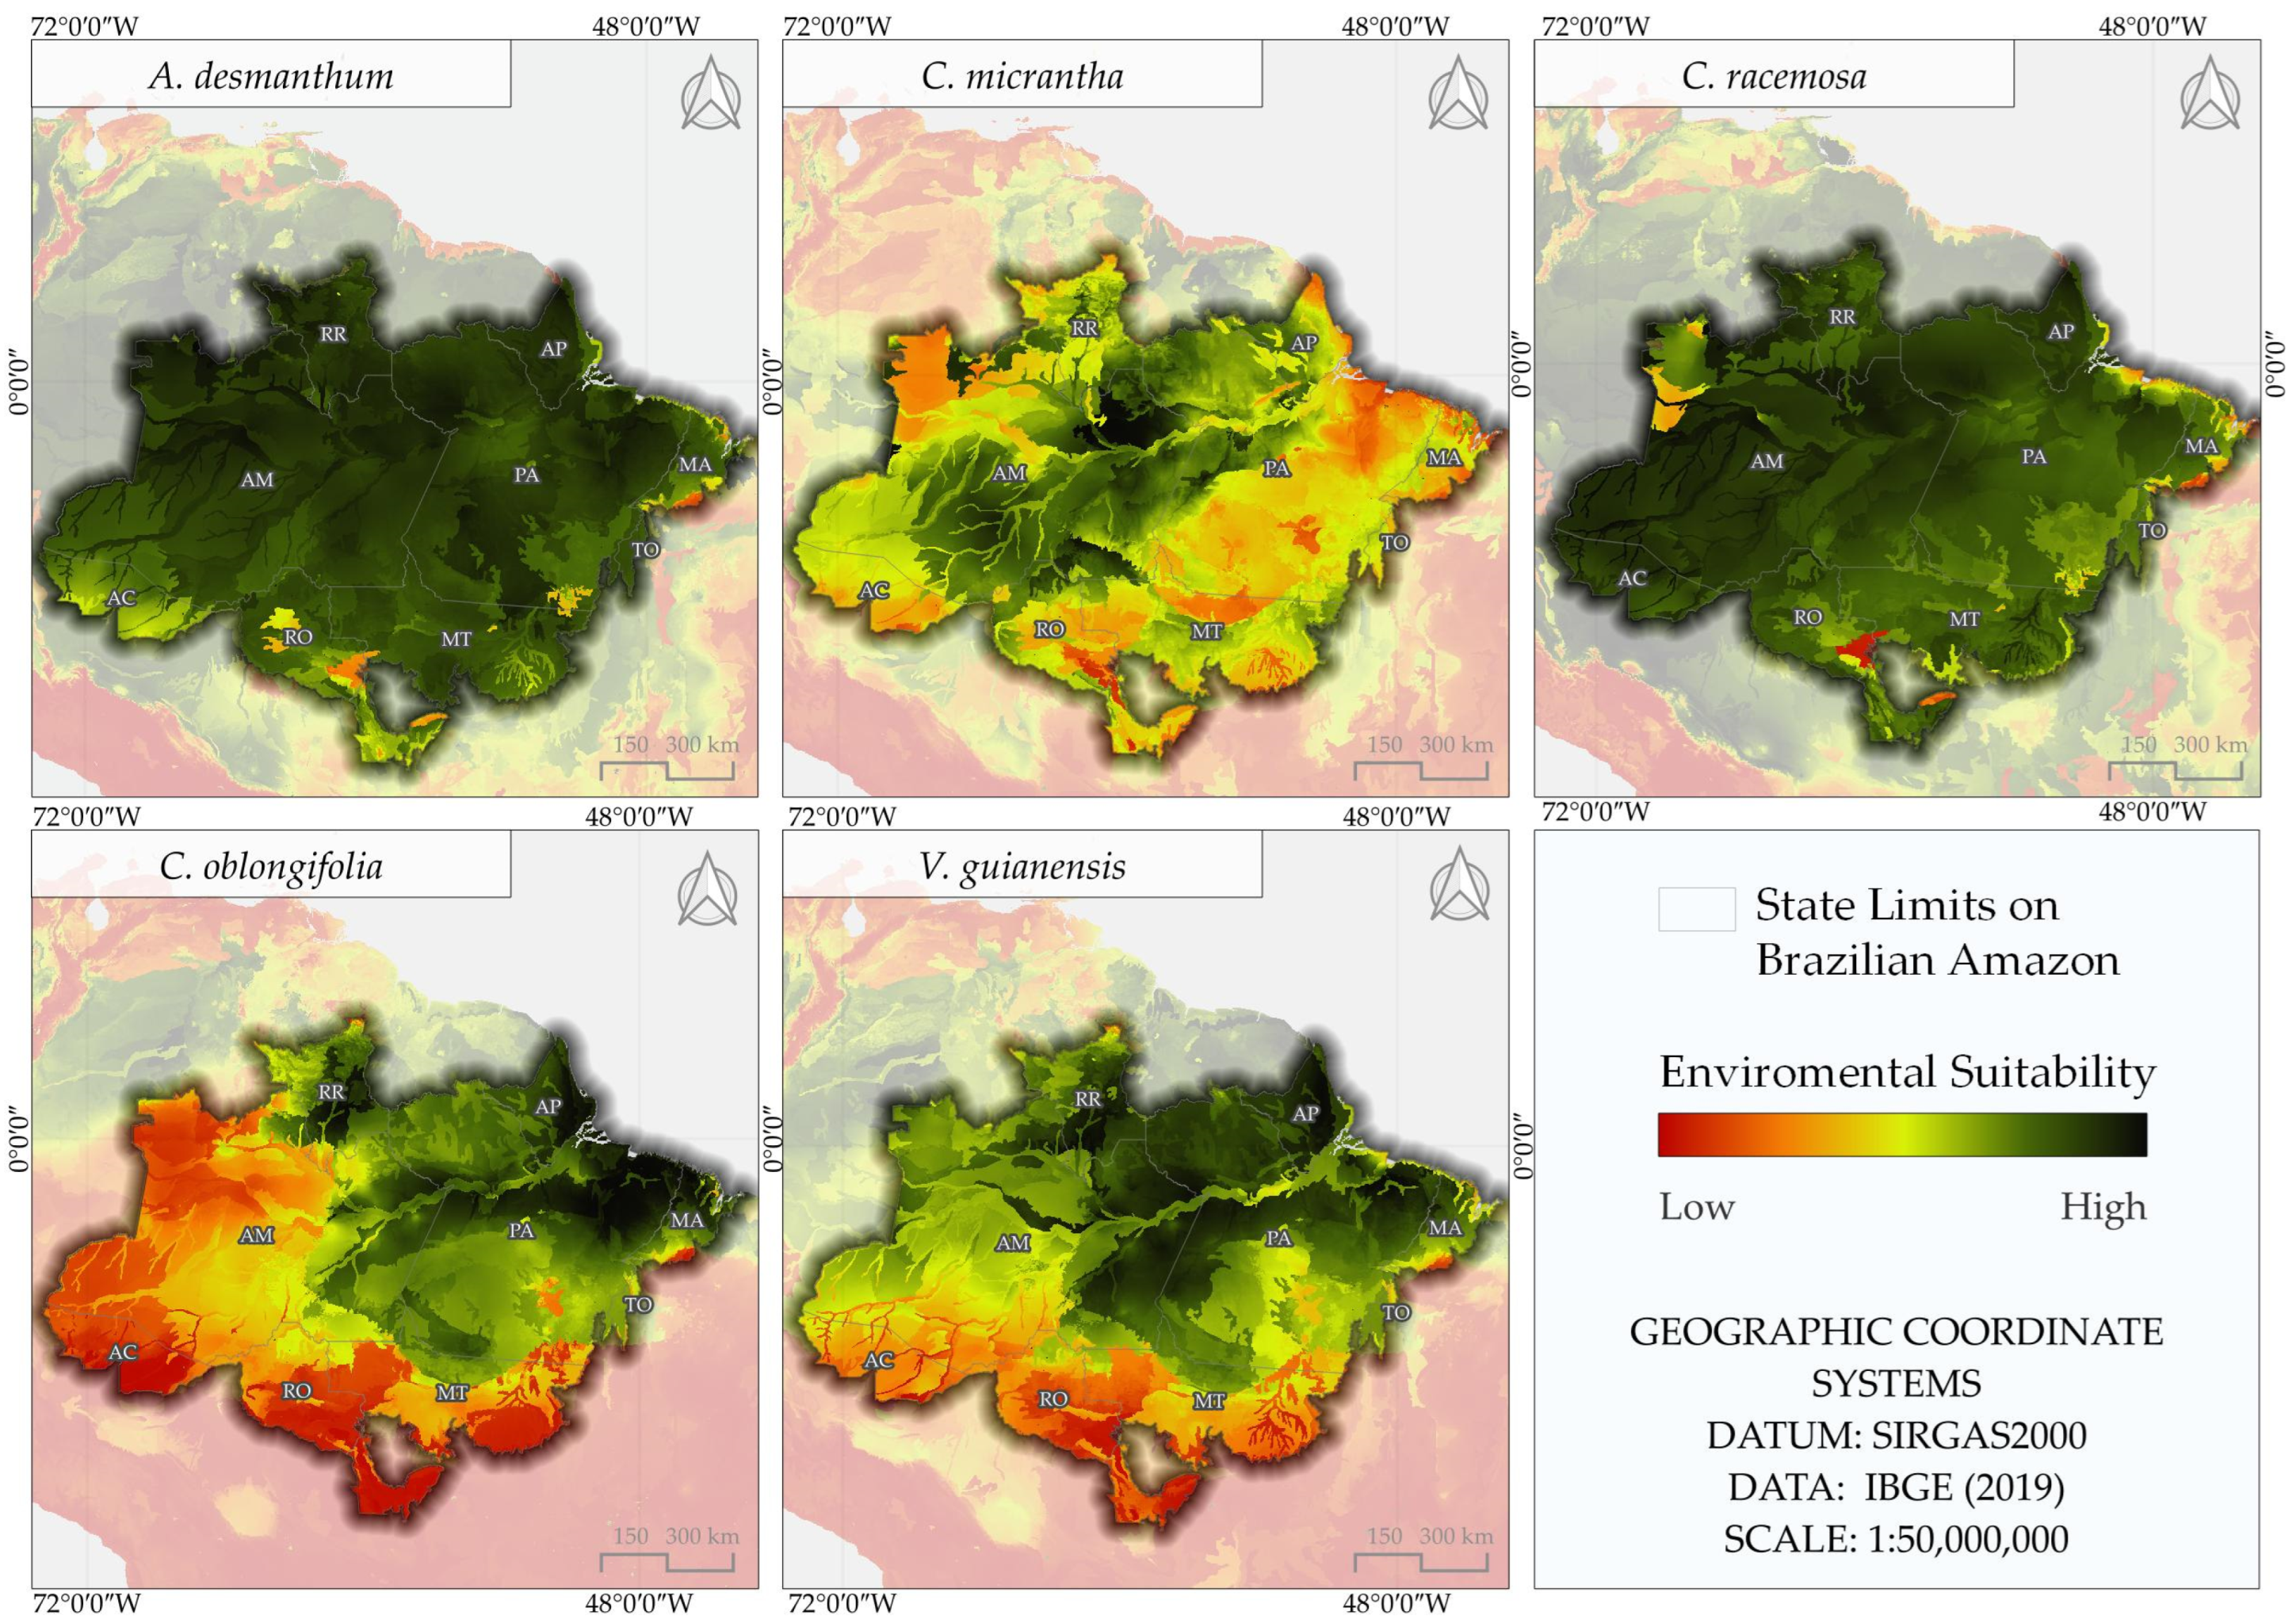
3.3. Areas of Environmental Suitability for the Reference Period

The potential areas for the occurrence of the species A. desmanthum, C. micranta, C. racemosa, C. oblongifolia, and V. guianensis generated using the ENMTML package are shown in Figure 3. The results showed that in base scenarios, all the species presented an environmental suitability area in the Brazilian Amazon.
The species A. desmanthum and C. racemosa showed the highest areas of environmental suitability, approximately 4,136,188 km2 and 4,093,816 km2, respectively, representing 98% and 97% of the total area of the Amazon. The species C. micranta presented an environmental suitability area of approximately 2,465,926 km2, of which 30% is in the Amazonas State, while the area of the species V. guianensis was 2,999,466 km2. C. oblongifolia was the species that showed the lowest area of environmental suitability in the Brazilian Amazon, covering approximately 2,224,906 km2 (Table 2).

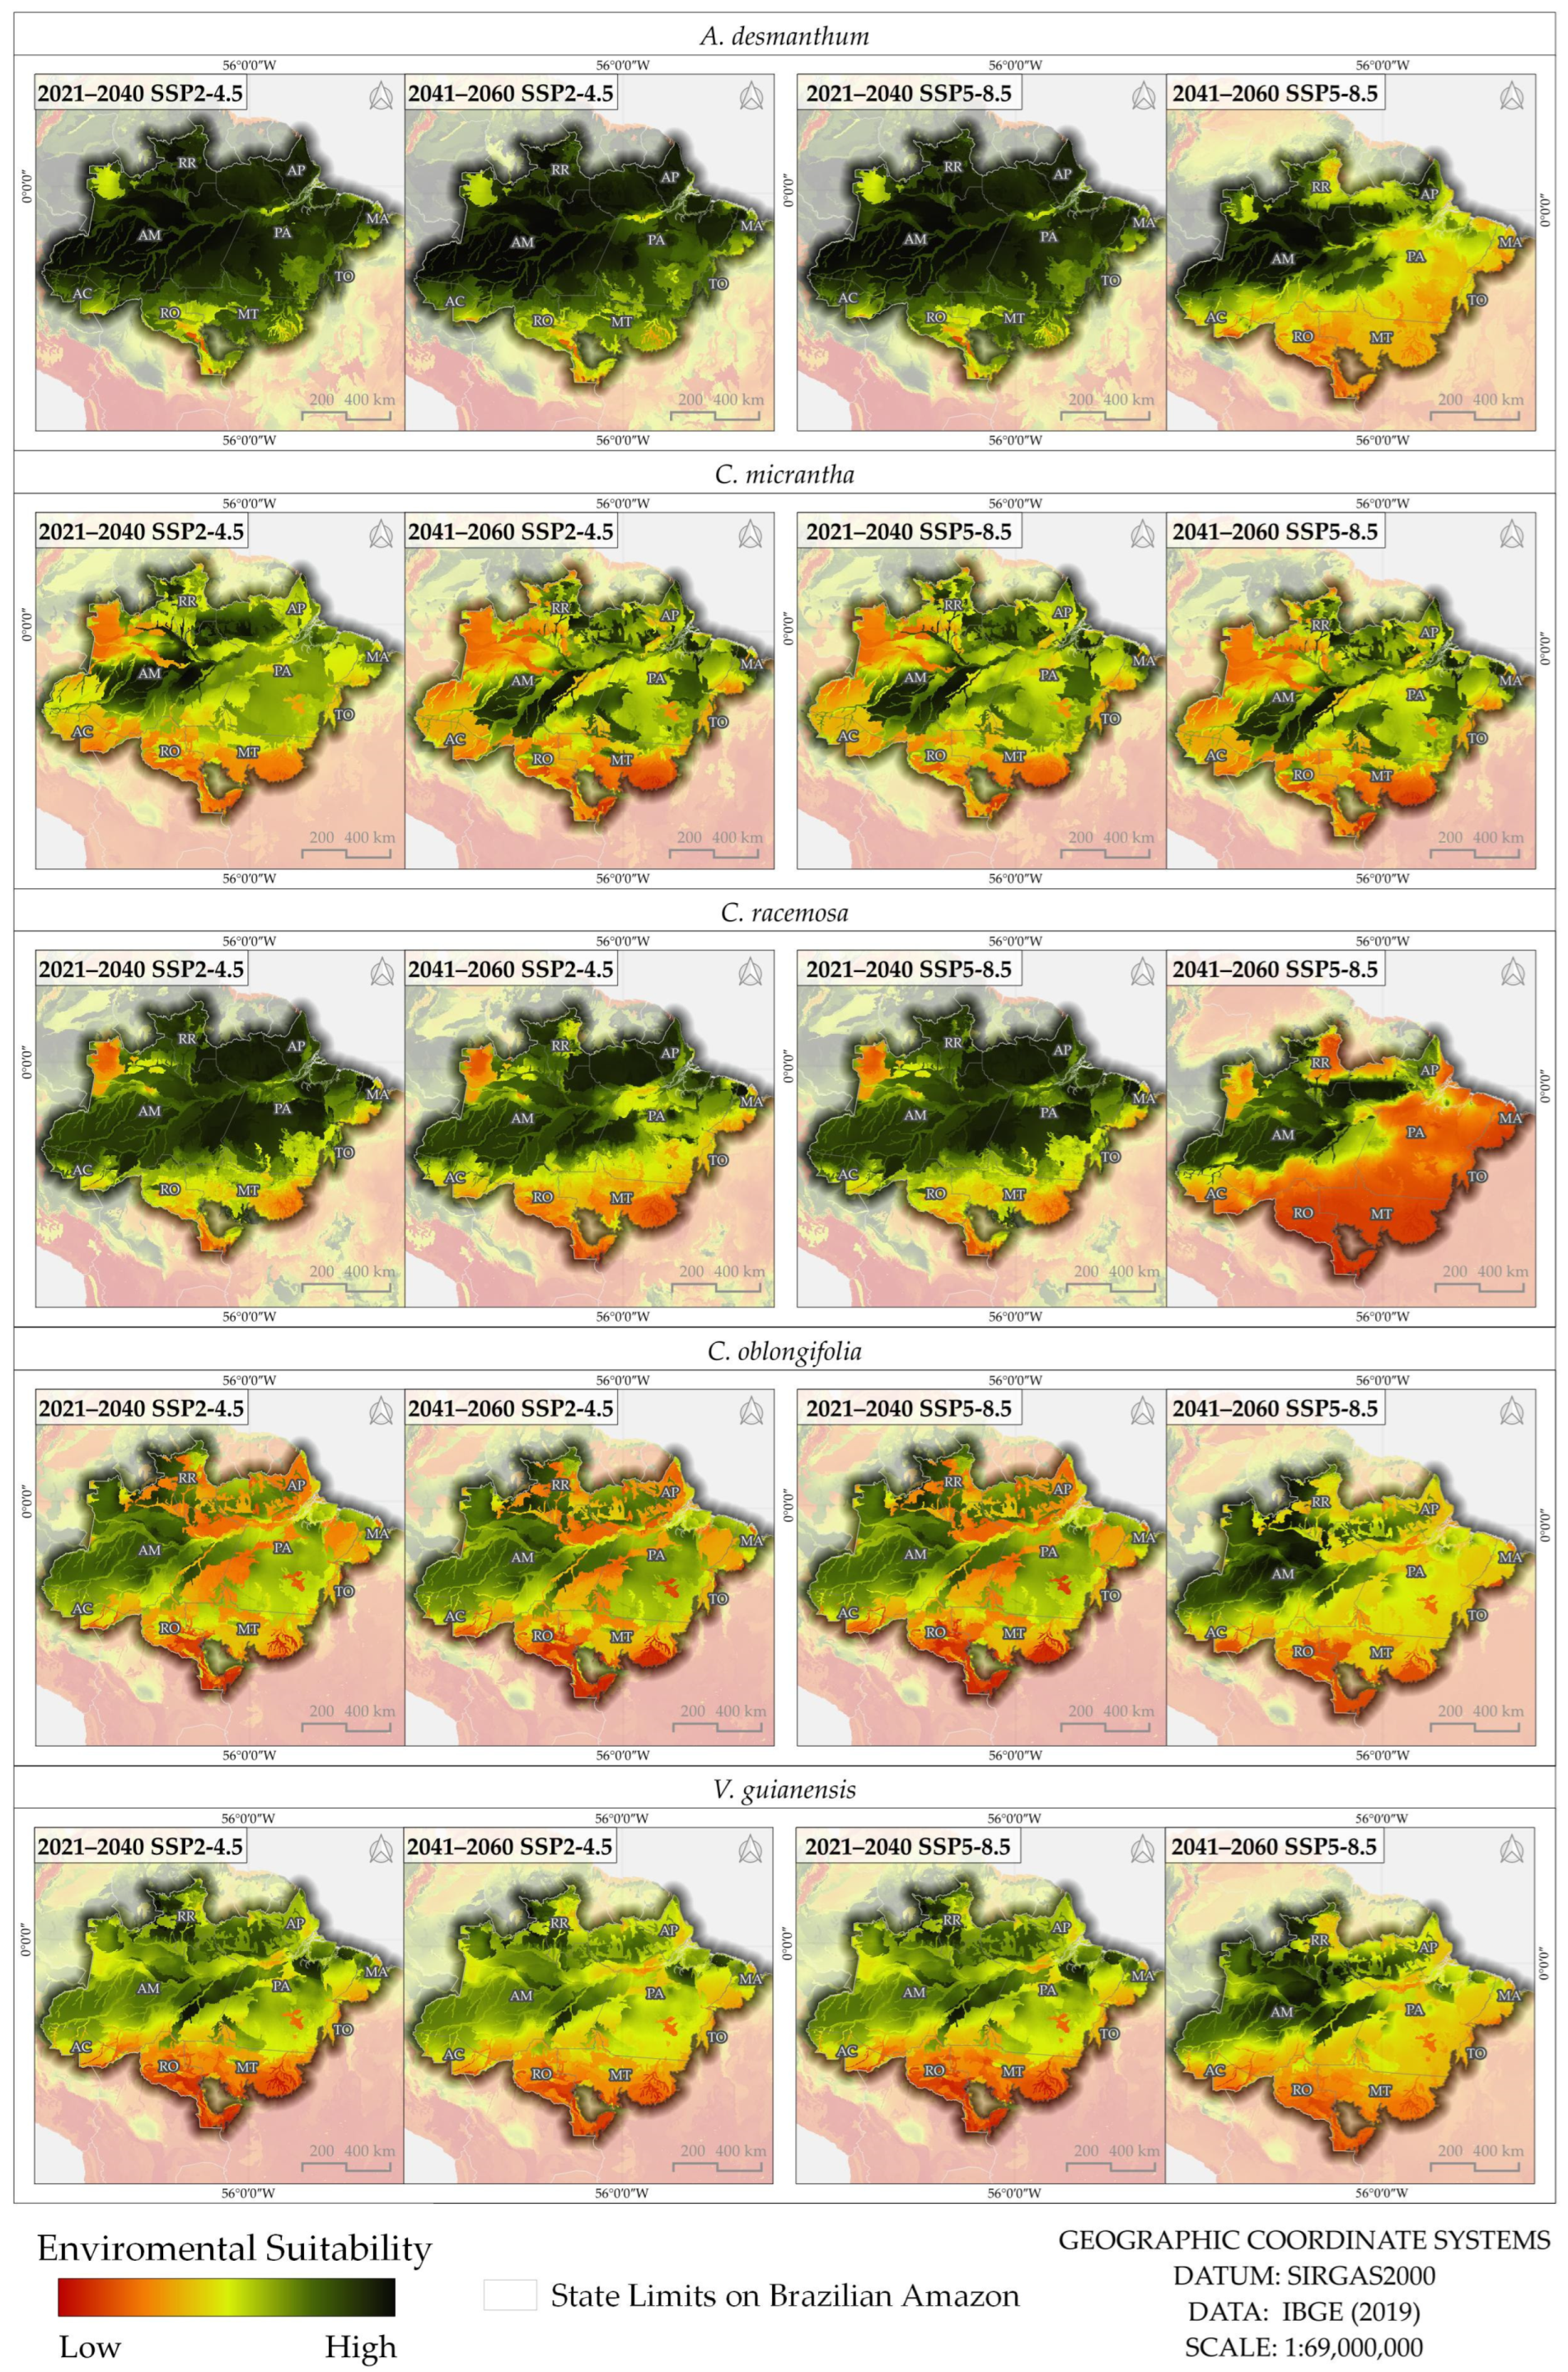
3.4. Area of Environmental Suitability for the Future

Table 2 shows the area of environmental suitability of species occurrence in the Brazilian Amazon for the periods 2021–2040 and 2041–2060. In relation to the base period, it is also possible to observe that for the scenarios SSP2–4.5 and SSP5–8.5, A. desmanthum, despite suffering losses in the estimation of future scenarios, still presented the highest total area of suitability for the studied periods when compared to the other species (C. micranta, C. racemosa, C. oblongifolia, and V. guianensis).
The estimated area of the species was 4,102,344 km2 for the intermediate scenario, SSP2–4.5, for the period of 2021–2040; however, the species has presented a reduction of 33,844 km2, which is equivalent to 1% of the niche area in the base period. It continued to have the largest area in comparison to the other species. For the period of 2041–2060, the reduced area was 2%. The estimates for the scenario SSP5–8.5 infer that the area losses of the species were more significant for the worst-case scenario, it was observed that there was a reduction of 48,862 km2 in the period 2021–2040, approximately 1% of the estimated area for the base period, and 2,446,345 km2 for the period 2041–2060, approximately 41% (Table 2; Figure 3).
The niche areas of the species C. micrantha and C. oblongifolia tend to increase in both scenarios for the period 2021–2040 in the Brazilian Amazon. The species C. micrantha presented an increase of 7% for the scenario SSP2–4.5 and 5% for the scenario SSP5–8.5, according to the base scenario, although, for the period 2041–2060, it was estimated that the species suffered a loss of 1% from its area under the scenario SSP2–4.5 and 3% in the scenario SSP5–8.5. These results revealed that species C. micrantha showed the lowest area variation for the studied scenarios of emission of GHGs, demonstrating that it was the most resilient among the species analyzed. C. micranta is known in the Amazon due to the fact that its seeds easily germinate and survive in open areas.
Although the species C. oblongifolia presents an increase of 12% and 9% in the scenarios SSP2–4.5 and SSP5–8.5, respectively, for the period 2021–2040, it presents a loss of 19% from the environmental suitability area for the period 2041–2060 under the scenario SSP5–8.5. This is a significant difference compared to the estimated area to the scenario SSP2–4.5, where an expansion of 11% under the area for the period 2041–2060 was foreseen (Figure 4).
The estimated niche of C. racemosa in the Brazilian Amazon under the intermediate scenario (SSP2–4.5) predicts a loss of approximately 549,816 km2 by 2040, the equivalent of 13% of the estimated area in the base period. By 2060, the area lost is expected to be around 1,204,119 km2 (29%), more than double the area previously predicted. In the worst-case scenario, SSP5–8.5 predicts a reduction of 16% in the suitability area for the species occurrence from 2021 to 2060 and 62% between 2041 and 2060. The species C. racemosa was demonstrated to be more sensitive to environmental conditions under different GHG emission scenarios; the prediction indicates that the loss for the scenario SSP5–8.5 was 33% higher than the prediction for intermediate scenario for the period 2041–2060 (Figure 4).
We estimated the loss of niche area for the species V. guianensis for the intermediate scenario (SSP2–4.5) and worst-case scenario (SSP5–8.5) during both periods analyzed. Under the pessimistic scenario, the reduction in the niche area was more significant than the estimated areas in the intermediate scenario. V. guianensis species showed 7% and 37% loss for the periods 2021–2040 and 2041–2060, respectively. For the intermediate scenario, the reduction was estimated at 4% and 13% for the same period, respectively (Figure 4).
The SSP5–8.5 scenario showed that species suffered more expressive losses than SSP2–4 (Figure 4). The SSP2–4.5 scenario predicts a moderate increase in GHG emissions, even after adopting climate change mitigation policies. For the SSP5–8.5 scenario, the emissions were considered higher and less sustainable when compared to other scenarios. The world is heading towards the SSP5–8.5 scenario, which predicts an increase in temperature of 1.9 °C to 3.0 °C by 2060 [33] due to the continuous increase in CO2 emissions caused mainly by the burning of fossil fuels, deforestation, and industrial processes. In the study of Urena lobata L., the results of ecological modeling showed the extinction of the species by 2070 for the most pessimistic scenario (SSP5–8.5) [49].
There is variability in emissions between the Eastern and Western Amazon regions. In the case of the Eastern region, there is a significant reduction in the occurrence area of the species A. desmanthum, C. racemosa, C. oblongifolia, and V. guianensis (Figure 4). This is an area that coincides with the “area of deforestation”, where there has also been an expansion of agriculture and livestock farming. Higher rates of GHG emissions contribute to global warming and its associated effects, such as rising temperatures, changes in rainfall patterns, and extreme climate events [50].
The migration of forest species from the Eastern Amazon to other regions has been observed as a response to climate change, mainly due to increasing temperatures and changes in rainfall patterns [49]. These changes could lead to a decrease in water availability in some areas, affecting the survival of plants, animals, and insects that migrate and are part of the maintenance ecosystem. The loss of Amazon species caused by climate change and deforestation by 2050 has been reported at 30% and 47%, considering SSP1–2.6 and SSP5–8.5, respectively, and the Eastern Amazon is reported as the most affected in the analysis [51]. The most vulnerable areas to environmental losses are those located in Pará (Brazil), where there is a high level of deforestation, an increase in temperature, and a trend for precipitation reduction.
Although forest species are known as resilient, in recent years, there has been a significant increase in the occurrence of extreme climatic events in shorter periods, such as long-term droughts and extreme rainfall, making it necessary for these species to adapt quickly in order to survive. Some individuals have specific genetic characteristics that may limit their ability to adapt quickly to changes. Considering natural selection within natural plant populations, climate change may act as a selective agent, reducing their genetic diversity, gene flow, and ability to adapt to extreme events [52].
After the 2005 drought, some forests in the Amazon decreased, and this reduction was observed mainly in areas that presented the highest water deficits, as registered in the south of the Amazon [53]. When adaptive responses have not been noticed, such as phenological changes, the species may become locally extinct or migrate to other regions looking for the most favorable environment to develop. This pattern can be observed in the niche distribution of the species A. desmanthum, C. racemosa, C. oblongifolia, and V. guianensis.
The Western Amazon has relatively more preserved forest cover and less deforestation than the Eastern Amazon. GHG emissions tend to be relatively lower in this region, increasing the possibility of other species migrating in order to find an ecosystem in favor of their perpetuation. The areas of the Western Amazon are recommended for in situ conservation, through conservation units, because they are suitable habitats for the perpetuation of the species and because in situ conservation is more cost-effective than ex situ conservation.
Climate changes may cause a reduction in the species distribution of this study, plus a decrease of genetic variability of populations, and consequently may increase the inbreeding within each species. The effects of inbreeding and inadequate effective population size hinder the adaptation of forest species [16], making them more vulnerable to extreme climate changes and habitat fragmentation [54].
In addition to the studies carried out that address bioclimatic variables with the geospatial distribution of plants, experimental studies can be conducted under controlled conditions to clarify how rising temperatures can affect the optimal conditions necessary for the growth and survival of specific plant species. Such research should include monitoring, at different temperatures, for the same species, pollen production, pollination, fruiting, growth, and mortality of plant populations, as well as the evaluation of physiological responses, such as photosynthesis and transpiration rates [49].
Based on the prediction of reduction areas of several forest species in the Amazon for future scenarios, it is relevant to the development of genetic conservation to carry out studies that may simulate the extreme conditions of climate change, namely germination tests using higher temperatures, plantings in dry conditions, and mutation experiments in the lab in order to study genetic variability, aiming to find resilient mutants in response to extreme conditions [16]. Field planting of selected individuals for adverse conditions, anticipating climate change, and introducing the most resilient individuals will reduce the risk of extinction and allow continuity in the species evolution process.
Considering the economic and ecological importance of the species A. desmanthum, C. micranta, C. racemosa, C. oblongifolia, and V. guianensis, this study suggests the characterization of their genetic resources in order to make management and conservation strategies more efficient. Molecular marker studies, which intend to evaluate the magnitude and distribution of the genetic variability of populations in different areas over a long period, will allow us to infer how climate change will affect this distribution.
The species populations in the Eastern Amazon will be the most affected by climate change. In order not to lose genetic variability, current conservation should prioritize the conservation of the most affected population in the region, particularly those in the arc of deforestation, which are most vulnerable. The recommendation for the conservation of forest species is that it should be carried out in situ, once it comes to gene flow, which is crucial to the continuity of genetic variability [55]. Moreover, due to the fact that the Eastern Amazon presents areas of difficult climatic suitability in the future, it would be prudent to collect seeds and pollen from species in these sites of low climatic suitability in order to also carry out ex situ conservation of the genetic resources of threatened populations. This study suggests adopting cryopreservation strategies to initiate the seed conservation of these forest species.
Addressing the impacts of climate change on the distribution of forest species in the Brazilian Amazon requires an approach that involves multidisciplinary studies and actions, including robust conservation measures, sustainable land management, and global actions to mitigate climate change.

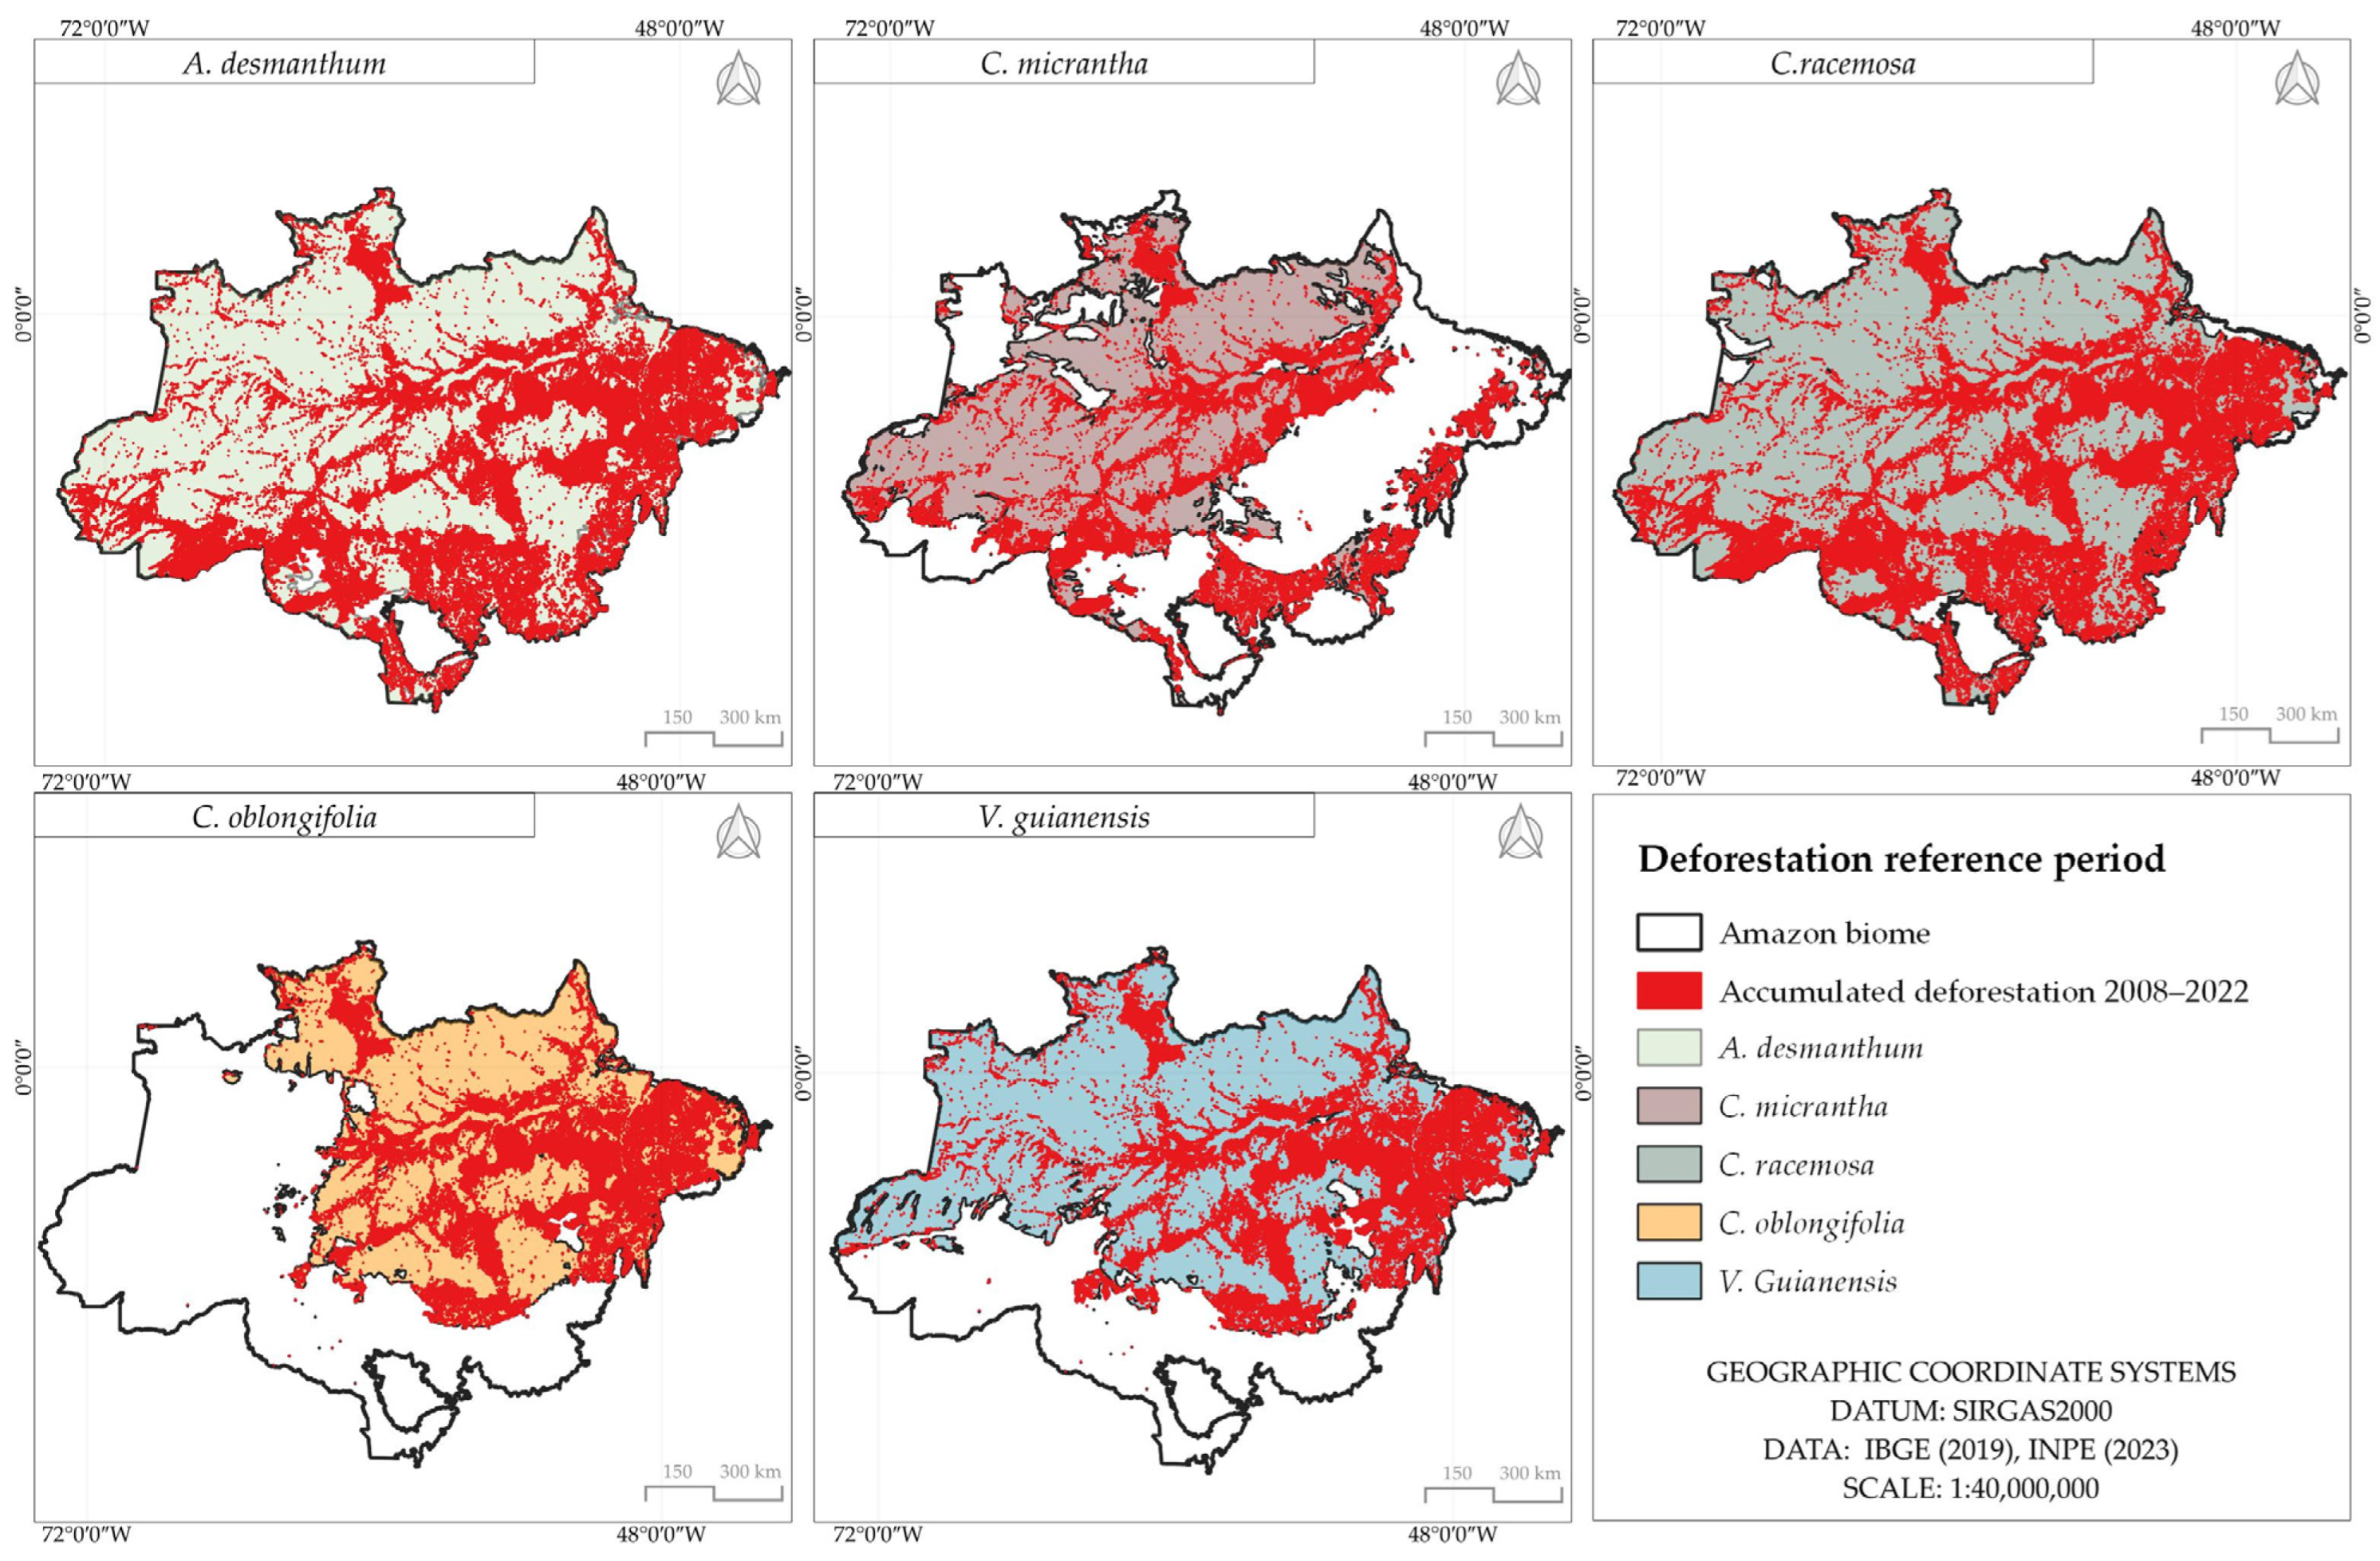
3.5. Accumulated Deforestation in Potential Areas of Species Occurrence

Analyses of the accumulated deforestation up to the year 2022, over 14 years, showed a reduction of 112,977 km2, 56,478 km2, 114,396 km2, 65,961 km2, and 68,564 km for A. desmanthum, C. micranta, C. racemosa, C. oblongifolia, and V. guianensis, respectively, according to the base period, from PRODES data (Figure 5). The species are considered vulnerable to exploitation and commercialization due to the good quality of the wood, and there are no records of commercial plantation areas. They are slow-growing and large species, for which reproduction is difficult; seed production is low in quantity or quality, and the matrices are in places that are difficult to access for collecting seeds [11].
Deforestation is the principal cause of the temperature increases. When the forests are cleared, part of the carbon fixation in their biomass is released into the atmosphere, which increases their concentration and contributes to the temperature increase. Furthermore, due to climatic factors, deforestation promotes forest fragmentation, leading to populational isolation and genetic diversity reduction [52,56].
The deforestation registered in 2013 was responsible for a decline of 7% in estimated occurrence areas of Amazon tree species, and it will achieve a rise of 19–33% by 2050, considering the projected deforestation analyses [49]. It is recommended to adopt conservation strategies to reduce deforestation, recover degraded areas, promote the proper management of natural resources, and protect hotspots for biodiversity. In addition, environmental awareness and education programs are important, with the aim of involving local communities in the conservation and valuation of ecosystem services offered by the Amazon rainforest.

3.6. Model Evaluation

The values of the used metrics were AUC > 0.96, TSS > 0.84, and Sorensen > 0.92 (Table 3). The developed consensus models, combined with five algorithms, were considered as fitted metrics in their evaluation: AUC = 0.995 ± 0.001, TSS = 0.961 ± 0.016, Sorensen = 0.980 ± 0.008 for the species A. desmanthum; AUC = 0.965 ± 0.019, TSS = 0.847 ± 0.053, Sorensen = 0.927 ± 0.024 for the species C. micrantha; AUC = 0.989 ± 0.007, TSS = 0.932 ± 0.029, Sorensen = 0.966 ± 0.014 for the species C. racemosa; AUC = 0.986 ± 0.009, TSS = 0.916 ± 0.055, Sorensen = 0.956 ± 0.031 for the species C. oblongifolia; and AUC = 0.981 ± 0.018, TSS = 0.906 ± 0.090, Sorensen = 0.951 ± 0.050 for the species V. guianensis.
From the results obtained, it could be seen that all the models presented had favorable fit results with values over 0.7 for all the evaluation metrics [41,42], and this can be confirmed from the observed standard deviation values.

4. Conclusions

The occurrence points of the species A. desmanthum, C. micranta, C. racemosa, C. oblongifolia, and V. guianensis are in countries that compose the International Amazon, but their widely concentrated distribution is in the phytogeographic domain of the Brazilian Amazon.
The spatial reduction of the occurrence points of the species A. desmanthum, C. micranta, C. racemosa, C. oblongifolia, and V. guianensis recommended for data analysis aimed to avoid model bias by reducing the aggregation of points in easy access without exclusion of areas representative of the natural occurrence of these species, thus showing the efficiency of reducing points with overlap or very close proximity.
C. micrantha reveals itself to be more resilient to climate change, presenting less variation in area in the different scenarios of GHG emissions in comparison to the species A. desmanthum, C. micranta, C. racemosa, C. oblongifolia, and V. guianensis, while C. racemosa showed itself to be the most sensitive to the most significant niche area losses.
The habitat reduction for the species A. desmanthum, C. micranta, C. racemosa, C. oblongifolia, and V. guianensis occurs mainly in the Eastern Amazon, in the region named the “arc of deforestation”, considering the periods of 2021–2040 and 2041–2060 based on the scenarios SSP2–4.5 and SSP5–8.5. For the scenario SSP5–8.5 (2041–2060), it has been observed that the suitability areas extend toward Eastern Amazonia, even for the resilient C. micranta, which has also been maintained in the Eastern Amazon area.
Analysis of the species shows that the Western Amazon has a greater climatic suitability area for the conservation of A. desmanthum, C. micrantha, C. racemosa, C. oblongifolia, and V. guianensis.
The losses in areas with environmental suitability for species occurrence in the SSP5–8.5 scenario, considering high rates of greenhouse gas (GHG) emissions, are more significant when compared to the losses in other scenarios.

Supplementary Materials

The following supporting information can be downloaded at https://www.mdpi.com/article/10.3390/su16083458/s1: Table S1: Coefficients of the principal components (PCs) selected by the PCAs for bioclimatic and edaphic variables together.

Author Contributions

Conceptualization, I.L.L.d.M., S.L.F.R., I.N.L.d.S., C.M., R.L. and M.T.G.L.; methodology, I.L.L.d.M., M.S.W., S.L.F.R., R.L., A.V.d.A., M.T.G.L. and A.A.d.L.; software, M.S.W., S.L.F.R. and A.A.d.L.; validation, R.L., I.N.L.d.S., M.S.W., R.F.d.S., A.V.d.A. and S.L.F.R.; formal analysis, M.S.W., S.L.F.R. and M.T.G.L.; resources, M.T.G.L., A.V.d.A., C.M., A.A.d.L. and S.L.F.R.; writing—original draft preparation, I.L.L.d.M., R.F.d.S., S.L.F.R., R.L., M.T.G.L. and C.M.; writing—review and editing, R.F.d.S., M.T.G.L., R.L. and C.M.; funding acquisition, M.T.G.L. and C.M. All authors have read and agreed to the published version of the manuscript.

Funding

This research has the financial support of the National Council for Scientific and Technological (CNPq) process No. 442914/2020-2. This study was financed in part by Paraiba State University, PRPGP grant #01/2024, and by the Coordination of Superior Level Staff Improvement—Brazil (CAPES)—Edital No. 16/2020—PROCAD-SPCF.

Institutional Review Board Statement

Not applicable.

Informed Consent Statement

Not applicable.

Data Availability Statement

Data are contained within the article.

Acknowledgments

The authors wish to thank the Forest and Environmental Sciences Graduate Program of the Federal University of Amazonas (PPGCIFA/UFAM). Carlos Henrique Salvino Gadelha Meneses (Process No. 313075/2021-2), Santiago Linorio Ferreyra Ramos (Process No. 305280/2022-8), Ricardo Lopes (Process No. 308815/2023-8) and Maria Teresa Gomes Lopes (Process No. 310307/2018-0) were supported by fellowships from CNPq. Ingrid Lana Lima de Morais was supported by fellowships from FAPEAM—Amazonas State Research Support Foundation.

Conflicts of Interest

Author Ricardo Lopes was employed by the company Embrapa Western Amazon; Authors Ananda Virginia de Aguiar and Marcos Silveira Wrege were employed by the company Embrapa Florestas; The remaining authors declare that the research was conducted in the absence of any commercial or financial relationships that could be construed as a potential conflict of interest.

References

  1. Artaxo, P.; Hansson, H.C.; Machado, L.A.T.; Rizzo, L.V. Tropical forests are crucial in regulating on Earth. PLoS Clim. 2022, 1, e0000054. [Google Scholar] [CrossRef]
  2. Val, A.L.; Wood, C.M. Global changes and physiological challenges for fish of the Amazon today and in the near future. J. Exp. Biol. 2022, 225, jeb216440. [Google Scholar]
  3. Qin, Y.; Xiao, X.; Liu, F.; de Sa e Silva, F.; Shimabukuro, Y.; Arai, E.; Fearnside, P.M. Forest Conservation in Indigenous Territories and Protected Areas in the Brazilian Amazon. Nat. Sustain. 2023, 6, 295–305. [Google Scholar] [CrossRef]
  4. Green, J.M.H.; Croft, S.A.; Durán, A.P.; West, C.D. Linking global drivers of agricultural trade to on-the-ground impacts on biodiversity. Proc. Natl. Acad. Sci. USA 2019, 116, 23202–23208. [Google Scholar] [CrossRef]
  5. Linares, L.M.D. The awkward question: What baseline should be used to measure biodiversity loss? The role of history, biology and politics in setting up an objective and fair baseline for the international biodiversity regime. Environ. Sci. Policy 2022, 135, 137–146. [Google Scholar] [CrossRef]
  6. Sintayehu, D. Impact of climate change on biodiversity and associated key ecosystem services in Africa: A systematic review. Ecosyst. Health Sustain. 2018, 4, 225–239. [Google Scholar] [CrossRef]
  7. Habibullah, M.S.; Din, B.H.; Tan, S.H.; Zahid, H. Impact of climate change on biodiversity loss: Global evidence. Environ. Sci. Pollut. Res. Int. 2022, 29, 1073–1086. [Google Scholar] [CrossRef] [PubMed]
  8. Silva, L.B.; Oliveira, G.; Frederico, R.G.; Loyola, R.; Zacarias, D.; Ribeiro, B.R.; Mendes-Oliveira, A.C. How future climate change and deforestation can drastically affect the species of monkeys endemic to the eastern Amazon, and priorities for conservation. Biodivers. Conserv. 2022, 31, 971–988. [Google Scholar] [CrossRef]
  9. Inpe—Instituto Nacional de Pesquisas Espaciais. Coordenação Geral de Observação da Terra. Programa de Monitoramento da Amazônia e Demais Biomas. Desmatamento—Amazonia. Available online: http://terrabrasilis.dpi.inpe.br/app/dashboard/deforestation/biomes/legal_amazon/rates (accessed on 30 July 2023).
  10. Jardim, F.C.S. Natural regeneration in tropical forests. Amaz. J. Agric. Environ. Sci. 2015, 58, 105–113. [Google Scholar]
  11. Diosinio, L.F.; Schwartz, G.; Lopes, J.C.; Oliveira, F.A. Growth, mortality, and recruitment of tree species in a Amazonian rainforest over 13 years of reduced impact logging. For. Ecol. Manag. 2018, 430, 150–156. [Google Scholar]
  12. Dionisio, L.F.S. Mid-term effects of selective logging on the growth, mortality, and recruitment of Manilkara huberi (Ducke) A. Chev. in an Amazonian rainforest. Sci. For. 2020, 48, e3154. [Google Scholar]
  13. Jump, A.S.; Ruiz-Benito, P.; Greenwood, S.; Allen, C.D.; Kitzbeger, T.; Fensham, R.; Martinez-Vilalta, J.; Lloret, F. Structural overshoot of tree growth with climate variability and the global spectrum of drought-induced forest dieback. Glob. Chang. Biol. 2017, 23, 3742–3757. [Google Scholar] [CrossRef] [PubMed]
  14. Pilotto, I.L.; Rodriguez, D.A.; Chou, S.C.; Garofolo, L.; Gomes, J.L. Impacts of the land use and land-cover changes on local Hydroclimate in Southwestern Amazon. Clim. Dynam. 2023, 61, 5597–5612. [Google Scholar] [CrossRef]
  15. Sierra, J.P.; Espinoza, J.C.; Junquas, C.; Wongchuing, S.; Polcher, J.; Morons, V.; Fitas, L.; Arias, P.A.; Schrapffers, A.; Pennel, R. Impacts of land-surface heterogeneities and Amazonian deforestation on the wet season onset in southern Amazon. Clim. Dyn. 2023, 61, 4867–4898. [Google Scholar] [CrossRef]
  16. Tomaz, J.S.; Bezerra, C.S.; De Aguiar, A.V.; Wrege, M.S.; Lopes, M.T. Prediction of the natural distribution, habitat and conservation of Stryphnodendron pulcherrimum (Willd) Hochr. In response to global climate change. Pesq. Agropec. Trop. 2022, 52, e72422. [Google Scholar]
  17. Metzger, M.J.; Rounsevell, M.D.A.; Acosta-Michlik, R.; Leemans, R.; Schroter, D. The vulnerability of ecosystem services to land use change. Agric. Ecosyst. Environ. 2006, 114, 69–85. [Google Scholar] [CrossRef]
  18. Chishugi, D.U.; Sonwa, D.J.; Kahindo, J.M.; Itunda, D.; Chishugi, J.B.; Felix, F.L.; Sahani, M. How climate change and land use/land cover change affect domestic water vulnerability in Yangambi Watersheds. Land 2021, 10, 165. [Google Scholar] [CrossRef]
  19. Bellard, C.; Bertelsmeier, C.; Leadley, P.; Thuiller, W.; Courchamp, F. Impactos of climate change on the future of biodiversity. Ecol. Lett. 2012, 15, 365–377. [Google Scholar] [CrossRef] [PubMed]
  20. Andrade, A.F.; Velazco, S.J.E.; Marco Junior, P. ENMTML: An R package for a straightforward construction of complex ecological niche models. Environ. Model. Softw. 2020, 125, 104615. [Google Scholar] [CrossRef]
  21. Elith, J.; Leathwick, J.R. Species Distribution Models: Ecological Explanation and Prediction Across Space and Tim. Annu. Rev. Ecol. Evol. Syst. 2009, 40, 677–697. [Google Scholar] [CrossRef]
  22. Ma, Y.; You, X. A sustainable conservation strategy of wildlife in urban ecosystems: Case of Gallinua chloropus in Beijing-Tianjin-Hebei region. Ecol. Inform. 2022, 68, 101571. [Google Scholar] [CrossRef]
  23. Aksoy, Ö.K. Predicting the Potential Distribution Area of the Platanus orientalis L. in Turkey Today and in the Future. Sustainability 2022, 14, 11706. [Google Scholar] [CrossRef]
  24. Muylaert, R.; Kingston, T.; Luo, J.; Vancine, M.H.; Galli, K.; Carlson, C.J.; John, R.S.; Rulli, M.C.; Hayman, D.T.S. Present and future distribution of bat hosts of sarbecoviruses: Implications for conservation and public health. Proc. R. Soc. Lond. Ser. B. Biol. Sci. 2022, 289, 20220397. [Google Scholar] [CrossRef]
  25. Maitner, B.S.; Boyle, B.; Casler, N.; Condit, R.; Donoghue, J.; Durán, S.M.; Guaderrama, D.; Hinchliff, C.E.; Jorgensen, P.M.; Kraft, N.J.B.; et al. The Bien R package: A tool to access the Botanical Information and Ecology Network (BIEN) database. Methods Ecol. Evol. 2018, 9, 373–379. [Google Scholar] [CrossRef]
  26. Fick, S.E.; Hijmans, R.J. WordClim 2: New 1-km spatial resolution climate surfaces for global land areas. Int. J. Climatol. 2017, 37, 4302–4315. [Google Scholar] [CrossRef]
  27. Firpo, M.A.F.; Guimarães, B.S.; Dantas, L.G.; Da Silva, M.G.B.; Alvez, L.M.; Chadwick, R.; Llopart, M.P.; De Oliveira, G.S. Assessment of CPIP6 models performance in simulating present day climate in Brazil. Front. Clim. 2022, 4, 1–27. [Google Scholar] [CrossRef]
  28. Monteverde, C.; De Sales, F.; Jones, C. Evaluation of the CMIP6 Performance in Simulating Precipitation in the Amazon River Basin. Climate 2022, 10, 122. [Google Scholar] [CrossRef]
  29. IPCC. Climate Change 2021: The Physical Science Basis. In Contribution of Working Group I to the Sixth Assessment Report of the Intergovernmental Panel on Climate Change; Masson-Delmotte, V.P., Zhai, A., Pirani, S.L., Connors, C., Péan, S., Berger, N., Caud, Y., Chen, L., Goldfarb, M.I., Gomis, M., et al., Eds.; Cambridge University Press: Cambridge, UK; New York, NY, USA, 2021; In press. [Google Scholar]
  30. FAO; IIASA. Harmonized World Soil Database Version 2.0. Rome and Laxenburg. 2023, 69p. Available online: https://www.fao.org/documents/card/en/c/cc3823en (accessed on 30 March 2023).
  31. Alvarez, F.; Morandi, P.S.; Marimon-Junior, B.H.; Exavier, R.; Araújo, I.; Mariano, L.H.; Muller, A.O.; Felpausch, T.R.; Marimon, B.S. Climate defined but not soil-restricted: The distribution of a Neotropical tree through space and time. Plant Soil 2022, 471, 175–191. [Google Scholar] [CrossRef]
  32. Collevatti, R.; Terribile, L.C.; Lima-Ribeiro, M.S.; Nabout, J.C.; Oliveira, G.; Rangel, T.F.; Rabelo, S.G.; Diniz-Filho, J.F. A coupled phylogeographical and species distribution modelling approach recovers the demographical history of Neotropical seasonally dry forest tree species. Mol. Ecol. 2012, 21, 5845–5863. [Google Scholar] [CrossRef]
  33. Oliveira, G.; Rangel, T.F.; Lima-Ribeiro, M.S.; Terribile, L.C.; Diniz-Filho, A.F. Evaluating, partitioning, and mapping the spatial autocorrelation component in ecological niche modeling: A new approach based on environmentally equidistant records. Ecography 2014, 37, 637–647. [Google Scholar] [CrossRef]
  34. Velazco, S.J.E.; Galvão, F.; Villalobos, F.; Marco-Junior, P. Using worldwide edaphic data to model plant species niches: Na assessment at a continental extent. PLoS ONE 2017, 12, e0186025. [Google Scholar] [CrossRef] [PubMed]
  35. Aiello-Lammens, M.; Boria, R.A.; Radosavljevic, A.; Vilela, B.; Anderson, R. SpThin: Na the R package for spatial thinning of species occurrence records for use in ecological niche models. Ecography 2015, 38, 541–545. [Google Scholar] [CrossRef]
  36. Fielding, A.H.; Bell, J.F. A review of methods for the assessment of prediction errors in conservation presence/absence model. Environ. Conserv. 1997, 24, 38–49. [Google Scholar] [CrossRef]
  37. De Marco Junior, P.; Villen, S.; Mendes, P.; Nobrega, C.; Cortes, L.; Castro, T.; Souza, R. Vulnerability of Cerrado threatened mammals: Na the integrative landscape and climate modeling approach. Biodivers. Conserv. 2020, 29, 1637–1658. [Google Scholar] [CrossRef]
  38. Lobo, J.; Jiménez-Valverde, A.; Hortal, J. The uncertain nature of absences and their importance in species distribution modelling. Ecography 2010, 33, 103–114. [Google Scholar] [CrossRef]
  39. Senay, S.D.; Worner, S.P.; Ikeda, T. Novel Three-Step Pseudo-Adsence Selection Technique for Improved Species Distribution Modelling. PLoS ONE 2013, 8, e71218. [Google Scholar] [CrossRef] [PubMed]
  40. Zaniewski, A.E.; Lehmann, A.; Overton, J.M. Predicting species spatial distributions using presence-only data: A case study of native New Zealand ferns. Ecol. Modell. 2002, 157, 261–280. [Google Scholar] [CrossRef]
  41. Allouche, O.; Tsoar, A.; Kadmon, R. Assuming the accuracy of species distribution models: Prevalence, kappa and the true skill statistic (TSS). J. Appl. Ecol. 2006, 43, 1223–1232. [Google Scholar] [CrossRef]
  42. Thuiller, W.; Guéguen, M.; Renaud, J.; Karge, D.N.; Zimmermann, N.E. Uncertainty in ensembles of global biodiversity scenarios. Nat. Commun. 2019, 10, 1446. [Google Scholar] [CrossRef]
  43. Leroy, B.; Delsol, R.; Hugueny, B.; Meynard, C.N.; Barhoumi, C.; Massin, M.B.; Bellard, C. Without quality presence-absence data, discrimination metrics such as TSS can be misleading measures of model performance. J. Biogeogr. 2018, 45, 1994–2002. [Google Scholar]
  44. Boria, R.; Olson, L.; Goodman, S.M.; Anderson, R.P. Spatial filtering to reduce sampling bias can improve the performance of ecological niche models. Ecol. Modell. 2014, 275, 73–77. [Google Scholar] [CrossRef]
  45. Sillero, N.; Barbosa, A.M. Common mistakes in ecological niche models. Int. J. Geogr. Inf. Sci. 2020, 35, 213–226. [Google Scholar] [CrossRef]
  46. Abdi, H.; Williams, L.J. Principal component analysis. Wiley Interdiscip. Rev. 2010, 2, 433–459. [Google Scholar] [CrossRef]
  47. Mcmeans, B.C.; Mccann, K.S.; Guzzo, M.M.; Vartley, T.J.; Bieg, C.; Blanchfield, P.J.; Fernandes, T.; Giacomini, H.C.; Middel, T.; Rennie, M.D.; et al. Winter in water: Differential responses and the maintenance of biodiversity. Ecol. Lett. 2020, 23, 922–938. [Google Scholar] [CrossRef] [PubMed]
  48. Bordoloi, R.; Das, B.; Yam, G.; Pandey, P.K.; Tripathi, O.P. Modeling of water holding capacity using readily available soil characteristics. Agric. Res. 2019, 8, 347–355. [Google Scholar] [CrossRef]
  49. Gomes, L.M.; Bezerra, C.S.; Aguiar, A.V.; Wrege, M.S.; Lopes, M.T.G. Prediction of the natural distribution and conservation of Urena lobata L. in Brazil. Pesq. Agropec. Trop. 2022, 52, e72594. [Google Scholar] [CrossRef]
  50. Brandão, D.O.; Barata, L.E.S.; Nobre, C.A. The effects of environmental changes on plant species and forest dependent communities in the Amazon region. Forests 2022, 13, 466. [Google Scholar] [CrossRef]
  51. Gomes, V.H.F.; Vieira, I.C.G.; Salomão, R.P. Amazonian tree species threatened by deforestation an climate change. Nat. Clim. Change 2019, 9, 547–553. [Google Scholar] [CrossRef]
  52. Naranjo, A.; Melton, A.E.; Soltis, D.E.; Soltis, P.S. Endemism, projected climate change, and identifying species of critical concern in the Scrub Mint clade (Lamiaceae). Conserv. Sci. Pract. 2022, 4, e621. [Google Scholar] [CrossRef]
  53. Yang, Y.; Saatchi, S.S.; Xu, L.; Choi, S.; Philips, N.; Kennedy, R.; Keller, M.; Knyazikhin, Y.; Myneni, R.B. Post-drought decline of the Amazon carbon sink. Nat. Commun. 2018, 9, 3172–3181. [Google Scholar] [CrossRef]
  54. Kramer, A.T.; Ison, J.L.; Ashley, M.V.; Howe, H.F. The genetic paradox of forest fragmentation. Conserv. Biol. 2008, 22, 878–885. [Google Scholar] [CrossRef] [PubMed]
  55. Van Dyck, H.; Baguette, M. Dispersal behaviour in fragmented landscape: Routine or special movements? Basic Appl. Ecol. 2005, 5, 535–545. [Google Scholar] [CrossRef]
  56. Jump, A.S.; Peñuelas, J. Running to stand still: Adaptation and the response of plants to rapid climate change. Ecol. Lett. 2005, 8, 1010–1020. [Google Scholar] [CrossRef] [PubMed]
Figure 1. Geographical distribution and kernel density estimation (KDE) of A. desmanthum, C. micranta, C. racemosa, C. oblongifolia, and V. guianensis in South America, without a spatial reduction and with spatial reduction of 5 km. South America: Brazilian biomes: Amazon, Caatinga, Cerrado, Atlantic Forest, Pampa, Pantanal; kernel density, high to low; also shown are the geographic coordinate system, cartographic base, and scale. Points in orange indicate higher Kernel density and those in green indicate lower Kernel density, from points of occurrence within a radius of 111 km.
Sustainability 16 03458 g001
Figure 2. The variance plot, the fourteen principal components (PCs) that best represent the variation in bioclimatic and edaphic data together. The gray bars represent the PCs, while the red line represents the explained variable.
Sustainability 16 03458 g002
Figure 3. Environmental suitability for the base scenario (1970–2000). State boundaries in the Brazilian Amazon; environmental suitability from low to high; also shown are the geographic coordinate system, cartographic base, and scale. AC: Acre, AM: Amazonas; RO: Rondônia; PA: Pará; MT: Mato Grosso; TO: Tocantins; MA: Maranhão; AP: Amapá; and RR: Roraima.
Sustainability 16 03458 g003
Figure 4. Environmental suitability of the species A. desmanthum, C. micranta, C. racemosa, C. oblongifolia, and V. guianensis for two distinct scenarios and the Shared Socioeconomic Pathways SSP2–4.5 and SSP5–8.5. AC: Acre, AM: Amazonas; RO: Rondônia; PA: Pará; MT: Mato Grosso; TO: Tocantins; MA: Maranhão; AP: Amapá; and RR: Roraima.
Sustainability 16 03458 g004
Figure 5. Map of accumulated deforestation considering the projected areas of occurrence of the species A. desmanthum, C. micrantha, C. racemosa, C. oblongifolia, and V. guianensis for the base period (1970–2000).
Sustainability 16 03458 g005
Table 1. Quantity of georeferenced occurrence points after the checking of the following timber wood species: A. desmanthum, C. micranta, C. racemosa, C. oblongifolia, and V. guianensis, plus the quantity of occurrence points after spatial reduction to 5 km using the SpThin package.
SpeciesNumber of Points
Without Spatial ReductionWith Spatial Reduction
A. desmanthum249203
C. micrantha12058
C. racemosa852455
C. oblongifolia11071
V. guianensis11575
Table 2. Area with environmental suitability for the occurrence of the timber forest species A. desmanthum, C. micranta, C. racemosa, C. oblongifolia, and V. guianensis according to two climate scenarios (SSP2–4.5 and SSP5–8.5) for two periods 2021–2040 and 2041–2060 in km2 and the reduction in these areas in relation to the base period in %.
SpeciesBase
Period
SSP2–4.5
2021–2040%2041–2060%
A. desmanthum4,136,1884,102,344–14,067,493–2
C. micranta2,465,9262,628,90172,448,709−1
C. racemosa4,093,8163,544,000−132,889,697−29
C. oblongifolia2,224,9062,484,873122,472,12811
V. guianensis2,999,4662,892,412−42,596,902−13
SpeciesBase
Period
SSP5–8.5
2021–2040%2041–2060%
A. desmanthum4,136,1884,087,326−12,450,481−41
C. micranta2,465,9262,599,84352,393,141−3
C. racemosa4,093,8163,454,992−161,548,902−62
C. oblongifolia2,224,9062,431,41991,803,522−19
V. guianensis2,999,4662,796,509−71,886,705−37
Table 3. Results of the metrics Area Under the Curve (AUC), True Skill Statistic (TSS), and Sorensen Index generated from the use of the consensus model using the algorithms Random Forest (RDF), Boosted Regression Trees (BRT), Support Vector Machine (SVM), Bayesian Gaussian Process (GAU), and Maximum Entropy Default (MXD), based on the analysis of the algorithms available in the package ENMTML, for the species A. desmanthum, C. micranta, C. racemosa, C. oblongifolia, and V. guianensis.
SpeciesAUCTSSSorensen
A. desmanthum0.995 ± 0.0010.961 ± 0.0160.980 ± 0.008
C. micranta0.965 ± 0.0190.847 ± 0.0530.927 ± 0.024
C. racemosa0.989 ± 0.0070.932 ± 0.0290.966 ± 0.014
C. oblongifolia0.986 ± 0.0090.916 ± 0.0550.956 ± 0.031
V. guianensis0.981 ± 0.0180.906 ± 0.0900.951 ± 0.050
Disclaimer/Publisher’s Note: The statements, opinions and data contained in all publications are solely those of the individual author(s) and contributor(s) and not of MDPI and/or the editor(s). MDPI and/or the editor(s) disclaim responsibility for any injury to people or property resulting from any ideas, methods, instructions or products referred to in the content.

