Article

Enhancing Sustainable Construction: Optimization Tool for Glulam Roof Structures According to Eurocode 5

by
María Simón-Portela
1,
José Ramón Villar-García
2,
Pablo Vidal-López
1,* and
Desirée Rodríguez-Robles
1
1
Mechanical and Fluid Engineering Research Group, Department of Forest and Agricultural Engineering, School of Agricultural Engineering, University of Extremadura, Av. Adolfo Suarez s/n, 06071 Badajoz, Spain
2
Forest Research Group, Department of Forest and Agricultural Engineering, Universitary Center of Plasencia, University of Extremadura, Av. Virgen del Puerto 2, 10600 Plasencia, Spain
*
Author to whom correspondence should be addressed.
Sustainability 2024, 16(9), 3514; https://doi.org/10.3390/su16093514
Submission received: 8 March 2024 / Revised: 18 April 2024 / Accepted: 19 April 2024 / Published: 23 April 2024

Abstract

:
The construction industry has a notably negative impact on the environment; thus, the promotion of the use of timber structures is an alternative to mitigate its effects. This research develops an artificial intelligence-based decision approach in the calculation of timber structures focused on the enhancement of the sustainability of roof structures. Based on the optimization carried out through genetic algorithms and the framework established in Eurocode 5, a general set of equations has been proposed for a laminated timber roof structure. The tool, which determines the most suitable roof structure for each strength class of laminated timber, allows for the determination of the dimensions of beams and purlins and their respective separations in order to minimize wood consumption. The ultimate goal is to offer multiple solutions regarding strength classes and structural designs in order to foster sustainability-informed choices that promote efficient use of resources in construction.

1. Introduction

Its economic and social relevance notwithstanding, the construction sector in the European Union (EU) consumes a great amount of resources, with figures up to 50% of all extracted materials [1], and produces vast quantities of waste, accounting for 37.5% of the total [2]. Moreover, the built environment is responsible for 40% of the total energy consumption and 36% of all CO2 emissions in the EU [3].
Among some of the most commonly employed construction materials are concrete and steel. Understanding the properties and constraints of materials is essential to both the design and future construction and use; however, evaluating the environmental impact has become equally critical as climate change and sustainability concerns increase. Thus, the use of life cycle assessment (LCA) databases allows for the assessment and comparison of construction materials’ environmental performance through the use of indicators such as embodied energy or CO2 emissions. For instance, the Ecoinvent database [4] indicates that steel has an embodied energy of 27.90 MJ/kg and emissions of 1.71 kg CO2/kg. Similarly, values of 0.618 MJ/kg and 0.112 kg CO2/kg are reported for concrete [4].
Nowadays, similarly to other economic sectors, construction is veering towards practices within material selection, construction methods, operational efficiency, and end-of-life strategies that regard social and environmental well-being to further sustainability. In this regard, the European Green Deal [5] promotes the use of timber as a means to reduce the environmental pressure of the construction industry.
Although the use of timber is not new, approaches to alleviate some of the inherent limitations of wood (i.e., dimensions, strength, instability, fire resistance, susceptibility to biodegradation, etc.) through the development of wood-engineered products [6,7] and various technological advances (e.g., chemical, thermal, or mechanical treatments) [6,8,9] are propelling its current popularity. Moreover, another factor driving the increase in use is the comparatively better environmental profile with respect to other construction materials [10]. As a renewable resource, timber can be continually sourced from sustainably managed forests, which contributes to the maintenance and expansion of forested areas, thereby mitigating deforestation and promoting ecological quality [11]. Since it originates from a photosynthetic organism, uptake of carbon occurs during its growth due to biomass conversion, with approximately 1.5 t CO2/m3 of wood [12]. Thus, sequestration or carbon storage could be considered in the manufacture of timber, provided that the harvested tree is used in long-life products such as construction materials. Moreover, the use of timber in substitution of other more environmentally damaging materials constitutes an additional benefit in CO2 mitigation, since the manufacturing emissions of the replaced construction material are avoided. After sawing, lumber is naturally or force-dried to achieve dimensional stability and planed according to use or processing into other wood-engineered products. Undoubtedly, these operations pose a negative impact on the environment. Although precise figures vary for the different wood products, both carbon emissions and embodied energy are significantly lower in timber construction [10,13,14,15,16].
Among the wood-engineered materials, this research focuses on glued laminated timber (also known as glulam). This construction material is composed of layers of sawn lumber bonded together, with the grain running parallel to the length of the structural element. This manufacturing allows for large spans and variable cross sections, as well as high strength-to-weight ratios. Nevertheless, the different strength classes (e.g., from GL 20h to GL 32h for homogeneous glulam [17]) exhibit specific mechanical performances relating to the wood species. For instance, lower strength classes could be associated with softwoods (Thuja plicata, Picea sitchensis, Abies magnifica, Abies grandis, Abies concolor, Abies procera, Abies amabilis, etc.), whereas greater strength classes are connected to Pinus sylvestris, Larix decidua, Pseudotsuga menziesii, etc. [18].
In this regard, the scientific community has predominantly centered its attention on the study of a single strength class, and the interest has not been uniformly distributed among them. Conversely, it is worth mentioning the research by Baranski et al. [19], who addressed the optimization of different beam geometries as well as different qualities of glulam (i.e., GL 22h, GL 24h, GL 26h, GL 28h, GL 30h, and GL 32h).
From the literature analysis, GL 24h stands out as the most evaluated class, with a greater incidence of studies on bending elements such as beams. In the context of structure optimization, two investigations can be highlighted. Firstly, Jelušič and Kravanka [20] assessed the optimization design of timber floor joists for a given imposed load and span of the structure. Then, De Vito et al. [21], who developed a topology optimization of Douglas fir GL 24h beams, considered the orthotropic nature of wood and the layering manufacture. Kilincarslan and Turker [22] considered the strengthening of the GL 24h spruce timber column–beam connection with carbon fiber-reinforced polymer through experimental evaluation. Wang et al. [23] evaluated the stiffness of GL 24h timber from Scotch pine beam–column joints with bolted connections and introduced a stiffness prediction method. Moreover, in the current state of transition to more sustainable materials, there are also some examples of the hybrid use of GL 24h with inert materials. Fu et al. [24] studied the optimization of the bonding performance between prefabricated concrete and GL 24h timber from spruce. Similarly, Giv et al. [25] studied the effect of adhesive type on the bending behavior of the GL 24h timber–concrete composite panel. Ferrara et al. [26] conducted real-scale experiments on the mechanical performance of a GL 24h timber–concrete composite floor supported at two edges. Gomez-Ceballos et al. [27] presented a numerical method for the analysis of the mechanical behavior of GL 24h Douglas beams reinforced with ultrahigh-performance fiber-reinforced concrete. For the timber–steel conjunction, Ching et al. [28] developed a topology optimization framework for trusses made of GL 24h timber and steel aimed at reduce global warming potential.
Several authors have also assessed the GL 28h class, mostly in the context of reinforced elements such as tendons or steel bars. For instance, De Luca and Marano [29] tested the failure of prestressed GL 28h spruce timber reinforced with steel bars. Also for European spruce, McConnell et al. [30] tested GL 28h timber with steel tendons in post-tensioning conditions. In regard to optimization, Mam et al. [31] focused on GL 28h bracing structures. For a timber–timber composite with glulam ribs and cross-laminated timber flanges, Suárez-Riestra et al. [32,33] tested the GL 28h from Picea abies and proposed an estimation model for the long-term behavior of the composite.
Amid the less studied strength classes, an investigation carried out by Jelušič [34], who proposed an optimization approach to variable cross-section beams of GL 30h timber should be mentioned, as well as the research performed on GL 32h timber by Šilih et al. [35] for timber trusses and Simón-Portela [36] for an entire timber roof structure.
Despite the current clear focus on specific strength classes, the complete consideration of the strength class range within the material selection could benefit the optimization of the timber volume required for a specific structure, which is one of the objectives of this research. In this regard, there is extensive literature on reducing material consumption in the design of steel and concrete structures; some examples can be found in [37,38,39]. Albeit more limited, optimization approaches have also been made for timber construction, such as beams [19,34,36] and trusses [20,35,40,41].
Additionally, the consideration of the use of the strength classes could also result in advantages from a sustainability standpoint, since a greater variety of wood species would be considered for construction purposes. It should be noted that besides their performance and classification within a strength class, the selection of available tree species would also be motivated by their intrinsic characteristics (e.g., climatic adaptation, growing rate [34], etc.) as well as the final acquisition cost of the material. In this regard, research shows that tree species richness can enhance wood productivity while maximizing ecosystem functioning [42,43,44]. Notwithstanding, to adequately supply the increasing demand for wood as a construction material, the source material must originate from responsibly managed forests.
Therefore, the present investigation assesses the influence of glulam strength classes in timber construction, specifically, on the design of a timber roof structure consisting of timber double-tapered beams and purlins according to Eurocode 5 [45] requirements. To that end, an optimization tool based on genetic algorithms has been developed, and based on the results, several equations have been proposed to determine the optimal geometry (width and height) of the structural elements (beams and purlins) as well as their spatial configuration given the roof length, span, snow load, and strength class. Similarly, a general equation has been derived to predict the optimum volume required for the roof structure considering the different strength classes, which would promote efficient use of resources and economic advantages while complying with structural and safety requirements.

2. Materials and Methods

This section presents the materials and methods employed throughout the research. Firstly, to establish a comprehensive framework of construction solutions relevant to the European context, the range of study for the different design parameters (material properties, geometric dimensions, and load scenarios) is considered. Subsequently, the specifics regarding the development of the optimization tool are detailed. On the one hand, the Eurocode 5 [45] equations utilized to evaluate the potential of each proposed design solution are mentioned. On the other hand, the concrete parameters within the genetic algorithm, as well as the objective function and the associated penalization criteria implemented, are defined. Finally, the statistical analysis conducted on the optimal solutions to derive the optimization equations intended to serve as a decision tool is described.

2.1. Design Parameters: Material, Dimensions and Loads

A roof structure comprised of timber double-tapered beams and purlins has been examined in this research. For the assessment, six homogeneous glued laminated (glulam) timber strength classes, as defined in EN 14080 [17], have been considered: GL 20h, GL 22h, GL 24h, GL 26h, GL 28h, GL 30h and GL 32h (Table 1). This broad selection of strength classes would allow for consideration beyond the traditionally used wood species and thus the promotion of previously unexploited or underutilized species in timber construction.
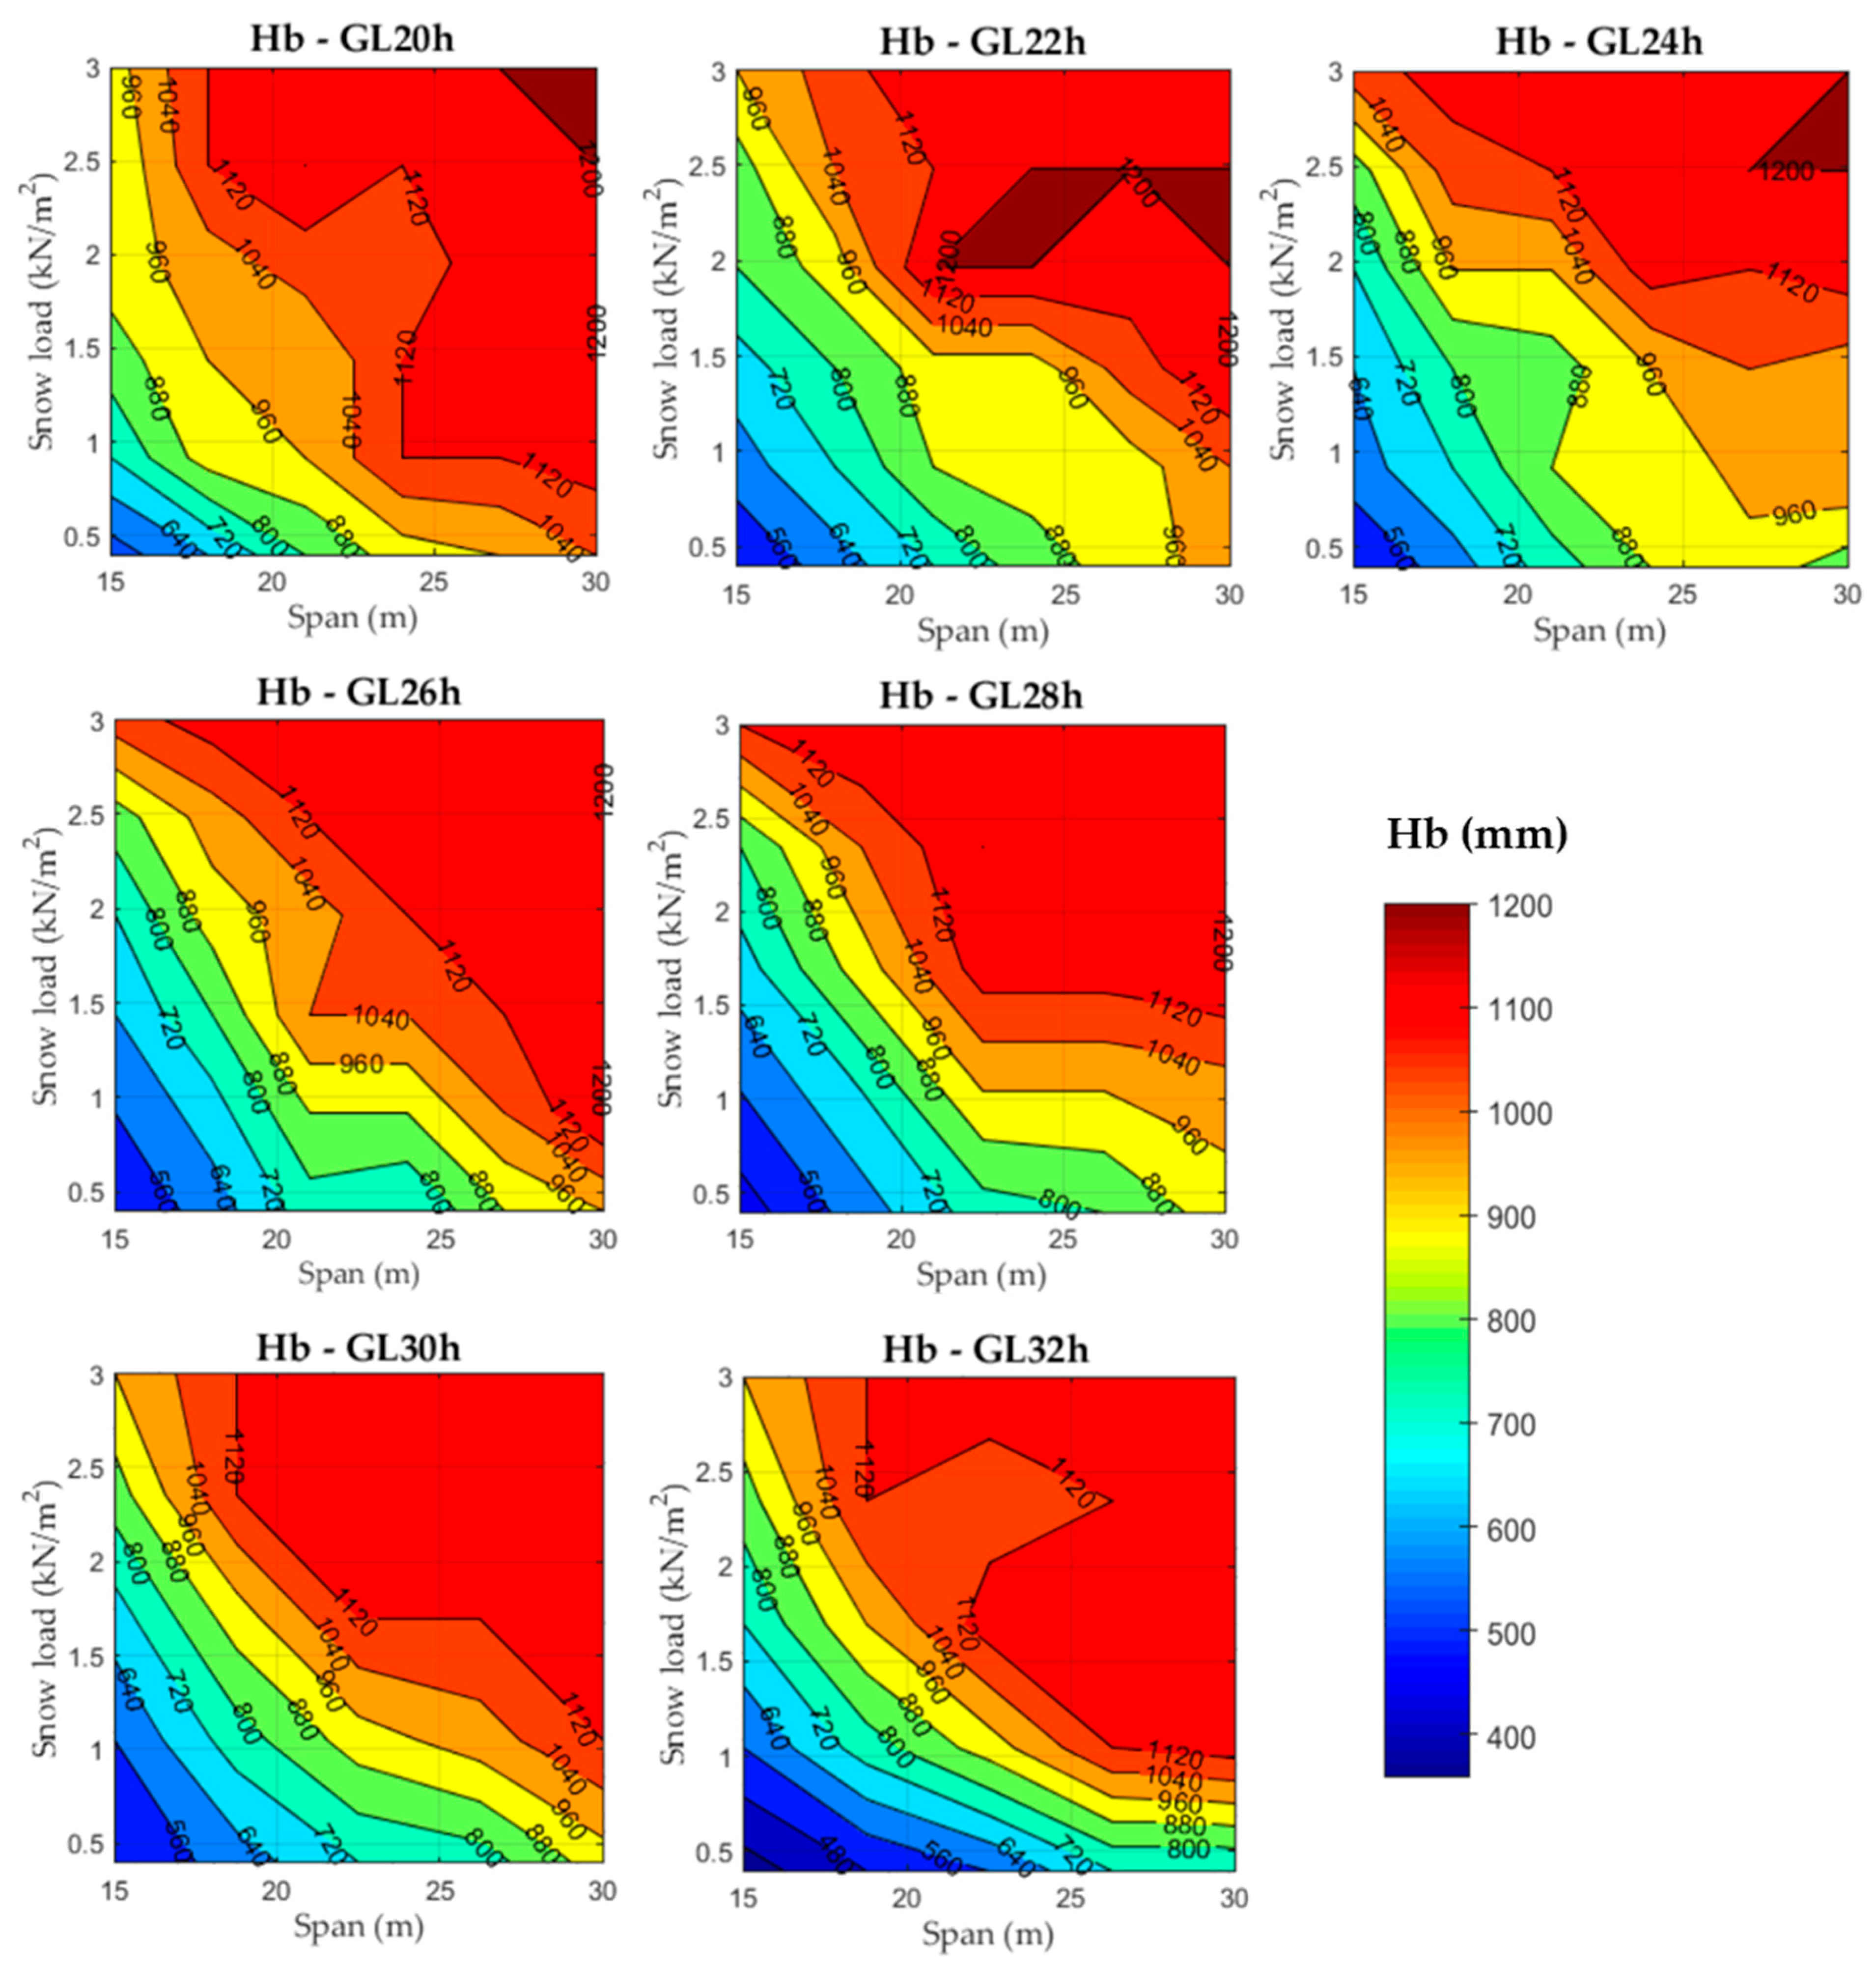
The optimization was carried out for different timber roof dimensions. The roof length was studied at 30 m, 45 m, 60 m and 75 m; the assessed span varied from 15 m to 30 m in 1.25 m increments; and inclination angles between 5° and 10° were examined for the tapered beam. The geometry of the structural elements was also considered a variable within the experimental program. The heights of beams (Hb) and purlins (Hp) ranged from 120 to 1200 mm, with 40 mm intervals reflecting the laminate thickness. Similarly, the widths for beams (Wb) and purlins (Wp) spanned from 90 to 220 mm, adjusted in 10 mm increments. Finally, regarding the arrangement of the structural elements within the roof structure, the spacing between beams and purlins was also studied as a variable. Beam spacing (Sb) was considered within a range of 3 m to 7 m, while purlin spacing (Sp) varied from 0.625 to 1.25 m, which was the maximum allowed separation.
Similarly, specific limits were established regarding the range of potential load conditions that the roof structure is designed to withstand. All contemplated loads were combined as established in Eurocode 1 [45] to assess the worst-case scenario in the structural integrity verification. As the roof elements fall within service class 1, a 1.25 safety factor was considered for the glulam material combined with a modification factor (kmod) of 0.9. For permanent surface loads, in addition to the self-weight of the beams and purlins that was automatically calculated during the optimization process, a dead load of 0.45 kN/m2 was also included. For variable loads, snow loads ranging from 0.4 to 3 kN/m2 were considered to accommodate typical values in different locations across the European Union [46]. It should be noted that in accordance with the Spanish Technical Building Code (also known as CTE) [47], the combination of snow and wind loads with the maintenance load is avoided due to the assumption that during extreme conditions, no one would be present on the roof, thus resulting in an overestimation of the total load on the structure. Conversely, snow load values below 0.4 kN/m2 were excluded to ensure that in scenarios with negligible snow loads, the maintenance load is applied. Regarding the wind load, it was considered for a gable roof without openings in a building with a height of 5 to 7 m [48], and since it has been proven not to affect the optimization results [36], a fixed value of 0.07 kN/m2 was employed.

2.2. Optimization

The optimization goal is to identify the most effective design for a roof structure, taking into account six different glulam strength classes that reduce timber material consumption and comply with the requirements of strength, stability, and stiffness set out in Eurocode 5 [45]. As such, initially, this method aims to balance structural performance (i.e., function and safety) with material conservation. However, it is worth mentioning that the interpretation of the outcomes across the different strength classes should also be regarded as a sustainability equalization, e.g., the selection of an optimal result from a different strength class that could be represented by less exploited wood materials, which alleviates the demand for certain species while promoting biodiversity.
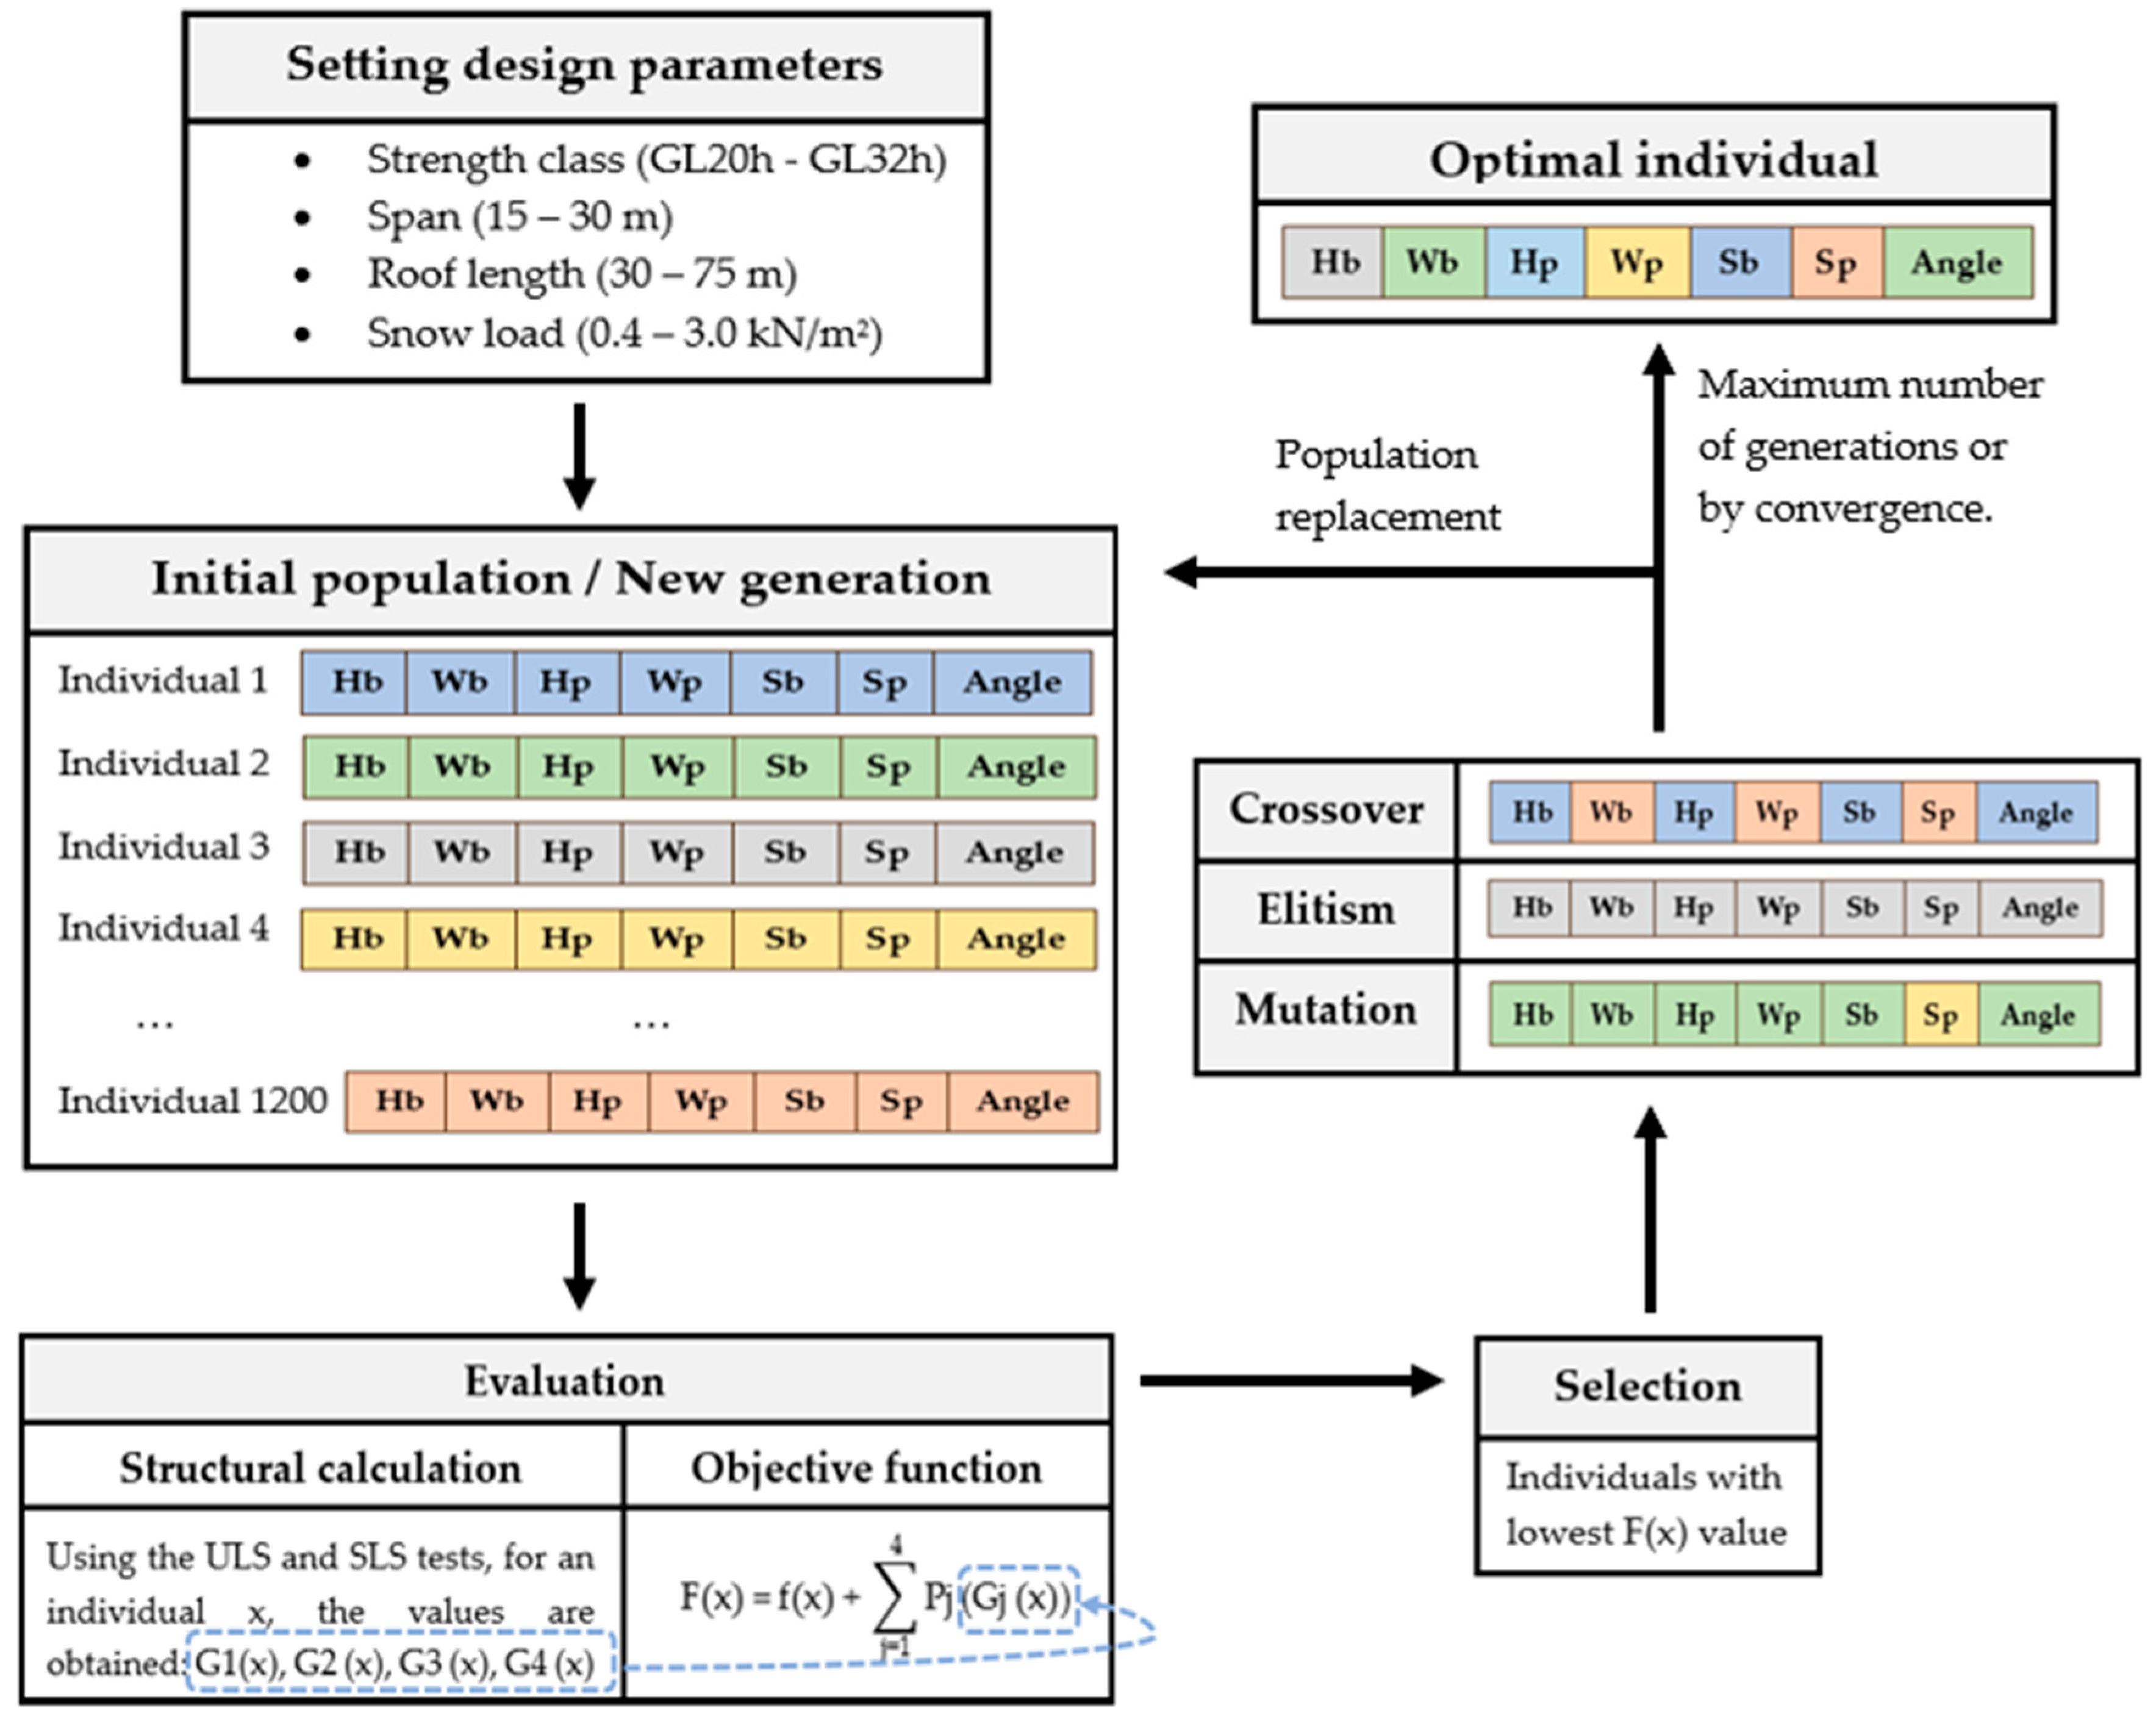
Genetic algorithms grounded in biological evolution principles were employed to execute the optimization process (Figure 1).
To represent different potential designs for the roof structure, an initial population of 1200 random individuals was generated. The selected population size is a compromise between the computational cost and the probability of identifying the optimal solution. The possible dimensions (i.e., Hb, Hp, Wb, Wp, and angle) and arrangements (i.e., Sb, Sp) of beams and purlins were considered through specific values in their chromosomes. Each individual within the population corresponds to a potential structural solution, encoded in a chromosome comprising seven genes: Hb, Hp, Wb, Wp, Sb, Sp, and angle. Then, the evaluation of each design solution depended on the utilization ratios determined within the structural calculation program developed in Matlab to verify the Eurocode 5 [45] criteria, which was previously collected in [36], as follows.
  • Ultimate limit state (ULS) tests:
    • Beam verification for shear strength (Iv ≤ 1).
    • Beam verification for bending strength (Im ≤ 1).
    • Beam verification in the apex zone (It,90 ≤ 1).
    • Purlin verification for combined bending and shear strength.
  • Serviceability limit state (SLS) tests:
    • A limit value of l/400 for the instantaneous deflection (winst).
    • A limit value of l/300 for the final deflection (wfin).
    • A limit value of l/225 for the net final deflection (wnetfin).
Then, the modified objective function (F(x) in Equation (1)) measures the fitness of individuals in terms of volume, in m3, and applies a penalty to those that do not meet the structural safety criteria and according to the aforementioned utilization rates:
F x = f x + j = 1 4 P j ( G j x )
where x denotes an individual within the study population, f(x) is the objective function in terms of volume (m3), j is the number of variables under examination, Pj is the penalization term conforming to the restrictions imposed on each structural element, and Gj is the penalty parameter, with the same order of magnitude as the objective function, based on the maximum utilization ratio observed in each structural component, with j assuming values from 1 to 4, as follows.
  • G1(x) is the highest ultimate limit state utilization ratio of the beam:
    0 > G1(x) > 1 then, P1(G1(x)) = 3 × 10(1−G1(x)).
    G1(x) = 1 then P1(G1(x)) = 0.
    G1(x) = 0 then P1(G1(x)) = 40.
    G1(x) > 1 then P1(G1(x)) = G1(x) × 400.
  • G2(x) is the highest serviceability limit state utilization ratio of the beam:
    0 > G2(x) < 1 then P2(G2(x)) = 1.8 × 10(1−G2(x)).
    G2(x) = 1 then P2(G2(x)) = 0.
    G2(x) = 0 then P2(G2(x)) = 24.
    G2(x) > 1 then P2(G2(x)) = 60 × G2(x).
  • G3(x) is the highest ultimate limit state utilization ratio of the purlin:
    0 > G3(x) > 1 then P3(G3(x)) = 1.725 × 10(1−G3(x)).
    G3(x) = 1 then P3(G3(x)) = 0.
    G3(x) = 0 then P3(G3(x)) = 23.
    G3(x) > 1 then P3(G3(x)) = G3(x) × 11.5.
  • G4(x) is the highest serviceability limit state utilization ratio of the purlin:
    0 > G4(x) > 1 then P4(G4(x)) = 172.5 × 10(1−G4(x)).
    G4(x) = 1 then P4(G4(x)) = 0.
    G4(x) = 0 then P4(G4(x)) = 23.
    G4(x) > 1 then P4(G4(x)) = G4(x) × 11.5.
Then, the individuals with the lowest values are roulette-selected to be subjected to two-point crossover (i.e., the combination of their characteristics), elitism (i.e., the retention of the fittest individuals) and mutation (i.e., the introduction of variability) operations in order to generate new individuals that replace the initial population. Values of 80%, 10% and 1% were employed for these operators, respectively. The cycle is repeated until convergence is reached, or up to a maximum set value of 50 generations. Nonetheless, convergence was always reached after 15 to 20 generations. For instance, Figure 2 showcases the characteristic evolution of the modified objective function across successive generations.

2.3. Statistical Analysis

A total of 1792 optimal individuals were generated based on combinations of specified values for span, depth, snow load, and strength class. A comprehensive statistical analysis was performed on the attributes of these configurations to assess for each glulam strength class, the optimal geometry (width and height) of the structural elements (beams and purlins) comprising the roof structure, and their spatial configuration. Additionally, the relationships among the different considered variables (i.e., snow load, span, depth, beam height and width, purlin height and width, beam spacing, and purlin spacing) as a function of the glulam strength class were examined through multiple linear regression analysis. The analysis also focused on the comparison of the optimum timber volume across different strength classes, offering a basis for making informed decisions based on both the material consumption (i.e., type and amount) and the cost-effectiveness. Therefore, several equations have been formulated to enable reliable predictions regarding the optimal volume and geometry parameters for a given span and roof length, snow load, and timber strength class. The validity of each predictive equation was assessed through the normality and homoscedasticity of the residuals as well as the correlation value.

3. Results and Discussion

The optimization outcomes for the timber roof structures studied are presented as predictive equations according to the design parameters and glulam strength classes. Initially, the analysis focuses on the optimal geometrical values of beams (i.e., inclination angle, width and height) and purlins (i.e., width and height), as well as their respective spatial arrangements in the roof structure. Subsequently, the exploration encompasses the optimization of the overall timber volume across the different strength classes. Moreover, examples for the application of the proposed predictive equations are included for each of the approaches mentioned.

3.1. Optimal Geometry of Structural Elements and Their Spatial Configuration

3.1.1. Inclination Angle of the Double-Tapered Beam

Consistently, the optimal inclination angle was 5°, the minimum for the studied range, regardless of span, snow load, and strength class. Nonetheless, it was initially hypothesized that the optimal angle might exceed the 5° considered minimum. It was assumed that an increased angle and the resulting increase in the central cross-section of the tapered beam could reduce the dimensions of the initial cross-section of the beam or allow for wider beam spacing, leading to a decrease in overall timber volume. However, a direct comparison with the findings reported by Simón-Portela [36] at a 10° inclination reveals that the reduction achieved due to the increased spacing between beams (i.e., halving the number of beams) does not compensate for the added volume due to the steeper angle. In fact, for identical loading conditions and roof dimensions, the volume at a 10° inclination is 30% greater than that at a 5° inclination. Minimal angle inclinations (<5°) were also reported in the optimizations carried out by Baranski et al. [19] and Jelušič [34].

3.1.2. Width, Height and Spacing of Beams

A multiple linear regression analysis was carried out to study the influence of the span and snow load variables on the dimensions of beams across various strength classes and snow load intervals. It should be noted that the data did not exhibit heteroscedasticity, and there were no significant deviations from the normal distribution (Levene’s test: p > 0.05; Shapiro–Wilk test: p > 0.05). The findings revealed that:
  • The span, both as a standalone factor and in combination with the snow load, significantly influences (p-value < 0.001) the width of the beam.
  • Both the span and snow load, whether considered separately or together, have a significant effect (p-value < 0.001) on the height of the beam.
As the correlation coefficients observed were greater than 0.95, reliable prediction equations of the width and height of beams could be achieved for a given span and snow load values. In this regard, Equations (2) and (3) were proposed based on the correlation coefficients from the multiple linear regression.
The optimal beam width (Wb), in meters, could be determined using Equation (2):
Wb = 90 + 10   ×   ( A + B   ×   Span   +   C   ×   Snow   load   ×   Span )
where span is expressed in meters and the snow load is expressed in kN/m2. Coefficients A, B, and C are detailed in Table 2 categorized according to the strength class and snow load.
It is worth noting that the outcomes from Equation (2) must be rounded to the nearest tenth to further be employed in the height beam determination (Equation (3)). Thus, the resulting width of the beams has to be rounded to the closest value in 10 mm increments, with a minimum value set at 90 mm.
For the different strength classes, Figure 3 illustrates the optimal values of the beam width as a colored area within the snow load and span plot. It can be inferred that the optimal model frequently employs the minimum value as the optimal beam width across many span–snow load scenarios, which becomes more prevalent as the strength class increases. In terms of maximum width, it is typically set at values 66.66% greater than the minimum width. Additionally, the graphical representation highlights a marked disparity in the coverage area between widths of 130 mm to 170 mm, which is substantially smaller than the area spanned by widths from 90 mm to 130 mm. A noteworthy observation is the similarity across the graphical representations for the GL 28h to GL 32h strength classes, indicating consistent behavior in beam width selection within this range.
Although a direct comparison to other optimization research [19,34] is not possible due to different optimization thresholds as well as material and load conditions, some commentary can be made regarding the observed patterns within the optimization results. For instance, Jelušič [34] reported that the maximum beam height-to-width ratio always ranged between 7 and 8. Conversely, for comparable strength (GL 30h) and separation, the optimization proposed in this research resulted in ratios ranging from 13.4 to 24.3, which justifies the lower beam widths arising from this investigation. Contrarily, Baranski et al. [19] limited the optimization to a maximum beam height-to-width ratio of 10, whereas in the present research, such a ratio is not restricted in order to study the complete 90–200 mm range with the sole limitations imposed by the structural standards. It is also worth mentioning that Baranski et al. [19] found the same width dimensions of beams to be valid for the complete strength range.
The optimal beam height (Hb), in meters, can be determined using Equation (3):
Hb = ( A + B   ×   Span   + C   ×   Snow   load + D   ×   Snow   load   ×   Span ) 1 E   ×   100 Wb
where span and beam width (Wb) are expressed in meters and the snow load is expressed in kN/m2. Coefficients A, B, C, D, and E are detailed in Table 3, categorized according to the strength class and snow load.
In this case, the height of the beam must be rounded to the nearest multiple of 40, reflecting the laminate thickness, up to a maximum value of 1200 mm.
Figure 4 shows the optimal beam height for the different span–snow load scenarios across the different timber structural strength classes. The analysis revealed greater variability in beam height compared to width, since the genetic algorithm predominantly optimizes the structure by adjusting the height due to the influence of this variable on the moment of inertia of the cross section. This behavior is particularly noticeable for the lower-strength classes that ultimately reach an optimum at the maximum available height value for some scenarios. Similarly to the optimal width, the distribution of the beam optimal height across the GL 28h to GL 32h strength classes shows comparable patterns.
No proportional relationship was observed between the strength class and the beam height-to-span ratio, since the model adjusts the height of the beam based on all geometric variables. For GL 30h, this lack of proportionality could also be observed in Jelušič [34]. In the investigation carried out by Baranski et al. [19], who studied a roof structure for a load of 0.9 kN/m2, a threshold of span/20 to span/40 was employed in the optimization. The aforementioned range is close to that resulting from this investigation, with values of beam height oscillating between span/20 and span/32. To assess the influence of the span, roof length and snow load on the optimal number of beams, a multiple linear regression analysis was conducted. No evidence of heteroscedasticity or significant deviations from a normal distribution of data was observed (Levene’s test: p > 0.05; Shapiro–Wilk test: p > 0.05). The span was found to be not significant, whereas the roof length, both independently and in combination with the snow load, significantly influences (p-value < 0.001) the number of beams. Equation (4) was derived from the correlation coefficients of the multiple regression model (R2 > 0.95).
The optimal values for the number of beams (Nb) and their spacing (Sb), in meters, can be determined using Equations (4) and (5), respectively:
Nb = A + B   ×   Roof   length + C   ×   Roof   length   ×   Sn ow   load 1 D
Sb = Roof   length ( Nb - 1 )
where roof length is expressed in meters and the snow load is expressed in kN/m2. Coefficients A, B, C, and D are detailed in Table 4, categorized according to the strength class and snow load. It should be noted that the optimal number of beams must be rounded to the next integer.
In other optimization research [19,34], the separation between beams is not subjected to optimization, but has a fixed value of 4 m. Nonetheless, the results arising from this optimization point to 4 to 6 m separation for the lower snow load values and between 3 and 3.5 m for greater snow load values, both regardless of the considered strength class.

3.1.3. Width, Height and Spacing of Purlins

It was found that the width of the purlin remains unaffected by the span and snow load, as in [36], or by the strength classes. Therefore, it could be consistently set at the optimal minimum of 90 mm. In contrast, the snow load and strength class impact the optimal height value of the purlins. Thus, for the GL 32h class, the ideal height falls between 120 and 160 mm. For the remaining classes, the optimal height lies between 160 and 200 mm, as indicated in Table 5. As for the spacing between purlins, the optimal distance is consistently the maximum allowable, set at 1.25 m.
Example 1. 
Case study of a roof structure located in an area subjected to a snow load of 1 kN/m2 with a span of 20 m and a depth of 50 m consisting of tapered beams and purlins of glued laminated timber pertaining to GL 24h strength class.
From Equation (2):
Wb = 90 + 10   ×   ( - 3.20080 + 0.14541   ×   20 + 0.02972   ×   1   ×   20 )   = 93.018     90   mm
From Equation (3):
Hb = ( - 82.268 + 30.655   ×   20 + 0   ×   1 + 9.972   ×   20   ×   1 ) 1 1   ×   100 90 = 811.41     840   mm
From Equation (4):
Nb = 2.183385 + 0.050095   ×   50 + 0.003365   ×   50   ×   1 1 0.6 = 13.93     14   beams
From Equation (5):
Sb = 50 ( 14   -   1 ) = 3.85   m
Hence, through the application of the proposed equations (Equations (1)–(3)), the optimal solution involves the use of 14 beams with a 5° inclination angle and cross-sectional dimensions of 90 × 840 mm spaced at intervals of 3.85 m. The optimal dimensions for purlins are 90 mm width and 160 mm height at a separation of 1.25 m.

3.2. Optimum Timber Volume as a Function of Glulam Strength Class

Determining the optimal volume required for the construction of a timber roof structure offers relevant information regarding material usage and cost estimations. Nonetheless, it could also be used as a comparison parameter between timber materials pertaining to different strength classes, since it facilitates an assessment of which strength class provides the best value in terms of material volume or cost while complying with the structural and safety requirements.
A multiple linear regression analysis was performed to explore the influence of the span, roof length and snow load on the timber volume required for the roof structure, taking into account different strength classes and ranges of span and snow load. The data exhibited no heteroscedasticity or significant deviations from a normal distribution, as confirmed by Levene’s test (p > 0.05) and Shapiro–Wilk test (p > 0.05). It was noticed that the span in combination with roof length, the snow load in combination with roof length, as well as the interaction between all three variables significantly influenced the timber volume (p < 0.001). Correlation values greater than 0.95 support the reliability of Equation (6), which was derived from the correlation coefficients arising from the multiple linear regression model.
Thus, for a roof structure consisting of double-tapered beams and purlins, the optimal timber volume (V), in m3, can be determined using Equation (6):
V = A   +   Roof   length   ×   ( B + C   ×   Snow   load + D   ×   Span + E   ×   Snow   load   ×   Span )
where roof length and span are expressed in meters and the snow load is expressed in kN/m2. Coefficients A, B, C, D, and E are detailed in Table 6. categorized according to the strength class, snow load and span.
Figure 5 illustrates the linear correlation between the timber volumes predicted by the proposed equations and those arising from the genetic optimization. The regression line (R2 = 0.9977) virtually overlaps the one-to-one ratio relationship indicated by the dashed line. This finding highlights a near-perfect equivalence between the predicted and optimized volumes that points to an exceptionally low prediction error.
To provide a comprehensive analysis of the differences in timber volume across the examined strength classes, Figure 6 showcases the percentage of variation between each strength class relative to the GL 32h reference class. This comparison is calculated based on the impact of the snow load and the span on the roof structure. The overview intentionally omits the factor of roof depth, as it has been determined to have negligible impact on the percentage difference between any given class and the benchmark GL 32h class.
Therefore, from a close examination of Figure 5 and in direct comparison with the reference class GL 32h, the following insights emerge.
  • The selection of the GL 20h strength class roughly requires 17–20% additional volume for snow loads ranging from 0.4 to 1.0 kN/m2. For higher snow loads of 1 to 2 kN/m2 and 2 to 3 kN/m2, the increase in timber volume needed is about 12–15% and 10–12%, respectively.
  • For the GL 22h class, an increase in timber volume of approximately 11–13% is needed for snow loads ranging from 0.4 to 0.7 kN/m2. The requirement decreases to 8–11% for loads between 0.7 and 1.8 kN/m2, 6–8% for 1.8 and 3 kN/m2 with spans of 15 to 18 m, and 3–6% for the same snow load with spans of 18 to 30 m.
  • The GL 24h class demands an additional 6–8% timber volume for snow loads from 0.4 to 0.8 kN/m2, 4–6% for 0.8 to 1.8 kN/m2 with spans of 15 m to 20 m, 5–7% for 0.8 to 1.6 kN/m2 with spans of 20 to 30 m, 3–5% for 1.8 to 3.0 kN/m2 with spans of 15 to 18 m, and a minimal increase up to 3% for 1.4 to 3.0 kN/m2 with spans of 18 to 30 m.
  • The GL 26h class roughly requires 6–8% additional timber volume for snow loads between 0.4 and 0.8 kN/m2, 4–6% for 0.8 and 1.2 kN/m2, 2–4% for 1.2 and 2.0 kN/m2, and a slight increase to 2% for snow loads of 2.0 and 3.0 kN/m2.
  • For the GL 28h class, a 5–7% timber volume increase is necessary for snow loads of 0.4 to 0.8 kN/m² across spans of 15 to 27 m. A lower volume increase of 3–5% occurs for three scenarios: snow loads of 0.8 to 2 kN/m2 and spans of 15 to 25 m, 0.4 to 1.3 kN/m2 and spans of 27 to 30 m as well as snow loads between 2.6 and 3.0 kN/m2. Moreover, a −1% timber volume variation for snow loads of 2.0 to 2.6 kN/m2 and spans of 15 to 25 m, as well as for snow loads between 1.3 and 2.0 kN/m2 with spans of 25–30 m should be noted. The difference reaches a -2% value for snow loads of 1.3 to 2.6 kN/m2 and spans of 25 to 30 m.
  • The selection of the GL 30h class requires a 4–6% increase in volume for snow loads of 0.4 to 0.6 kN/m2 and spans of 15 to 20 m, with a marginal 0–2% increase for similar snow loads across spans of 20 to 30 m as well as for snow loads of 1.0 to 2.0 kN/m2 for spans of 15 to 20 m. For the remaining loads and spans, a decrease of up to 2% in timber volume could be achieved.
In order to analyze the aforementioned cost approach, a Spanish construction cost database [49] was employed to assess the cost of glulam timber pertaining to different strength classes. For instance, the price for 1 m3 of GL 24h timber was 1080 EUR, whereas 1 m3 of GL 32h timber reached 1140 EUR. Since GL 24h resulted in a 5.26% lower cost, it could be inferred that for snow loads in the range of 2 to 3 kN/m2, using the GL 24h material would be desired, while for snow loads ranging from 0.4 to 2 kN/m2, the preferred decision lies in the GL 32h class. In this regard, there are numerous cases where, for snow loads greater than 2 kN/m2, cost considerations would be the sole driver in the decision due to the same timber usage for both GL 30h and GL 32h classes. Although in a smaller capacity, there are also instances following this pattern for GL 26h and GL 28h classes. Moreover, this approach should go beyond strength class and contemplate the difference in cost of different species with the suitable strength properties required for the studied strength class. Through the consideration of wood species, both within the same or a different strength class, the role of the different tree species in the ecosystem is regarded. Then, the sustainability of such derived decisions includes both material reduction and the promotion of less commonly used materials, which further biodiversity and future resilience against climate change.
Example 2. 
Two worked examples initially proposed by Argüelles Álvarez and Arriaga Martitegui [50] are compared with the corresponding optimal timber volume derived from Equation (6). Specifically, their Example 8.1 consisting of GL 28h double-tapered beams and a modification of Example 6.1 focusing on purlins were employed. It should be noted that their Example 6.1 was modified to account for the same material and load conditions as in Example 8.1. The final result for a roof structure of 20 × 45 m exposed to a snow load of 0.47 kN/m2 resulted in a GL 28h timber consumption of 39.75 m3.
Table 7 shows the calculated optimal timber volumes (Equation (6)) required for the aforementioned roof structure, while also including the volume incurred for the remaining strength classes. Moreover, the variation in the timber requirements across all strength classes is compared to the reference 39.75 m3, providing a comprehensive overview of material efficiency.
From the direct comparison for the same timber material (GL 28h), the optimization leads to a significant reduction of 26.64% in the material volume required for the roof structure. Considering material costs [49], the reference roof incurs an expense of 43,315 EUR, whereas the optimized structure costs 33,243 EUR, representing a 10,000 EUR saving. Hence, the optimization results in more efficient resource use and lower construction costs without compromising structural integrity.
Similarly, the selection of timber pertaining to a different strength class also results in savings while allowing for diversification in the wood species selected or adaptation to locally available materials. Thus, such a strategy could seek economic and material efficiency but also include sustainability considerations in the decision-making process.
Finally, to provide a simplified approach to the comparison between classes, Table 8 shows the percentage reduction between the modulus of elasticity parallel to the grain (Table 1) of a specific strength class and that of the GL 32h reference (RMOD) as well as the percentage reduction between the required timber volume of a specific class compared to the GL 32h reference (RVOL). As proved by the statistical analysis, the snow load range significantly explains the variability of the correlation between RVOL and RMOD (Equation (7)), with a slope approximately 1.53 times steeper for the 0.4 to 1.5 kN/m2 snow range.
For   Snow   load   range   [ 0.4 ,   1.5 ]   RVOL = - 2.0375 + 0.4349   ×   RMOD For   Snow   load   range   ( 1.5 ,   3.0 ]   RVOL = - 2.0375   +   0.2847   ×   RMOD

4. Conclusions

This research focused on the optimization of roof structures comprised of glulam beams and purlins of different strength classes and exposed to varying snow loads. The developed genetic algorithm tool, along with the structural calculation program, was employed to generate 1792 optimal roof structures with dimensions (i.e., roof length and span) and load conditions (i.e., snow loads below 3 kN/m2) typical of European construction. From a systematic statistical analysis, several predictive equations were proposed as a reliable method for optimizing timber roof design in accordance with Eurocode 5 [45]. Firstly, the predictive model could be used to optimize the beam width and height as well as their spatial arrangement as a function of the roof dimensions, loads, and the desired strength class. Additionally, the developed model also enabled the determination of the overall optimal timber volume required for a roof structure as a function of the strength class. Although this approach seeks material usage reduction and economic savings, it ultimately could include sustainability considerations in the decision-making process. Since an optimal solution could arise from timber pertaining to various strength classes, it would allow for diversification in the wood species selected or adaptation to locally available materials. Thus, such a strategy would assist in the promotion of the use of alternative wood species, which would further biodiversity and future resilience against climate change.
Among the findings, it was found that double-tapered beams exhibited their optimal inclination angle at 5°, leading to a 30% reduction in the total timber volume used for the roof structure compared to an inclination of 10°. The optimal spacing between purlins coincided with the maximum set value, i.e., that allowed by the roofing material. This pointing to consideration of non-traditional roofing materials as a future optimization strategy.
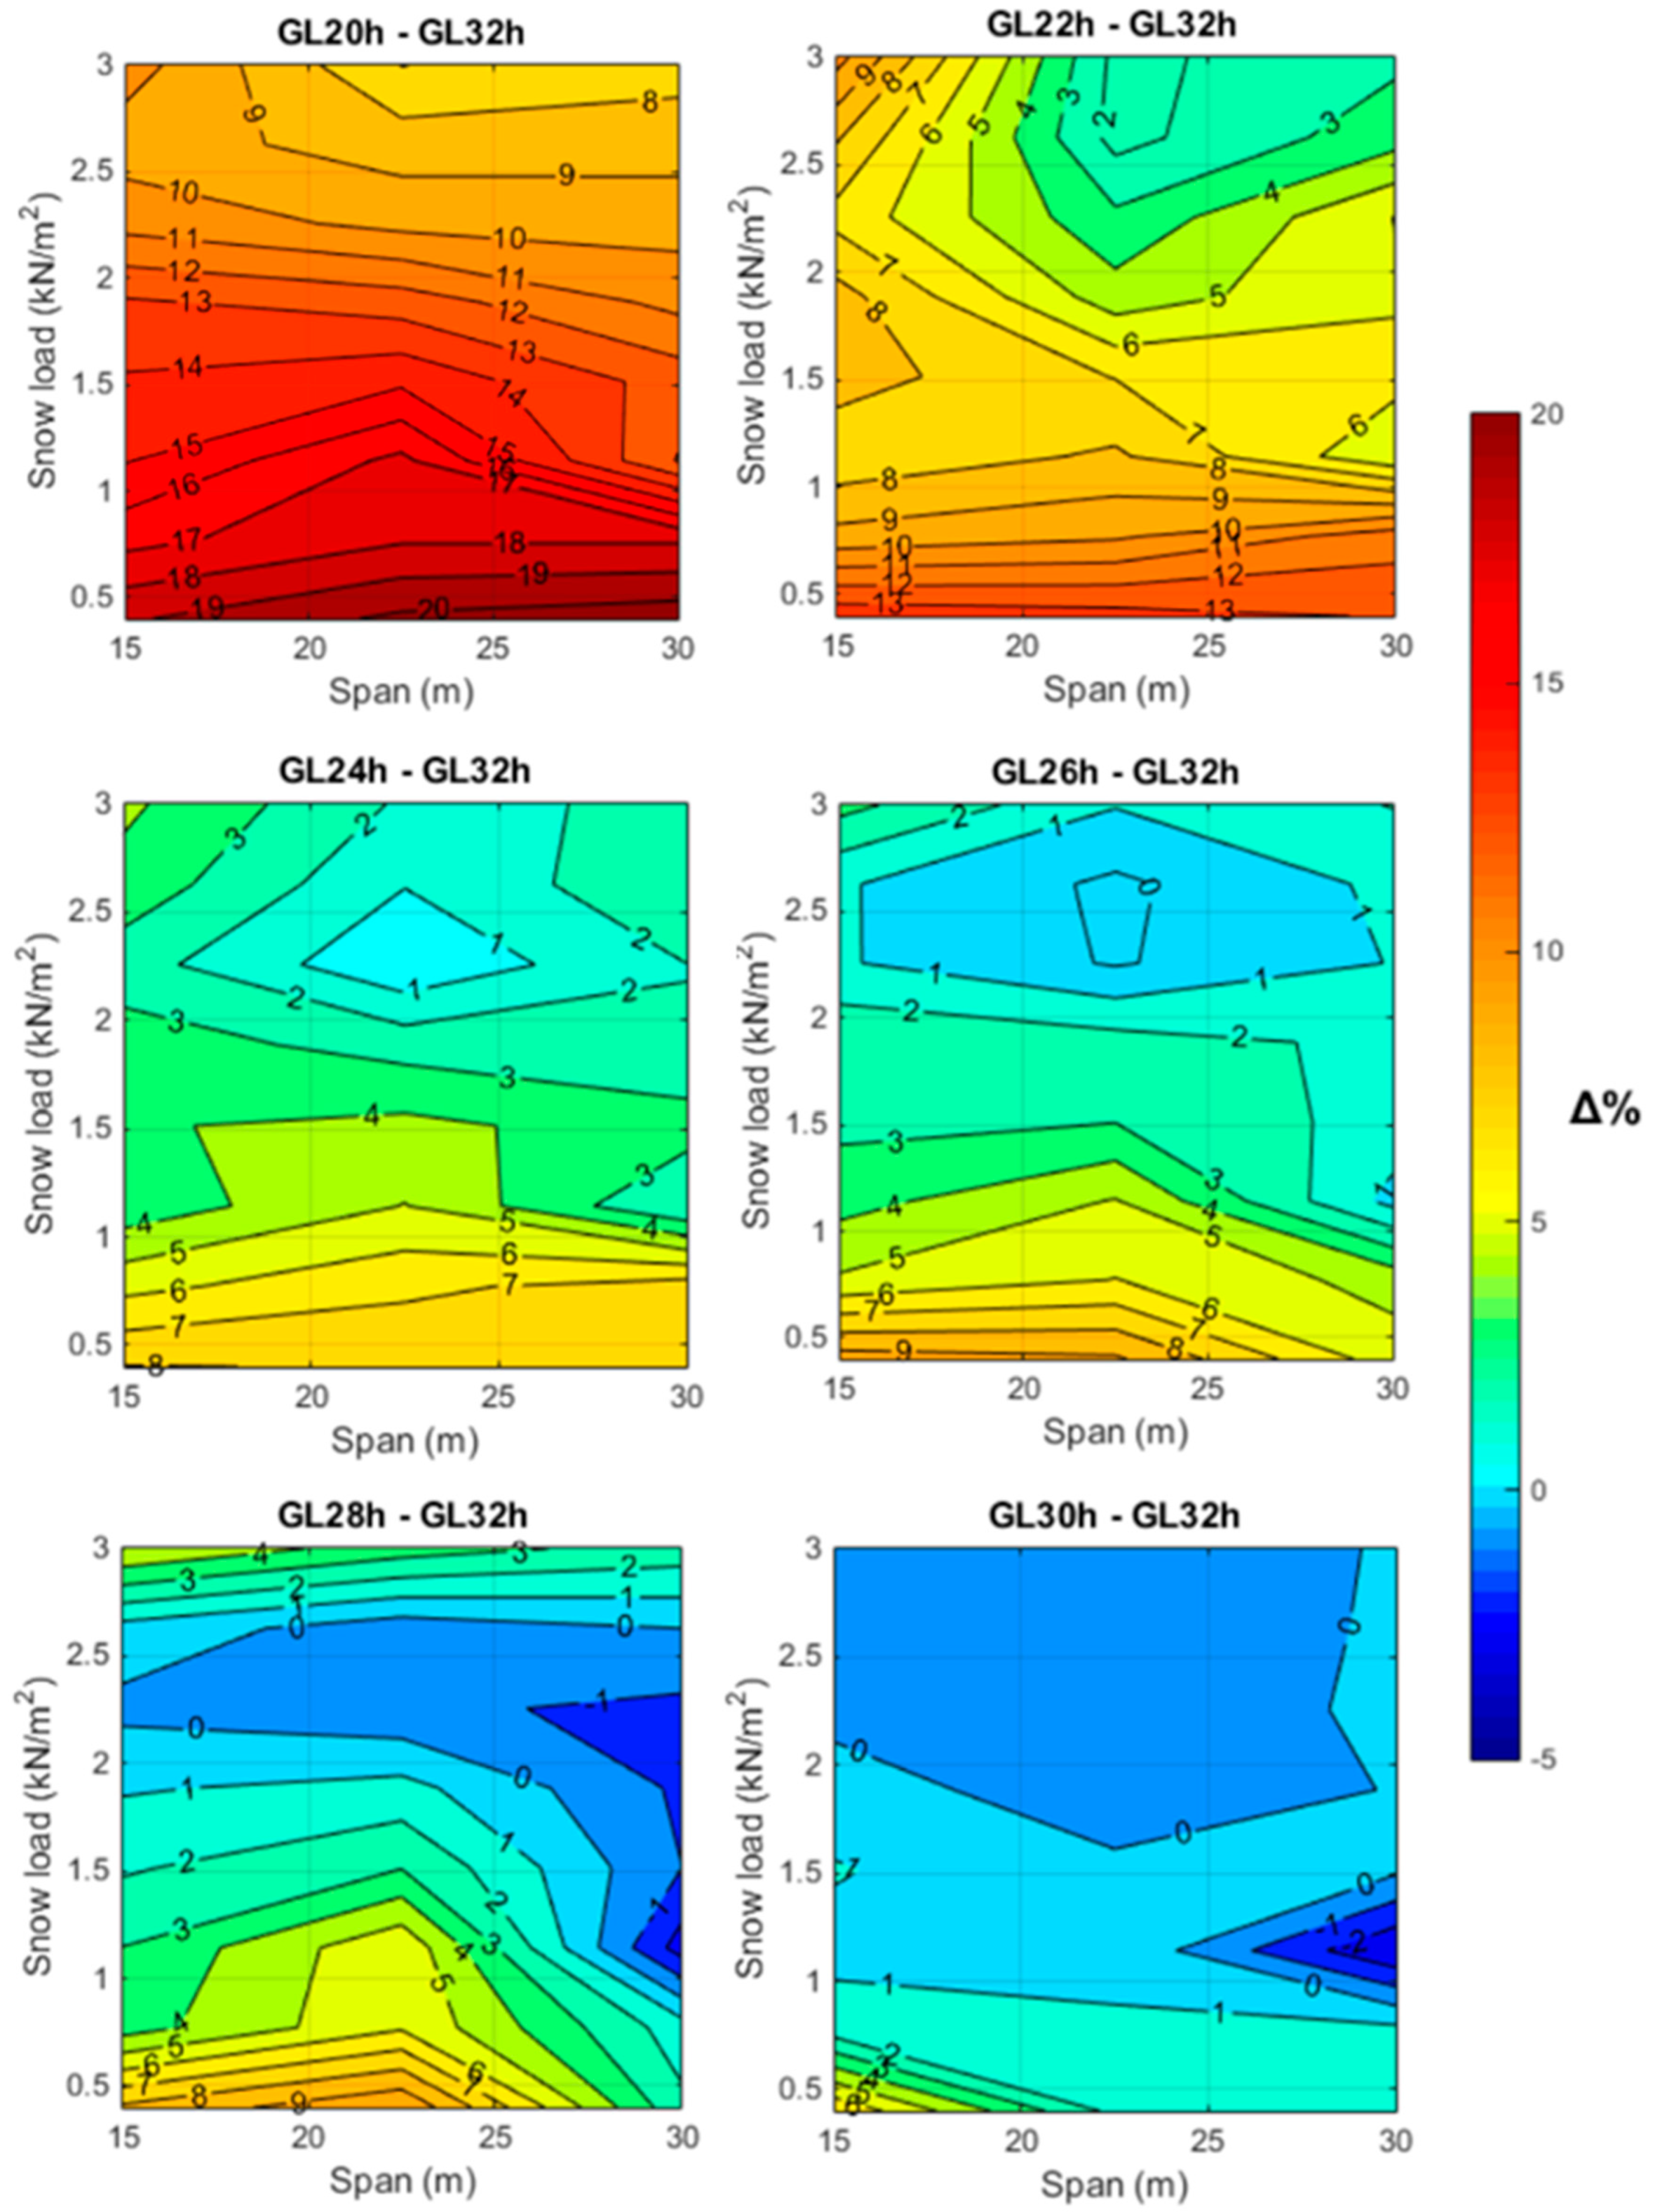
For structures exposed to snow loads greater than 2.5 kN/m2, a similar timber volume requirement, with at most a 3% difference, was noticed for most strength classes (GL 24h, GL 26h, GL 28h, GL 30h, and GL 32h). Thus, suggesting the existence of a broad range of wood species that effectively could rival the most commonly employed (GL 24h and GL 32h). Similarly, for snow loads greater than 1 kN/m2, GL 30h and GL 32h classes also resulted in similar consumption of timber volumes (up to 1%). Across all strength classes, the largest differences in volume occur at span values close to 15 m and for lower snow loads, with differences up to 20% for GL 20h compared to GL 32h. In any case, a strong relationship exists between the increase in the timber volume and the reduction in the strength class or the modulus of elasticity.

Author Contributions

Conceptualization, methodology, software, validation, investigation, data curation, writing—original draft preparation, review and editing, visualization, M.S.-P., J.R.V.-G., P.V.-L. and D.R.-R.; supervision, funding acquisition, J.R.V.-G., P.V.-L. and D.R.-R. All authors have read and agreed to the published version of the manuscript.

Funding

This research was funded by Junta de Extremadura and the European Regional Development Fund of the European Union through grants GR21163 and GR21091.

Institutional Review Board Statement

Not applicable.

Informed Consent Statement

Not applicable.

Data Availability Statement

The data presented in this study are available on request from the corresponding author.

Acknowledgments

Administrative and technical support from the Forest Research Group and the Mechanical and Fluid Engineering Research Group of the University of Extremadura is gratefully acknowledged.

Conflicts of Interest

The authors declare no conflicts of interest.

References

  1. European Commission. Communication from the Commission to the European Parliament, the Council, the European Economic and Social Committee and the Committee of the Regions. A New Circular Economy Action Plan For a Cleaner and More Competitive Europe; COM(2020) 98 Final; Publications Office of the EU: Luxembourg, 2020. [Google Scholar]
  2. Eurostat Waste Statistics. Available online: https://ec.europa.eu/eurostat/statistics-explained/index.php?title=Waste_statistics (accessed on 6 March 2024).
  3. European Commission. Directive (EU) 2023/1791 of the European Parliament and of the Council of 13 September 2023 on Energy Efficiency and Amending Regulation (EU) 2023/955 (Recast) (Text with EEA Relevance); Publications Office of the EU: Luxembourg, 2023; Volume 231. [Google Scholar]
  4. Ecoinvent LCA Database. Available online: https://ecoinvent.org/database/ (accessed on 6 March 2024).
  5. European Commission. European Parliament Resolution of 15 January 2020 on the European Green Deal (2019/2956(RSP)); Publications Office of the EU: Luxembourg, 2020. [Google Scholar]
  6. Ayanleye, S.; Udele, K.; Nasir, V.; Zhang, X.; Militz, H. Durability and Protection of Mass Timber Structures: A Review. J. Build. Eng. 2022, 46, 103731. [Google Scholar] [CrossRef]
  7. Huang, Y.; Hu, J.; Peng, H.; Chen, J.; Wang, Y.; Zhu, R.; Yu, W.; Zhang, Y. A New Type of Engineered Wood Product: Cross-Laminated-Thick Veneers. Case Stud. Constr. Mater. 2024, 20, e02753. [Google Scholar] [CrossRef]
  8. Sandberg, D.; Kutnar, A.; Mantanis, G. Wood Modification Technologies—A Review. iForest—Biogeosci. For. 2017, 10, 895. [Google Scholar] [CrossRef]
  9. Cabral, J.P.; Kafle, B.; Subhani, M.; Reiner, J.; Ashraf, M. Densification of Timber: A Review on the Process, Material Properties, and Application. J. Wood Sci. 2022, 68, 20. [Google Scholar] [CrossRef]
  10. Puettmann, M.; Pierobon, F.; Ganguly, I.; Gu, H.; Chen, C.; Liang, S.; Jones, S.; Maples, I.; Wishnie, M. Comparative LCAs of Conventional and Mass Timber Buildings in Regions with Potential for Mass Timber Penetration. Sustainability 2021, 13, 13987. [Google Scholar] [CrossRef]
  11. Condé, T.M.; Tonini, H.; Higuchi, N.; Higuchi, F.G.; Lima, A.J.N.; Barbosa, R.I.; dos Santos Pereira, T.; Haas, M.A. Effects of Sustainable Forest Management on Tree Diversity, Timber Volumes, and Carbon Stocks in an Ecotone Forest in the Northern Brazilian Amazon. Land Use Policy 2022, 119, 106145. [Google Scholar] [CrossRef]
  12. Arriaga, F.; Wang, X.; Íñiguez-González, G.; Llana, D.F.; Esteban, M.; Niemz, P. Mechanical Properties of Wood: A Review. Forests 2023, 14, 1202. [Google Scholar] [CrossRef]
  13. Martínez-Alonso, C.; Berdasco, L. Carbon Footprint of Sawn Timber Products of Castanea Sativa Mill. in the North of Spain. J. Clean. Prod. 2015, 102, 127–135. [Google Scholar] [CrossRef]
  14. Cabral, M.R.; Blanchet, P. A State of the Art of the Overall Energy Efficiency of Wood Buildings—An Overview and Future Possibilities. Materials 2021, 14, 1848. [Google Scholar] [CrossRef]
  15. Allan, K.; Phillips, A.R. Comparative Cradle-to-Grave Life Cycle Assessment of Low and Mid-Rise Mass Timber Buildings with Equivalent Structural Steel Alternatives. Sustainability 2021, 13, 3401. [Google Scholar] [CrossRef]
  16. Liang, S.; Gu, H.; Bergman, R.; Kelley, S.S. Comparative Life-Cycle Assessment of a Mass Timber Building and Concrete Alternative. Wood Fiber Sci. 2020, 52, 217–229. [Google Scholar] [CrossRef]
  17. EN 14080 Timber Structures—Glued Laminated Timber and Glued Solid Timber—Requirements; CEN: Belgium, Brussels, 2013.
  18. Porteous, J.; Kermani, A. Structural Timber Design to Eurocode 5; John Wiley & Sons: Oxford, UK, 2013. [Google Scholar]
  19. Baranski, J.; Szolomicki, J.; Damian, K. Shape Optimization of Glulam Timber Roof Girders. In Proceedings of the World Congress on Engineering and Computer Science, London, UK, 4–6 July 2018; Volume 2. [Google Scholar]
  20. Jelušič, P.; Kravanja, S. Optimal Design and Competitive Spans of Timber Floor Joists Based on Multi-Parametric MINLP Optimization. Materials 2022, 15, 3217. [Google Scholar] [CrossRef] [PubMed]
  21. De Vito, A.F.; Vicente, W.M.; Xie, Y.M. Topology Optimization Applied to the Core of Structural Engineered Wood Product. Structures 2023, 48, 1567–1575. [Google Scholar] [CrossRef]
  22. Kilincarslan, S.; Simsek Turker, Y. Experimental Investigation of the Rotational Behaviour of Glulam Column-Beam Joints Reinforced with Fiber Reinforced Polymer Composites. Compos. Struct. 2021, 262, 113612. [Google Scholar] [CrossRef]
  23. Wang, X.T.; Zhu, E.C.; Niu, S.; Wang, H.J. Analysis and Test of Stiffness of Bolted Connections in Timber Structures. Constr. Build. Mater. 2021, 303, 124495. [Google Scholar] [CrossRef]
  24. Fu, Q.; Yan, L.; Thielker, N.A.; Kasal, B. Effects of Concrete Type, Concrete Surface Conditions and Wood Species on Interfacial Properties of Adhesively-Bonded Timber—Concrete Composite Joints. Int. J. Adhes. Adhes. 2021, 107, 102859. [Google Scholar] [CrossRef]
  25. Giv, A.N.; Chen, Z.; Fu, Q.; Leusmann, T.; Yan, L.; Lowke, D.; Kasal, B. Bending Behavior and Bond Analysis on Adhesively Bonded Glulam-Concrete Panels Fabricated with Wet Bonding Technique. J. Build. Eng. 2023, 76, 107140. [Google Scholar] [CrossRef]
  26. Ferrara, G.; Michel, L.; Ferrier, E. Flexural Behaviour of Timber-Concrete Composite Floor Systems Linearly Supported at Two Edges. Eng. Struct. 2023, 281, 115782. [Google Scholar] [CrossRef]
  27. Gomez-Ceballos, W.G.; Gamboa-Marrufo, M.; Grondin, F. Multi-Criteria Assessment of a High-Performance Glulam through Numerical Simulation. Eng. Struct. 2022, 256, 114021. [Google Scholar] [CrossRef]
  28. Ching, E.; Carstensen, J.V. Truss Topology Optimization of Timber–Steel Structures for Reduced Embodied Carbon Design. Eng. Struct. 2022, 252, 113540. [Google Scholar] [CrossRef]
  29. De Luca, V.; Marano, C. Prestressed Glulam Timbers Reinforced with Steel Bars. Constr. Build. Mater. 2012, 30, 206–217. [Google Scholar] [CrossRef]
  30. McConnell, E.; McPolin, D.; Taylor, S. Post-Tensioning of Glulam Timber with Steel Tendons. Constr. Build. Mater. 2014, 73, 426–433. [Google Scholar] [CrossRef]
  31. Mam, K.; Douthe, C.; Le Roy, R.; Consigny, F. Shape Optimization of Braced Frames for Tall Timber Buildings: Influence of Semi-Rigid Connections on Design and Optimization Process. Eng. Struct. 2020, 216, 110692. [Google Scholar] [CrossRef]
  32. Suárez-Riestra, F.; Estévez-Cimadevila, J.; Martín-Gutiérrez, E.; Otero-Chans, D. Experimental, Analytical and Numerical Vibration Analysis of Long-Span Timber-Timber Composite Floors in Self-Tensioning and Non-Tensioning Configurations. Constr. Build. Mater. 2019, 218, 341–350. [Google Scholar] [CrossRef]
  33. Suárez-Riestra, F.; Estévez-Cimadevila, J.; Martín-Gutiérrez, E.; Otero-Chans, D. Timber-Timber-Composite (TTC) Beam Long-Term Behaviour. Full Scale Experimental Campaign and Simplified Analytical Model. Constr. Build. Mater. 2022, 361, 129649. [Google Scholar] [CrossRef]
  34. Jelušič, P. Determining Optimal Designs of Timber Beams with Non-Uniform Cross-Section. In Proceedings of the WIT Transactions on The Built Environment, Ljubljana, Slovenia, 11–13 July 2018; Volume 175, pp. 169–175. [Google Scholar]
  35. Šilih, S.; Kravanja, S.; Premrov, M. Shape and Discrete Sizing Optimization of Timber Trusses by Considering of Joint Flexibility. Adv. Eng. Softw. 2010, 41, 286–294. [Google Scholar] [CrossRef]
  36. Simón-Portela, M.; Villar-García, J.R.; Rodríguez-Robles, D.; Vidal-López, P. Optimization of Glulam Regular Double-Tapered Beams for Agroforestry Constructions. Appl. Sci. 2023, 13, 5731. [Google Scholar] [CrossRef]
  37. Negrin, I.; Kripka, M.; Yepes, V. Design Optimization of Welded Steel Plate Girders Configured as a Hybrid Structure. J. Constr. Steel Res. 2023, 211, 108131. [Google Scholar] [CrossRef]
  38. Negrin, I.; Kripka, M.; Yepes, V. Metamodel-Assisted Meta-Heuristic Design Optimization of Reinforced Concrete Frame Structures Considering Soil-Structure Interaction. Eng. Struct. 2023, 293, 116657. [Google Scholar] [CrossRef]
  39. Gonzalez-Montellano, C.; Ramirez, A.; Gallego, E.; Ayuga, F. On the Steel Cost of Circular Flat-Bottomed Silos Designed Using the Eurocodes. Struct. Eng. Mech. 2009, 33, 561–572. [Google Scholar] [CrossRef]
  40. Villar, J.R.; Vidal, P.; Fernández, M.S.; Guaita, M. Genetic Algorithm Optimisation of Heavy Timber Trusses with Dowel Joints According to Eurocode 5. Biosyst. Eng. 2016, 144, 115–132. [Google Scholar] [CrossRef]
  41. Villar-García, J.R.; Vidal-López, P.; Rodríguez-Robles, D.; Guaita, M. Cost Optimisation of Glued Laminated Timber Roof Structures Using Genetic Algorithms. Biosyst. Eng. 2019, 187, 258–277. [Google Scholar] [CrossRef]
  42. Baeten, L.; Bruelheide, H.; Van Der Plas, F.; Kambach, S.; Ratcliffe, S.; Jucker, T.; Allan, E.; Ampoorter, E.; Barbaro, L.; Bastias, C.C.; et al. Identifying the Tree Species Compositions That Maximize Ecosystem Functioning in European Forests. J. Appl. Ecol. 2019, 56, 733–744. [Google Scholar] [CrossRef]
  43. Fichtner, A.; Härdtle, W.; Li, Y.; Bruelheide, H.; Kunz, M.; Von Oheimb, G. From Competition to Facilitation: How Tree Species Respond to Neighbourhood Diversity. Ecol. Lett. 2017, 20, 892–900. [Google Scholar] [CrossRef]
  44. Vilà, M.; Vayreda, J.; Comas, L.; Ibáñez, J.J.; Mata, T.; Obón, B. Species Richness and Wood Production: A Positive Association in Mediterranean Forests. Ecol. Lett. 2007, 10, 241–250. [Google Scholar] [CrossRef]
  45. UNE-EN 1995-1-1; Eurocódigo 5: Proyecto de Estructuras de Madera. Parte 1-1: Reglas Generales y Reglas Para Edificación. AENOR: Madrid, Spain, 2016.
  46. EN 1991-1-3/AC-A1; Eurocode 1: Actions on Structures—Part 3: Snow Loads. CEN: Brussels, Belgium, 2015.
  47. Royal Decree 314 Technical Building Code; Spanish Ministry of Housing: Madrid, Spain, 2006.
  48. EN 1991-1-4/AC-A1; Eurocode 1: Actions on Structures—Part 4: Wind Actions. CEN: Brussels, Belgium, 2010.
  49. Instituto Valenciano de la Edificación Cost Database. Available online: https://bdc.f-ive.es/BDC23/1 (accessed on 5 March 2024).
  50. Argüelles Álvarez, R.; Arriaga Martitegui, F. Timber Structures: Design and Calculation [Estructuras de madera: Diseño y cálculo]; Editorial AITIM: Madrid, Spain, 1997; ISBN 978-84-87381-09-6. [Google Scholar]
Figure 1. Genetic algorithm optimization process.
Sustainability 16 03514 g001
Figure 2. Illustrative example of the evolution of the modified objective function for a GL 32h roof structure of 22.5 × 45 m subjected to a snow load of 1 kN/m2.
Sustainability 16 03514 g002
Figure 3. Optimal width of the beam, in mm, for the different timber strength classes.
Sustainability 16 03514 g003
Figure 4. Optimal height of the beam, in mm, for the different timber strength classes.
Sustainability 16 03514 g004
Figure 5. Linear regression between the genetics and predicted timber volumes, in m3. The dashed line corresponds to the 1:1 relationship.
Sustainability 16 03514 g005
Figure 6. Timber volume variation, in percentage, between the selected strength class and the reference GL 32h class as a function of the snow load and span.
Sustainability 16 03514 g006
Table 1. Characteristic properties for each homogeneous glulam strength class [17].
PropertyGL 20hGL 22hGL 24hGL 26hGL 28hGL 30hGL 32h
Bending strength (N/mm2)20222426283032
Tensile strength: parallel to the grain (N/mm2)1617.619.220.822.32425.6
Tensile strength: perpendicular to the grain (N/mm2)0.5
Compression strength: parallel to the grain (N/mm2)20222426283032
Compression strength: perpendicular to the grain (N/mm2)2.5
Modulus of elasticity: parallel to the grain (N/mm2)840010,50011,50012,10012,60013,60014,200
Modulus of elasticity: perpendicular to the grain (N/mm2)300
Density (kg/m3)340370385405425430440
Table 2. Coefficients for the determination of the beam width as a function of the span, snow load, and strength class according to Equation (2).
Strength ClassSnow Load Range (kN/m2)ABC
GL 20h[0.4, 1.0]−2.623630.084740.09558
(1.0, 3.0]−5.549450.236340.06286
GL 22h[0.4, 1.0]−1.920330.076530.03823
(1.0, 1.8]−3.414840.037790.12499
(1.8, 3.0]−6.764840.383970.02239
GL 24h[0.4, 2.4]−3.200800.145410.02972
(2.4, 3.0]−8.57140.11540.1461
GL 26h[0.4, 2.0]−2.495730.120070.01960
(2.0, 3.0]−7.02490.0000.1611
GL 28h[0.4, 2.0]−2.532360.115260.02117
(2.0, 3.0]−6.48640.000000.1511
GL 30h[0.4, 1.6]−1.9466250.0983500.009656
(1.6, 3.0]−6.191520.136800.09266
GL 32h[0.4, 0.6]−1.615380.070350.01870
(1.4, 3.0]−6.151100.177790.07631
Table 3. Coefficients for the determination of the beam height as a function of the span, snow load, beam width, and strength class according to Equation (3).
Strength ClassSnow Load Range (kN/m2)ABCDE
GL 20h[0.4, 0.8]−2437.7364.9−387.00.01.3
(0.8, 3.0]43.69167.7027−0.66861.89430.8
GL 22h[0.4, 1.6]−107.7932.440.00010.641.0
(1.6, 3.0]44.5258.2760.0001.5160.8
GL 24h[0.4, 2.4]−82.26830.6550.0009.9721.0
(2.4, 3.0]9.78690.45732.13130.17990.5
GL 26h[0.4, 1.8]−1195.93149.320.00047.621.2
(2.2, 3.0]35.0290.0000.0001.9200.7
GL 28h[0.4, 2.6]−1899.6255.0−931.2152.61.3
(2.6, 3.0]−67.7872.35631.5630.0000.6
GL 30h[0.4, 2.0]−790.05121.95−260.8066.661.2
(2.0, 3.0]480.660.000−233.5723.771.0
GL 32h[0.4, 0.6]227.1461.13−1924.63111.491.2
(0.6, 1.4]−143.5018.99138.300.0000.9
(1.4, 2.4]−565.4255.17220.200.0001.0
(2.4, 3.0]−1288.7366.47396.610.0001.0
Table 4. Coefficients for the determination of the number of beams as a function of the span, snow load and strength class according to Equation (4).
Strength ClassSnow Load Range (kN/m2)ABCD
GL 20h[0.4, 1.0)1.7146530.0292030.0033520.5
[1.0, 1.4)1.886763
[1.4, 1.8)2.01307
[1.8, 2.6)2.079799
[2.6, 3.0]2.190146
GL 22h[0.4, 0.6)1.3875000.1799690.0055561.0
[0.6, 1.0)0.227129
[1.0, 2.2)0.246142
[2.2, 2.8]0.279475
(2.8, 3.0]0.309969
GL 24h[0.4, 0.6)2.1833850.0359690.003365 0.6
[0.6, 1.0)0.044658
[1.0, 1.4)0.050095
[1.4, 1.8)0.053231
[1.8, 2.5)0.057995
[2.5, 3.0)0.051065
GL 26h[0.4, 0.6)−13.016950.79546−0.047281.4
[0.6, 1.0)0.9864
[1.0, 1.4)1.13949
[1.4, 1.8)1.31396
[1.8, 3.0]1.49259
GL 28h[0.4, 0.6)1.4166670.1758840.0021621.0
[0.6, 1.0)0.219464
[1.0, 1.4)0.245759
[1.4, 1.8)0.279462
(1.8, 3.0]0.312182
GL 30h[0.4, 0.6)−0.237220.249090.015081.1
[0.6, 1.0)0.29747
[1.0, 1.4)0.34151
[1.4, 1.8)0.39152
(1.8, 3.0]0.43494
GL 32h[0.4, 1.0)2.2328590.0415010.0050990.6
[1.0, 1.8)0.045316
[1.8, 3.0]0.050558
Table 5. Optimal purlin height values as a function of the snow load and strength class.
Strength ClassSnow Load Range (kN/m2)Purlin Height (mm)
GL 20h[0.4, 0.6]160
(0.6, 3.0]200
GL 22h[0.4, 1.6]160
(1.6, 3.0]200
GL 24h[0.4, 2.4]160
(2.4, 3.0]200
GL 26h[0.4, 2.6]160
(2.6, 3.0]200
GL 28h[0.4, 2.8]160
(2.8, 3.0]200
GL 30h[0.4, 3.0]160
GL 32h[0.4, 0.6]120
(0.6, 3.0]160
Table 6. Coefficients for the determination of the volume of timber as a function of the roof length, snow load and span according to Equation (6).
Strength ClassSnow Load Range (kN/m2)Span Range (m)ABCDE
GL 20h[0.4, 3.0][15, 24]2.49589−0.39406−0.334660.049090.03310
(24, 30]7.38722−2.815520.00000.129690.0275
GL 22h[0.4, 3.0][15, 23]1.06634−0.30129−0.273910.043090.02919
(23, 30]7.26380−0.65811−0.989760.053060.06075
GL 24h[0.4, 3.0][15, 23]0.92186−0.26346−0.299970.039670.03067
(23, 30]6.42904−0.61534−0.959220.049810.05996
GL 26h[0.4, 3.0][15, 22]0.074440.00000−0.399300.024370.03664
(22, 29]5.135920.00000−1.124140.025610.06663
(29, 30]6.01730.84920.85070.00000.0000
GL 28h[0.4, 2.5][15, 22]0.147860.0000−0.41010.024650.03664
(22,30]4.407940.0000−1.052640.028060.06222
(2.5, 3.0][15, 22]−1.194040.0000−0.358150.011460.03943
(22,30]8.532190.0000−1.129230.00000.07523
GL 30h[0.4, 3.0][15, 23]1.25132−0.18641−0.355790.033700.03375
(23, 30]5.65268−0.57068−0.973290.046150.06066
GL 32h[0.4, 3.0][15, 22]0.91510−0.20407−0.303540.034220.03088
(22, 30]4.25579−0.50446−0.874090.044270.05749
Table 7. Optimal timber volumes (Equation (5)) for Example 2 and variation of timber consumption compared to the reference [50].
Strength ClassOptimal Volume (m3)Variation (%)
GL 20h35.87−9.76
GL 22h32.84−17.38
GL 24h31.4−21.01
GL 26h29.06−26.89
GL 28h29.16−26.64
GL 30h29.94−24.68
GL 32h29.17−26.62
Table 8. RMOD and RVOL values for the comparison of a strength class to the GL 32h reference class as a function of the snow load range.
Snow Load Range (kN/m2)%GL 20hGL 22hGL 24hGL 26hGL 28hGL 30h
RMOD40.826.11914.811.34.2
[0.4, 1.5]RVOL15.99.863.22.61.1
(1.5, 3.0]RVOL10.25.22.71.60.70.1
Disclaimer/Publisher’s Note: The statements, opinions and data contained in all publications are solely those of the individual author(s) and contributor(s) and not of MDPI and/or the editor(s). MDPI and/or the editor(s) disclaim responsibility for any injury to people or property resulting from any ideas, methods, instructions or products referred to in the content.

