Article

CO2 Emission Compensation by Tree Species in Some Urban Green Areas

1
Department of Civil and Environmental Engineering, University of Perugia, 06121 Perugia, Italy
2
Department of Engineering, University of Perugia, 06125 Perugia, Italy
3
School of Science and Technology, University of Camerino, 62032 Camerino, Italy
*
Author to whom correspondence should be addressed.
Sustainability 2024, 16(9), 3515; https://doi.org/10.3390/su16093515
Submission received: 28 February 2024 / Revised: 18 April 2024 / Accepted: 19 April 2024 / Published: 23 April 2024
(This article belongs to the Special Issue Sustainable Urban Planning: Biodiversity, Greening, and Forestry)

Abstract

:
Mitigating the negative impacts of climate change in urban areas has recently become essential to improving citizens’ living conditions. Trees are one of the most effective ways to attenuate the Heat Island phenomenon in cities, and numerous projects have been carried out to calculate tree ecosystem services (ES) provisioning. Among these, the Clivut European project (LIFE 18 GIC/IT/001217) developed a web app to allow citizens and the public administration to quantify the ES provided by the most common tree species. The present study aims to consider a new model to calculate the tree evapotranspiration cooling effect in the urban environment in terms of CO2-compensated emissions. The model directly converts the surface temperature change produced by tree evapotranspiration into the corresponding CO2 offset in four urban parks in two Italian cities (Bologna and Perugia). The considered parks stored 1100 t of CO2 at the time of the study, while the CO2 compensated is 860 t, showing the significance of this interpretation. As a result of the study, it can be concluded that the presented model will allow a better estimation of the potential trees’ climate change compensation and also add further functionality to the web app.

1. Introduction

Addressing climate change is the most significant challenge of our times. As a consequence of the increasingly hotter and more prolonged summers, a substantial increase in the need for cooling systems is expected, especially in densely populated regions of the Mediterranean basin [1]. Cities are greatly affected by climate change phenomena. However, they also have a significant impact on climate change as they are the main emitters of greenhouse gases: up to 70% of global anthropogenic emissions come from those areas, primarily related to fossil fuel consumption [2]. Therefore, direct interventions in large urban areas could represent part of the solution on the path for climate change mitigation [3,4]. Among the EU challenges to increase the sustainability of urban environments, some key objectives are energy efficiency, conservation and restoration of biodiversity, and the “zero pollution” target for a toxic-free environment [5]. Urban green infrastructures play an important role in increasing cities’ sustainability by producing essential benefits for the environment and thus for society [6,7,8], also representing an opportunity to increase energy efficiency and enter the Voluntary Carbon Market (VCM). The various typologies of urban green areas have different functions and positive effects on local climate, air quality, noise levels, soil stability, and on the psychological restoration of the local population [9]. Vegetation acts as a “natural air conditioner”, tempering the thermal extremes that characterize the Urban Heat Island effect (UHI) [10]. In particular, tree shading and evapotranspiration effects contribute to mitigating summer temperatures by decreasing air temperatures up to 7 °C in the Mediterranean area [11] and indirectly impacting air quality, greenhouse gas emission, and global warming by lowering the energy demand for cooling buildings [10]. Finally, urban trees contribute to reducing air pollution by absorbing particulate matter (PM) [7,12,13,14]. Part of the solar energy absorbed by plants results in the evaporation of leaf water, resulting in additional cooling of the atmosphere around the trees. The total volume of water evaporated and transpired depends not only on the availability of water in the soil but also on the characteristics of the leaves, the intensity of solar radiation, the air temperature, the water vapor pressure deficit in the air (the difference between the amount of moisture in the air and the amount of water vapor in the canopy), and the wind conditions. Therefore, every tree presents several intrinsic characteristics that influence its growth, shape, physiology, and radiative properties, leading some species to have more significant cooling potential. A study on the cooling capacity of urban trees in subtropical countries found that the features that contributed the most to daytime canopy air temperature reduction were (in descending order of importance) leaf color, leaf area index (LAI), leaf thickness, and leaf roughness [15]. In addition, in urban areas, the presence of plants significantly reduces the air temperature through evapotranspiration. From a sustainability point of view, this phenomenon may represent an opportunity for energy requirement reduction for summer air-conditioning cooling, with significant environmental, economic, and social implications. However, scientific evidence on the effect of different tree characteristics on their cooling capacity in temperate regions is still limited [16]. The LIFE+ Clivut project (CLIVUT LIFE 18 GIC/IT/001217) aimed to fill this gap by collecting tree ecosystem services data in four Mediterranean pilot cities (Thessaloniki in Greece, Cascais in Portugal, and Perugia and Bologna in Italy) and actively involving public administrations and citizens in this process by developing a web app (https://lifeclivut.treedb.eu/) [17,18].
By absorbing thermal energy from the atmosphere, tree evapotranspiration produces an effect opposite to that produced by the increased atmospheric concentration of CO2 and other climate-altering gases. Therefore, the energy absorbed by the trees from the environment can be interpreted in terms of CO2 emissions offset. The present work proposes a methodology to evaluate the contributions of each urban park to the evapotranspiration cooling effect and to express it in tonnes of compensated CO2 to facilitate comparison with the tree CO2 storage of the same park through a model developed by CIRIAF (Interuniversity Centre for Research on Pollution and the Environment “Mauro Felli”). This approach, based on the concept of Radiative Forcing (RF), potentially permits a better assessment of urban tree mitigation capacity and a more accurate estimation of the produced carbon credits.
As the main research question, this paper aims to determine the cooling potential of four urban parks and assess the CO2 compensation potentiality of the trees, while also comparing this to the climate change mitigation effect due to CO2 storage.
The following analyses were addressed to validate the proposed method:
  • Calculation of the CO2 storage of four Italian urban parks to assess their contribution to the heat island effect and climate change mitigation.
  • Calculation of the CO2 compensated by the four parks, based on the trees’ potential heat reduction (Q) and evapotranspiration (ETP).
  • Comparison of the trees’ CO2 storage with the CO2 compensated by each park.

2. Material and Methods
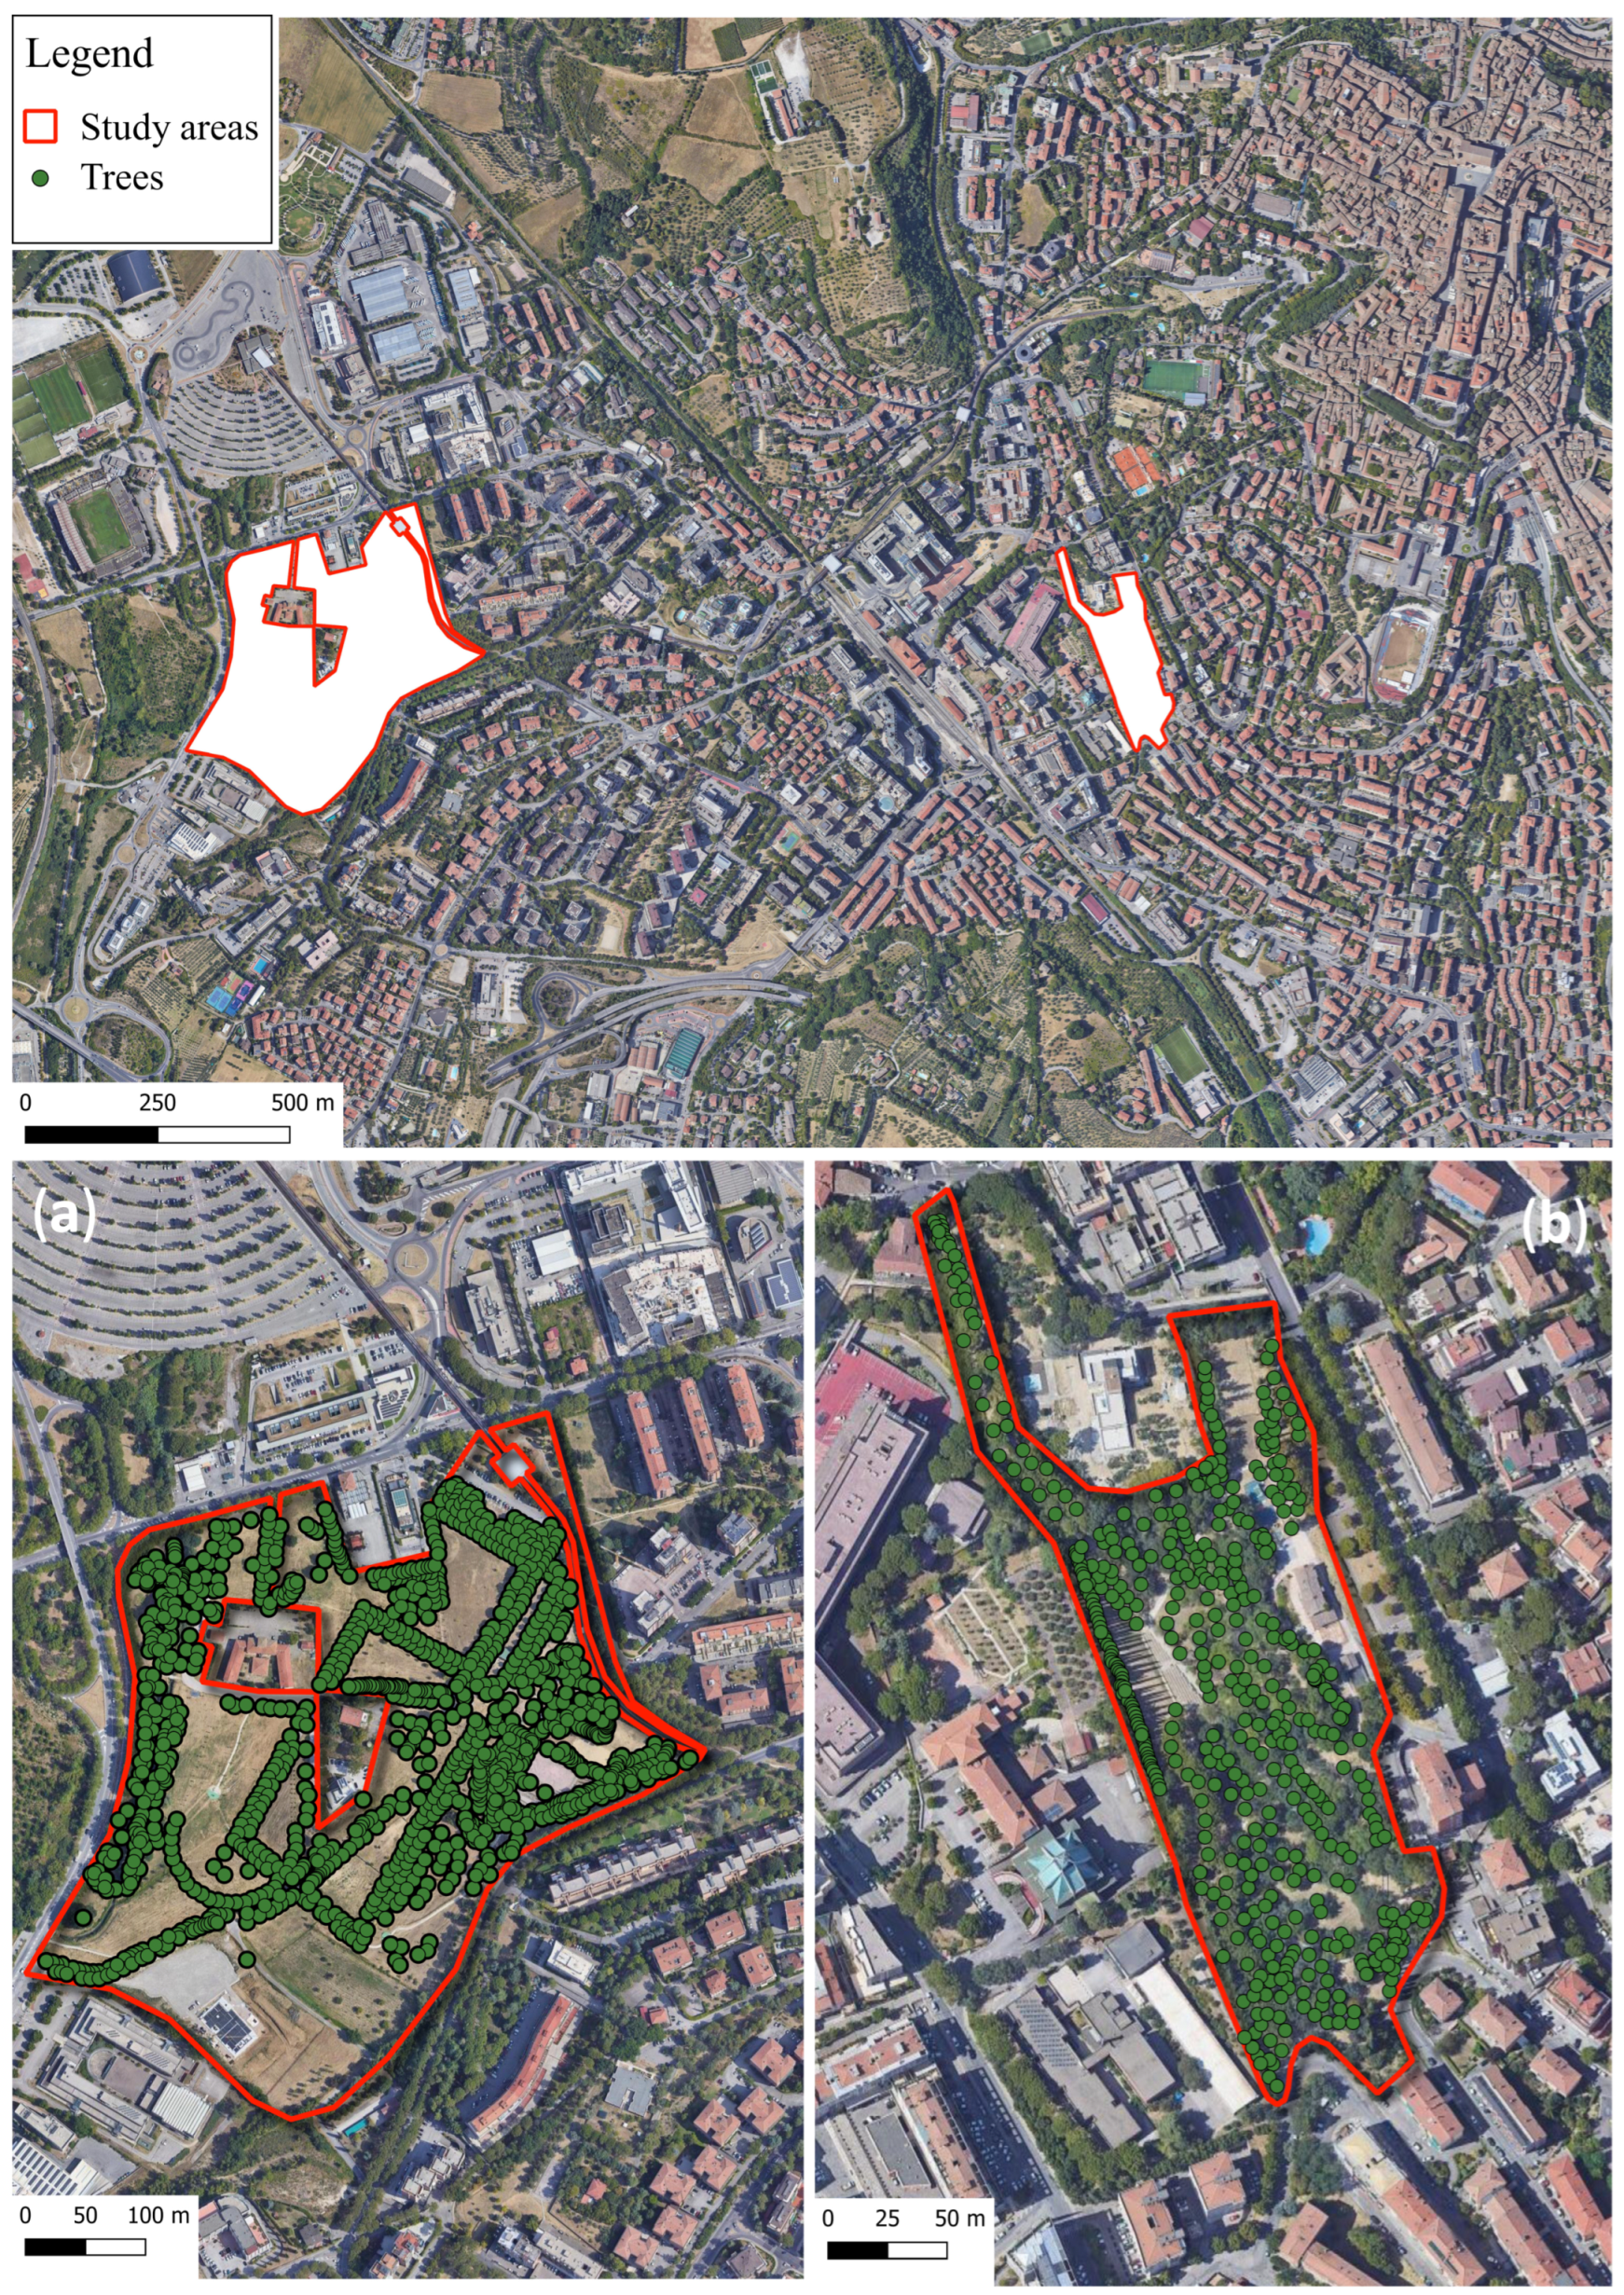
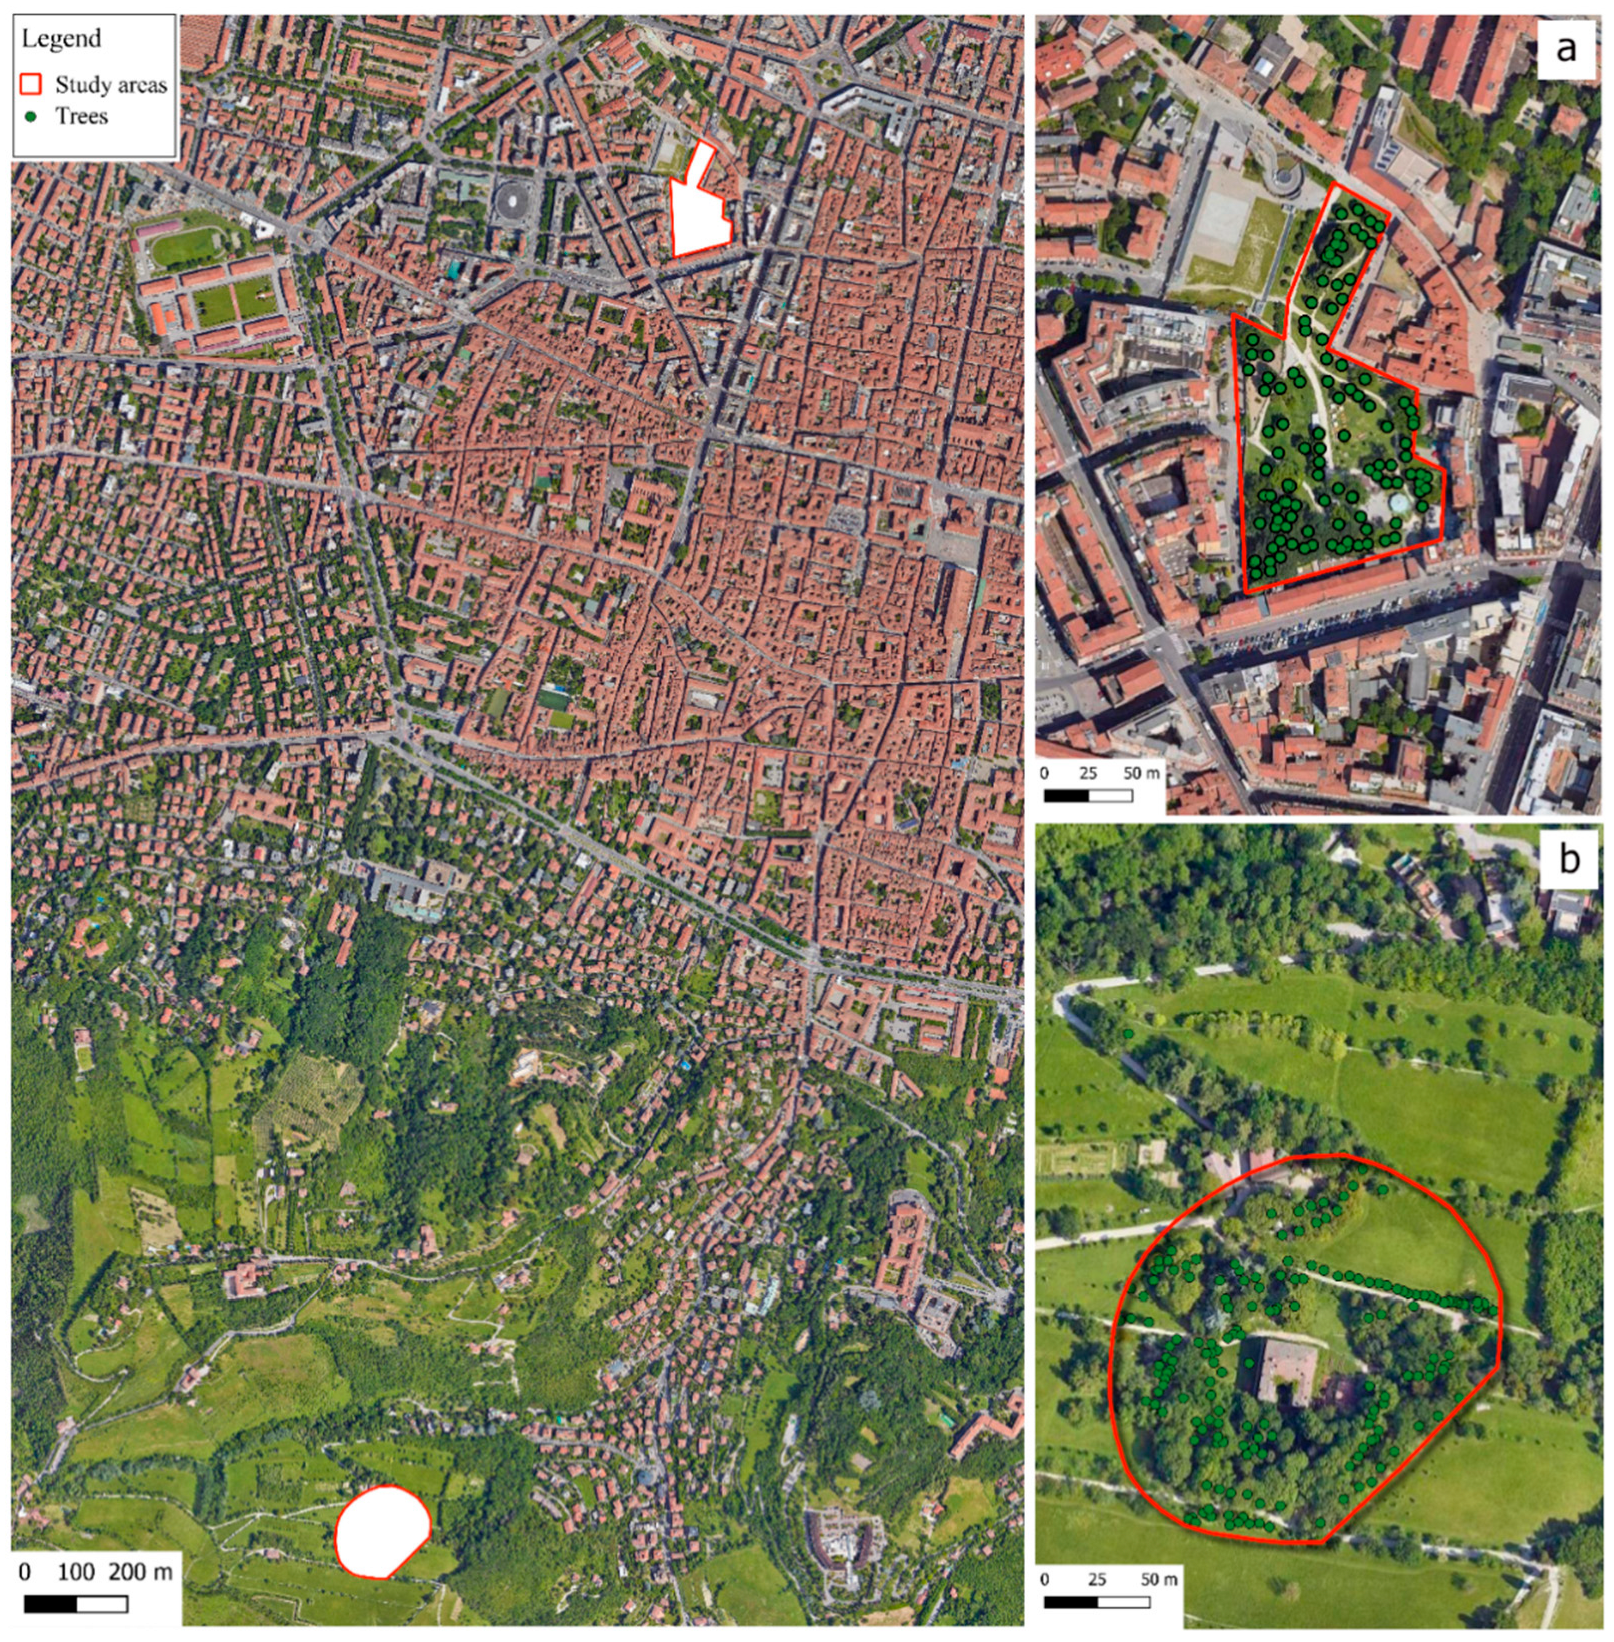
2.1. Study Areas

For the pilot cities, participation in the Clivut project required a tree census campaign of at least ten urban areas representative of each typology of urban green according to the green infrastructure concept [19]. Among these areas surveyed with the web app, this study selected four urban parks, one in a high-sealed context and one in a peri-urban context, for each study city. The four parks (Chico Mendez and Pescaia in Perugia; 11 September 2001 and Villa Ghigi Park in Bologna) were selected on the basis of their representativeness in terms of tree species and green infrastructure typology in the Italian pilot cities.
Figure 1 shows the context in which the Perugia study areas are embedded and the position of the studied trees on the map, in addition to the nearest building from the sites reachable by foot. The Chico Mendez Park (Figure 1a) is a 16 ha green infrastructure realized in the 1980s in a flat area of the city and characterized by equipped pathways and long tree-lined avenues. The Pescaia Park (Figure 1b), close to Perugia’s historic center, was built in the 1970s in one of the most densely populated neighbourhoods of the city. It presents a wide variety of Mediterranean flora distributed on different elevations due to the slope.
Figure 2 shows the location of the two study areas in Bologna. The 11 September 2001 Park (Figure 2a) is an equipped area in the densely populated city center that originates from the reconversion of a former industrial area in the 1970s. Out of the 30 ha of the Villa Ghigi Park agricultural area in the surroundings of Bologna, only the woods pertaining to the Villa (Figure 2b), opened to the public in 1974, have been considered in this study as they present characteristics typical of a historic park.
The CO2 stored and CO2 compensated calculation methodology was applied to different urban parks and does not represent any attempt to compare the related environmental performance of the same woody species present in each park since the results strongly depend on the planting age of the different trees. It aims to calculate the environmental contribution of each park as a picture of the current green heritage condition, also considering the tree species in different vegetative development phases (as young, adult, and old trees were present in the parks at that moment).

2.2. Data Collection

This study utilized the data collected from June to September during the 2020 tree census campaign of the parks described in Section 2.1.
Information about the each tree’s species, GPS position, diameter at breast height (DBH), height, the height of the first branch, crown size and shape, leaf area (LA), phytosanitary condition, distance from buildings and paved surfaces, crown transparency, and ground-cover typology were gathered in the Clivut web app’s database. A detailed description of the applied data collection methodology can be found in the Clivut protocol (https://www.lifeclivut.eu/public_download/download/8/file_download_en.pdf, accessed on 12 April 2024) and in other related publications [17]. The collection of these parameters allowed, through the web app’s mathematical models, the estimation of the following ecosystem services (ES): particulate matter (PM10) absorption, tree shading, increase in biodiversity, and above all, the potential heat reduction (Q) of the trees and the CO2 storage, as better explained in the following paragraphs (Section 2.3 and Section 2.4).
The assessing methods for these ES, even if already covered in other publications [17,18,20,21], will be briefly summarized in the following sections. All web-app databases and functions of the web app are open-source and accessible through any internet browser through https://lifeclivut.treedb.eu/ and are suitable for GIS applications.

2.3. Potential CO2 Storage Assessment

The allometric equations used in this study derive from assumptions in the literature on tree volume assessment already covered in other publications [17,18]. In particular, investigations carried out in geographical areas with similar characteristics to those of interest in temperate zones were considered [22,23,24,25,26]. Moreover, to improve the estimation of the biomass and carbon stored by tree species in the Mediterranean area, the results of an Italian research program (Ri.selv.Italia) financed by the Agricultural and Forestry Department of the Italian government have been taken into consideration in the carried out equations [27,28].
Carbon storage was based on different ages, crown sizes, growth rates, and pruning techniques, estimating tree biomass through volumetric equations (m3/tree) from diameter to breast height (DBH in centimeters) and crown height (h in meters). Dry Weight (DW) biomass and stored carbon were calculated by applying DW biomass density factors (reported in the scientific literature) and incorporating underground biomass by multiplying DW biomass by 1.28 [29,30]. DW biomass was converted to kilograms of carbon (C) by multiplying it by the constant 0.50 [31], while stored carbon was converted to stored CO2 in tonnes by multiplying it by the constant 3.67 (the molecular weight of CO2).

2.4. Potential Heat Reduction (Q) and Potential Evapotranspiration (ETP) Assessment

The evapotranspiration energy reduction potential is due to the amount of energy absorbed from the environment to evaporate water into the atmosphere. The incoming solar energy converts the water inside leaves into water vapor [16,32], producing a cooling effect in the air around the tree in a way comparable to the canopy shading effect [16]. The web app reports the cooling effect of each tree in Watts/tree and Watts/m2; in this context, square meters refer to the orthogonal projection of the tree crown surface. In addition, it can be a percentage compared to the total daily radiation in m2. Daily temperature and solar radiation data are collected from local weather stations.

2.4.1. Estimation of Evapotranspiration

Actual evapotranspiration (ETR) [mm/d] results from the interaction between the soil, vegetation, and the atmosphere. It depends essentially on the evaporative power of the atmosphere, the vegetation (type, development, and vegetative stage), and the soil’s water content.
In the present study, the magnitude of the evapotranspiration phenomenon has been determined through a simplified approach, wherein the soil’s water content is assumed to be equivalent to the amount of water that the plant can evaporate. As a result, evapotranspiration depends exclusively on the evaporating power of the atmosphere (degree of humidity) and vegetation characteristics. Thus, it denotes the highest potential evapotranspiration for a given vegetation type, considering both the plant growth and the weather conditions. Although there are several different methods for ETP estimation, the model of Hargreaves and Samani [33] has been chosen, being easily adaptable to a wide variety of climates, simple from a computational point of view with a good level of accuracy, and requiring daily meteorological data. The formula used is as follows:
E T P = 0.0023 · T m + 17.8 · T m a x T m i n · 0.5 · R s e
where:
  • Tm = average air temperature (°C)
  • Tmax = daily maximum temperature (°C)
  • Tmin = daily minimum temperature (°C)
  • Rse = daily extraterrestrial solar radiation (mm/d)
In the present formula, the Rse values are expressed in equivalent evaporated water height (mm/d) and considered constant over the years, depending solely on the geographical location of the study site. Consequently, to prevent overestimating the actual evapotranspiration (ETR) of trees, particularly during specific periods of the year, a reduction coefficient of 0.5 [34] has been implemented to estimate the fraction of water “readily” available to the roots, considering that the water available for evapotranspiration diminishes significantly before reaching the wilting point, as a consequence of the increased strength of the bond between the water and the soil matrix, resulting in water stress for the plants.

2.4.2. Heat Reduction Potential (Q) Calculation

The heat reduction potential (Q) has been estimated as the amount of heat used for evaporating water [35]. As water evaporates and turns into steam, it absorbs heat from its surroundings. Hence, the energy value equation can be formulated as follows:
Q w = m w · h f g A
where the latent heat of water evaporation and the rate of water consumption by the plant are represented by the following equations:
h f g = 2502 2.386   T a
m w = E T R · 10 3 · ρ w · A 24 × 3600
where:
  • Qw = air heat reduction due to water consumption W/m2
  • ETR = amount of water consumed by the plant (mm/day)
  • A = canopy surface area (m2)
  • mw = rate of water consumption by the plant (kg/second)
  • hfg = latent heat of evaporation of water (J/kg)
  • Ta = average temperature (°C)
  • ρw = water density (kg/m3)

2.5. Radiative Forcing and CO2 Compensated by the CIRIAF Model

Radiative Forcing (RF) is a scientific concept used by the Intergovernmental Panel for Climate Change (IPCC) to quantify (in Watts/meters) and compare the altering effect that natural and anthropogenic factors have on the Earth’s energy balance [36]. The IPCC defines radiative forcing RF as “the change in net irradiance at the tropopause allowing for stratospheric temperatures to readjust to radiative equilibrium”. Hence, positive radiative forcing (RF) indicates an imbalance, with Earth receiving more incoming energy than it can radiate back to space, resulting in a rise in the global mean temperature. Accordingly, global warming can be seen as an outcome of positive radiative forcing, influenced by alterations in greenhouse gas concentrations in the atmosphere. Therefore, the change in radiative forcing due to a perturbation to the atmospheric CO2 concentration (RFCO2) can be calculated by the following well-known relation [37,38]:
R F CO 2 = 5.35 · ln C 0 + Δ C C 0
RFCO2 when ΔC is 1 ppm and C0 is the actual atmospheric CO2 concentration is known as the current global mean radiative efficiency (αCO2), expressed in W/m2 ppm. The CO2 global mean radiative efficiency can be obtained in terms of W/m2 kg by using the following equation:
k CO 2 = α CO 2 · ε a i r · 10 6 ε CO 2 · M a t m
where εCO2 is the molecular weight of CO2 (44.01 kg/kmol), εair is the molecular weight of air (28.97 kg/kmol), and Matm is the mass of the atmosphere (5.14 × 10¹⁸ kg). For the actual CO2 concentration of about 420 ppm, kCO2 is equal to 1.63 × 10⁻¹⁵ W/m2 kg.
The simplest method to relate evapotranspiration to the RF following a constant in time change of CO2 concentration is to consider that a constant amount of the CO2 emission (defined airborne fraction AF) is instantaneously removed by the Earth’s oceanic and terrestrial CO2 sinks [39]. Specifically, the airborne fraction is defined as the ratio of the annual increase in atmospheric CO2 to total emissions from anthropogenic sources [39]; observations show that AF has remained roughly constant over the last decades and is equal to about 50%. Under these assumptions, the emission of 1 t of CO2 into the atmosphere produces an average increase in RF of 1630 W, which means that the ΔRFCO2 = 1.63 kW/t of CO2.
On the other hand, the reduction of radiative forcing by an amount of 1.63 kW can be interpreted as the effect of a decrease in atmospheric CO2 concentration equivalent to 1 tonne.
Therefore, after determining the average heat power (kW) absorbed by evapotranspiration annually for each species, it is possible to calculate the corresponding CO2 compensation value (in tonnes) by dividing it by the site-specific ΔRFCO2 coefficient. Generally, both RF and ΔRFCO2 depend on various parameters, including the latitude of the site, ground exposure (such as tilt and the azimuth angle of the soil surface), surface albedo, and the climatic conditions of the site. CIRIAF has developed a model to evaluate the RF value in a specific location to directly convert the surface temperature change produced by evapotranspiration into the corresponding CO2 offset. In the two case-study cities, the value of ΔRFCO2 obtained by the CIRIAF model is equal to 1502 W/t of CO2 in Perugia and 1470 W/t of CO2 in Bologna.
Hereafter, CO2 storage will be abbreviated as CO2s, and CO2 compensated as CO2c.

3. Results

3.1. Heat Reduction Effect and Stored CO2 Results

The following section discloses the study case results of the trees’ CO2 storage and cooling effect, as calculated with the Clivut web app.
Table 1 shows the woody species in Chico Mendez Park, considering only the species with mean CO2s > 0.2 t. The number of plants with a minimum value of 0.2 t of CO2s in the present park corresponds to 592, represented by 27 species, with an estimated average age of 22 years, an average cooling effect (Q/day) per year of 664 Watts, and a calculated average CO2s at the time of the census of 0.67 t.
The most common plants are Quercus ilex (137 plants), Populus nigra (115 plants), and Cupressus arizonica (79 plants), while the tree species with the highest average CO2 storage were Salix viminalis (3.19 t) and Pinus pinea (1.71 t). For these two species, the average mean age was 41 and 33 years, respectively (a value significantly higher than those of all the other plants).
The age distribution around the mean value expressed by the standard deviation for each species may allow us to evaluate if the individuals were planted in a restricted period (if the trees have the same age) or during a long period of time. In Chico Mendez Park, the Pinus pinea, Robinia pseudoacacia, and Ulmus laevis species show the lowest planting age distributions, manifesting the same age characteristics as their peers. On the other hand, Salix viminalis, Quercus petraea, Populus nigra, and Cupressus arizonica evidence highest distribution values, suggesting their planting phases were realized during a period of several years.
Table 2 reports the woody species in Pescaia Park in Perugia with CO2 storage higher than 0.2 t. The selected plants, represented by 19 species, numbered 413 with an average age of 20 and CO2s of 0.7 t.
Regarding the age distribution around the mean value in Pescaia Park, the Cupressaceae family and Quercus ilex species show the lowest planting age distributions, manifesting the same age characteristics as their peers. Olea europaea and Acer saccharum species evidence the highest distribution values, considering that many trees are present as very young specimens due to recent regeneration interventions in the park.
In 11 September Park (Table 3), plants with CO2s > 0.2 t numbered 70 and are represented by 24 species with an average age of 28 years and average CO2s of 1.23 t. Only two species (Tilia cordata and Ulmus carpinifolia) show the lowest standard deviation for the planting age values.
Table 4 presents the 103 plants of Villa Ghigi Park with CO2s > 0.2 t. They are represented by 23 species with an average age of 44 years and CO2s of 1.66 t. The age distribution around the mean value expressed by the standard deviation for each species showed that in Villa Ghigi Park, Tilia cordata is one of the species planted during a small range of years, especially considering that in this area, an entire alley consists of this species distributed around the main building.
In Table 5, the CO2 storage and compensated values of all the trees present in each park, including trees with mean CO2s < 0.2 t, have been reported. In Chico Mendez Park, a total of 1145 plants from 50 different species were recorded, with an estimated average age of about 17 years, an average cooling effect (Q/day) per year of 515 Watts, and a calculated average CO2s at the census time of 0.4 t. In Pescaia Park, the total number of plants corresponded to 450 trees, represented by 31 different species, with an estimated average age of 17 years, an average cooling effect (Q/day) per year of 592 Watts, and a calculated average CO2s at the census time of 0.48 t. In Bologna, the 11 September Park presented 106 plants belonging to 35 different species (average age = 21 years; average CO2s = 0.85), denoting the high tree biodiversity. In Villa Ghigi Park, 144 trees were present with a mean age of about 31 years. Moreover, Table 5 also considers the ratio between the mean Leaf Area and DBH when considering all the trees of each park, with both parameters deriving from the Clivut web app’s dataset, to observe and highlight the relationship between the tree’s crown dimensions and the tree volume estimated on the basis of DBH.
In addition, the cited mean values highlighted the relationships between CO2 compensated—Leaf Area and CO2s—DBH, considering that high tree crown dimensions induce high ETP volumes and consequently elevate CO2 compensated values. The highest leaf area: DBH ratio recorded in 11 September Park determined low differences between the CO2c and CO2s values, while the lowest ratio (5.87) recorded in Pescaia Park was in accordance with the high differences between compensated and storage CO2.

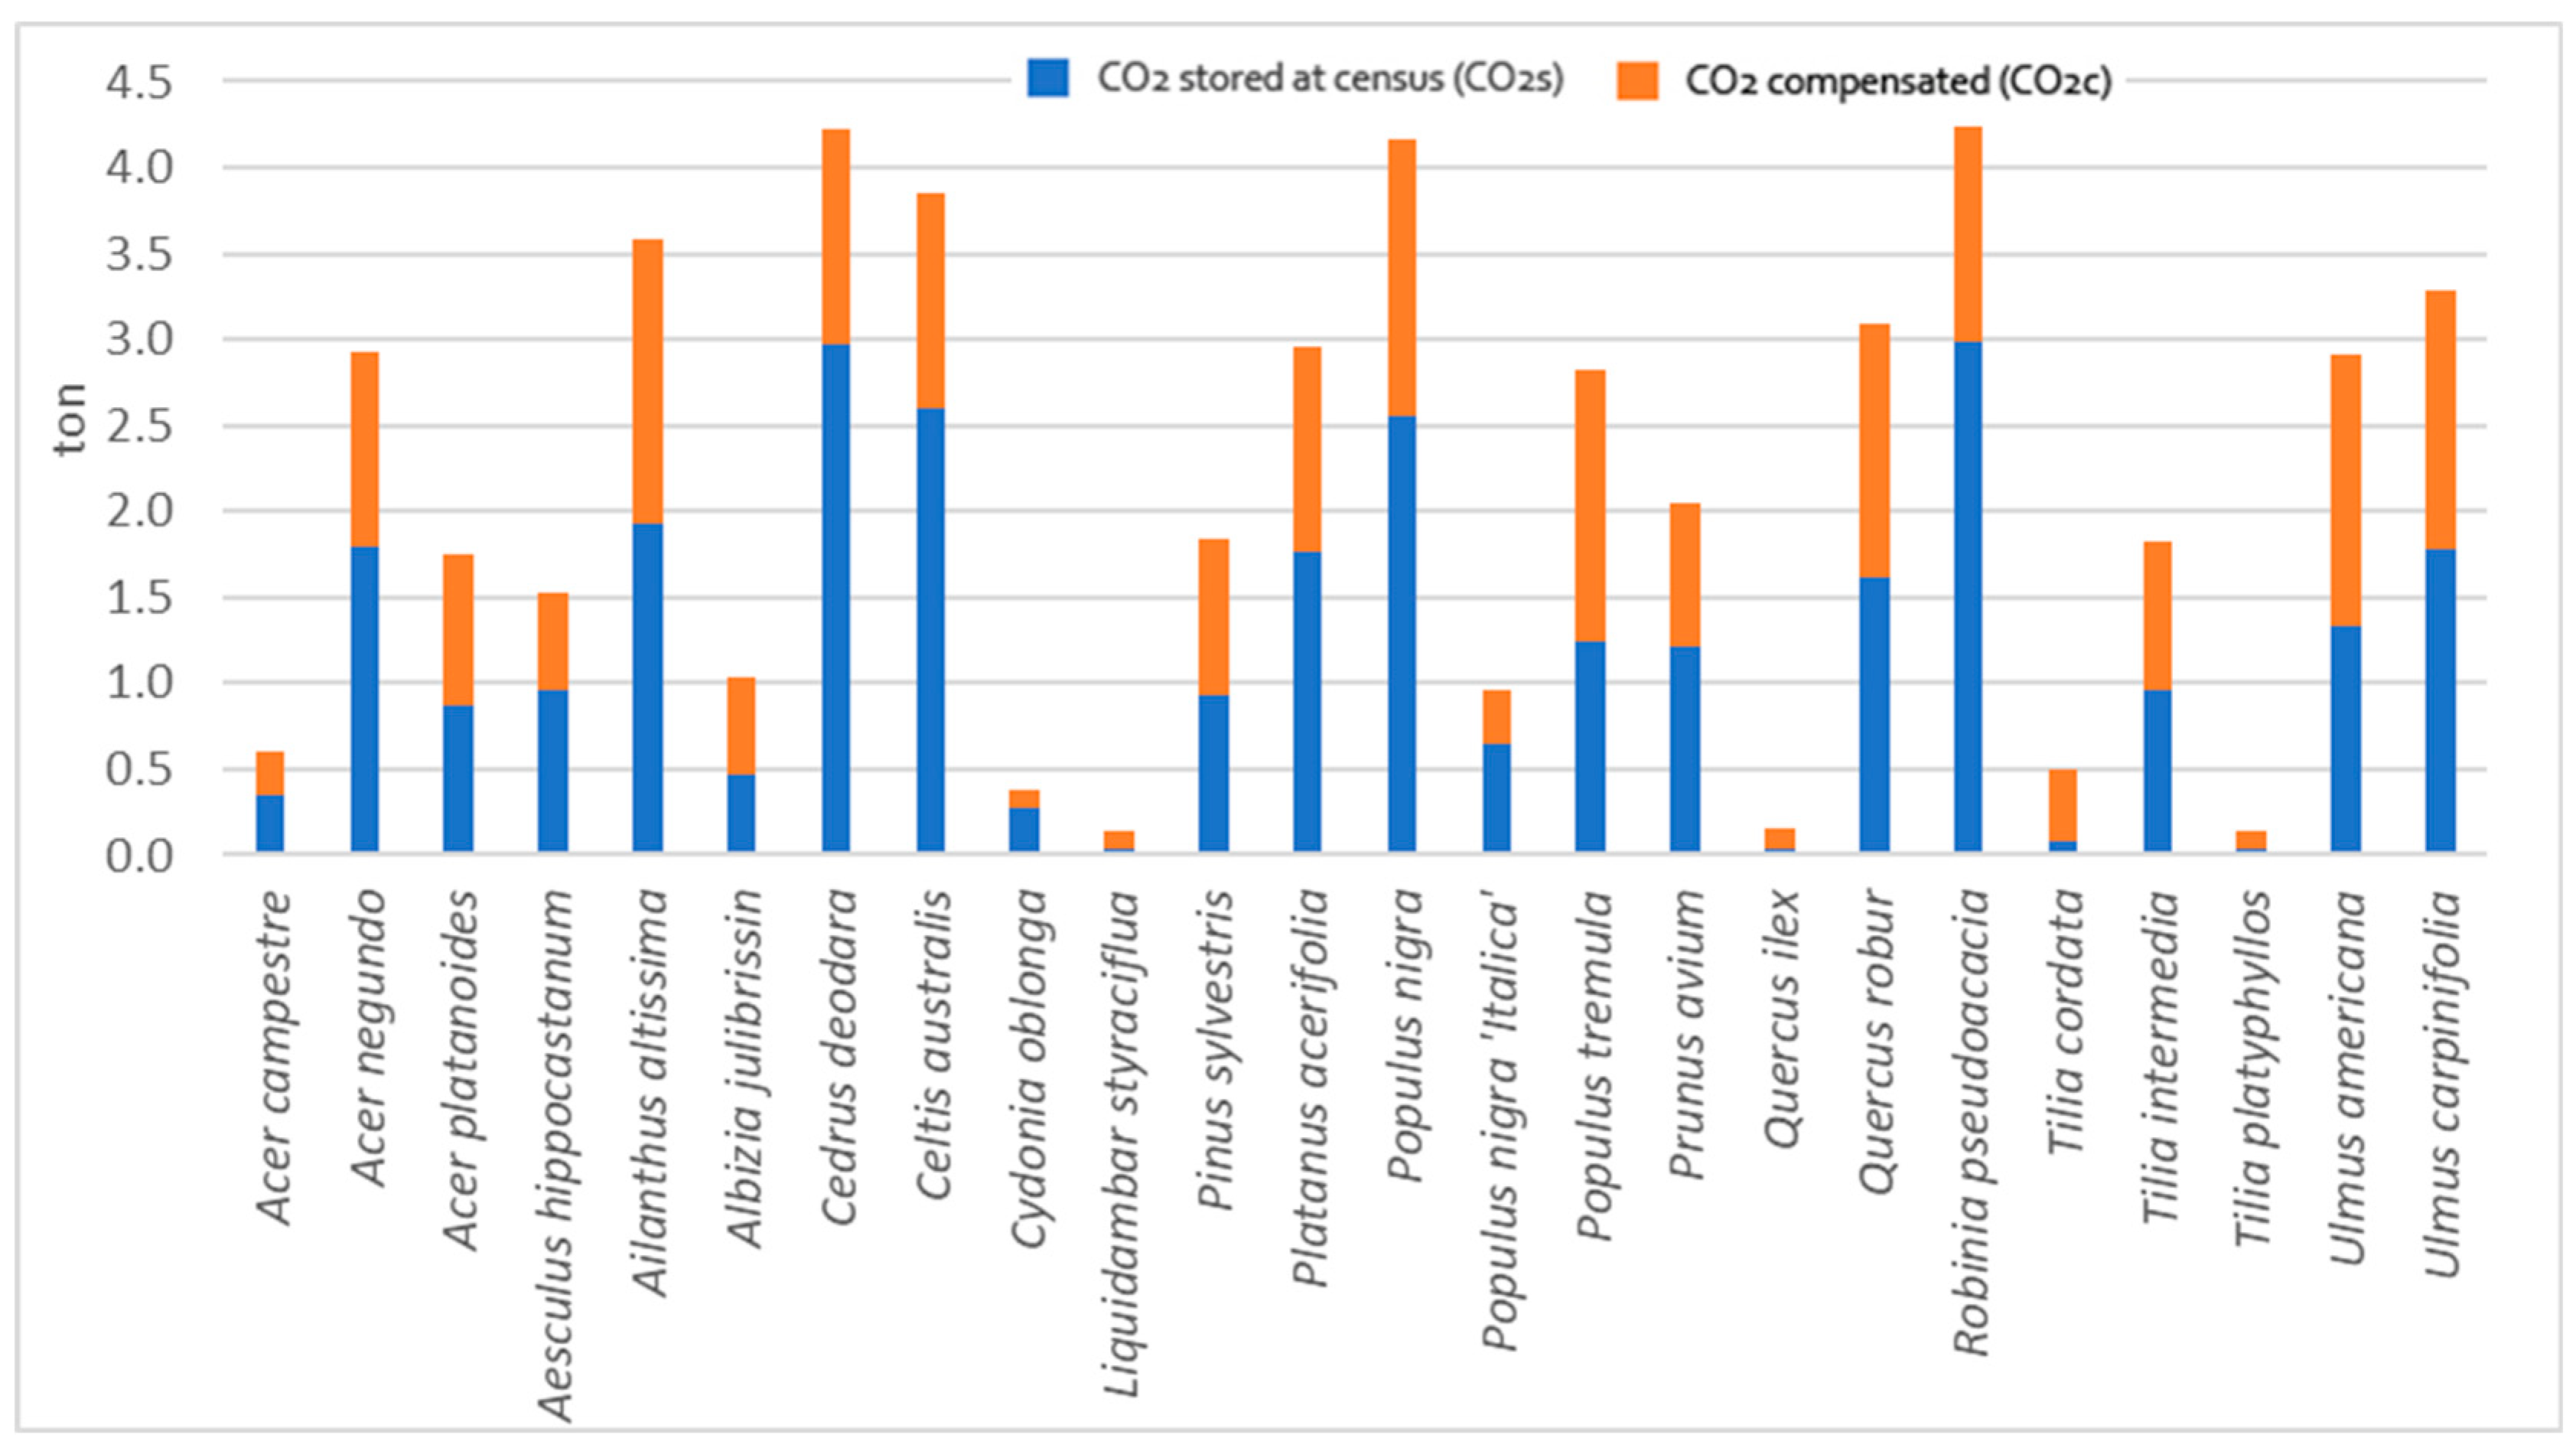
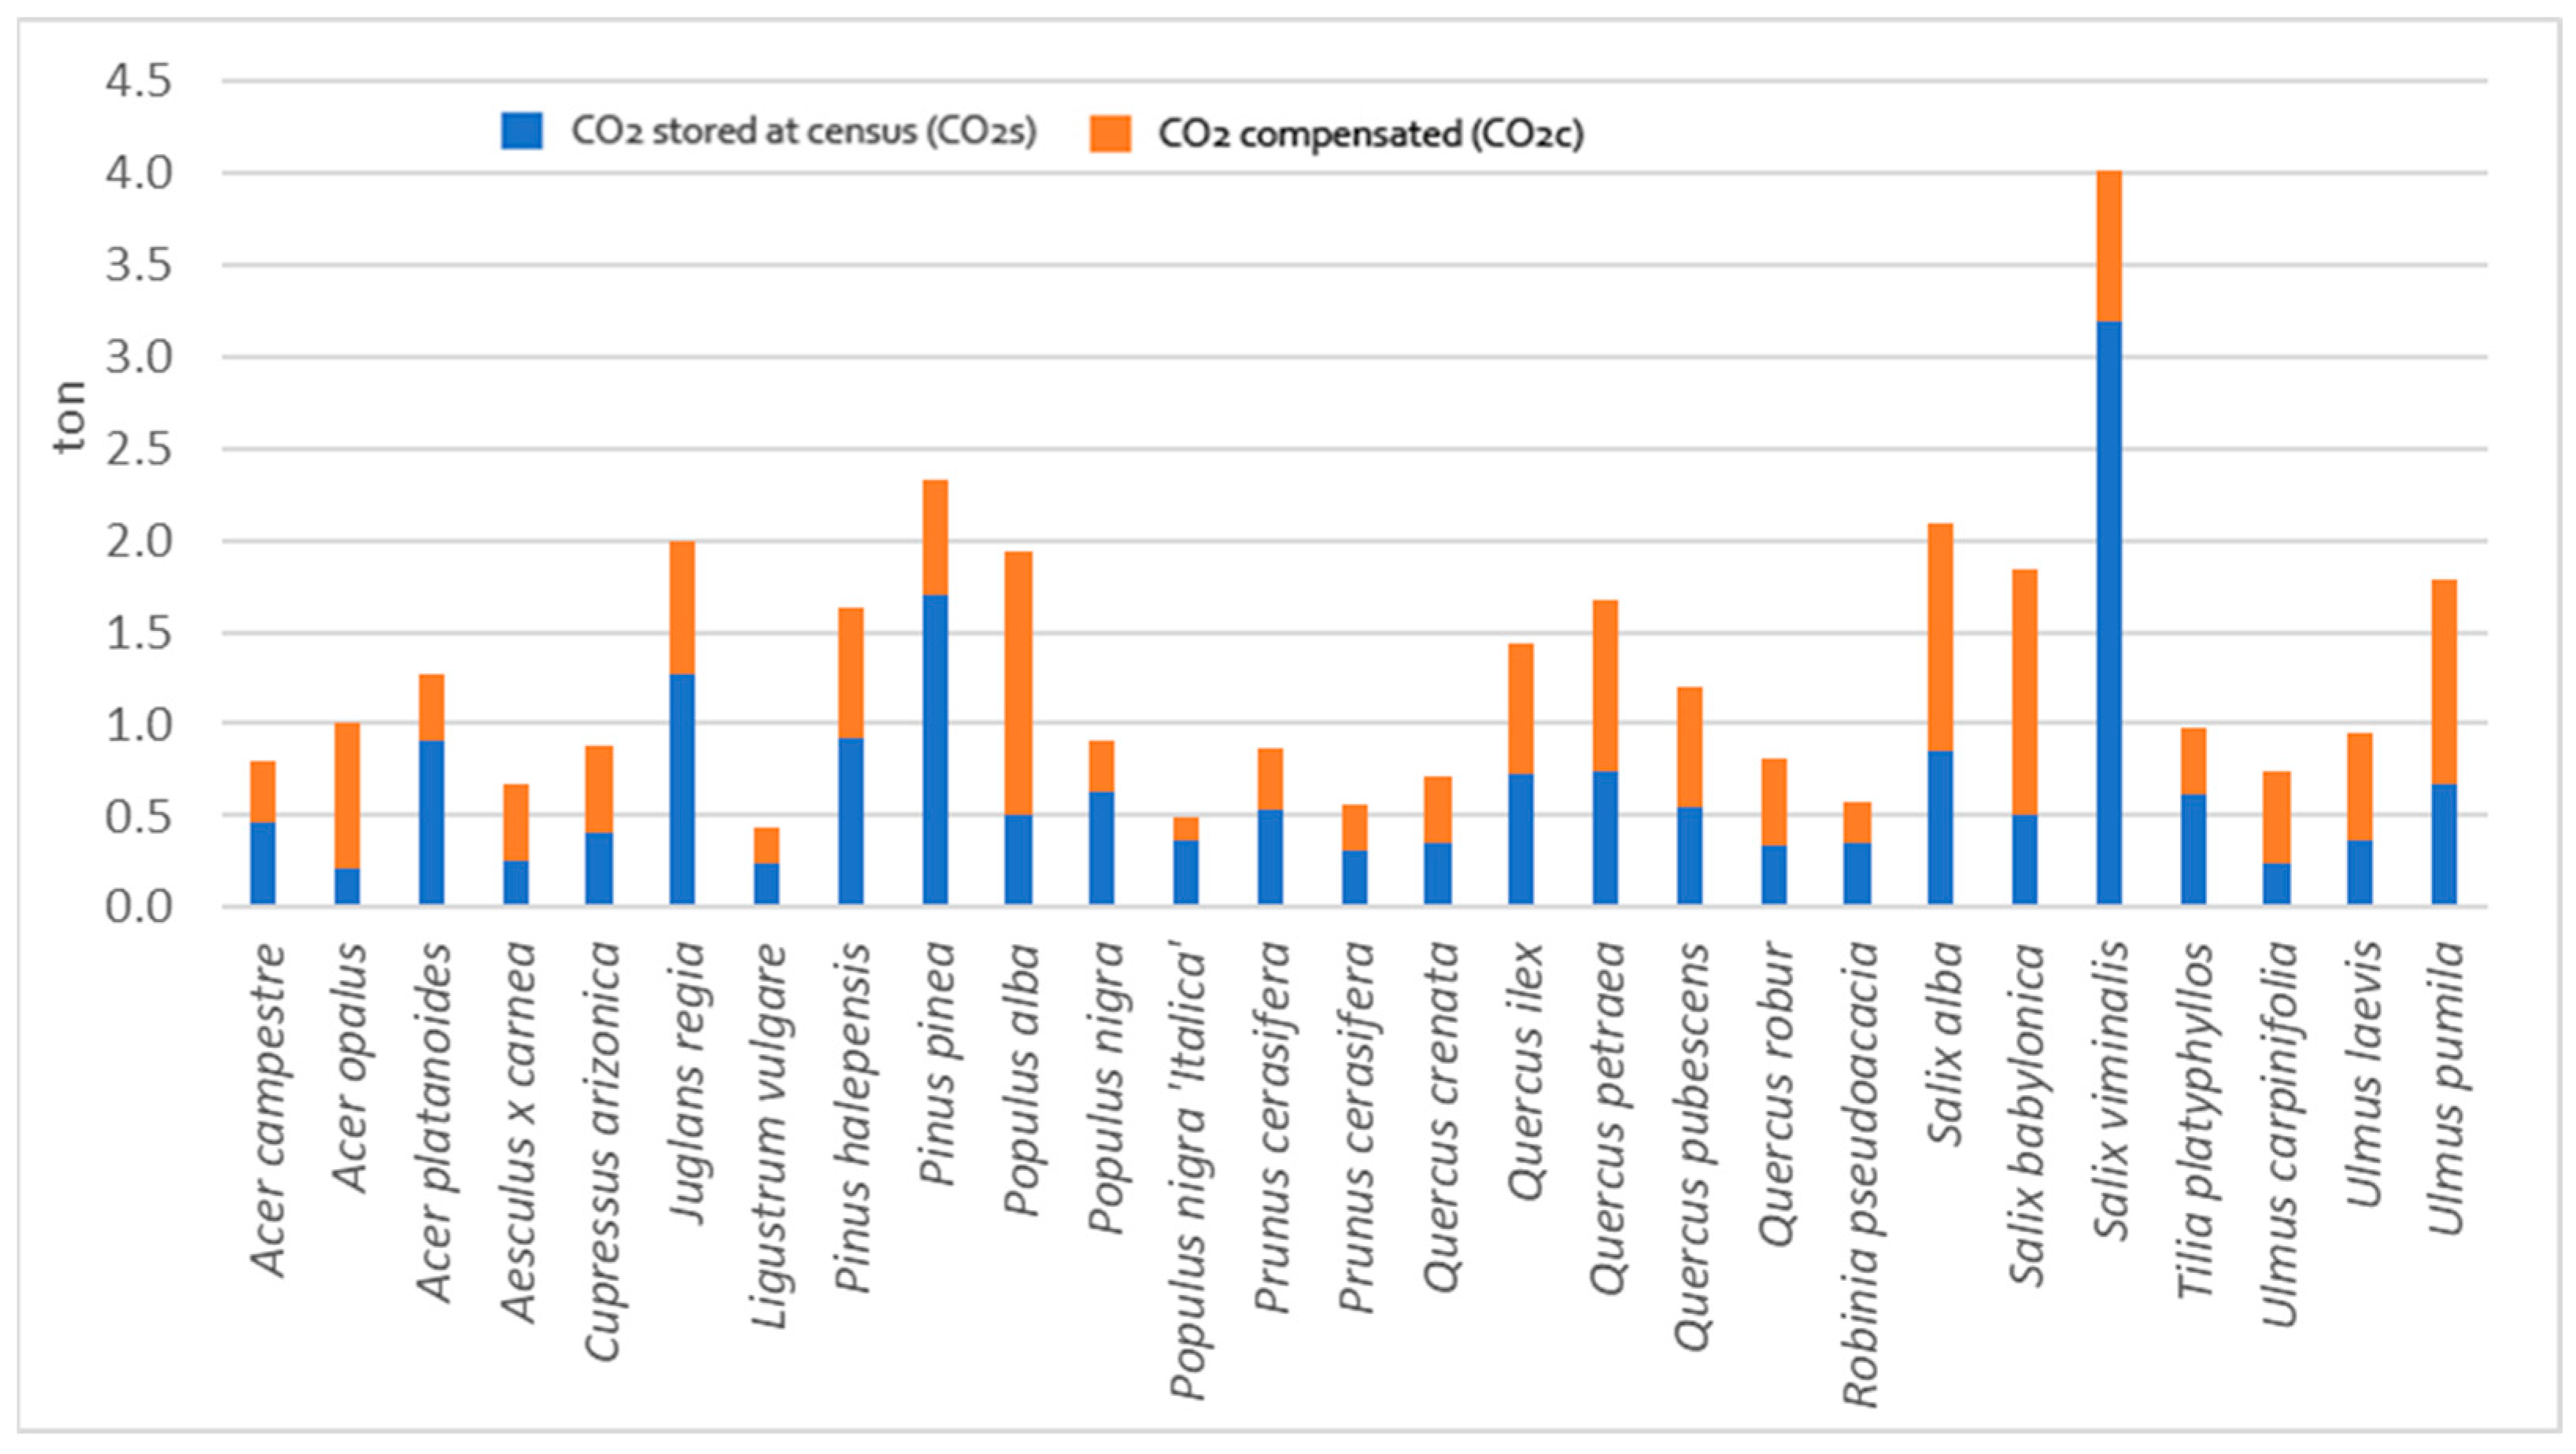
3.2. Compensated CO2 and Stored CO2 Comparison

Estimates of CO2 storage (>0.2 t) and compensated CO2 for woody plant species in all the studied parks are shown in Figure 3, Figure 4, Figure 5 and Figure 6.
Figure 3, referring to the Chico Mendez Park results, shows that Salix viminalis exhibits the highest average CO2 storage compared with CO2 compensated, suggesting that the trees of this species showed a lower growing rate of the crown than DBH. On the other hand, Populus alba demonstrated notably divergent results and presented a CO2 compensation value more than proportional to CO2 storage; this suggests a prevalence of large-crowned individuals within this species for that park. In Pescaia Park (Figure 4), P. pinea showed a very high CO2 stored value that was more than proportional to compensated CO2, suggesting that the trees of this species presented limited crown dimensions compared to DBH values. In contrast, Fraxinus ornus showed the opposite dendrometric characteristics.
In 11 September 2001 Park (Figure 5), Cedrus deodara, Celtis australis, Populus nigra, and Robinia pseudoacacia were the species with the highest contributions of CO2s. While Acer campestre, Cydonia oblonga, Quercus ilex, Tilia cordata, and T. platyphillos showed the lowest values due to their young ages. In Figure 6, two Villa Ghigi Park species (Acer spp. and Quercus pubescens) present compensated CO2 values less than proportional to the CO2s, suggesting the presence of old trees with narrow crowns.

4. Discussion

The integration of models developed within the Clivut project, together with the CIRIAF models deploying the Radiative Forcing concept, allowed a comprehensive estimation of the environmental potential of the four parks analyzed.
In each park, both the potential CO2 storage (CO2s) of the trees, depending on their size and species-related wood characteristics, and their cooling potential (CO2 compensated or CO2c), ascribable to the energy absorption from the environment (Q), were calculated. In all the parks studied, the CO2c values resulting from plant evapotranspiration processes are noteworthy and substantial enough to be compared to those obtained from the conventional calculation of CO2s. A more detailed analysis of the performance recorded in each park allowed us to evidence the morphological parameters, mainly related to the CO2c values, crown dimensions, and transparency that concurred with leaf area estimation.
Indeed, tree LA was shown to be one of the main components contributing to CO2c, considering that a large foliage surface induces the extraction of high volumes of water from the ground and, therefore, the emission of a high quantity of water vapor into the atmosphere (high values of evapotranspiration). A lower LA/DBH ratio in trees determines a significant difference between CO2s and CO2c values due to the reduced ETP contribution. Thus, the dendrometric relationship between crown and DBH growth was confirmed to be a key parameter for CO2 compensation estimation and not only for CO2 storage accounts. Moreover, the differences in CO2 compensated/CO2 storage ratios observed among the parks can be attributed mainly to the variations in species composition, tree age, natural crown shape, and crown dimensions. The tree species composition assessment showed that 35% of the total is composed of C. sempervirens, C. arizonica, P. pinea, and P. pinaster, which are characterized by needle-shaped leaves (with a small gas-exchange surface) or narrow crowns. In the other parks in the case study, the percentage of coniferous species decreases to 15% for Chico Mendez Park, 6% for 11 September Park, and 8% for Villa Ghigi Park. Furthermore, considering the extremely variable performances that characterize trees of different ages, this aspect needs to be taken into account in designing new green spaces and managing existing ones. New parks present lower CO2s and reduced evapotranspiration performances. In addition, old parks show lower CO2s and high ETP performances. Hence, newly planted or ancient individuals have suboptimal performance compared to parks with both young and adult trees, highlighting the importance of having unevenly aged trees simultaneously to optimizing the environmental performances over the medium- to long-term. Additionally, being related to the tree size [40,41] and the designed space available for their growth [20,42,43], the pruning typology performed by the administration may influence their ecosystem services performance [21]. For example, extraordinary pruning with the removal of more than 50% of the crown may decrease the carbon stored by trees, unbalance tree growth, and reduce the LA. Moreover, severe pruning causes an increased risk of wood decay in adult trees [44]. Therefore, the Clivut project proposes, as good practice, reducing the pruning intervals, limiting the wood asportation to a maximum of 25% of the crown, and absolutely avoiding cutting branches with diameters greater than 15 cm. According to the LIFE Clivut results [21], with the same management conditions, the best-performing tree species individuated were the Cedrus spp. and some species of the Pinus genera for conifers and Celtis australis, Ulmus spp., Tilia spp., Quercus ilex, and Populus spp. among the broadleaved species. From this point of view, the robustness of the statistical models implemented in the web app can be improved by further census campaigns, adding new tree data, updating existing data, and engaging municipalities from other countries. Furthermore, the application range of the app can be extended by including new plant species from different climates. Moreover, the transferability of the web app can be improved by enlarging the equations’ validity range for different climatic areas.

5. Conclusions

In conclusion, evapotranspiration has been shown to be a relevant part of the tree’s cooling effect on the surrounding area and actively absorbs heat from the environment. It also contributes to the overall energy balance and can be translated into CO2 compensation to effectively align with CO2 storage capacity. The combined assessment of CO2s and CO2c permits us to optimize the choice of species to be used within the green infrastructure of cities, with a more conscious view of their potential ES. It also represents a valuable addition to the Clivut web app as a tool to improve citizen and public administration awareness of green infrastructure mitigation and as a practical decision-making aid to select the best-performing tree species from an ES point of view. Moreover, in addition to providing a method of quantifying CO2 reduction by storage and by compensation through evapotranspiration, this study also highlights how this value could vary among species, the tree’s development stages (growth phases), and their management techniques (pruning intervals and intensity).
Regardless, the ratio between CO2s and CO2c may be the object of future studies. In addition, further research could continue to explore the CO2 compensation species-specific and intra-specific variability. In addition, considering different classes of tree ages could help to identify the variations among tree species in future research on urban green areas. In conclusion, the highest reduction of the CO2s component in the last part of the tree’s life and also the contemporary increase in the CO2c component, due to tree crown enlargement, must be considered as criteria in the evaluation process for the renewal of senescent trees in the park.

Author Contributions

Conceptualization, M.F. (Marco Fornaciari); Methodology, M.F. (Mirko Filipponi), B.C. and A.D.G.; Software, M.F. (Mirko Filipponi); Validation, F.R.; Formal analysis, B.C. and A.D.G.; Investigation, F.R. and C.P.; Resources, L.R.; Data curation, L.R.; Writing—original draft, D.M., M.F. (Mirko Filipponi) and F.O.; Writing—review & editing, F.O. All authors have read and agreed to the published version of the manuscript.

Funding

This study was funded by LIFE Climate Governance and Information project application, LIFE18 GIC/IT/001217.

Institutional Review Board Statement

Not applicable.

Informed Consent Statement

Not applicable.

Data Availability Statement

The raw data supporting the conclusions of this article will be made available by the authors on request.

Acknowledgments

We would thank Perugia and Bologna municipality administrations for their contribution to the tree census activities and Enzo Scudellari for the realization of the Clivut-Treedb web-app.

Conflicts of Interest

The authors declare no conflict of interest.

References

  1. Baglivo, C.; Albanese, P.M.; Congedo, P.M. Relationship between Shape and Energy Performance of Buildings under Long-Term Climate Change. J. Build. Eng. 2024, 84, 108544. [Google Scholar] [CrossRef]
  2. Yue, X.L.; Gao, Q.X. Contributions of Natural Systems and Human Activity to Greenhouse Gas Emissions. Adv. Clim. Chang. Res. 2018, 9, 243–252. [Google Scholar] [CrossRef]
  3. Carter, J.G.; Cavan, G.; Connelly, A.; Guy, S.; Handley, J.; Kazmierczak, A. Climate Change and the City: Building Capacity for Urban Adaptation. Prog. Plann. 2015, 95, 1–66. [Google Scholar] [CrossRef]
  4. Kabisch, N.; Korn, H.; Stadler, J.; Bonn, A. Nature-Based Solutions to Climate Change Adaptation in Urban Areas. Linkages between Science, Policy and Practice; Springer Nature: New York, NY, USA, 2017; ISBN 9783319537504. [Google Scholar]
  5. European Commission. The European Green Deal; European Commission: Brussels, Belgium, 2019. [Google Scholar]
  6. Gill, S.E.; Handley, J.F.; Ennos, A.R.; Pauleit, S. Adapting Cities for Climate Change: The Role of the Green Infrastructure LK. Built Environ. 2007, 33, 115–132. Available online: https://Slc.on.Worldcat.Org/Oclc/123729317 (accessed on 26 September 2019). [CrossRef]
  7. Nowak, D.J.; Dwyer, J.F. Understanding the Benefits and Costs of Urban Forest Ecosystems. In Urban and Community Forestry in the Northeast; Springer: Dordrecht, The Netherlands, 2010; pp. 11–25. [Google Scholar] [CrossRef]
  8. Ning, T.; Wang, J.; Elgered, G.; Dick, G.; Wickert, J.; Bradke, M.; Sommer, M.; Querel, R.; Smale, D. The Uncertainty of the Atmospheric Integrated Water Vapour Estimated from GNSS Observations. Atmos. Meas. Tech. 2016, 9, 79–92. [Google Scholar] [CrossRef]
  9. Carrus, G.; Scopelliti, M.; Lafortezza, R.; Colangelo, G.; Ferrini, F.; Salbitano, F.; Agrimi, M.; Portoghesi, L.; Semenzato, P.; Sanesi, G. Go Greener, Feel Better? The Positive Effects of Biodiversity on the Well-Being of Individuals Visiting Urban and Peri-Urban Green Areas. Landsc. Urban Plan. 2015, 134, 221–228. [Google Scholar] [CrossRef]
  10. Shashua-Bar, L.; Hoffman, M.E. Vegetation as a Climatic Component in the Design of an Urban Street. Energy Build. 2000, 31, 221–235. [Google Scholar] [CrossRef]
  11. Cao, X.; Onishi, A.; Chen, J.; Imura, H. Quantifying the Cool Island Intensity of Urban Parks Using ASTER and IKONOS Data. Landsc. Urban Plan. 2010, 96, 224–231. [Google Scholar] [CrossRef]
  12. Nowak, D.J.; Crane, D.E.; Stevens, J.C. Air Pollution Removal by Urban Trees and Shrubs in the United States. Urban For. Urban Green. 2006, 4, 115–123. [Google Scholar] [CrossRef]
  13. Nowak, D.J.; Greenfield, E.J.; Hoehn, R.E.; Lapoint, E. Carbon Storage and Sequestration by Trees in Urban and Community Areas of the United States. Environ. Pollut. 2013, 178, 229–236. [Google Scholar] [CrossRef]
  14. Massetti, L.; Petralli, M.; Brandani, G.; Napoli, M.; Ferrini, F.; Fini, A.; Pearlmutter, D.; Orlandini, S.; Giuntoli, A. Modelling the Effect of Urban Design on Thermal Comfort and Air Quality: The SMARTUrban Project. Build. Simul. 2019, 12, 169–175. [Google Scholar] [CrossRef]
  15. Lin, B.S.; Lin, Y.J. Cooling Effect of Shade Trees with Different Characteristics in a Subtropical Urban Park. HortScience 2010, 45, 83–86. [Google Scholar] [CrossRef]
  16. Zardo, L.; Geneletti, D.; Pérez-Soba, M.; Van Eupen, M. Estimating the Cooling Capacity of Green Infrastructures to Support Urban Planning. Ecosyst. Serv. 2017, 26, 225–235. [Google Scholar] [CrossRef]
  17. Orlandi, F.; Fornaciari, M.; Ranfa, A.; Proietti, C.; Ruga, L.; Meloni, G.; Burnelli, M.; Ventura, F. LIFE-CLIVUT, Ecosystem Benefits of Urban Green Areas: A Pilot Case Study in Perugia (Italy). iFor. Biogeosci. For. 2022, 15, 133–140. [Google Scholar] [CrossRef]
  18. Orlandi, F.; Ranfa, A.; Proietti, C.; Ruga, L.; Ventura, F.; Fornaciari, M. Dynamic Estimates of Tree Carbon Storage and Shade in Mediterranean Urban Areas. Int. For. Rev. 2022, 24, 225–239. [Google Scholar] [CrossRef]
  19. Cvejić, R.; Eler, K.; Pintar, M.; Železnikar, Š.; Haase, D.; Kabisch, N.; Strohbach, M. Green Surge—A Typology of Urban Green Spaces, Eco-System Services Provisioning Services and Demands. 2015. Available online: https://assets.centralparknyc.org/pdfs/institute/p2p-upelp/1.004_Greensurge_A+Typology+of+Urban+Green+Spaces.pdf (accessed on 18 April 2024).
  20. Muscas, D.; Fornaciari, M.; Proietti, C.; Ruga, L.; Orlandi, F. Tree Growth Rate under Urban Limiting Conditions. Eur. J. For. Res. 2023, 142, 1423–1437. [Google Scholar] [CrossRef]
  21. Muscas, D.; Orlandi, F.; Petrucci, R.; Proietti, C.; Ruga, L.; Fornaciari, M. Effects of Urban Tree Pruning on Ecosystem Services Performance. Trees For. People J. 2024, 15, 100503. [Google Scholar] [CrossRef]
  22. Zianis, D.; Muukkonen, P.; Mäkipää, R.; Mencuccini, M. Biomass and Stem Volume Equations for Tree Species in Europe. In Silva Fennica Monographs; The Finnish Society of Forest Science, The Finnish Forest Research Institute: Helsinki, Finland, 2005; ISBN 9514019830. [Google Scholar]
  23. McPherson, E.G.; van Doorn, N.; Peper, P.J. Urban Tree Database and Allometric Equations; General Technical Report PSW-GTR-253; US Department of Agriculture, Forest Service, Pacific Southwest Research Station: Albany, CA, USA, 2016; 86p.
  24. Nowak, D.J. Air Pollution Removal by Chicago’s Urban Forest. In Chicago’s Urban Forest Ecosystem: Results of the Chicago Urban Forest Climate Project; General Technical Report NE-186; United States Department of Agriculture: Washington, DC, USA, 1994; Volume 201. [Google Scholar]
  25. Nowak, D.; Crane, D. The Urban Forest Effects (UFORE) Model: Quantifying Urban Forest Structure and Functions. In Integrated Tools for Natural Resources Inventories in the 21st Century; General Technical Report NC-212; U.S. Department of Agriculture, Forest Service, North Central Research Station: St. Paul, MN, USA, 1998; Volume 714–720. [Google Scholar]
  26. Nowak, D.J. Understanding i-Tree: Summary of Programs and Methods; General Technical Report NRS-200; U.S. Department of Agriculture, Forest Service, Northern Research Station: Madison, WI, USA, 2020; 100p. [CrossRef]
  27. Bianchi, M. Il Progetto “Ri.Selv.Italia”: Programma Comune Di Ricerca Sulla Selvicoltura in Italia. Forest 2004, 1, 109–111. [Google Scholar] [CrossRef]
  28. Secco, L.; Agnoloni, S.; Cantiani, P.; De Meo, I.; Ferretti, F.; Pettenella, D. A Methodology to Integrate SFM Standards on Forest Cultural Heritage into Meso-Scale Forest Planning: Preliminary Results of the Ri.Selv.Italia 4.2 Research Project. In Proceedings of the International Conference on Cultural Heritage and Sustainable Forest Management: The Role of Traditional Knowledge, Florence, Italy, 8–11 June 2006; Parrotta, J., Agnoletti, M., Johann, E., Eds.; 2006; Volume 2, ISBN 9788392239642. Available online: https://www.research.unipd.it/handle/11577/1557801 (accessed on 18 April 2024).
  29. Tritton, L.M.; Hornbeck, J.W. Biomass Equations for Major Tree Species of the Northeast; U.S. Department of Agriculture, Forest Service, Northeastern Forest Experimental Station: Broomall, PA, USA, 1982; 46p. [CrossRef]
  30. Sinacore, K.; Hall, J.S.; Potvin, C.; Royo, A.A.; Ducey, M.J.; Ashton, M.S. Unearthing the Hidden World of Roots: Root Biomass and Architecture Differ among Species within the Same Guild. PLoS ONE 2017, 12, e0185934. [Google Scholar] [CrossRef]
  31. Lamlom, S.H.; Savidge, R.A. A Reassessment of Carbon Content in Wood: Variation within and between 41 North American Species. Biomass Bioenergy 2003, 25, 381–388. [Google Scholar] [CrossRef]
  32. Dekić, J.P.; Mitković, P.B.; Dinic Branković, M.M.; Igić, M.Z.; Dekić, P.S.; Mitković, M.P. The Study of Effects of Greenery on Temperature Reduction in Urban Areas. Therm. Sci. 2018, 2018, 988–1000. [Google Scholar] [CrossRef]
  33. Hargreaves, G.H.; Samani, Z.A. Reference Crop Evapotranspiration from Temperature. Appl. Eng. Agric. 1985, 1, 96–99. [Google Scholar] [CrossRef]
  34. Allen, R.G.; Pereira, L.S.; Raes, D.; Smith, M. Crop Evapotranspiration—Guidelines for Computing Crop Water Requirements. Available online: http://www.fao.org/docrep/x0490e/x0490e00.htm (accessed on 26 September 2019).
  35. Dussadee, N.; Ramaraj, R.; Sutassanamarlee, N. Effect of Plant Shading and Water Consumption on Heat Reduction of Ambient Air. Chiang Mai J. Sci. 2018, 45, 188–197. [Google Scholar]
  36. Houghton, J.T.; Ding, Y.; Griggs, D.J.; Noguer, M.; van der Linden, P.J.; Dai, X.; Maskell, K.; Johnson, C.A. Climate Change 2001: The Scientific Basis. Contribution of Working Group I to the Third Assessment Report of the Intergovernmental Panel on Climate Change; Cambridge University Press: Cambridge, UK, 2001; pp. 16–17. ISBN 0521 80767 0. [Google Scholar]
  37. Myhre, G.; Shindell, D.; Bréon, F.-M.F.-M.; Collins, W.; Fuglestvedt, J.; Huang, J.; Koch, D.; Lamarque, J.-F.J.-F.; Lee, D.; Mendoza, B.; et al. Anthropogenic and Natural Radiative Forcing. In Climate Change 2013—The Physical Science Basis; Cambridge University Press: Cambridge, UK, 2013; pp. 659–740. [Google Scholar]
  38. Myhre, G.; Highwood, E.J.; Shine, K.P.; Stordal, F. New Estimates of Radiative Forcing Due to Well Mixed Greenhouse Gases. Geophys. Res. Lett. 1998, 25, 2715–2718. [Google Scholar] [CrossRef]
  39. Forster, P.; Ramaswamy, V.; Artaxo, P.; Berntsen, T.; Betts, R.; Fahey, D.W.; Haywood, J.; Lean, J.; Lowe, D.C.; Myhre, G.; et al. Changes in Atmospheric Constituents and in Radiative Forcing. Climate Change 2007: The Physical Science Basis. Contribution of Working Group I to the Fourth Assessment Report of the Intergovernmental Panel on Climate Change; Cambridge University Press: Cambridge, UK; New York, NY, USA, 2007. [Google Scholar]
  40. Vanninen, P.; Mäkelä, A. Carbon Budget for Scots Pine Trees: Effects of Size, Competition and Site Fertility on Growth Allocation and Production. Tree Physiol. 2005, 25, 17–30. [Google Scholar] [CrossRef] [PubMed]
  41. Pretzsch, H.; Biber, P.; Uhl, E.; Dahlhausen, J.; Rötzer, T.; Caldentey, J.; Koike, T.; van Con, T.; Chavanne, A.; Seifert, T.; et al. Crown Size and Growing Space Requirement of Common Tree Species in Urban Centres, Parks, and Forests. Urban For. Urban Green. 2015, 14, 466–479. [Google Scholar] [CrossRef]
  42. Hynynen, J. Predicting Tree Crown Ratio for Unthinned and Thinned Scots Pine Stands. Can. J. For. Res. 1995, 25, 57–62. [Google Scholar] [CrossRef]
  43. Mäkinen, H.; Isomäki, A. Thinning Intensity and Long-Term Changes in Increment and Stem Form of Scots Pine Trees. For. Ecol. Manag. 2004, 203, 21–34. [Google Scholar] [CrossRef]
  44. Suchocka, M.; Swoczyna, T.; Kosno-Jończy, J.; Kalaji, H.M. Impact of heavy pruning on development and photosynthesis of Tilia cordata Mill. trees. PLoS ONE 2021, 16, e0256465. [Google Scholar] [CrossRef]
Figure 1. Perugia study areas: (a) Chico Mendez Park and (b) Pescaia Park.
Sustainability 16 03515 g001
Figure 2. Bologna study areas: (a) 11 September 2001 Park and (b) Villa Ghigi Park.
Sustainability 16 03515 g002
Figure 3. Estimates of CO2 stored at census (CO2s) and CO2 compensated (CO2c) by woody plant species in Chico Mendez Park.
Sustainability 16 03515 g003
Figure 4. Estimates of CO2 stored at census (CO2s) and CO2 compensated (CO2c) by woody plant species in Pescaia Park.
Sustainability 16 03515 g004
Figure 5. Estimates of CO2 stored at census (CO2s) and CO2 compensated (CO2c) by woody plant species in 11 September Park.
Sustainability 16 03515 g005
Figure 6. Estimates of CO2 stored at census (CO2s) and CO2 compensated (CO2c) by woody plant species in Villa Ghigi Park.
Sustainability 16 03515 g006
Table 1. Number of plants with mean CO2s > 0.2 t, mean age (st.dev.), cooling effect, and stored CO2 at the census of woody species in Chico Mendez Park, Perugia.
SpeciesN° PlantsMean AgeQ/Day Mean Value (W)Mean CO2 Stored at Census (t)
Acer campestre7013 (±6.28)457.900.46
Acer opalus220 (±2.35)458.390.21
Acer platanoides320 (±8.45)471.110.91
Aesculus x carnea1026 (±7.27)558.500.25
Cupressus arizonica7919 (±26.3)632.760.40
Juglans regia336 (±19.38)967.281.26
Ligustrum vulgare116267.860.24
Pinus halepensis526 (±4.47)948.210.93
Pinus pinea233 (±3.15)840.661.71
Populus alba913 (±6.46)607.000.50
Populus nigra11513 (±15.44)359.690.64
Populus nigra I‘talica’1718 (±4.02)162.230.37
Prunus cerasifera278 (±71.65)438.870.53
Quercus crenata613 (±2.52)479.010.35
Quercus ilex13718 (±6.17)956.810.72
Quercus petraea317 (±11.60)1255.510.74
Quercus pubescens1729 (±11.64)874.370.54
Quercus robur814 (±4.14)640.980.34
Robinia pseudoacacia3817 (±3.69)301.830.35
Salix alba914 (±5.31)651.450.86
Salix babylonica814 (±6.47)771.390.51
Salix viminalis1041 (±35.09)1100.233.19
Tilia platyphyllos519 (±1.81)478.150.62
Ulmus carpinifolia149 (±3.14)656.040.25
Ulmus laevis1513 (±2.24)771.370.37
Ulmus pumila316 (±0.57)1493.460.67
Total59222664.270.67
Table 2. Number of plants with mean CO2s > 0.2 t, mean age (st.dev.), cooling effect, and stored CO2 at the census of woody species in Pescaia Park, Perugia.
SpeciesN° PlantsMean AgeQ/Day Mean Value (W)Mean CO2 Stored at Census (t)
Acer opalus728 (±6.45)959.830.51
Acer rubrum419 (±6.14)863.650.66
Acer saccharum421 (±13.45)810.460.42
Aesculus hippocastanum641789.770.78
Cercis siliquastrum4011 (±6.80)426.420.29
Cupressus arizonica4113 (±1.45)464.510.32
Cupressus sempervirens4211 (±0.65)418.350.22
C. sempervirens ‘pyramidalis’2116 (±1.53)498.870.56
Ficus carica29 (±0.70)164.620.22
Fraxinus ornus1215 (±2.74)893.440.32
Hibiscus sp.6635.710.20
Olea europaea6328 (±26.42)539.661.28
Pinus pinaster434 (±1.12)1132.991.17
Pinus pinea3834 (±7.43)1285.602.67
Populus nigra I‘talica’626 (±13.31)1354.510.89
Quercus ilex6321 (±3.79)1078.371.08
Robinia pseudoacacia819 (±3.42)566.390.41
Ulmus carpinifolia4317 (±5.68)736.120.76
Ulmus pumila315 (±1.90)671.410.53
Total41320720.560.70
Table 3. Number of plants with mean CO2s > 0.2 t, mean age (st.dev.), cooling effect, and stored CO2 at the census of woody species in 11 September 2001 Park, Bologna.
SpeciesN° PlantsMean AgeQ/Day Mean Value (W)Mean CO2 Stored at Census (t)
Acer campestre312 (±7.33)343.720.35
Acer negundo431 (±2.75)1513.351.79
Acer platanoides216 (±15.75)1177.140.87
Aesculus hippocastanum444 (±4.35)765.180.96
Ailanthus altissima338 (±3.35)2203.991.93
Albizia julibrissin131765.180.46
Cedrus deodara1521691.512.97
Celtis australis1334 (±15.14)1667.562.60
Cydonia oblonga139148.150.27
Liquidambar styraciflua27 (±5.70)148.150.03
Pinus sylvestris332 (±8.43)1215.380.93
Platanus acerifolia734 (±7.32)1592.221.77
Populus nigra426 (±5.55)2147.492.55
Populus nigra I‘talica’122421.470.65
Populus tremula316 (±2.30)2122.121.24
Prunus avium3101 (±10.56)1131.741.21
Quercus ilex15168.470.03
Quercus robur1291966.951.62
Robinia pseudoacacia1351682.302.99
Tilia cordata36559.500.08
Tilia intermedia419 (±6.38)1142.470.96
Tilia platyphyllos24 (±1.35)148.150.04
Ulmus americana1222108.501.34
Ulmus carpinifolia2242008.121.79
Total70281201.621.23
Table 4. Number of plants with mean CO2s > 0.2 t, mean age (st.dev.), cooling effect, and stored CO2 at census of woody species in Villa Ghigi Park, Bologna.
SpeciesN° PlantsMean AgeQ/Day Mean Value (W)Mean CO2 Stored at Census (t)
Acer campestre731 (±15.34)409.381.04
Acer opalus1532 (±9.99)682.800.74
Acer spp.1701586.656.34
Cedrus deodara432 (±10.08)1449.561.91
Celtis australis2031 (±9.37)1456.082.49
Cupressus sempervirens11501604.572.74
Diospyros lotus115827.610.44
Fraxinus angustifolia1242337.982.00
Juglans regia823 (±8.47)889.930.49
Ligustrum japonicum123870.120.57
Morus spp.233 (±5.05)539.910.73
Picea abies1271443.400.71
Pinus sylvestris137453.590.86
Prunus domestica1116892.491.11
Pyrus communis1113737.300.66
Quercus pubescens788 (±13.82)2583.185.29
Taxus baccata224 (±7.35)1379.090.49
Tilia cordata1224 (±5.74)1684.371.71
Tilia platyphyllos332 (±17.39)2427.303.06
Tilia tomentosa1135 (±13.77)1618.103.06
Ulmus carpinifolia114454.510.57
Ulmus laevis117619.770.69
Ulmus minor1131016.440.50
Total103441215.831.66
Table 5. Total tree number of the parks (including also trees with mean CO2s < 0.2 t), mean age, and Total CO2s and CO2c (ton) per park.
ParkN° TreesMean Tree AgeTot. CO2s (t)Tot. CO2c (t)CO2c–CO2sLeaf Area/DBH
Chico Mendez Park114516.71431.22403.39−27.847.36
Pescaia Park45016.72366.35233.40−132.965.87
11 September Park10620.82104.8074.37−30.437.59
Villa Ghigi Park14430.58206.28151.28−55.007.36
Disclaimer/Publisher’s Note: The statements, opinions and data contained in all publications are solely those of the individual author(s) and contributor(s) and not of MDPI and/or the editor(s). MDPI and/or the editor(s) disclaim responsibility for any injury to people or property resulting from any ideas, methods, instructions or products referred to in the content.

