

Uncertainty Estimation in the Modeling of a Flood Wave Caused by a Dam Failure in a Hydropower System with Pumped Hydro Energy Storage

Laboratory of Hydrology, Lithuanian Energy Institute, Breslaujos St. 3, LT-44403 Kaunas, Lithuania
*
Author to whom correspondence should be addressed.
Sustainability 2024, 16(9), 3528; https://doi.org/10.3390/su16093528
Submission received: 15 March 2024
/
Revised: 8 April 2024
/
Accepted: 22 April 2024
/
Published: 23 April 2024
(This article belongs to the Special Issue Sustainability in Water Resources, Water Quality, and Architecture)
Abstract
:Future global sustainability depends heavily on the development of renewable energy. The object of this study is a system of two plants (Kaunas hydropower plant (HP) and Kruonis pumped-storage hydropower plant) and upper and lower reservoirs. A possible dam failure accident in such an important system can endanger the population of Kaunas City. The methodology for estimating dam-failure-induced flood wave uncertainty included scenarios of the upper reservoir embankment failure hydrographs, modeling flood wave spreading (MIKE 21 hydrodynamic model), and estimating wave heights. The GRS methodology was selected to assess the uncertainty of flood wave modeling results and the sensitivity of hydrodynamic model parameters. The findings revealed that the discharge values of the Nemunas inflow and outflow through the HP outlets are the most important parameters determining the greatest height of the flood wave. Therefore, by correctly managing the amount of water in the upper reservoir, it would be possible to prevent the lower reservoir dam from breaking.
1. Introduction
Ancient civilizations arose in river valleys, and their prosperity was based on successfully controlling and harvesting river water. The earliest known dam was constructed in modern-day Jordan in the Bronze Age around 3000 BC [1]. Over the centuries, dams have protected human settlements from floods, and man-made reservoirs have been used for water supply, irrigation, and power generation, among other vital needs. The number of dams is still growing. In some countries, the construction of dams is still considered a symbol of modernism and wealth [2,3,4].
As many countries strive to prioritize renewable energy development and minimize fossil-fuel-based generation, sustainability-focused studies and plans for new hydropower schemes and pumped-storage hydropower projects are on the rise [5,6,7,8,9,10]. Pumped hydro energy storage (PHES) supports essential functionality in the energy system, helping to balance load, regulate frequency, and generate reserve over short and long periods [11,12]. Although PHES systems, for example, in the US, have historically been used in conjunction with nuclear power plants, they are now widely used together with naturally intermittent renewable energy sources such as wind and solar power plants as well [6,13,14]. Developing such energy facilities can significantly increase the share of renewable energy in the global energy mix, which is one of the United Nations’ Sustainable Development Goals before 2030 [15].
Although dam construction involves extensive use for various purposes, the collapse of large dams often brings severe human, economic, and environmental losses. Causes of dam failures include construction errors, dam aging, mismanagement, heavy rains, floods, earthquakes, landslides, glacier avalanches, terrorist attacks, etc. [16,17,18,19,20]. The International Commission on Large Dams [21] reports a general downward trend in the number of registered failures worldwide. Nevertheless, the authorities responsible for dam safety must be aware of all possible threats that could lead to dam failure and take measures to avoid or mitigate the potential danger.
Dam breach analysis often solves two main tasks. The first is a projection of the reservoir discharge hydrograph after a dam break event; the second is the routing of this hydrograph downstream to identify downstream effects [22,23]. According to [24], dam breach analysis tools include comparative analysis, empirical methods, and physically based and parametric models. The first two of these tools require dam failure data, which tend to be inaccurate and incomplete [17,25]. Applying physically based models is challenging because the inputs and physical constraints change in dam breach analysis over time. Parametric models (hydrological and hydraulic) estimate peak discharge and dam breach hydrographs based on user-supplied parameters. Many studies focus on understanding the causes, mechanisms, and risks of dam failures by modeling dam breaks [23,26,27,28,29,30]. Modeling extreme phenomena such as dam failures involves many approximations that introduce multiple sources of uncertainty [31,32,33,34]. Therefore, understanding and assessing uncertainty within dam break analysis is very important.
Many studies are dedicated to single dam breach analysis, but the failure analysis of the infrastructure downstream of the dam is equally important. The overall modeling uncertainty of the infrastructure system is then the sum of the uncertainties arising from the modeling uncertainty of each system element. Dam failure in a chain of man-made reservoirs is a specific problem due to the potential so-called domino effect [35,36,37,38]. Although many studies concentrate on dam breaks in a cascade of hydropower reservoirs, a unique situation is when facilities fail in a power system consisting of a conventional hydropower plant and pumped-storage hydropower plant and their reservoirs. Such a rare layout of facilities is the object of the present study. The options of converting a hydropower plant into a pumped-storage hydropower plant or constructing an additional (upper) reservoir to balance the energy generation are being discussed in other countries as well [39,40,41,42]. Still, the present investigation was conducted as a case study of the existing hydropower system, which consists of two power plants (Kaunas hydropower plant (HP) and Kruonis pumped-storage hydropower plant (PSHP)) and upper and lower reservoirs. The Kaunas HP reservoir on the Nemunas River also serves as the lower reservoir for the pumped-storage power plant. The upper reservoir is an artificial water body not connected to the Nemunas River (Figure 1). These reservoirs are connected by giant pipes. In the daytime, water flows from the upper reservoir to the lower reservoir using turbines to generate electricity. At night, water flows from the lower reservoir to the upper reservoir in pump mode. In the event of embankment failure at the upper reservoir, the flood wave would soon reach the lower reservoir, raising the water level dramatically. Consequently, the risk of a dam break at the hydropower plant would also substantially increase. This study aimed to develop a methodology for estimating the propagation of a flood wave through the described hydropower system in case of failure of the upper reservoir dam and to assess the uncertainty in modeling this process.
2. Case Study Description
The present study examined a hydropower system consisting of two reservoirs and power plants: the lower Kaunas reservoir, formed to generate electricity at the Kaunas hydropower plant (HP), and the upper Kruonis reservoir, which serves the Kruonis pumped-storage hydropower plant (PSHP) (Figure 1). This hydropower system is the largest in Lithuania and meets about 3% of the country’s electricity demand.
In 1959, the Kaunas reservoir was formed after the damming of the Nemunas River. The Kaunas HP was built in 1960. The length of the Kaunas reservoir is 83 km, the average width is 0.67 km, the average depth is 7.3 m, the surface area at the maximum water level is 63.5 km2, and the total storage capacity is 462 million m3. The average annual flow through the power plant outlets is 293 m3/s.
The Kruonis PSHP was built in 1992–1998 on the bank of the Kaunas reservoir. It has an installed capacity of 200 MW per each of the four turbines (Figure 2). During its construction, the Kruonis reservoir was formed by a dike-type concrete impoundment, the walls of which consist of 16.5 m and 9.5 m high and 25 m wide sections. This concrete structure surrounds the newly formed artificial water body. The total length of the dike is 6666 m, the reservoir capacity is 48.9 million m3, and the depth is 15.5 m [43].
This current study analyzed and evaluated the risks of the biggest possible accident at the Kruonis PSHP—the collapse of the Kruonis reservoir embankment initiated by the failure of the embankment wall in the case of a catastrophic event (such as an aircraft crash or terrorist attack). The height difference between the water level in the lower and upper reservoirs varies between 90 and 104 m. The maximum discharge through each turbine of the Kruonis PSHP, with a height difference of 96 m, is 189 m3/s. When the height difference is 100 m, discharge can reach a maximum of 226 m3/s. These characteristics determine the potential risk of the breach of the Kruonis reservoir embankment and, therefore, are important for risk analysis and assessment.
In the event of embankment failure at the upper reservoir, a sudden flood wave would be directed and soon reach the Kaunas reservoir, sharply increasing its water level. Consequently, the dam break risk at the Kaunas HP will also substantially increase. An analysis of the factors that could cause the embankment breach showed two major potential hazards: sliding down the reservoir slope and the collapse of the supporting concrete walls. However, the severity of possible consequences and the extent of potential damage to Kaunas City, located in the close vicinity, are huge and require careful investigation. Therefore, the present study can help determine whether the flood wave formed during the embankment collapse at the Kruonis reservoir would influence the stability of the Kaunas HP dam. The uncertainty estimation of the flood wave calculation made this projection more reliable.
3. Methods
As detailed in Figure 3, the methodology included the following main steps: formulation of failure scenarios for upper reservoir embankment and calculation of hydrograph of water flowing to the lower reservoir; the modeling of flood wave propagation in the lower reservoir; and uncertainty estimation of the flood wave height. If the estimated flood wave height was dangerous for the stability of the hydropower plant dam, it would be necessary to take measures to reduce this flood wave. Then, an update of the risk assessment of the hydropower system (repeating all calculation steps) must be carried out.
3.1. Failure-Related Discharge from the Upper Reservoir
The most likely scenarios for the failure of the upper reservoir embankment were based on the analysis and evaluation of possible events and their probabilities. According to these scenarios, hydrographs were created to analyze the flooding processes. They were also used to describe the boundary conditions for modeling the flood wave propagation through the lower reservoir. The discharge from the upper reservoir during the accident was calculated using the following formula [44]:
where Wb—the height of the broken embankment (m), —gravitation constant (m/s2), and —the difference in the lift (m).
3.2. Modeling the Flood Wave Propagation in the Lower Reservoir
The hydrodynamic module (HD), the basic module in the MIKE 21 Flow Model [45], was applied to evaluate the potential consequences of the embankment failure. HD simulates unsteady two-dimensional flows in one-layer (vertically homogenous) fluids. This model uses an Alternating Direction Implicit (ADI) finite difference scheme to integrate the equations for mass and momentum conservation in the space-time domain. This hydrodynamic model was applied to calculate the flow velocity and water levels in the lower reservoir. The height of a flood wave in various cross-sections of the reservoir and wave speed were simulated under different scenarios of the upper reservoir embankment breach and different hydrological conditions. Water levels, their fluctuations, and current velocities were calculated for every grid point.
The following equations, the conservation of mass and momentum integrated over the vertical, describe the flow and water level variations [46]:
The following symbols were used in the equations: h (x, y, t)—water depth (m); ϛ (x, y, t)—surface elevation (m); p, q (x, y, t)—flux densities in x and y directions (m3/s/m); u, v—depth-averaged velocities in x and y directions (m/s); C (x, y)—Chezy resistance (m0.5/s); g—acceleration due to gravity (m2/s); f (V)—wind friction factor; V, Vx, Vy (x, y, t)—wind speed and components in x and y direction (m/s); Ω (x, y)—Coriolis parameter, latitude-dependent (s−1); pa (x, y, t)—atmospheric pressure (kg/m/s2); ρw—density of water (kg/m3); x, y—space coordinates (m); t—time (s); τxx, τxy, τyy—components of effective shear stress.
3.3. GRS Methodology for Uncertainty and Sensitivity Analysis of Flood Wave Height
The GRS methodology developed by the German company GRS (Gesellschaft für Anlagen und Reaktorsicherheit) [47] was selected to evaluate the uncertainty of the flood wave modeling results and the sensitivity of hydrodynamic model parameters. This methodology is based on statistical (probabilistic) uncertainty extrapolations when uncertainties are assumed in random values with selected distributions.
Primarily, information on all possible significant uncertainty sources has to be obtained [47]. Then, for the identified uncertain parameters, their ranges and probability distributions (most often Gaussian or uniform) are specified, and dependencies between the parameters are checked. The Monte Carlo method is used to generate a random sample of the model parameters based on their specified probability distributions. Each simulation (accomplished with selected software, SUSA 4.1) produces one possible model solution, which, taken all together, form a sample from the unknown probability distribution of model outcomes. Uncertainty can then be expressed by quintiles (5% and 95%), two-sided statistical tolerances (upper and lower limits, with 95% probability and 95% confidence), etc. In the next step, sensitivity measures (Spearman’s correlation) are used to rank the parameters based on their contribution to the uncertainty of the model output. A significant advantage of the GRS method is that the number of necessary calculations is independent of the number of uncertain variables but depends only on the required probability and the confidence level of the statistical tolerance limits. This relationship is calculated by Wilks’ formula [48]. For a probability of 95% and a confidence level of 95%, several calculations (n = 93) have to be made. A typical number of calculations in the uncertainty analysis is 100.
Sensitivity assessment was performed using regression techniques from the sets of model parameters. The corresponding calculation results allowed ranking the model parameters according to their contribution to the output uncertainty. In this study, the sensitivity assessment was accomplished using Spearman’s correlation coefficient. This coefficient is defined as the Pearson correlation coefficient between the ranked variables [49]. Xi and Yi were converted to ranks xi and yi, and Spearman’s correlation coefficient (ρ) was calculated as follows:
This coefficient estimates how well a monotonic function can describe the relationship between two variables. If there are no duplicate data values in the data, a perfect Spearman correlation of +1 or −1 occurs when each variable is a perfect monotone function of the other.
Also, the coefficient of determination R2 was calculated, which is very important for sensitivity analysis.
The SUSA 4.1 (Software System for Uncertainty and Sensitivity Analyses) software was developed by GRS; it provides a choice of statistical tools to be applied during the uncertainty and sensitivity analysis [50]. This software performed the generation of a random sample of size n for model parameters (by Monte Carlo method), calculation of quantitative uncertainty statements and quantitative sensitivity measures (Spearman’s correlation coefficient).
4. Results
4.1. Water Discharges from the Upper Reservoir According to Different Embankment Failure Scenarios
After analysis of the Kruonis embankment structure, it was determined that the collapse could most likely be initiated by the failure of one concrete wall, which would then cause the collapse of the adjacent walls. Due to the topography of the area and location of the reservoir, such a failure would result in a sudden flood wave rapidly propagating downstream, i.e., towards the Kaunas reservoir. The development of the events starting with the failure can be divided into three stages:
Stage 1. The fall of one of the 25 m concrete wall sections somewhere in the perimeter is followed by the release of 1.5 million m3 of water and the water level in the reservoir dropping by 0.5 m.
Stage 2. The subsequent 45.8 million m3 of storage water leaves the reservoir, with the neighboring sections falling. According to our estimations, 1.5 million m3 of water could be discharged through every opening (with a width equal to the width of one concrete wall section). At this stage, two different developments of further collapse of the concrete wall are possible. They form the basis of two scenarios:
Scenario #1: After the collapse of the first concrete wall section, two neighboring sections fall, followed by the failure of the next two, etc. Water pressure in the reservoir would cause the collapse of 11 wall sections in total.
Scenario #2: After the collapse of the first concrete wall section, two neighboring structures fall down on each side (altogether five sections), followed by the further failure of 2 sections, etc. In this case, a total of 11 wall sections would also be broken.
Stage 3. The remaining 1.0 million m3 of water leaves the Kruonis reservoir.
To describe the flood wave in the Kaunas (lower) reservoir formed by the embankment failure, first of all, hydrographs of water running from the Kruonis (upper) reservoir through the broken embankment during the accident were created. Maximum discharge values and an estimated 1.5 million m3 flow through each broken wall section were used. Under the first embankment failure scenario (Figure 4), the flooding was expected to last approximately 4 h throughout all three stages discussed above until the reservoir is completely drained. The peak discharge would be reached after 1.7 h from the initiation of the event. During the event, the maximum discharge was estimated not to exceed 5925 m3/s.
The second scenario can be described as more dramatic, with the events unfolding faster. The reservoir emptying continues for 3.3 h (Figure 4). The peak discharge would be reached 50 min earlier than in case of the first scenario or after 1.2 h from the start of the embankment failure. The maximum discharge was estimated to be 17 percent higher, or 7180 m3/s.
The hydrographs created to illustrate the flood wave propagation from the broken embankment were used to describe the boundary conditions for modeling the flood wave propagation in the Kaunas reservoir.
4.2. Possible Hydrodynamic Changes in the Kaunas Reservoir Due to the Failure of the Kruonis Embankment
The MIKE 21 hydrodynamic module (HD) was used to calculate the flow velocity and water levels in the Kaunas reservoir. The flood wave height in different cross-sections of this water body and wave speed were simulated under two upper reservoir embankment failure scenarios and different hydrological conditions.
The simulation was performed for the whole area of the reservoir. The hydrodynamic model was calibrated for one and two operating turbines of the Kruonis PSHP, using measured values of flow velocities. According to the calibration results, the eddy viscosity coefficient was 2 m2/s, while the Manning number for the modeled area was 0.032. However, this number was not precisely correct when modeling the wave propagation after the Kruonis PSHP embankment break because a part of the water would flow down the reservoir slopes. The values of the Manning coefficient for the water flowing through grass, shrubs, buildings, etc., are different. This coefficient can range from 0.025 to 0.20. In this case, we chose a Manning coefficient of 0.040.
When using the MIKE 21 HD module, it is very important to define the correct initial conditions: simulation time and boundary conditions. Given the model grid size (50 m), a time step of 30 s was selected. Such values meet the HD model requirements. The simulation period was 12 h, enough to analyze the flood wave propagation in the Kaunas reservoir. Regarding the boundary conditions, the following options were chosen:
- Inflow to the Kaunas reservoir. Two cases: (1) the discharge is 120 m3/s, which corresponds to the minimum allowable discharge through the HP turbines; (2) the Nemunas River flood discharge (3000 m3/s), corresponding to the maximum discharge through the HP outlets.
- Outflow through the Kaunas HP outlets. Depending on the selected values for the inflow to the Kaunas reservoir, the discharge through the HP is 120 or 3000 m3/s, respectively.
- Outflow from the Kruonis reservoir in the event of the embankment break. Two hydrographs were defined as the scenarios of the Kruonis embankment failure.
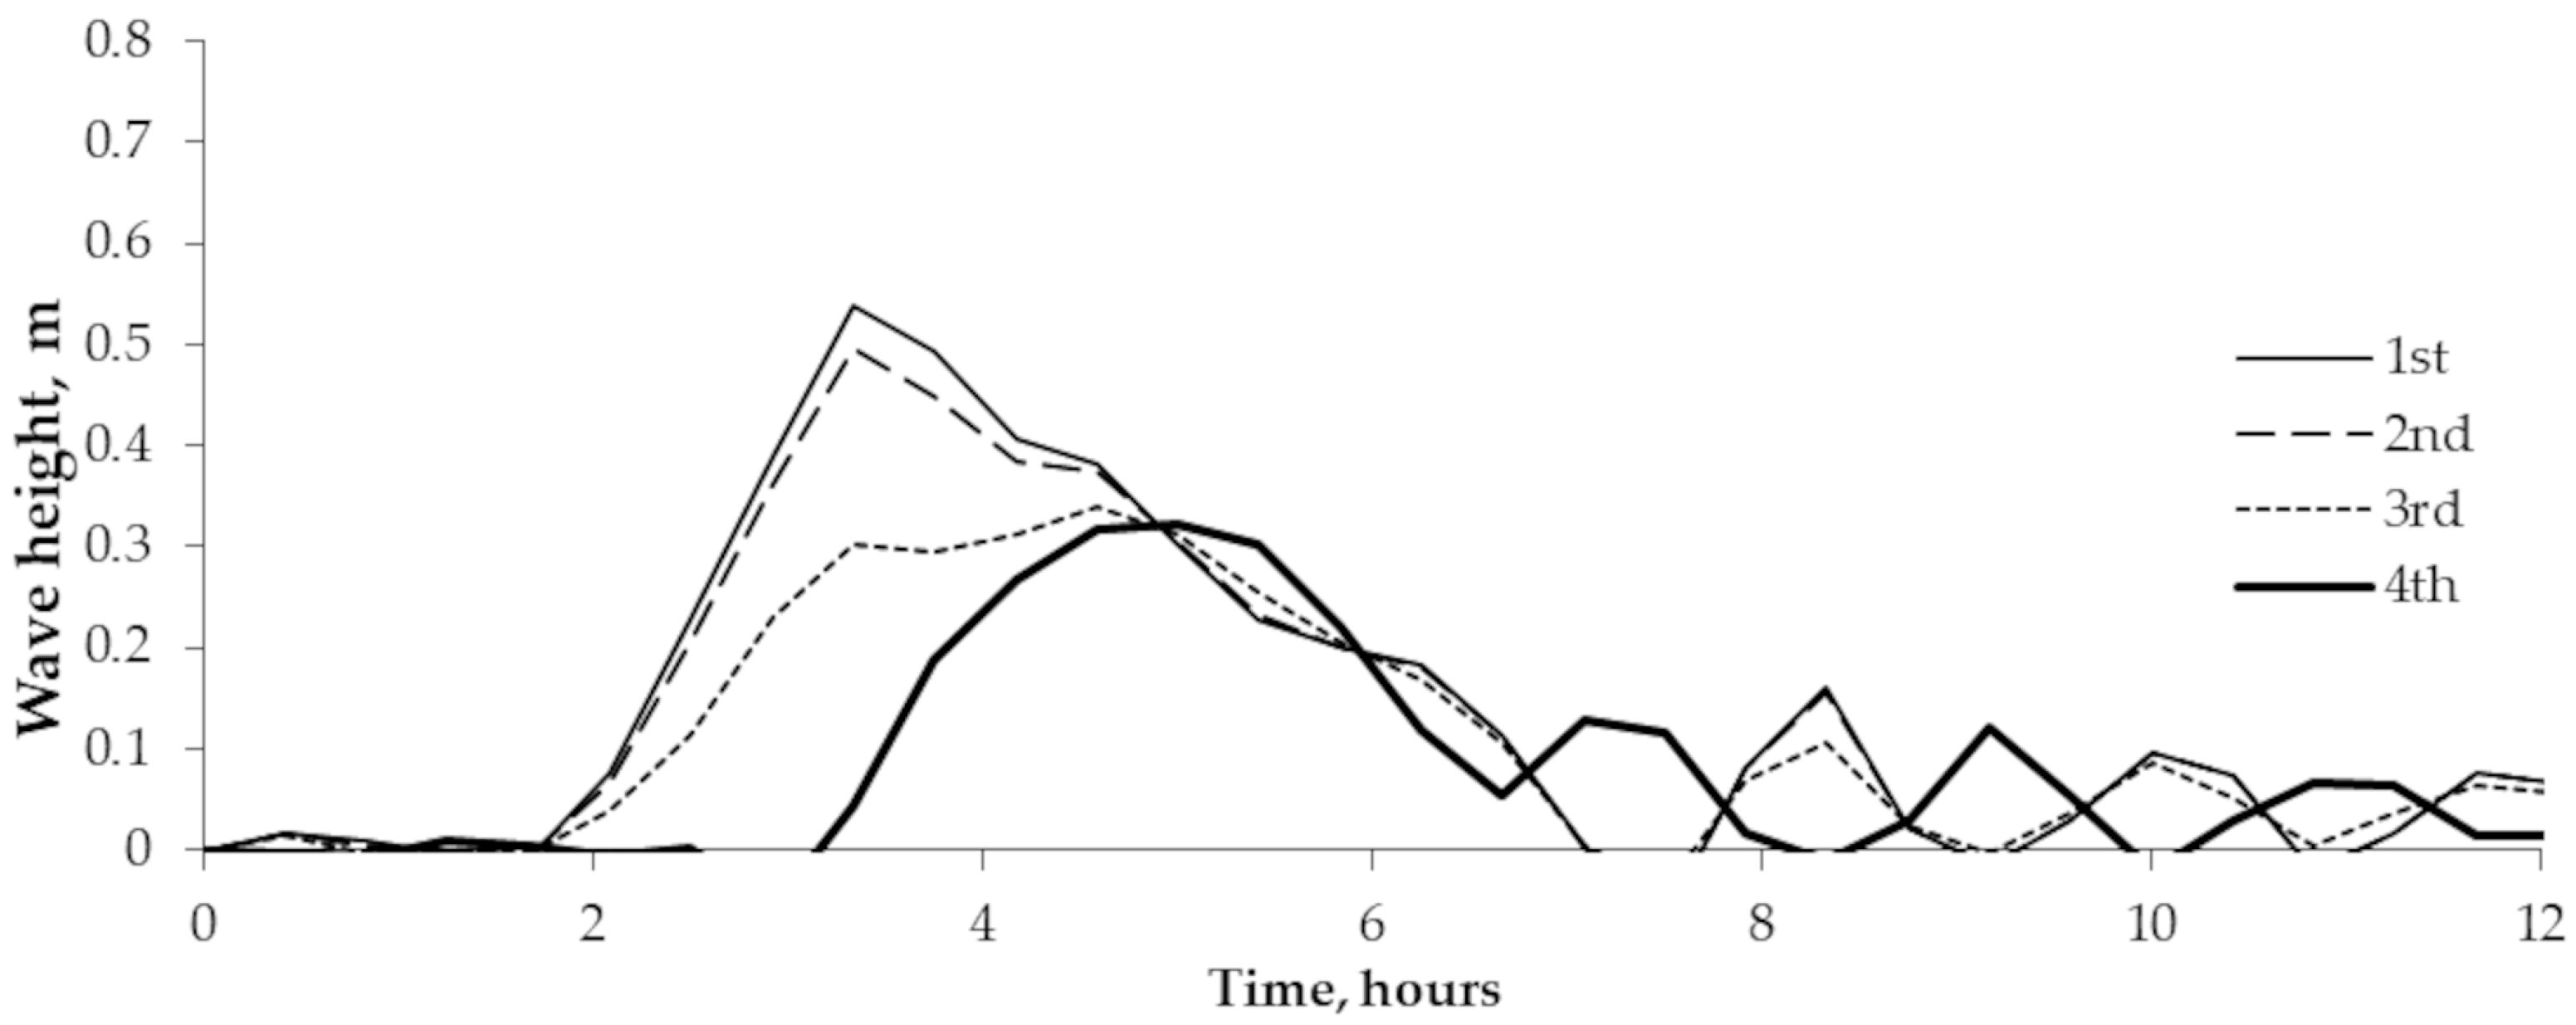
The results of hydrodynamic modeling were presented as water level differences in four cross-sections of the Kaunas reservoir, located at various distances from the entry point of the flooding water, i.e., the Kruonis embankment. These differences illustrated the propagation of the flood wave during the simulation period. The first cross-section was in the Kruonis reservoir; the second and third cross-sections were, respectively, 200 m and 3.5 km downstream from the reservoir; and the fourth was located close to the Kaunas HP dam (for the location of the cross-sections refer to Figure 1C). Analysis was performed comparing the possible consequences of the embankment failure scenarios (first and second) when the inflow to the Kaunas reservoir and the outflow through the Kaunas HP outlets were the same and equal to 120 m3/s.
Under the first failure scenario, the collapse of the Kruonis embankment was set to begin 100 min after the simulation started. Figure 5 illustrates the fluctuation in the flood wave height in the Kaunas reservoir within 12 h. Two hours after the beginning of the failure, the water level in the first and second cross-sections rises by 0.6 m and continues to increase at a lower rate. The flood wave arrives at the Kaunas HP dam 30 min from the beginning of the embankment collapse, and over the next 3.5 h, the water level here reaches 0.78 m. The water level in the entire reservoir fluctuates within the 3 cm range. This happens because of the low inflow and outflow from the Kaunas reservoir (120 m3/s) as opposed to the large amount of additional water reaching the Kaunas HP dam within a short period and generating sinusoidal fluctuations that fade away after a certain time.
Similar processes can be observed under the second scenario, except for the flood wave in the fourth cross-section reaching its maximum height 3.5 h after the failure, compared to 4 h under the first scenario. The water level in the fourth cross-section near the Kaunas HP dam rises by 0.80 m.
When the inflow to the Kaunas reservoir is 3000 m3/s, the flood wave according to the first scenario will reach the Kaunas HP dam one hour after the start of the embankment failure, and after another two hours, it will reach a maximum height of 0.75 m (Figure 6).
According to the second scenario, under the flood flow (3000 m3/s) conditions, the fourth cross-section will be reached in 50 min from the beginning of the embankment failure, with the flood wave achieving its peak of 0.77 m after 1.5 h. In flood conditions, the water level soon stabilizes (sinusoidal fluctuations do not occur). Therefore, the larger the volume of the Kaunas reservoir, the smaller the relative amount of water that reaches it due to the Kruonis reservoir embankment failure, which means a smaller impact on water level fluctuations in the reservoir.
4.3. Uncertainty Estimation in the Modeling of the Flood Wave Induced by the Kruonis Embankment Failure
The sources of hydrodynamic model uncertainty (calibration parameters and input model data) influenced the modeling results of the flood wave that would occur after the Kruonis embankment failure. When calculating the flood wave, two model calibration parameters (coefficients of roughness and eddy viscosity) and three model input data (the Nemunas River inflow to the Kaunas reservoir, outflow through Kaunas HP outlets, and wind speed) had the most significant influence. The investigated parameters of the hydrodynamic model; their minimal, maximum, and basic values; standard deviation; and distribution types are presented in Table 1. For example, the discharge of the Nemunas inflow QNem = 3000 m3/s, the measurement bias is ±25%, the discharge ranges from 2250 to 3750 m3/s, and the distribution type is normal (Gaussian).
In uncertainty and sensitivity analysis, according to the GRS methodology, the number of calculations does not depend on the number of input parameters; it depends only on the desirable statistical confidence limits of the calculation results. In this study, we examined the results of the maximum flood wave estimation using a two-sided Wilks’ criterion to determine the number of calculations. According to this criterion, the required number of calculations is 93. Therefore, 93 sets of different model parameters were generated using the SUSA 4.1 software package according to their ranges and the type of probability distribution (Table 1). The heights of flood waves formed by the embankment failure in the Kruonis PSHP were simulated according to two embankment failure scenarios using 93 sets of model parameters. The collapse of the Kruonis PSHP embankment starts at time t = 0. After 3 h and 45 min from the beginning of this event, the maximum height of the flood wave is estimated at the Kaunas HP.
The flood wave simulation results based on 93 sets showed (Figure 7) that the arithmetic mean almost coincided with the median, indicating that the data distribution was symmetric with respect to the mean, i.e., a particular simulation value of similar probability could be both higher and lower than the average. The simulated minimal height of the wave was 0.63 m, and the maximum was 1.23 m. If uncertainty analysis was not employed and initial parameters (boundary conditions) as well as model parameters were constant, the simulated maximum wave height was 0.75 m.
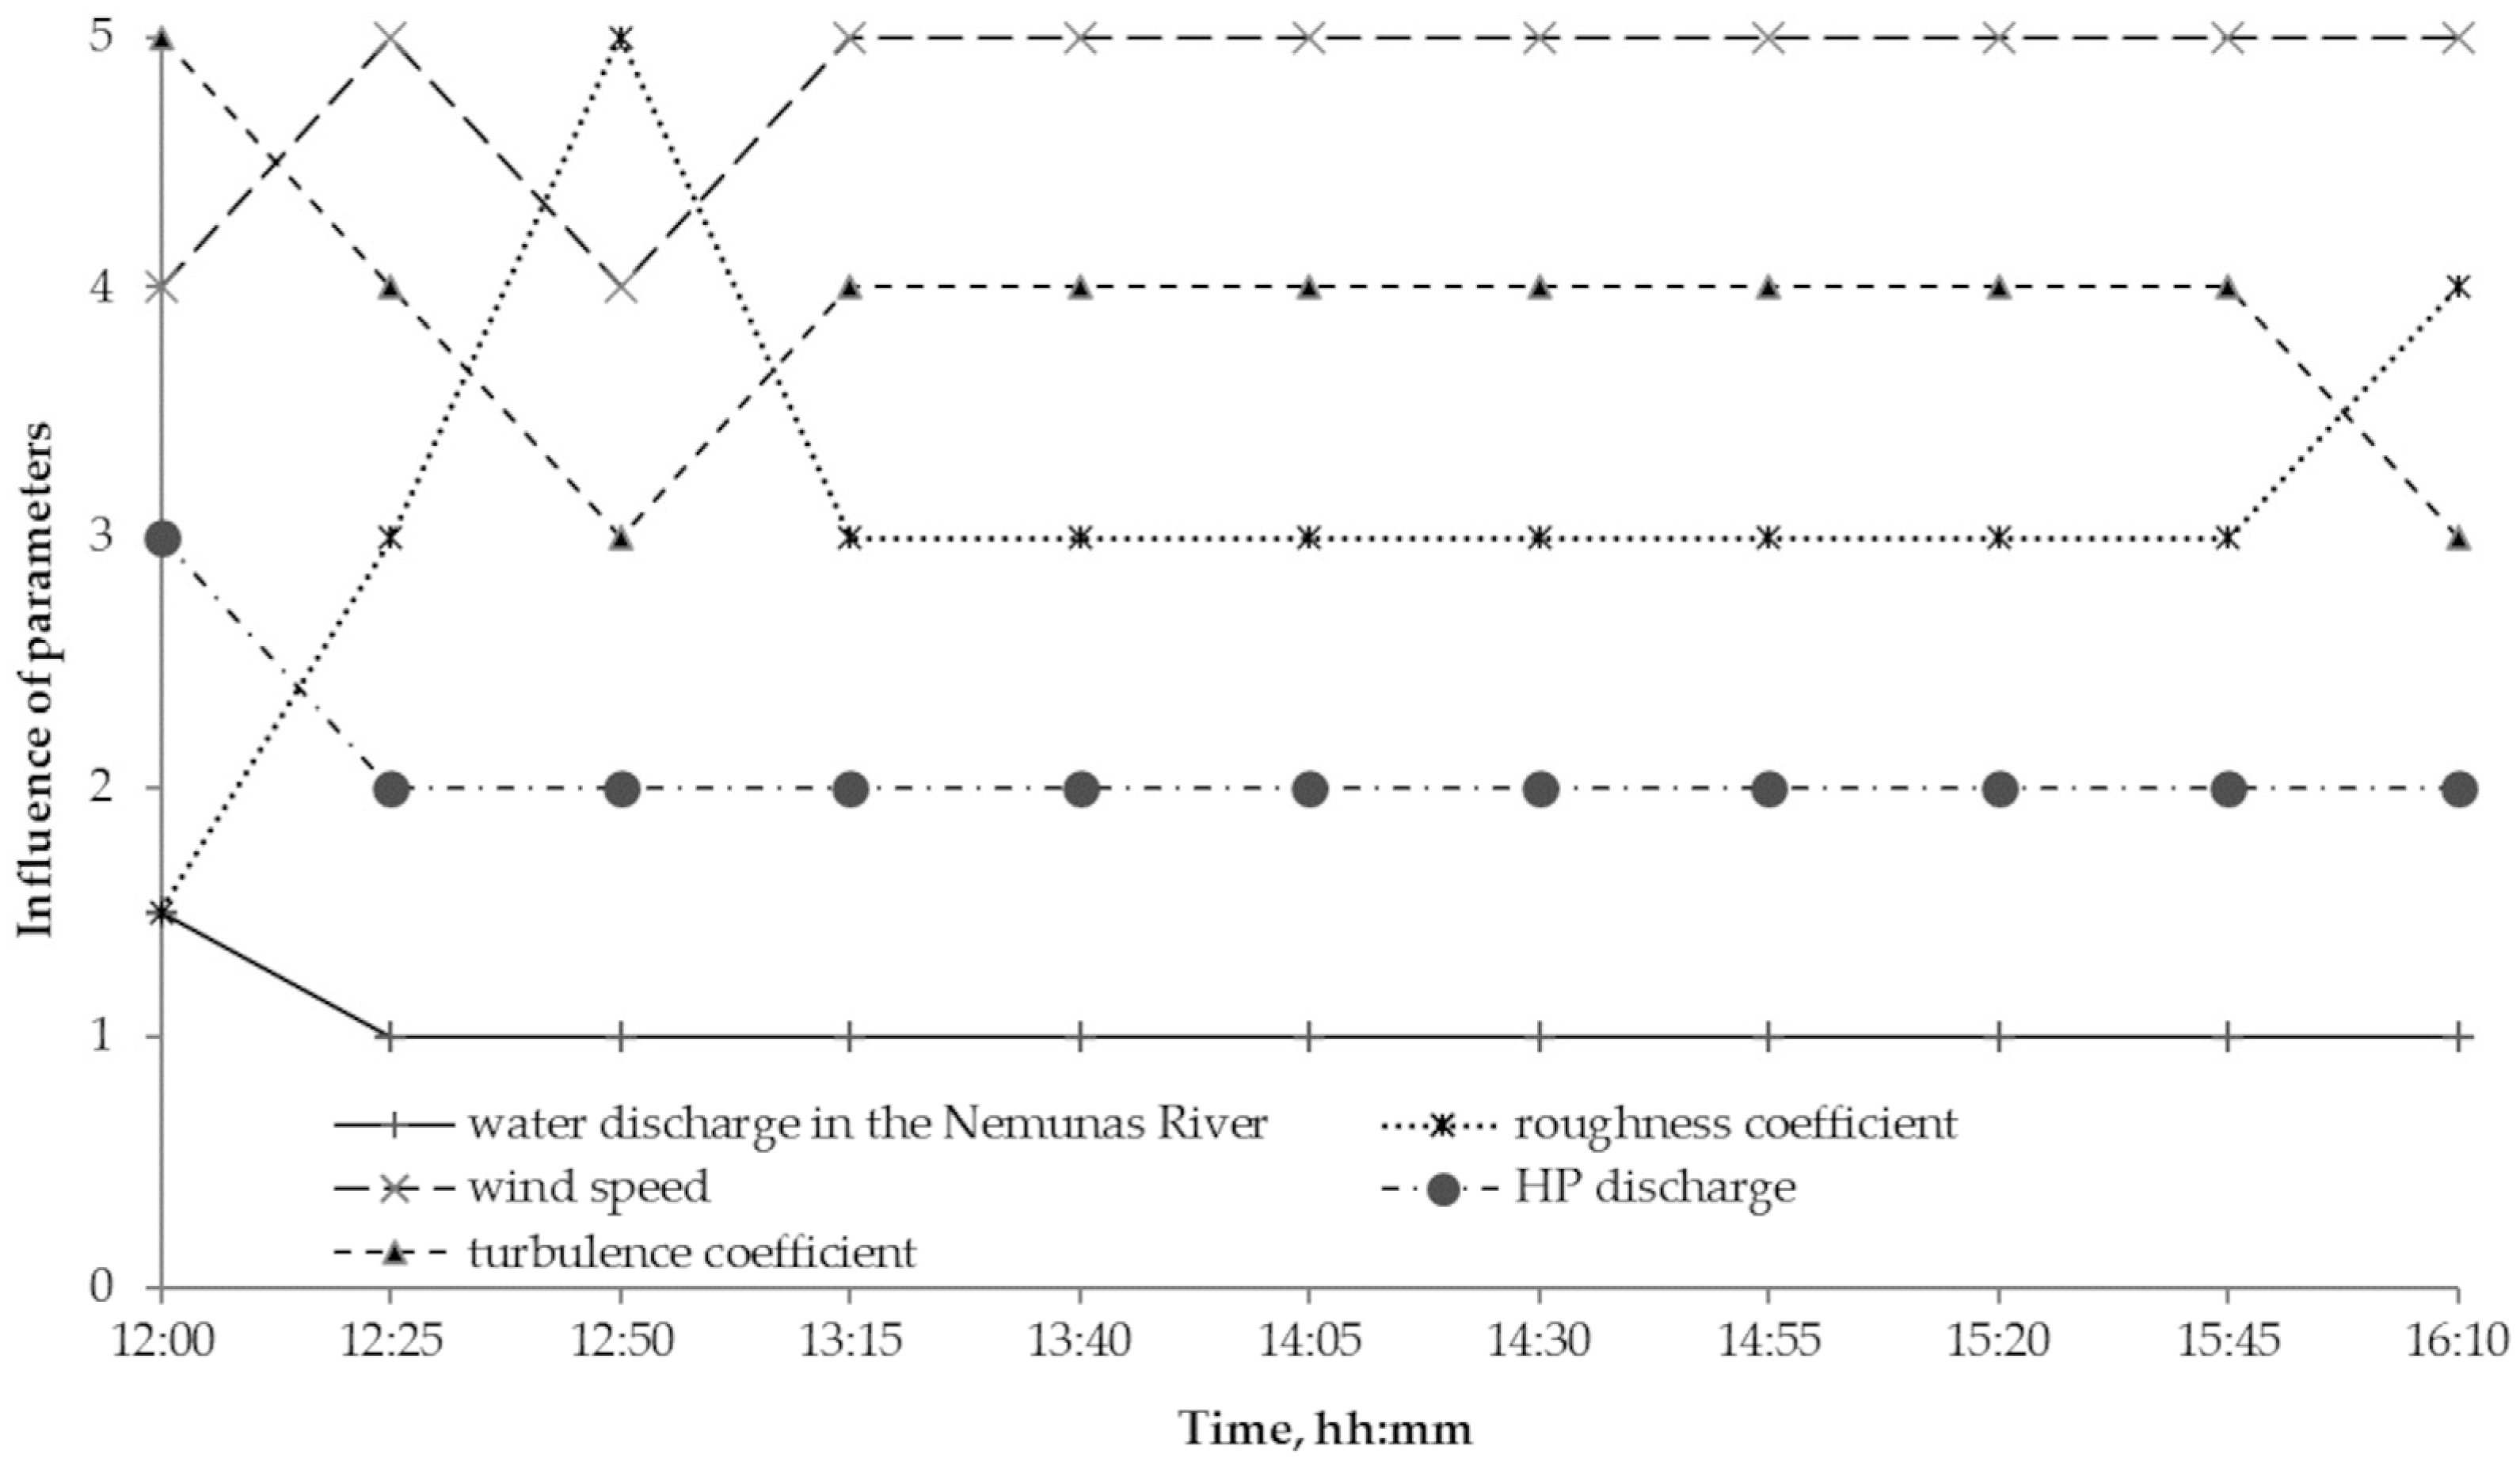
The sensitivity analysis of the influence of the hydrodynamic model parameters on the calculated flood wave heights is presented in Figure 8 and Figure 9. Figure 8 illustrates the impact of five model parameters on the simulated wave height at the Kaunas HP dam. The greater absolute value of the parameter sensitivity coefficient means that the model parameter is more critical and affects the calculation results. As presented in Figure 8, on the time axis, the influence of model parameters on the wave height changed. The Nemunas inflow discharge had the highest positive influence on the wave height, and discharge through the Kaunas HP turbines had the highest negative impact. The negative influence means that if the parameter increases, the wave height will be shorter; i.e., if the discharge through the Kaunas HP outlets increases, the wave height will decrease.
Figure 8 indicates that the discharge values of the Nemunas inflow (0.92) and outflow through the Kaunas HP outlets (−0.49) were the most important parameters that determined the greatest height of the flood wave. The remaining input parameters were less critical.
The calculated ranks of Spearman’s correlation coefficients for five model parameters confirmed the results of the influence analysis (Figure 9). These ranks indicated the influence level (rank) of the input parameters on the modeling results. If the impact of the parameter was more significant, a lower rank value was indicated. This investigation also proved that discharges of the Nemunas River inflow and outflow from the Kaunas reservoir were the most important parameters influencing wave height, whereas wind speed was the least important. The influence of the bottom roughness coefficient changed quite significantly over time. This was due to the different flow speeds when the flood wave spread along the Kaunas reservoir.
4.4. Measures for Reducing the Height of the Flood Wave near the Kaunas HP Dam
Two cases were analyzed: (1) when the Nemunas River inflow to the Kaunas reservoir is minimal (120 m3/s) and (2) when the inflow is maximum (flood discharge = 3000 m3/s).
The results of hydrodynamic modeling showed that the failure of the Kruonis PSHP embankment would raise the water level of the Kaunas HP reservoir to 0.80 m. If the inflow to the Kaunas reservoir is minimal after the accident, the operators of the Kaunas HP must be immediately informed where the HP seals have to be opened as soon as possible to release the additional amount of water from the Kaunas reservoir. Figure 10 displays the modeled situation when the discharge through the HP outlets is minimal (120 m3/s), and all the HP seals are opened 30 min after the Kruonis PSHP embankment failure starts. Under such conditions, the maximum wave height near the Kaunas HP dam will reach only 0.32 m.
The additional load on the Kaunas HP concrete dam in extreme conditions should not be allowed. During large spring floods, even with the Kaunas HP seals opened, the water level in the reservoir can reach the maximum value (45.6 m). Therefore, to reduce the risk and avoid dam breaking, only an indispensable amount of water (about 10 million m3) should be kept in the reservoir. The combination of such events is estimated to occur once every 100 or 1000 years. It is obligatory to begin emptying the Kruonis reservoir when the water level of the Kaunas reservoir reaches 44.8 m in springtime. Depending on the water level in the Kaunas HP reservoir, the water level in the PSHP upper reservoir has to be lower than the values given in Table 2.
5. Discussion and Conclusions
Estimating the consequences of a dam failure in a hydropower system consisting of two power plants (a conventional hydropower plant and a pumped-storage power plant) and two water reservoirs is a complicated task. If the embankment of the upper reservoir failed, the flood wave would quickly reach the lower reservoir, endangering the dam of the hydropower plant and the 300,000-strong population of Kaunas City. Unfortunately, very little has been found about such a complex system as that which was the subject of this study. In the works dedicated to similar systems, the goal was not the analysis of the collapse but the possible installation and operation of such facilities [40,41,42,51]. Meanwhile, many studies are devoted to single dam failures or even more complex failures in cascaded reservoirs. A process of dam failure in cascading reservoirs has transmission and superposition effects [52].
Unlike a cascade, in the studied power system, if the dam collapsed, the upper reservoir would be quickly emptied, the flood wave would travel downstream through the lower reservoir and HP dam, and then the river flow (in the lower reservoir) would stabilize again. A methodology for modeling the flood wave height and estimating its uncertainty was developed to understand this process. It included the following main steps: the formulation of failure scenarios of the upper reservoir dam and the calculation of hydrographs of water flowing into the lower reservoir; the calculation of flood wave propagation in the lower reservoir; and the estimation of flood wave height uncertainty.
As mentioned in the short literature review, parametric models are widely used to simulate flooding downstream of a dam breach. In the present study, we applied the MIKE 21 two-dimensional hydrodynamic module. MIKE [53] is considered one of the most commonly used software tools for dam failure simulation [18,27,28,54], whereas the methodology developed by GRS [47], which was selected to evaluate the uncertainty of flood wave modeling results and sensitivity of hydrodynamic model parameters, is not mentioned as a usual tool in hydrological studies [55]. Initially, it was created for technical systems [47,56] and is currently considered one of the most used methods in the nuclear field [57]. This methodology is attractive as it provides information in a convenient form for decision-making. In this study, we proved one more time that this tool can also be successfully used for hydrological studies (like in our prior studies [58,59]). Therefore, this choice can encourage other researchers in the hydrology field to follow the example.
In this study, the flood wave propagation analysis was performed by comparing possible consequences of the embankment failure scenarios when inflow to the Kaunas reservoir as well as outflow through the Kaunas HP outlets was the same and equaled the minimum allowable and the maximum/flood discharge through HP turbines. One scenario was more dramatic, with the events unfolding faster and the estimated maximum discharge being 17% higher. Our results demonstrated that after the collapse of the Kruonis embankment, the water level (flood wave height) near the Kaunas HP dam would rise by 0.77–0.80 m. Evaluation of the uncertainty of flood wave modeling results indicated that its maximum height would not exceed 1.23 m with 95% probability. The analysis of uncertainty and sensitivity of flood wave modeling results revealed that discharge values of the Nemunas inflow and outflow through the Kaunas HP outlets are the most important parameters determining the greatest height of the flood wave.
As already mentioned, we could not find similar studies to compare our findings. The studies devoted to the modeling of conventional single dams’ failures emphasize the significance of the correct estimation of outflow hydrograph, its volume, and peak flow, which depend on breach geometry, the development of the dam break, the height of the dam, the reservoir length, storage volume and other parameters [18,60,61]. Like in our study, in the case of dam series, the accurate prediction of the wave propagation in the downstream reservoirs is of critical importance [35]. While an accurate prediction of the flow from the broken dam is challenging because of the uncertainty that affects the prediction of dam breach width and time of formation [62,63]. Furthermore, the uncertainty in predictions of dam breach parameters is likely to be much greater than that of all other factors [64].
Our findings revealed that the catastrophic consequences of the Kruonis embankment failure are possible only during extraordinary spring floods of the Nemunas River when the water level in the Kaunas reservoir becomes the highest, and the dam experiences additional hydrostatic pressure. Therefore, during a flood and when the water level in the Kaunas reservoir is 44.8 m or higher, it is recommended to store only the necessary amount of water (approximately 10 million m3) in the upper reservoir. However, even if the flow in the Kaunas reservoir is minimal or average, in the case of the embankment failure, the HP seals must be opened as soon as possible, and an additional amount of water must be discharged from the Kaunas reservoir. Therefore, correct management of the amount of water in the upper reservoir could prevent the dam failure of the lower reservoir in the conditions of the upper reservoir embankment collapse. Thus, in both power plants, the communication between the decision-making authorities must be very close and efficient not only to operate optimally and effectively but also to successfully identify and control potentially dangerous hydrodynamic situations in the system.
The research methods selected and used in this study can be applied to investigate other similar hydropower systems or cascades elsewhere. The findings demonstrated the importance of estimating the simulated flood wave uncertainty when assessing such power system reliability. Therefore, the proposed methodology can be helpful for construction managers and power plant operators to understand and control potential threats. While technologies and operation standards are constantly being improved, the existing facilities and infrastructures should be exploited, and future facilities should be constructed considering the lessons learned (about accidents) and the newest scientific knowledge gained. The study results can serve to develop appropriate flood management measures and provide recommendations for operating similar power systems to reduce the risk.
Author Contributions
Conceptualization, J.K. and D.Š.; methodology, J.K.; software, J.K.; validation, D.Š.; formal analysis, J.K.; investigation, J.K. and D.Š.; data curation, D.Š.; writing—original draft preparation, J.K. and D.Š.; writing—review and editing, J.K.; visualization, D.Š. All authors have read and agreed to the published version of the manuscript.
Funding
This research received no external funding.
Institutional Review Board Statement
Not applicable.
Informed Consent Statement
Not applicable.
Data Availability Statement
Data are contained within the article.
Acknowledgments
The authors wish to thank the Lithuanian Hydrometeorological Service for providing the daily hydrometeorological data.
Conflicts of Interest
The authors declare no conflicts of interest.
References
- Baba, A. Developments in Water Dams and Water Harvesting Systems throughout History in Different Civilizations. IJH 2018, 2, 155–171. [Google Scholar] [CrossRef]
- Kaika, M. Dams as Symbols of Modernization: The Urbanization of Nature Between Geographical Imagination and Materiality. Ann. Assoc. Am. Geogr. 2006, 96, 276–301. [Google Scholar] [CrossRef]
- Kaneti, M. Dams, Neoliberalism, and Rights: Mainstreaming Environmental Justice Claims. Sustain. Dev. 2020, 28, 424–434. [Google Scholar] [CrossRef]
- Vahedifard, F.; Madani, K.; AghaKouchak, A.; Thota, S.K. Are We Ready for More Dam Removals in the United States? Environ. Res. Infrastruct. Sustain. 2021, 1, 013001. [Google Scholar] [CrossRef]
- Kaygusuz, K. Renewable Energy: Power for a Sustainable Future. Renew. Energy 2001, 19, 603–626. [Google Scholar] [CrossRef]
- Yang, C.-J.; Jackson, R.B. Opportunities and Barriers to Pumped-Hydro Energy Storage in the United States. Renew. Sustain. Energy Rev. 2011, 15, 839–844. [Google Scholar] [CrossRef]
- Graabak, I.; Jaehnert, S.; Korpås, M.; Mo, B. Norway as a Battery for the Future European Power System—Impacts on the Hydropower System. Energies 2017, 10, 2054. [Google Scholar] [CrossRef]
- Bartle, A. New Challenges Are Being Met by the Inherent Advantages of Hydro and Storage. Int. J. Hydropower Dams 2022, 7, 2–7. [Google Scholar]
- Pandey, V.; Sircar, A.; Yadav, K.; Bist, N. Pumped Hydro Storage for Intermittent Renewable Energy: Present Status and Future Potential in India. MRS Energy Sustain. 2023, 10, 189–206. [Google Scholar] [CrossRef]
- Abu-Afifeh, Q.; Rahbeh, M.; Al-Afeshat, A.; Al-Omari, S.; Qutishat, T.A.; Brezat, A.; Alkayed, A. Dam Sustainability’s Interdependency with Climate Change and Dam Failure Drivers. Sustainability 2023, 15, 16239. [Google Scholar] [CrossRef]
- Yang, C.-J. Pumped Hydroelectric Storage. In Storing Energy; Elsevier: Amsterdam, The Netherlands, 2016; pp. 25–38. ISBN 978-0-12-803440-8. [Google Scholar]
- Child, M.; Kemfert, C.; Bogdanov, D.; Breyer, C. Flexible Electricity Generation, Grid Exchange and Storage for the Transition to a 100% Renewable Energy System in Europe. Renew. Energy 2019, 139, 80–101. [Google Scholar] [CrossRef]
- Rehman, S.; Al-Hadhrami, L.M.; Alam, M.M. Pumped Hydro Energy Storage System: A Technological Review. Renew. Sustain. Energy Rev. 2015, 44, 586–598. [Google Scholar] [CrossRef]
- Kong, Y.; Kong, Z.; Liu, Z.; Wei, C.; Zhang, J.; An, G. Pumped Storage Power Stations in China: The Past, the Present, and the Future. Renew. Sustain. Energy Rev. 2017, 71, 720–731. [Google Scholar] [CrossRef]
- United Nations Department of Economic and Social Affairs. The Sustainable Development Goals Report 2023: Special Edition; The Sustainable Development Goals Report; United Nations: New York, NY, USA, 2023; ISBN 978-92-1-002491-4. [Google Scholar]
- You, L.; Li, C.; Min, X.; Xiaolei, T. Review of Dam-Break Research of Earth-Rock Dam Combining with Dam Safety Management. Procedia Eng. 2012, 28, 382–388. [Google Scholar] [CrossRef]
- Aureli, F.; Maranzoni, A.; Petaccia, G. Review of Historical Dam-Break Events and Laboratory Tests on Real Topography for the Validation of Numerical Models. Water 2021, 13, 1968. [Google Scholar] [CrossRef]
- Kostecki, S.; Banasiak, R. The Catastrophe of the Niedów Dam—The Causes of the Dam’s Breach, Its Development, and Consequences. Water 2021, 13, 3254. [Google Scholar] [CrossRef]
- Ghimire, S.N.; Schulenberg, J.W. Impacts of Climate Change on the Environment, Increase in Reservoir Levels, and Safety Threats to Earthen Dams: Post Failure Case Study of Two Cascading Dams in Michigan. Civ. Environ. Eng. 2022, 18, 551–564. [Google Scholar] [CrossRef]
- Naddaf, M. Ukraine Dam Collapse: What Scientists Are Watching. Nature 2023, 618, 440–441. [Google Scholar] [CrossRef]
- ICOLD Incident Database Bulletin 99 Update. Statistical Analysis of Dam Failures. In Committee on Dam Safety; International Commission on Large Dams (ICOLD): Paris, France, 2019.
- Patra, K.C.; Mishra, R. Dam Breach Parameters and Its Effects on Propagation of Flood Wave in the Downstream. In Proceedings of the Eighth International Conference On Advances in Civil Structural and Mechanical Engineering ACSM 2018, Paris, France, 24 June 2018; Institute of Research Engineers and Doctors: New York, NY, USA; pp. 1–5. [Google Scholar]
- Beza, M.; Fikre, A.; Moshe, A. Dam Breach Modeling and Downstream Flood Inundation Mapping Using HEC-RAS Model on the Proposed Gumara Dam, Ethiopia. Adv. Civ. Eng. 2023, 2023, 8864328. [Google Scholar] [CrossRef]
- Guidelines for Dam Breach Analysis 2020. Available online: https://dnrweblink.state.co.us/dwr/ElectronicFile.aspx?docid=3566962&dbid=0 (accessed on 8 April 2024).
- Sopta, L.; Maćešić, S.; Holjević, D.; Črnjarić-Žic, N.; Škifić, J.; Družeta, S.; Crnković, B. Tribalj Dam-Break and Flood Wave Propagation. Ann. Univ. Ferrara 2007, 53, 405–415. [Google Scholar] [CrossRef]
- Tsakiris, G.; Vasilis, B.; Constantinos, Z. Embankment Dam Failure: A Downstream Flood Hazard Assessment. Eur. Water 2010, 32, 35–45. [Google Scholar]
- Zolghadr, M.; Hashemi, M.R.; Zomorodian, S.M.A. Assessment of MIKE21 Model in Dam and Dike-Break Simulation. IJST 2011, 35, 247–262. [Google Scholar]
- Soninbayar, J.; Audra, P. Dam Break Simulation Using DHI-MIKE21 in the Eg Hydropower Plant, Mongolia. In Advances in Hydroinformatics; Gourbesville, P., Cunge, J., Caignaert, G., Eds.; Springer Water; Springer: Singapore, 2018; pp. 415–422. ISBN 978-981-10-7217-8. [Google Scholar]
- Psomiadis, E.; Tomanis, L.; Kavvadias, A.; Soulis, K.X.; Charizopoulos, N.; Michas, S. Potential Dam Breach Analysis and Flood Wave Risk Assessment Using HEC-RAS and Remote Sensing Data: A Multicriteria Approach. Water 2021, 13, 364. [Google Scholar] [CrossRef]
- Gaagai, A.; Aouissi, H.A.; Krauklis, A.E.; Burlakovs, J.; Athamena, A.; Zekker, I.; Boudoukha, A.; Benaabidate, L.; Chenchouni, H. Modeling and Risk Analysis of Dam-Break Flooding in a Semi-Arid Montane Watershed: A Case Study of the Yabous Dam, Northeastern Algeria. Water 2022, 14, 767. [Google Scholar] [CrossRef]
- Delenne, C.; Cappelaere, B.; Guinot, V. Uncertainty Analysis of River Flooding and Dam Failure Risks Using Local Sensitivity Computations. Reliab. Eng. Syst. Saf. 2012, 107, 171–183. [Google Scholar] [CrossRef]
- Morris, M.W. Breaching of Earth Embankments and Dams. Ph.D. Thesis, The Open University, Milton Keynes, UK, 2013. [Google Scholar] [CrossRef]
- Peter, S.J.; Siviglia, A.; Nagel, J.; Marelli, S.; Boes, R.M.; Vetsch, D.; Sudret, B. Development of Probabilistic Dam Breach Model Using Bayesian Inference. Water Resour. Res. 2018, 54, 4376–4400. [Google Scholar] [CrossRef]
- Tschiedel, A.D.F.; Paiva, R.C.D.D. Uncertainty Assessment in Hydrodynamic Modeling of Floods Generated by Dam Break. RBRH 2018, 23, e30. [Google Scholar] [CrossRef]
- Dewals, B.; Erpicum, S.; Detrembleur, S.; Archambeau, P.; Pirotton, M. Failure of Dams Arranged in Series or in Complex. Nat. Hazards 2011, 56, 917–939. [Google Scholar] [CrossRef]
- Xue, Y.; Xu, W.; Luo, S.; Chen, H.; Li, N.; Xu, L. Experimental Study of Dam-Break Flow in Cascade Reservoirs With Steep Bottom Slope. J. Hydrodyn. 2011, 23, 491–497. [Google Scholar] [CrossRef]
- Cai, W.; Zhu, X.; Peng, A.; Wang, X.; Fan, Z. Flood Risk Analysis for Cascade Dam Systems: A Case Study in the Dadu River Basin in China. Water 2019, 11, 1365. [Google Scholar] [CrossRef]
- Campos, R.G.D.; Saliba, A.P.M. Methodology to Evaluate Cascade Dams Breaks for Analysis and Safety Design. RBRH 2023, 28, e16. [Google Scholar] [CrossRef]
- Zvirgzdins, J.; Linkevics, O. Pumped-Storage Hydropower Plants as Enablers for Transition to Circular Economy in Energy Sector: A Case of Latvia. Latv. J. Phys. Tech. Sci. 2020, 57, 20–31. [Google Scholar] [CrossRef]
- Kiene, S.; Linkevics, O. Simplified Model for Evaluation of Hydropower Plant Conversion into Pumped Storage Hydropower Plant. Latv. J. Phys. Tech. Sci. 2021, 58, 108–120. [Google Scholar] [CrossRef]
- Toufani, P.; Nadar, E.; Kocaman, A.S. Operational Benefit of Transforming Cascade Hydropower Stations into Pumped Hydro Energy Storage Systems. J. Energy Storage 2022, 51, 104444. [Google Scholar] [CrossRef]
- Manikas, K.; Skroufouta, S.; Baltas, E. Simulation and Evaluation of Pumped Hydropower Storage (PHPS) System at Kastraki Reservoir. Renew. Energy 2024, 222, 119888. [Google Scholar] [CrossRef]
- Jakimavičius, D. Regulations for the Use and Maintenance of the Reservoir of the Kaunas Hydropower Plant; Lithuanian Energy Institute: Kaunas, Lithuania, 2016. [Google Scholar]
- Fread, D.L. A Breach Erosion Model for Earthen Dams. In Proceedings of the Specialty Conference, Los Angeles, CA, USA, 25–27 June 1984; Utah State University: Logan, UT, USA, 1984. [Google Scholar]
- MIKE 21 Flow Model. Hydrodynamic Module. 2019. Available online: https://manuals.mikepoweredbydhi.help/2019/Coast_and_Sea/M21HD.pdf (accessed on 8 April 2024).
- Abbott, M.B. Computational Hydraulics: Elements of the Theory of Free Surface Flows; Pitman: Lanham, MD, USA, 1979; ISBN 978-0-273-01140-8. [Google Scholar]
- Glaeser, H. GRS Method for Uncertainty and Sensitivity Evaluation of Code Results and Applications. Sci. Technol. Nucl. Install. 2008, 2008, 798901. [Google Scholar] [CrossRef]
- Wilks, S.S. Determination of Sample Sizes for Setting Tolerance Limits. Ann. Math. Statist. 1941, 12, 91–96. [Google Scholar] [CrossRef]
- Myers, J.L.; Well, A. Research Design and Statistical Analysis, 2nd ed.; Lawrence Erlbaum Associates: Mahwah, NJ, USA, 2003; ISBN 978-1-4106-0703-4. [Google Scholar]
- Kloos, M. The Tool Susa 4 for Probabilistic Uncertainty and Sensitivity Analyses. In Proceedings of the 1st International Conference on Uncertainty Quantification in Computational Sciences and Engineering (UNCECOMP 2015), Crete Island, Greece, 25–27 May 2015; Institute of Structural Analysis and Antiseismic Research School of Civil Engineering National Technical University of Athens (NTUA) Greece: Crete Island, Greece, 2015; pp. 961–976. [Google Scholar]
- Zoss, T.; Karklina, I.; Blumberga, D. Power to Gas and Pumped Hydro Storage Potential in Latvia. Energy Procedia 2016, 95, 528–535. [Google Scholar] [CrossRef]
- Wang, Z.; Fang, G.; Wen, X.; Tan, Q.; Zhang, P.; Liu, Z. Coordinated Operation of Conventional Hydropower Plants as Hybrid Pumped Storage Hydropower with Wind and Photovoltaic Plants. Energy Convers. Manag. 2023, 277, 116654. [Google Scholar] [CrossRef]
- MIKE Powered by DHI: Software Catalogue 2023 by DHI A/S—Issuu. Available online: https://issuu.com/dhigroup/docs/softwarecatalogue2023 (accessed on 5 March 2024).
- Paşa, Y.; Peker, İ.B.; Hacı, A.; Gülbaz, S. Dam Failure Analysis and Flood Disaster Simulation under Various Scenarios. Water Sci. Technol. 2023, 87, 1214–1231. [Google Scholar] [CrossRef]
- Panchanathan, A.; Ahrari, A.H.; Ghag, K.; Must, S.M.T.; Haghighi, A.T.; Kløve, B.; Oussalah, M. An Overview of Approaches for Reducing Uncertainties in Hydrological Forecasting: Progress, and Challenges. Res. Sq. 2023. preprint. Available online: https://www.researchsquare.com/article/rs-2802423/v1 (accessed on 8 April 2024).
- Glaeser, H. Summary of Existing Uncertainty Methods. Int. At. Energy Agency 2013. Available online: https://inis.iaea.org/collection/NCLCollectionStore/_Public/45/107/45107563.pdf (accessed on 8 April 2024).
- Mesado, C.; Miró, R.; Verdú, G. Methodology for Neutronic Uncertainty Propagation and Application to a UAM-LWR Benchmark. Prog. Nucl. Energy 2020, 126, 103389. [Google Scholar] [CrossRef]
- Jakimavičius, D.; Kriaučiūnienė, J.; Gailiušis, B.; Šarauskienė, D. Assessment of Uncertainty in Estimating the Evaporation from the Curonian Lagoon. Baltica 2013, 26, 177–186. [Google Scholar] [CrossRef]
- Kriauciuniene, J.; Jakimavicius, D.; Sarauskiene, D.; Kaliatka, T. Estimation of Uncertainty Sources in the Projections of Lithuanian River Runoff. Stoch. Environ. Res. Risk Assess. 2013, 27, 769–784. [Google Scholar] [CrossRef]
- Soliman, A.; Bekhit, H.; Hamed, K.; Zawahry, A.E. Prediction of Dam Breach Parameters and Their Uncertainties. J. Eng. Appl. Sci. 2014, 61, 269–290. [Google Scholar]
- Hu, H.; Zhang, J.; Li, T.; Yang, J. A Simplified Mathematical Model for the Dam-Breach Hydrograph for Three Reservoir Geometries Following a Sudden Full Dam Break. Nat. Hazards 2020, 102, 1515–1540. [Google Scholar] [CrossRef]
- Dewals, B.J.; Archambeau, P.; Erpicum, S.; Detrembleur, S.; Pirotton, M. Sensitivity Analysis of the Peak Outflow Induced by the Breaching of Embankment Dams; Technische Universität München: Munich, Germany, 2007. [Google Scholar]
- Wang, W.; Chen, W.; Huang, G. Research on Flood Propagation for Different Dam Failure Modes: A Case Study in Shenzhen, China. Front. Earth Sci. 2020, 8, 527363. [Google Scholar] [CrossRef]
- Wahl, T.L. Uncertainty of Predictions of Embankment Dam Breach Parameters. J. Hydraul. Eng. 2004, 130, 389–397. [Google Scholar] [CrossRef]
Figure 1.
Location of the hydropower system ((A)—at European scale, (B)—at Lithuanian scale, (C)—a layout of reservoirs and hydropower plants; 1–4 indicate cross-section numbers).
Figure 1.
Location of the hydropower system ((A)—at European scale, (B)—at Lithuanian scale, (C)—a layout of reservoirs and hydropower plants; 1–4 indicate cross-section numbers).

Figure 2.
Schematic view of the Kruonis PSHP.

Figure 3.
Methodology for the hydropower system management in case of the upper reservoir embankment failure.
Figure 3.
Methodology for the hydropower system management in case of the upper reservoir embankment failure.

Figure 4.
Hydrographs of the water flow through the broken embankment according to the 1st and the 2nd scenarios.
Figure 4.
Hydrographs of the water flow through the broken embankment according to the 1st and the 2nd scenarios.

Figure 5.
Fluctuation in the flood wave height in four cross-sections (Figure 1C) of the Kaunas reservoir when water inflow to the reservoir as well as outflow through the Kaunas HP outlets is 120 m3/s (according to the 1st scenario).
Figure 5.
Fluctuation in the flood wave height in four cross-sections (Figure 1C) of the Kaunas reservoir when water inflow to the reservoir as well as outflow through the Kaunas HP outlets is 120 m3/s (according to the 1st scenario).

Figure 6.
Fluctuation in the flood wave height in four cross-sections (Figure 1C) of the Kaunas reservoir when water inflow to the reservoir as well as outflow through the Kaunas HP outlets is 3000 m3/s (according to the 1st scenario).
Figure 6.
Fluctuation in the flood wave height in four cross-sections (Figure 1C) of the Kaunas reservoir when water inflow to the reservoir as well as outflow through the Kaunas HP outlets is 3000 m3/s (according to the 1st scenario).

Figure 7.
Statistical analysis of the wave heights in the 4th cross-section at the Kaunas HP dam under the 1st Kruonis PSHP embankment failure scenario.
Figure 7.
Statistical analysis of the wave heights in the 4th cross-section at the Kaunas HP dam under the 1st Kruonis PSHP embankment failure scenario.

Figure 8.
Influence of five input parameters on the simulated result (flood wave height).

Figure 9.
Ranks of the influence of five input parameters on the modeling results (flood wave height).
Figure 9.
Ranks of the influence of five input parameters on the modeling results (flood wave height).

Figure 10.
Fluctuation in flood wave height in the Kaunas reservoir according to the 1st scenario of the Kruonis PSHP embankment failure (inflow into the Kaunas reservoir is 120 m3/s).
Figure 10.
Fluctuation in flood wave height in the Kaunas reservoir according to the 1st scenario of the Kruonis PSHP embankment failure (inflow into the Kaunas reservoir is 120 m3/s).


Table 1.
Description of hydrodynamic model parameters that most influenced the results of flood wave modeling.
Table 1.
Description of hydrodynamic model parameters that most influenced the results of flood wave modeling.
| Input Parameter | Input Parameter Ranges | Basic Value (m) | Standard Deviation (s) and Bias | Distribution Type | |
|---|---|---|---|---|---|
| Minimal Value (i) | Maximum Value (a) | ||||
| The Nemunas River inflow to the Kaunas reservoir | 2250 m3/s | 3750 m3/s | 3000 m3/s | 375 [25%] | Gaussian |
| Outflow through Kaunas HP outlets | 2700 m3/s | 3300 m3/s | 3000 m3/s | 150 [10%] | Gaussian |
| Coefficient of roughness | 20 m1/2/s | 40 m1/2/s | 32 m1/2/s | – | Triangular |
| Coefficient of eddy viscosity | 0.5 m2/s | 3.5 m2/s | 2 m2/s | – | Discrete {0.5; 1; 1.5; 2; 2.5; 3; 3.5} |
| Wind speed | 2 m/s | 5 m/s | – | Uniform | |
Table 2.
Recommended usable storage in the upper reservoir depending on the water level in the Kaunas reservoir.
Table 2.
Recommended usable storage in the upper reservoir depending on the water level in the Kaunas reservoir.
| Water level in the Kaunas HP reservoir (m) | 44.8 | 45.0 | 45.2 | 45.4 | 45.6 |
| Usable storage in the PSHP upper reservoir (million m3) | 41.0 | 33.0 | 25.0 | 17.0 | 10.0 |
Disclaimer/Publisher’s Note: The statements, opinions and data contained in all publications are solely those of the individual author(s) and contributor(s) and not of MDPI and/or the editor(s). MDPI and/or the editor(s) disclaim responsibility for any injury to people or property resulting from any ideas, methods, instructions or products referred to in the content. |
© 2024 by the authors. Licensee MDPI, Basel, Switzerland. This article is an open access article distributed under the terms and conditions of the Creative Commons Attribution (CC BY) license (https://creativecommons.org/licenses/by/4.0/).
Share and Cite
MDPI and ACS Style
Kriaučiūnienė, J.; Šarauskienė, D. Uncertainty Estimation in the Modeling of a Flood Wave Caused by a Dam Failure in a Hydropower System with Pumped Hydro Energy Storage. Sustainability 2024, 16, 3528. https://doi.org/10.3390/su16093528
AMA Style
Kriaučiūnienė J, Šarauskienė D. Uncertainty Estimation in the Modeling of a Flood Wave Caused by a Dam Failure in a Hydropower System with Pumped Hydro Energy Storage. Sustainability. 2024; 16(9):3528. https://doi.org/10.3390/su16093528
Chicago/Turabian StyleKriaučiūnienė, Jūratė, and Diana Šarauskienė. 2024. "Uncertainty Estimation in the Modeling of a Flood Wave Caused by a Dam Failure in a Hydropower System with Pumped Hydro Energy Storage" Sustainability 16, no. 9: 3528. https://doi.org/10.3390/su16093528
Note that from the first issue of 2016, this journal uses article numbers instead of page numbers. See further details here.