
Optimization of the Water–Energy–Carbon Nexus in the Residential Water Uses of Shanghai, China

Zhejiang University—University of Illinois Urbana Champaign Institute, International Campus, Zhejiang University, Haining 314400, China
*
Author to whom correspondence should be addressed.
Sustainability 2024, 16(9), 3529; https://doi.org/10.3390/su16093529
Submission received: 15 March 2024
/
Revised: 16 April 2024
/
Accepted: 18 April 2024
/
Published: 23 April 2024
(This article belongs to the Section Sustainable Water Management)
Abstract
:Residential water use in urban areas directly affects household energy consumption and associated carbon emissions. Reducing residential water use through water saving can lead to substantial energy saving and lower carbon emissions. Household choices in water appliances and fixtures and water-use behaviors shape water consumption patterns. This paper presents a study in Shanghai, China, where the water consumption structure of households was analyzed through a comprehensive survey. In addition, a season-differentiated water–energy–carbon nexus optimization model with Monte Carlo simulation was built to minimize the costs associated with water and energy usage while maximizing carbon emission reduction. The survey data revealed Shanghai’s water demand structure, thereby highlighting the water-use influence in the city on urban household energy consumption and carbon emissions, which are affected by seasonal temperature variations. The results provide useful insights into the intricate relationships among water use, energy consumption, and carbon emissions at the scale of urban households.
1. Introduction
Currently, rapid economic development, population growth, and urbanization in many countries and regions have led to challenging issues such as water scarcity and energy shortage, thereby drawing global attention [1]. Global water scarcity is projected to increase by 75% by 2050, with more than two thirds of the population anticipated to reside in severely water-scarce regions [2]. Meanwhile, by the year 2035, the worldwide demand for primary energy is anticipated to surge by 40% compared to 2010 levels [3]. Additionally, the substantial carbon dioxide emissions stemming from fossil fuel consumption has caused anthropogenic climate change. The intrinsic ties among water, energy, carbon emissions, and urban sustainability underscore the pivotal role of prudently harnessing water resources and energy to bolster urban resilience [4].
Water is intricately linked with energy and carbon emissions in urban systems. Processes such as the supply, distribution, and treatment of water consume significant amounts of energy, while energy extraction, processing, and distribution also entail substantial water usage. In Spain, 5.8% of national electricity consumption is attributed to urban water systems [5]. The energy consumption associated with water systems represents a significant source of urban carbon dioxide emissions, with considerable carbon dioxide production stemming from the energy required for urban wastewater treatment, which subsequently exacerbates the greenhouse effect [6]. The greenhouse effect induced by carbon dioxide, in turn, leads to urban water scarcity, increased costs of electricity production, and elevated urban energy consumption. This fact has underscored the urgent need for research on the coupling of water resources, energy, and carbon emissions, thereby drawing increasing attention from international organizations, national governments, and enterprises at all levels [7].
The residential end-use water sector plays a critical role in the urban water–energy–carbon emissions system. The research on water–energy–carbon emissions, which has been primarily focused on urban water systems, constitutes a significant research framework encompassing the following four main stages: withdrawal, distribution, usage, and wastewater treatment [8]. While past studies have predominantly concentrated on major consumers such as desalination plants and water treatment facilities, recent reports from California have emphasized the highest energy consumption intensity in the end-use water sector [9]. Approximately 70% of energy consumption related to water is concentrated in the end-use water sectors, with residential water usage constituting the highest energy consumption [10]. Notably, the energy consumption associated with water usage in end-use water sectors is increasing as advancements in technology and management lead to reductions in other energy consumptions. Within the residential end-use water sector, energy consumption linked to water heaters holds the highest proportion. A market survey on water heaters in the United States revealed that the energy expenditure for water heating in residential homes accounts for 17% of total household energy consumption, with this proportion steadily rising alongside improvements in residential living standards [11]. Moreover, it has been found that the residential end uses of water and related energy are deeply influenced by geographical, cultural, and socio-economic factors [12]. The effective utilization of water and energy resources in the residential end-use water sector is pivotal for urban sustainable development [13].
Research on residential water–energy consumption historically falls into three categories: quantifying household water–energy usage, analyzing the correlation between water (or energy) consumption and individual attributes, and developing optimized models for enhancing residential water–energy efficiency [4]. In the primary classification, Kenway closely monitored seven households using material flow analysis (MFA) to quantify water and energy flow, thereby exploring their relationship [14]. Abdallah used data to compute consumption probabilities, which are beneficial for the cost-effective water conservation decisions of utility providers [15]. In the second classification, Yu analyzed 1017 surveys in the second category, where they investigated how demographics and behaviors influence household water and energy use using statistical methods [16]. Different attributes significantly impact consumption, thereby necessitating tailored water and energy-saving measures. Arbues studied diverse water prices by focusing on residential water demand estimation and econometric issues [17]. In the third classification, Zhou employed water flow analysis to optimize urban water flow and energy consumption [18]. Escriva’s household model on water–energy–carbon footprints enhances policy insights yet overlooks the budget constraints affecting water-saving practices [19].
Residential water–energy consumption research boasts a rich historical lineage and holds vast potential for optimization and progression. Prior studies have mainly delved into the intricate correlations among water, energy, and carbon emissions, with minimal focus on integrated analyses involving carbon emissions [20]. Despite the intricate interdependencies among these elements, comprehensive investigations into their interactions remain scarce. Carbon emissions play a pivotal role in the urban water–energy–carbon framework, where energy and water resources form the foundational pillars of urban operations [21]. Notably, the carbon emissions that result from residential energy consumption associated with water usage can be substantial. Incorporating carbon emissions into integrated frameworks allows for a deeper comprehension of the interrelations among energy, water resources, and carbon emissions, thereby providing nuanced decision-making support for carbon reduction initiatives such as managing emission peaks. This integration also streamlines the identification and evaluation of potential carbon mitigation opportunities [22]. By quantifying the carbon emissions stemming from urban residential water and energy consumption, essential emission reduction areas and processes can be pinpointed, thereby leading to the development of tailored mitigation strategies.
This study gathered data on the water consumption among urban residents in Shanghai through a questionnaire survey. Shanghai represents the modernized large cities in China, and it is characterized by high water and energy consumption per capita. Analyzing the water–energy–carbon nexus in Shanghai can offer comprehensive insights for sustainable urban water and energy management. Subsequently, the water use structure was figured out and the relationship between water use and energy consumption was quantified based on the questionnaire data. Following this analysis, a season-differentiated water–energy–carbon nexus optimization model was introduced to optimize the water and energy consumption in urban households [23]. Through simulating the water-saving and energy-efficient behaviors among urban residents, this model aims to minimize water and energy consumption while maximizing carbon emission reductions. Seasonal variations are integrated into the model to identify the most effective conservation parameters for each season [24]. Moreover, Monte Carlo simulations were employed to simulate the realistic short-term conservation behaviors of residents, which were then incorporated into the optimization model for scenario analyses [15]. Ultimately, based on the simulation outcomes, recommendations are provided to the government and urban residents concerning water resources and energy consumption.
2. Materials and Methods
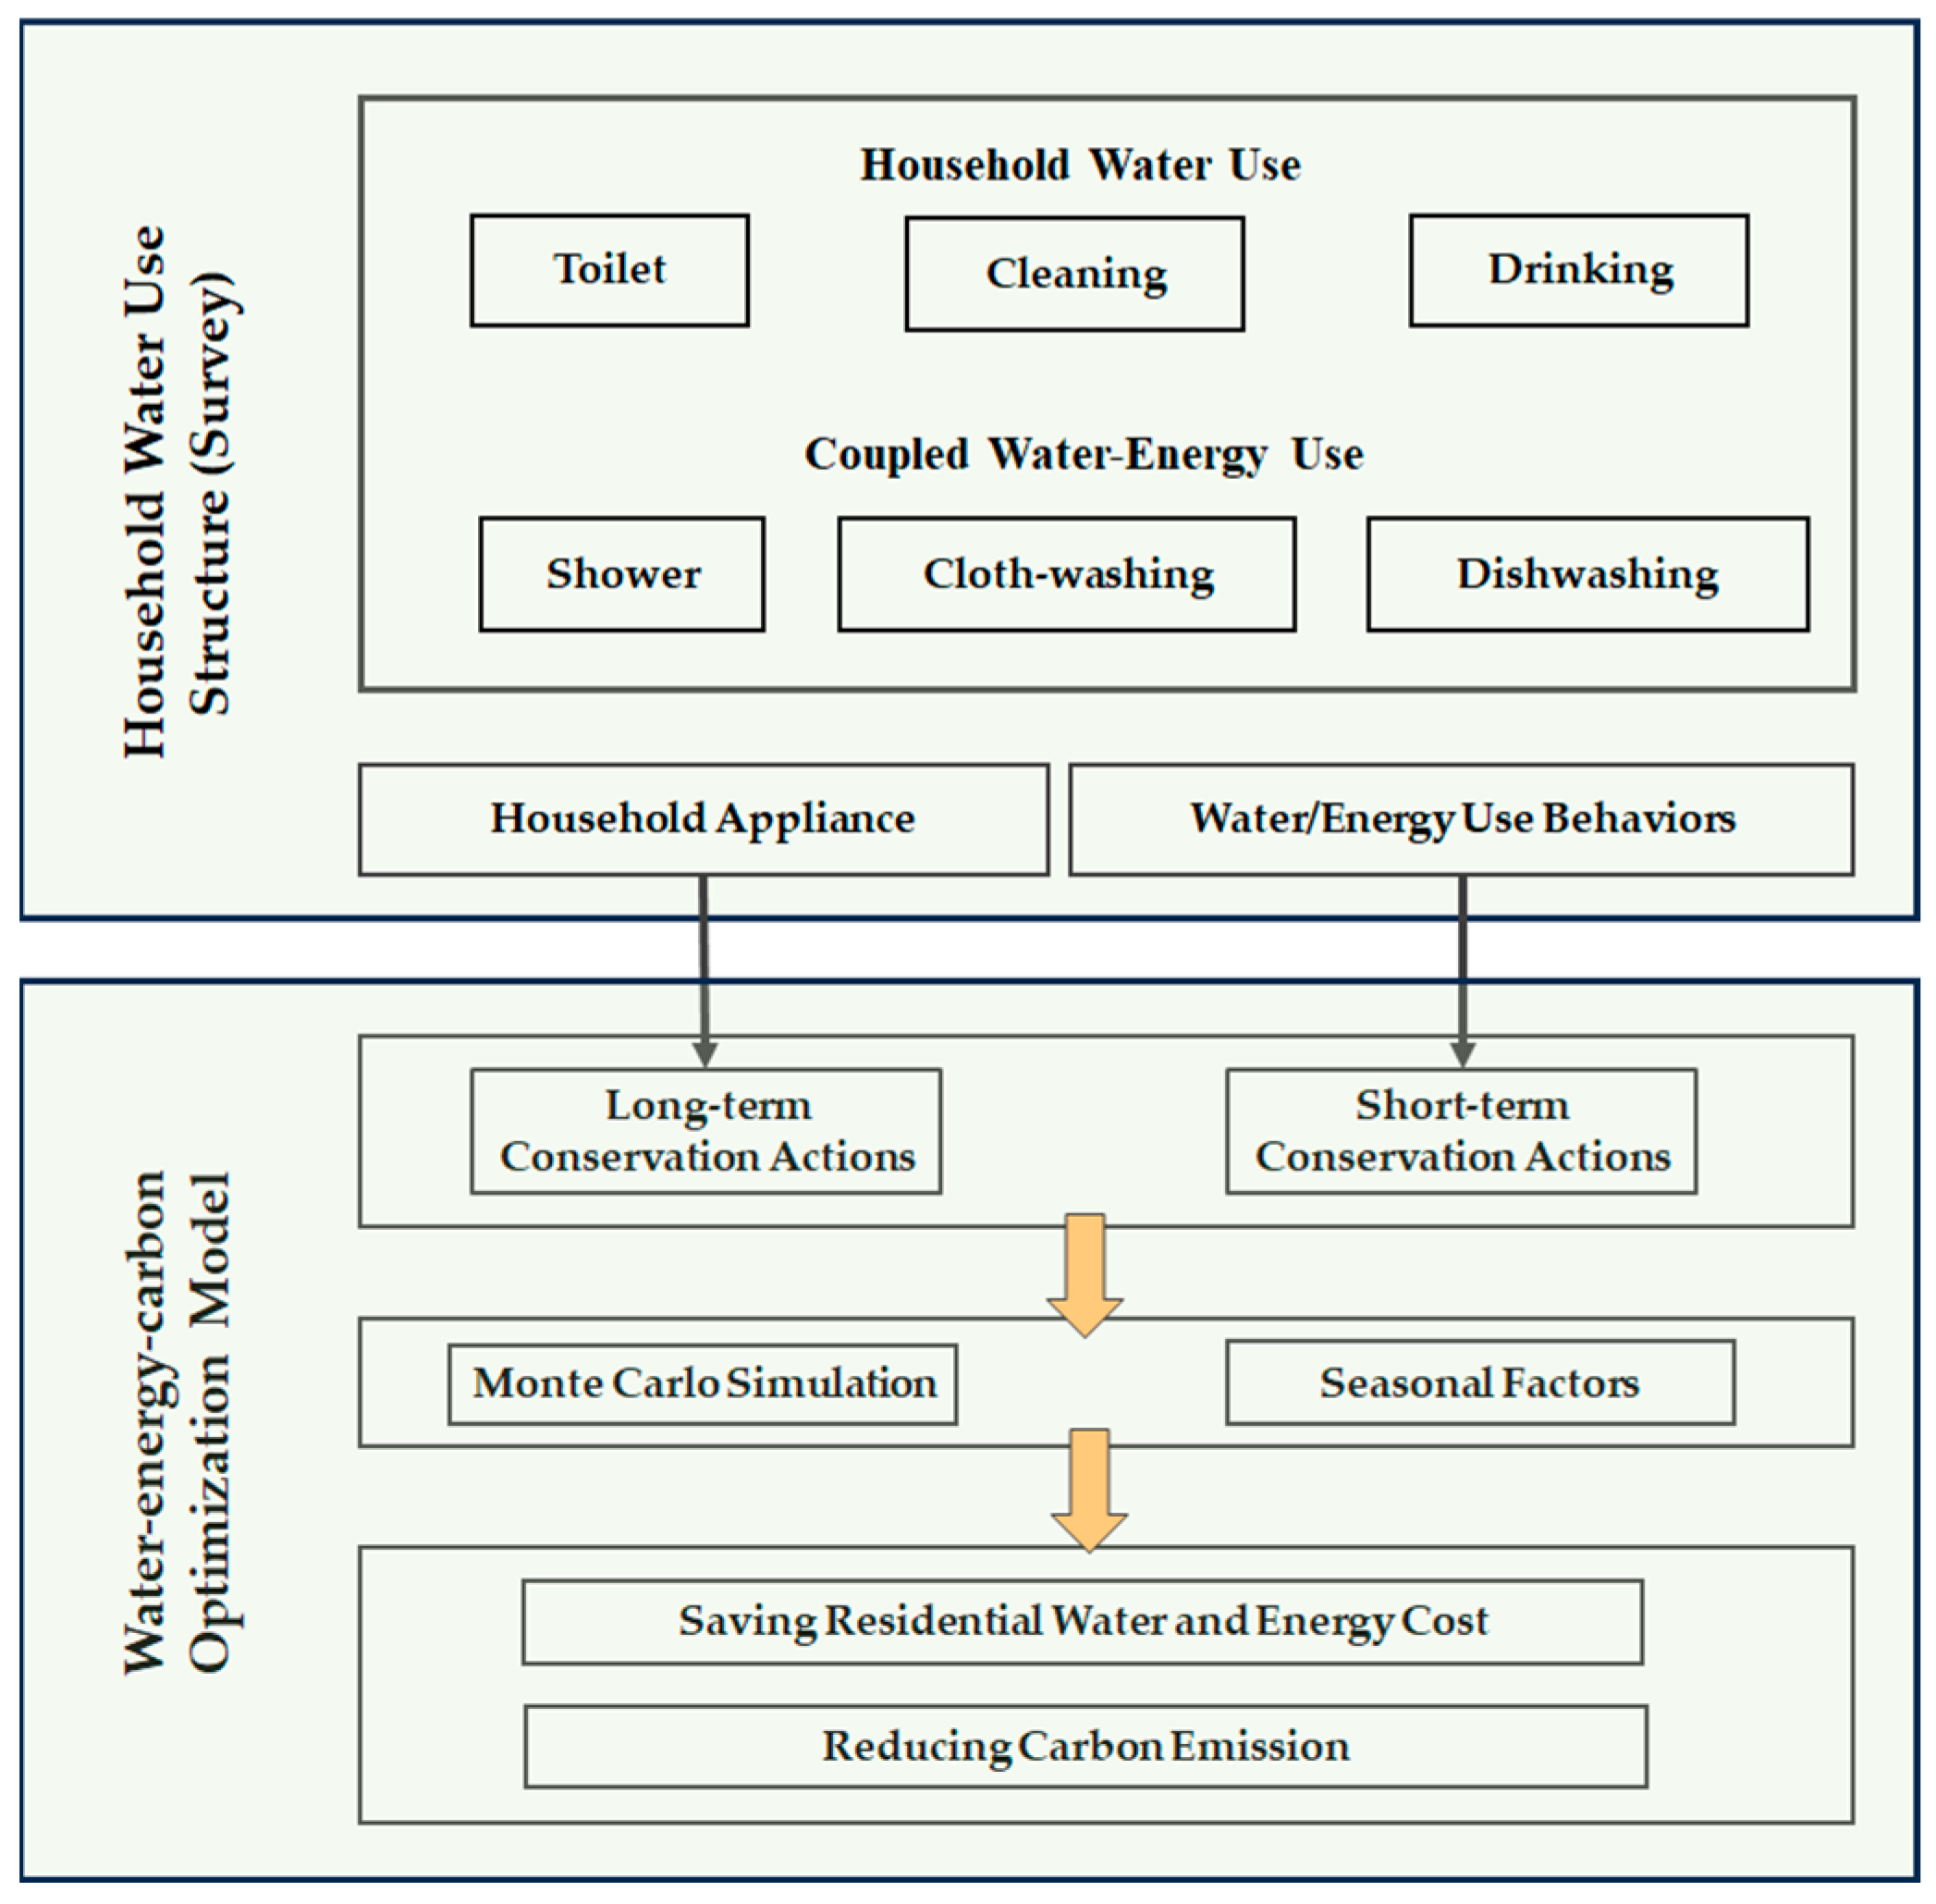
Figure 1 shows the overall organization of the study, which started with a questionnaire survey to collect data of the water uses and associated energy consumption of urban households in different districts of Shanghai, China. Using the survey data, the water-use structure of urban households and the relationships between water uses and energy consumption in urban households were quantified. Next, a water–energy–carbon nexus optimization model was set up to minimize water and energy consumption while maximizing carbon emission reduction through taking water and energy conservation actions in urban households. To incorporate seasonal factors, the model was assigned different parameter values for the same short-term conservation action for each of the four seasons. A Monte Carlo simulation framework was adopted to represent the uncertainties associated with the short-term conservation behaviors of residents, with the water–energy–carbon nexus optimization model being embedded in it, for scenario simulations. Finally, based on the simulation results, recommendations were made for managing urban water use and related energy consumption practices.
2.1. Study Area
Shanghai, with a total population of 24.89 million and 5.68 million households in 2022, is the largest city in China. The average per capita gross domestic product is CNY 172.16 thousand. The city has a total available water resource of 5.86 billion m3 annually, ranking 28th among the 31 provinces and municipalities in China. Shanghai’s annual per capita water usage of 140.6 m3 significantly falls below the national average of 455 m3. Considering the interconnected nature of water and energy resources, tackling the conflict stemming from rising water demand amidst limited water supply in Shanghai is of utmost significance for achieving sustainable development goals and for peaking carbon dioxide emissions by 2030.
2.2. Questionnaire Survey
The survey questionnaire consists of 48 questions categorized into three sections. The first section encompasses household characteristics, including household demography, education, age, household income, water expenses, and associated energy costs. The second section focuses on water conservation awareness, such as water consumption and reactions to incentives for water-efficient household appliances. Responses to these inquiries were quantified through the contingent valuation method. The third section looks into household water consumption patterns and the details of water-related appliances. The survey was conducted online in 16 municipal districts of Shanghai through the online survey company Credamo (Beijing, China), which has over three million registered survey participants domestically. Credamo has conducted other survey studies previously that have led to published research findings [25]. To enhance the reliability of the questionnaire data, controls were implemented in three key areas: quality assurance, sample attribute configurations, and response parameters. We first issued 50 questionnaires at the pre-survey stage, and we then improved the questionnaire design by analyzing the pre-survey results. At the formal survey stage, 500 questionnaires were distributed to participants by Credamo.
2.3. Optimization Model
The optimization model was parameterized with the data obtained from the questionnaire survey. The objective of this model was to minimize the economic costs of the water and energy consumption of Shanghai households by implementing water and energy conservation measures while maximizing reductions in carbon emissions. The model simulates residential water and related energy uses for the entire population of Shanghai, which totals 24.89 million. The categories of conservation measures that residents can implement are listed in Table 1. We divided the conservation measures into two categories: long-term measures and short-term measures. Short-term measures are influenced by seasonal factors. The uncertainties of the short-term behavior parameters were represented with probability distribution functions parameterized using survey data. Monte Carlo simulations were repeatedly conducted through randomly drawing values of those short-term behavior parameter values from the probability distribution functions to run the optimization model.
- (1)
- Objective function.
The objective function is shown below:
In Equation (1), is the total cost of household water and energy consumption after conservation measures were implemented in the households of Shanghai City. and are the annual total water and energy expenses, respectively. is the unit cost of long-term water conservation measures; is the unit cost of long-term energy conservation measures; and is the unit cost of long-term water–energy conservation measures.
and
are the unit costs of short-term water, energy, and water and energy conservation measures, respectively. The effectiveness and cost of short-term conservation measures are influenced by the season in a year. Moreover, we used the Monte Carlo simulation approach to incorporate the uncertainties of the short-term conservation measure parameter values. The probability density function (PDF) of the cost of a short-term conservation measure was found to observe the exponential distribution as follows:
where represents the cost of a short-term conservation measure, and a and b are the location and scale parameters of the PDF, respectively. The associated cumulative distribution function (CDF) of the above PDF is as follows:
We conducted Kolmogorov–Smirnov tests on the distribution function of the short-term actions, thereby verifying that the p-values for each function were greater than 0.05. The results indicate a good fitting between the survey data and the distribution functions. The parameter values of the PDF function for short-term conservation measures are shown in Table 2.
- (2)
- Constraints and supplementary equations.
In Equation (4), is the annual water saving and is the original annual water use of Shanghai households. Water saving includes long- and short-term water saving, namely
where is the water saving achieved through short-term water conservation measures, and represents the water saving achieved through long-term water conservation measures. Moreover, the expression of is given as
where refers to the unit water conservation effectiveness of a short-term water conservation measure, and represents the unit water conservation effectiveness of short-term water and energy conservation measures.
In Equation (7), is annual energy saving, and is the original annual energy use of Shanghai households. includes similar components as , namely
in which the expression of short-term energy-saving term is
where represents the energy saving achieved through short-term energy conservation measures, and represents the energy saving achieved through long-term energy conservation measures. represents the unit energy conservation effectiveness of the short-term energy conservation measures, and represents the unit energy conservation effectiveness of the short-term water and energy conservation measures.
where , , and represents the resources (i.e., water or energy) saved by adopting certain short-term conservation measures. The index represents short-term water conservation measures; represents short-term energy conservation measures; and represents short-term water–energy conservation measures. These short-term conservation measures are dependent on certain long-term conservation measures. Therefore, the unit conservation effectiveness of these short-term measures vary according to actual circumstances. represents the unit effectiveness of short-term water conservation measures without certain long-term measures. represents the unit effectiveness of short-term water conservation measures with certain long-term measures being implemented. and represent the quantity of corresponding short-term water-saving behaviors.
where represents reduced carbon emissions due to the household energy saving associated with water and water-related energy conservation at the household level, and represents the target of carbon emission reduction in Shanghai. The carbon emission reduction per household in Shanghai is expected to exceed that of Shenzhen [26]. The expression of is shown below:
represents the carbon emission reduction effectiveness of the long-term energy conservation measures. refers to the carbon emission reduction effectiveness of the long-term water and energy conservation measures. represents the carbon emission reduction effectiveness of the short-term energy conservation measures. represents the carbon emission reduction effectiveness of the short-term water and energy conservation measures.
3. Results and Discussion
3.1. Analysis of the Questionnaire Survey Data
A total of 496 valid questionnaires were received, encompassing the households in 16 municipal districts in Shanghai, with statistics by district, as shown in Table 3. The effective response rate of the questionnaire survey was 90.18%. Notably, the samples from Pudong and Fengxian districts exceeded 100 each, with 132 samples from the Pudong New Area and 100 samples from Fengxian District. By contrast, Chongming District had only two completed questionnaires received; therefore, it was dropped from the analysis. The sample sizes in the remaining 5 municipal districts varied from 5 to 100 questionnaires.
Figure 2 illustrates the distribution of the water consumption intensity across the municipal districts of Shanghai. Hongkou District and Yangpu District exhibited the lowest water consumption intensity, with monthly average water bills amounting to CNY 72.75 and CNY 73.00, respectively. In contrast, the Jing’an, Changning, and Minhang districts demonstrated the highest water consumption intensity, with monthly average water bills of CNY 106.20, CNY 106.70, and CNY 109.10, respectively. Notably, Putuo District, with a monthly average water bill of CNY 105.50, was dropped from the comparative analysis due to data insufficiency. Generally, the water-use intensity was found to be higher in the central areas than in the suburb areas.
The household water-use structure in Shanghai is illustrated in Figure 3. These results are in line with the results reported by most studies included in the review conducted by Mazzoni [12]. Among the six categories of water consumption, shower water use had the highest proportion at 30.08%, corresponding to a daily average use of 46.95 L per person; the shares of toilet water and cloth washing water were 20.33% and 19.96%, with their quantities being very close at 31.72 L and 31.15 L per person, respectively, while cleaning and drinking water use had relatively small shares, accounting for 9.83% and 4.20%, respectively. Governmental statistics reveal that the average household water consumption in Shanghai amounts to 200.26 m3/year, with structured water usage measuring at 192.50 m3/year. The difference between the two accounts for 7.76 m3/year, representing a ratio of 3.68%. This demonstrates the basic alignment of the residential water expenditure structure with the research hypothesis.
3.2. Residential Water–Energy–Carbon Emission Optimization Results
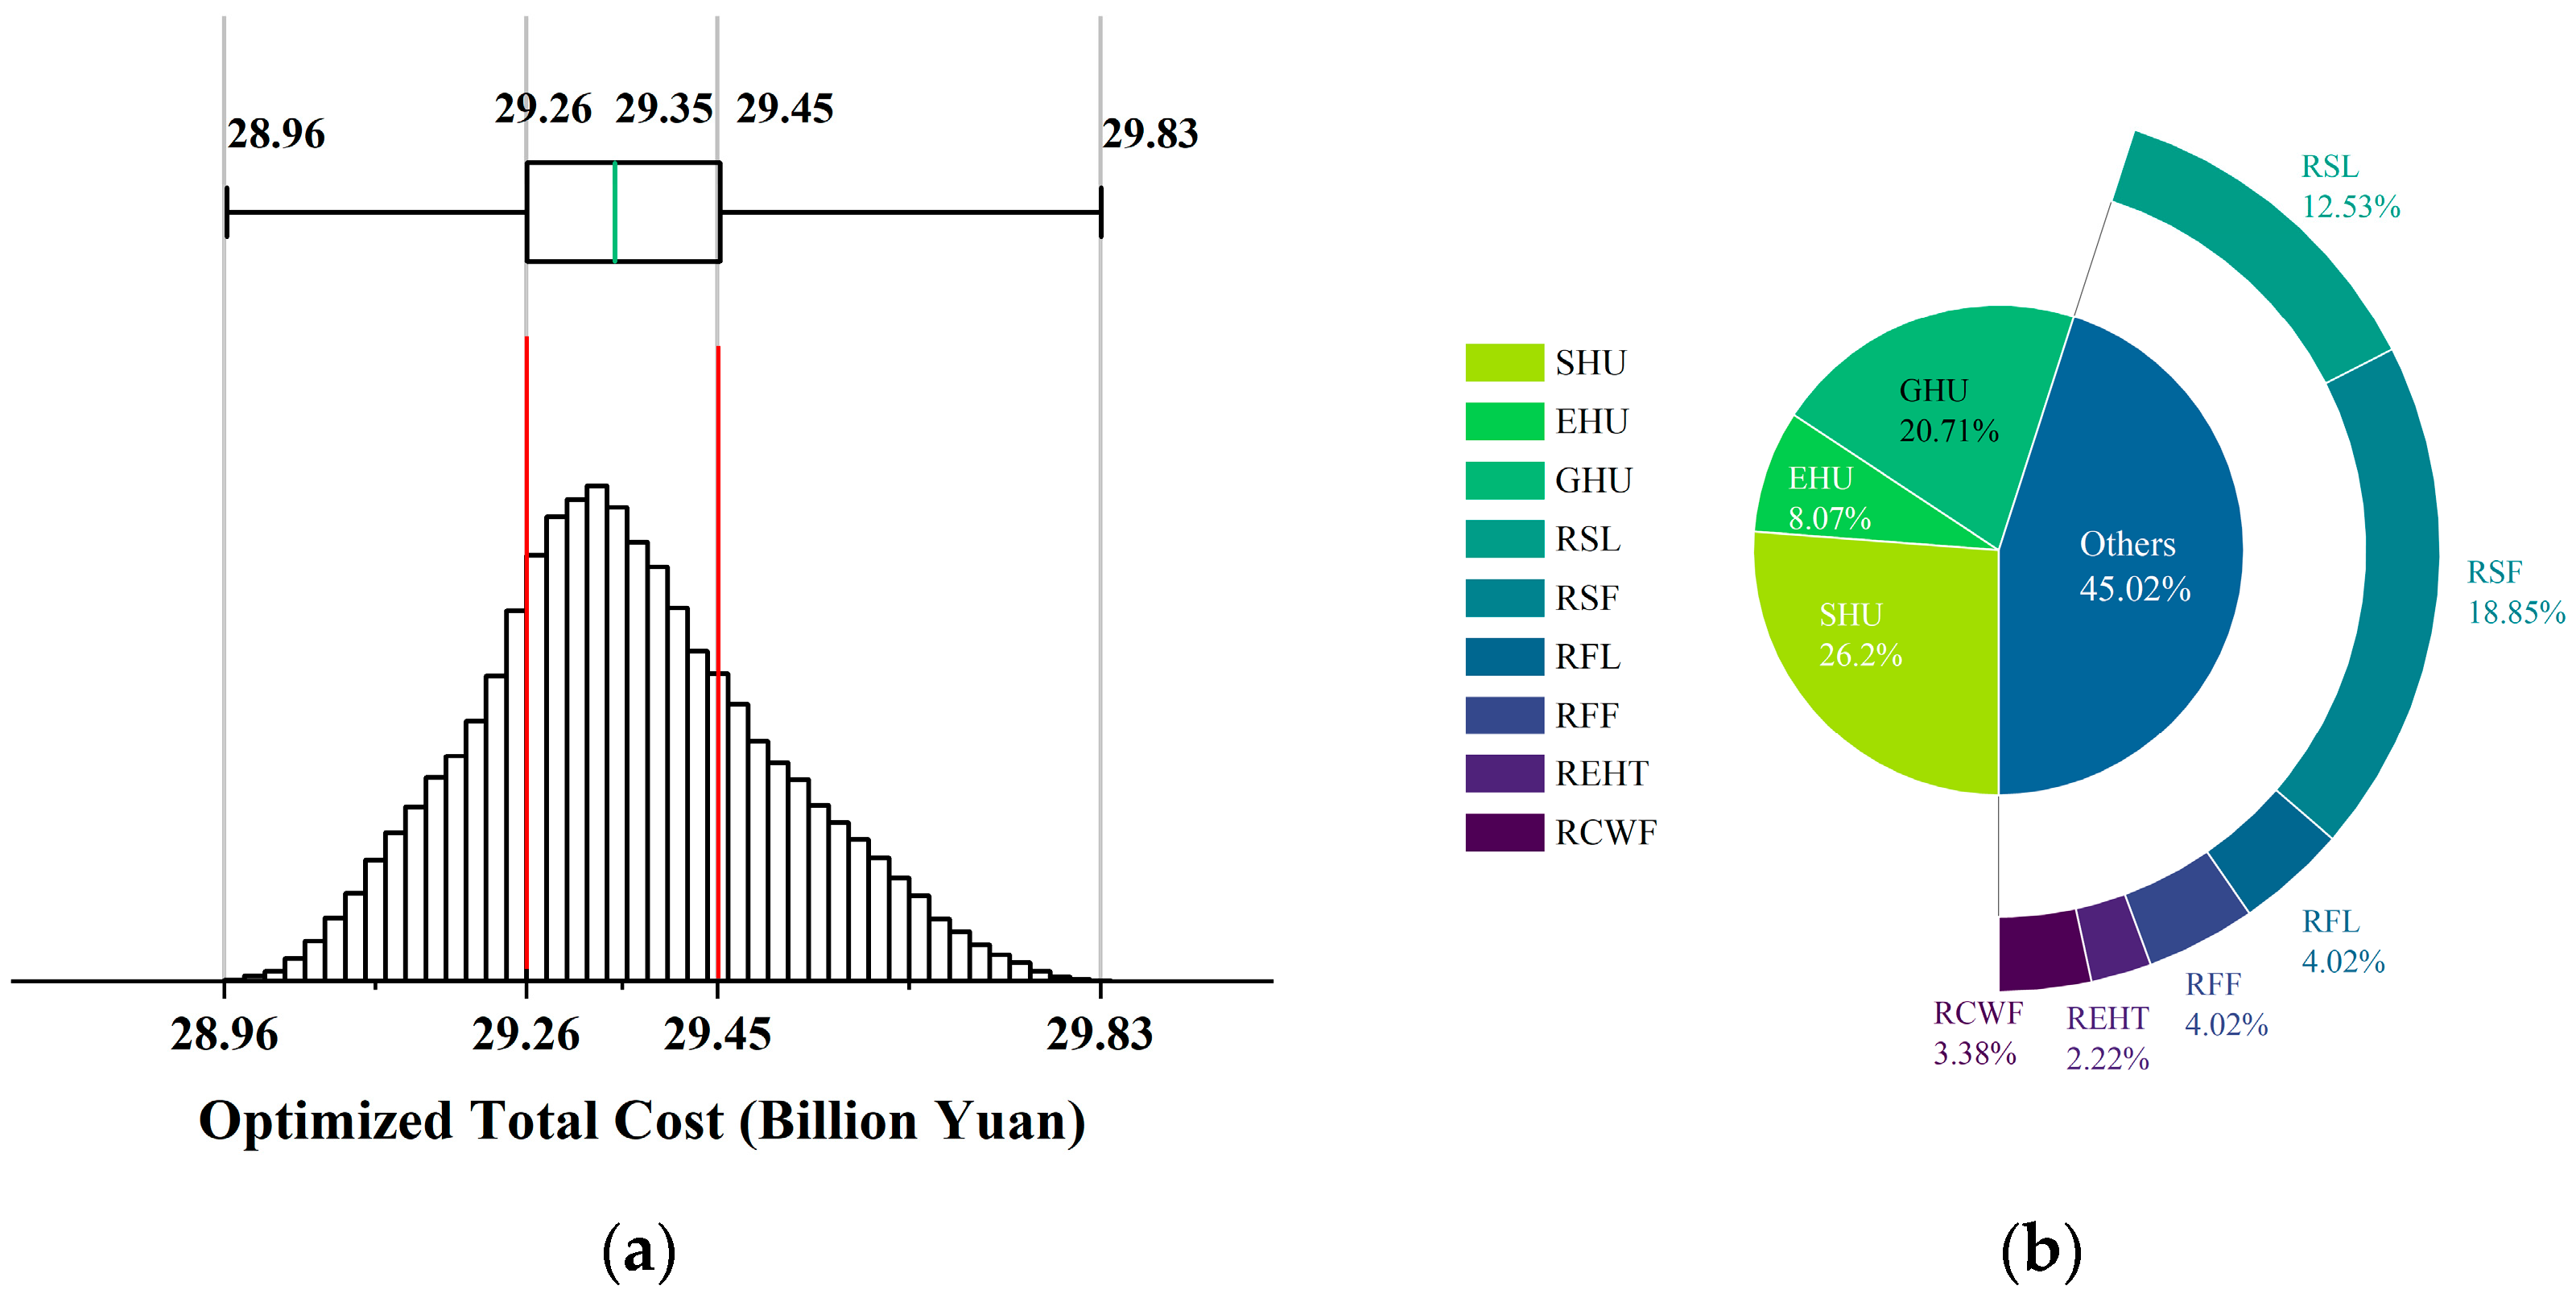
With Monte Carlo simulations, the urban residential water–energy–carbon optimization model simulated all of the residential households in Shanghai, where 100 thousand iterations were conducted, thereby producing a dataset containing 100 thousand entries. The distribution of the optimized household energy costs in Shanghai is shown in Figure 4a. The lowest overall water and energy cost for the Shanghai households was CNY 28.96 billion, thus indicating a 4.89% cost reduction due to optimization compared to the original cost of CNY 30.45 billion, which resulted in an average annual saving of CNY 202.1 per household. In contrast, the highest household energy expenditure in the city amounted to CNY 298.3 billion, thus representing a 2.05% cost reduction due to optimization, which led to an average yearly energy cost saving of CNY 84.60 per household.
The median total cost for the Shanghai households amounted to CNY 29.35 billion, reflecting a 3.61% cost reduction due to optimization compared to the original total household energy costs in the city. On average, each household could save CNY 149.42 in energy costs. Upon further breakdown by sector, the optimized total water cost for the households in Shanghai stood at CNY 68.56 billion, thereby showcasing a 15.92% cost reduction. The total electricity expenditure amounted to CNY 169.64 billion, thus demonstrating a 1.10% cost reduction; meanwhile, the natural gas costs totaled CNY 47.69 billion, thereby exhibiting a 7.22% cost reduction.
Figure 4b shows the cost saving for urban households in Shanghai in residential water and energy uses through adopting each of the water- or energy-saving measure derived from the optimization model. The abbreviation of each conservation measure is given in Table 1. Overall, the long-term measure benefits accounted for 54.98%, whereas the short-term measures accounted for 45.02%. Long-term saving measures included the updating of showerheads, electric water heaters, and gas water heaters, which represented 26.20%, 8.07%, and 20.71%, respectively. Short-term measures included reducing shower duration and frequency, minimizing faucet length and frequency, reducing electric water heater temperatures, and reducing cloth washing frequency. Specifically, the percentages for reducing shower duration and frequency, which played vital roles in total cost savings, were 12.53% and 18.85%, respectively.
Figure 5 illustrates the water and energy cost composition in the Shanghai households, including water, electricity, natural gas, and saving behavior costs. Water costs ranged from CNY 6.66 billion to CNY 7.38 billion. The water cost with the highest frequency was CNY 6.94 billion, with a frequency number of 15.43%. For electricity costs, the range was from CNY 16.96 billion to CNY 17.10 billion. The electricity cost of CNY 16.96 billion had the highest frequency of 79.73%. Natural gas costs were distributed among three specific values, with the high frequency at CNY 4.77 billion, CNY 4.82 billion, and CNY 4.78 billion. The conservation cost observed a normal distribution, with a mean of 0.735 and a standard deviation of 0.088. Overall, the electricity costs and natural gas costs showed a concentrated distribution, while the water costs and costs related to optimized conservation measures exhibited a normal distribution.
The correlation coefficients between the short-term conservation measures and water–energy savings are shown in Figure 6, where positive values indicate a positive correlation, and negative values indicate a negative correlation. We categorized the savings of short-term conservation measures into three parts: water savings, electricity savings, and gas savings. For water savings, five types of conservation behaviors, including reducing shower duration, reducing shower frequency, reducing faucet frequency, reducing faucet duration, and reducing cloth washing frequency, have the correlation coefficients of −0.64, −0.54, −0.21, −0.2, and −0.16, respectively. For electricity saving, reducing cloth washing frequency had the largest influence, with a correlation coefficient value of −0.9. For gas saving, the correlation coefficient with reducing gas heater temperature was −0.94.
3.2.1. Seasonal Factors
Figure 7a displays the season-specific distribution of the cost savings due to taking short-term conservation measures in the households of Shanghai. Overall, the average effectiveness of the short-term conservation measures in spring, summer, and fall were close, with values of CNY 1315 million, CNY 1330 million, and CNY 1315 million, respectively. In contrast, the average effectiveness in winter was relatively lower at CNY 841 million.
Figure 7b shows the correlations between seasonal saving effectiveness and short-term conservation measures. The size-differentiated red and blue circles in the figure reflect the strength of correlation between two parameters. The most strongly correlated parameter to seasonal saving effectiveness in spring and fall was reducing shower duration, with a correlation coefficient of −0.61. Moreover, the correlation coefficients of reducing shower frequency and reducing cloth washing frequency were −0.59 and −0.27, respectively, which ranked 2nd and 3rd. During the summer, reducing shower frequency and reducing cloth washing frequency ranked 1st and 2nd in influencing conservation effectiveness, with correlation coefficients of −0.56 and −0.45, respectively. In winter, the correlation coefficient of reducing shower frequency and reducing shower duration were −0.52 and −0.49, respectively.
To summarize, the crucial factors influencing seasonal saving effectiveness involved reducing shower duration, reducing shower frequency, and decreasing cloth washing frequency.
3.2.2. Carbon Emission Reduction
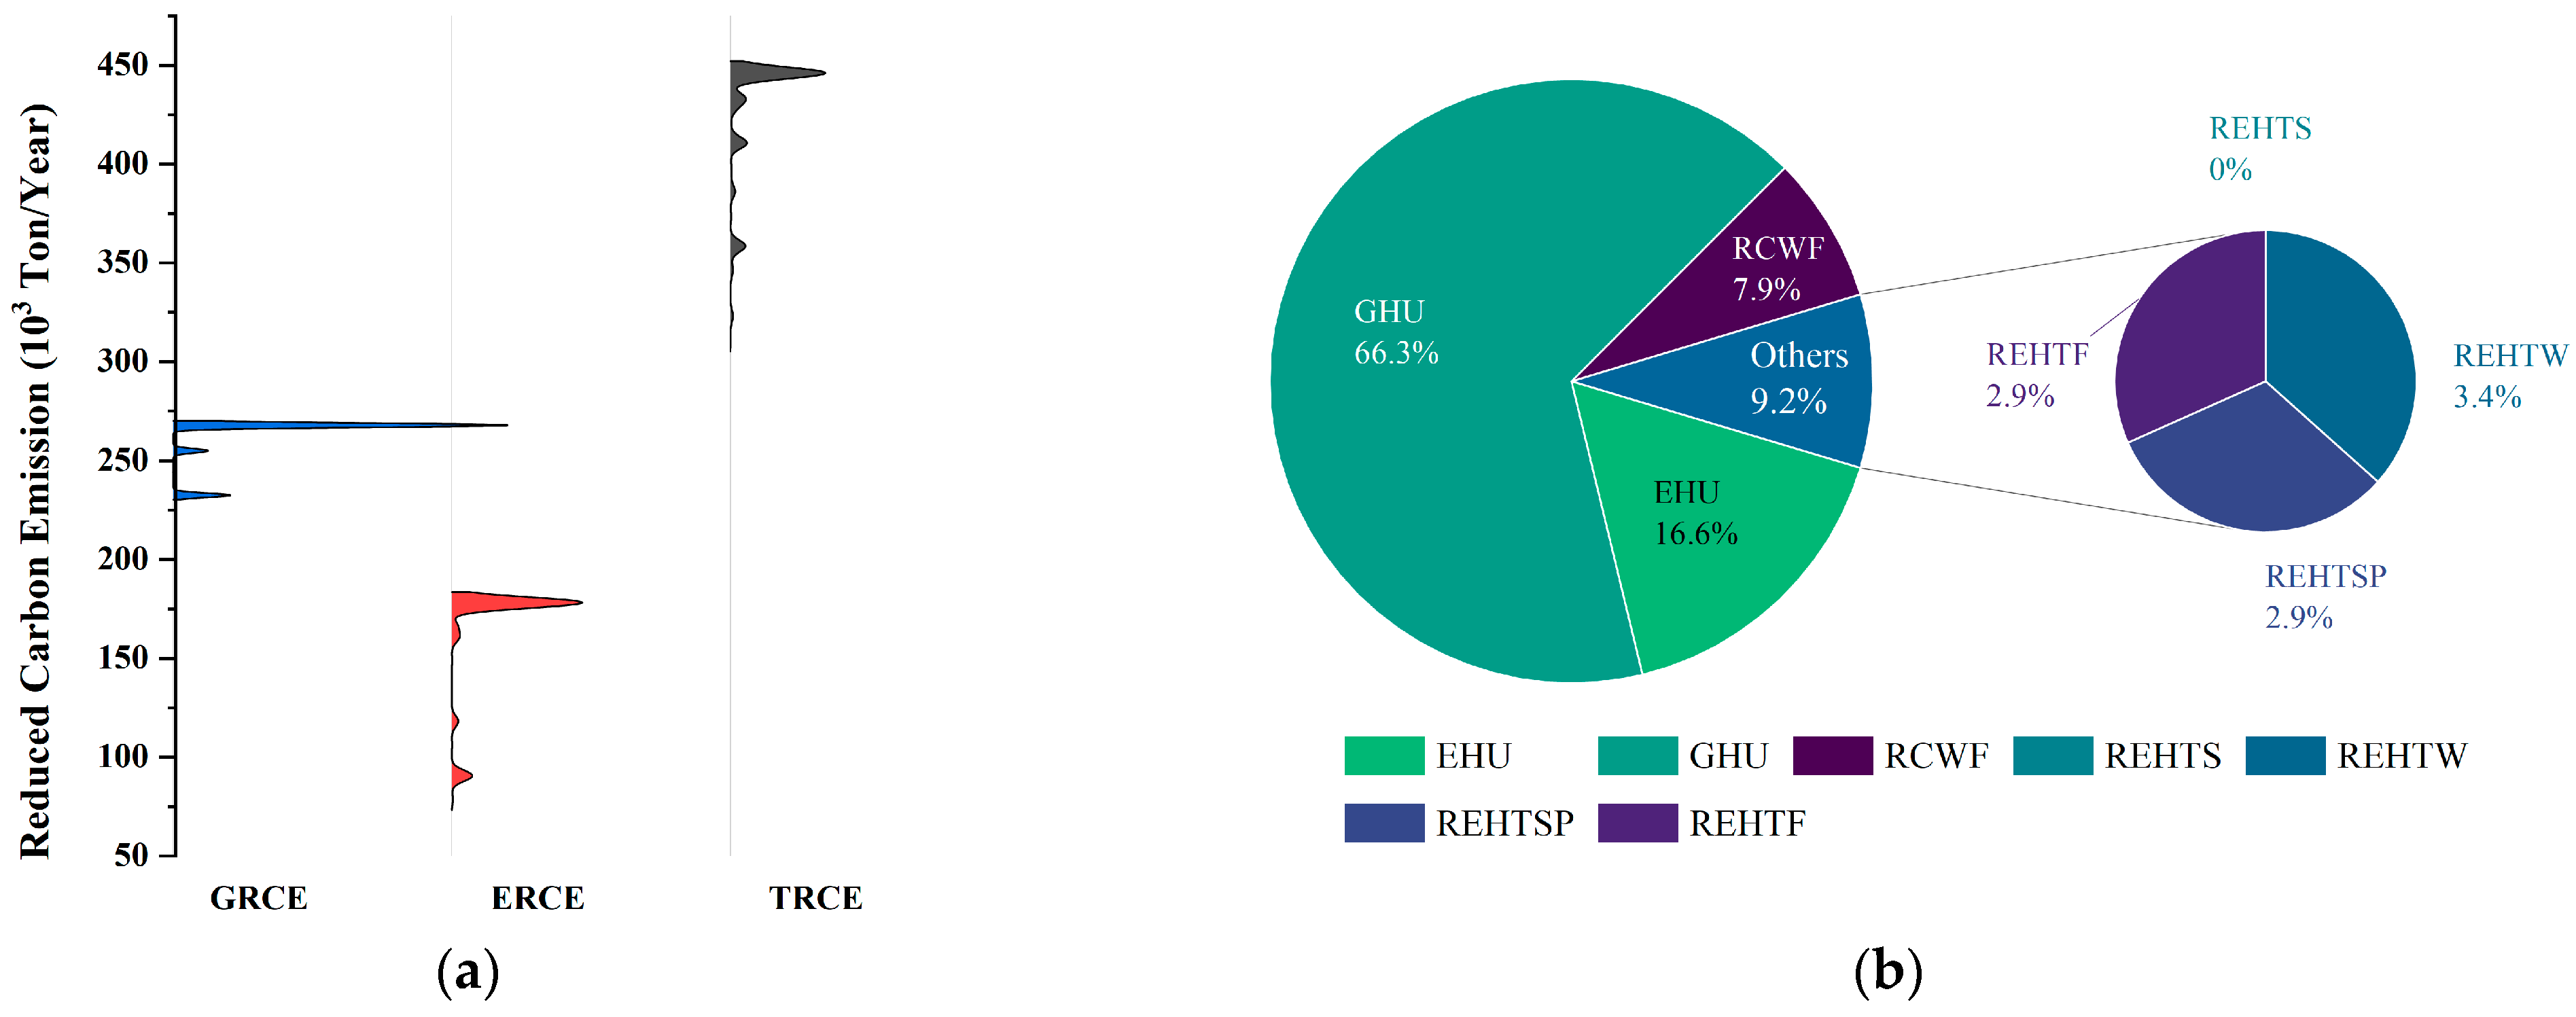
In the water–energy–carbon nexus optimization model for urban residents in Shanghai, carbon emission reduction targets were established, where the aim was for households to achieve carbon emission reduction goals. Figure 8a illustrates the distribution of carbon-reduction potential of Shanghai households. The average carbon emissions reduced by electricity conservation measures was 16.38 thousand tons (ranging from 7.87 to 17.82 thousand tons) of equivalent CO2. The average carbon emission reductions due to gas conservation measures was 26.21 thousand tons. The distribution ranged from 23.25 to 26.79 thousand tons. The total reduced carbon emission distribution ranged from 31.12 to 44.61 thousand tons, with an average value of 42.59 thousand tons. The average carbon emission reduction in Shanghai per household was 57.74 kg.
We disaggregated the carbon emission reduction to determine the efficiency of all types of conservation measures, as illustrated in Figure 8b. We explain the abbreviations of each type of conservation behavior in Table 1. Long-term behaviors included updating electric water heaters, gas water heaters, washing machines, and dishwashers, while short-term behaviors involved reducing the temperature of electric water heaters, reducing the temperature of the gas water heaters, and decreasing cloth washing frequency. Overall, the long-term conservation behaviors resulted in an 82.9% reduction in carbon emissions, while short-term conservation behaviors led to a decrease of 17.1% in carbon emissions. Among the long-term conservation behaviors, gas heater updating reduced 933.99 tons of carbon emissions, accounting for 66.3%; following this was electric heater updating, which resulted in a decrease of 233.34 tons of carbon emissions, representing 16.6% of total carbon reduction. Regarding short-term behaviors, reducing the temperature of electric water heaters reduced carbon emissions by 9.3%, with corresponding percentages for spring, summer, fall, and winter being 2.9%, 0%, 2.9%, and 3.4%, respectively; reducing cloth washing frequency could lead to a 7.9% decrease in carbon emissions, but this predominantly occurs during summer. From a seasonal perspective, summer possesses the greatest potential for saving carbon emissions.
A study for Shenzhen found that residential electricity consumption accounted for approximately 16% of the total electricity consumption in the city, thus making it a crucial component in the carbon-inclusive ecosystem [26]. Between June 2022 and June 2023, there were 805,000 household residents in Shenzhen that opened carbon accounts, and they collectively achieved a CO2 emission reduction of 12,000 tons through engaging in carbon reduction practices. On average, this amounts to a reduction of 14.91 kg of CO2 emissions per household. The optimized carbon emission reduction derived from our optimization model was 57.74 kg per household in Shanghai, which is 3.87 times the level of carbon emission reduction per household reported for Shenzhen.
3.3. Potential Improvements in Future Research
This study explored the interconnections between urban residential water and energy uses by building an optimization model with innovative strategies to tackle urban water- and energy-saving challenges. Nonetheless, several potential improvements are worth further exploration in future research endeavors:
- (1)
- Data collection. The questionnaire survey was conducted online due to the COVID-19 pandemic. Although the 496 valid sets of responses displayed reasonable heterogeneity and distribution across participated households in different districts, an offline survey with the same questionnaire may have broader coverage and diversity. For instance, Chongming District lacked a reliable sample size in current survey results, which potentially impacted the fidelity of the study results. In subsequent research endeavors, we hope to conduct offline surveys to augment sample size and widen the coverage of surveys, thereby enhancing the reliability and representativeness of research findings.
- (2)
- Water-saving awareness quantification. Subjective biases may be introduced into the survey data with respect to water-saving awareness. Alternative methods for quantifying water-saving awareness may be worth further exploration to enhance the reliability of quantified awareness parameters.
- (3)
- Factors influencing water and energy use. Seasonal factors were considered in this study; however, other factors that influence residential water and energy use, such as socioeconomic factors, geographical location, and the climate, require further analysis.
4. Conclusions
In this study, we built a season-differentiated urban residential water–energy–carbon nexus optimization model to explore the potential of water- and energy-saving, as well as associated carbon emission reduction. A survey on household characteristics, including demographic, education and income aspects, household water appliances, and water- and energy-using behaviors were conducted in Shanghai, China, to collect data for model parameterization. Moreover, the optimization model was embedded into a Monte Carlo simulation framework to account for the probability distributions of short-term conservation behavioral parameters. The following are concluded based on survey data and modeling results:
- (1)
- The survey data revealed that the intensities of water uses are higher in the central areas than suburb areas in Shanghai. At the household level, bathing, toilet flushing, and laundry are the top three water-using activities.
- (2)
- The water–energy–carbon nexus optimization model results showed an annual potential cost savings of CNY 149.42 per household in Shanghai, reflecting a 15.92% reduction in water cost, 7.22% reduction for gas cost, and 1.10% reduction for electricity cost. Overall, the long-term conservation measures were more effective than short-term ones. Water conservation was mostly effective for energy-saving, followed by saving gas and electricity. Specifically, showerhead upgrades led to the highest savings at 26.20%, followed by gas water heater upgrade at 20.71%. For short-term conservation behaviors, reducing shower frequency and duration accounted for 18.85% and 12.53% of energy saving, which were ranked third and fourth, respectively. Seasonal factors influenced the effectiveness of conservation efforts, with summer presenting the greatest opportunity for water and energy conservation at the household level.
Despite these findings, the study was subject to several limitations. Due to the COVID-19 pandemic, we only collected 496 valid questionnaires online, thus resulting in a relatively small survey sample size. The representativeness and reliability of survey data can be improved by involving a larger number of survey participants and by conducting in-person surveys. Secondly, implementing the optimization model on a larger scale provides opportunities to illustrate broader environmental and economic benefits. Socioeconomic, geographical, cultural, and climatic factors are key aspects influencing water and energy use. Considering those main influencing factors can enhance the wide applicability of the optimization model [12].
Overall, the empirical results derived from the questionnaire survey and the optimization model represent a promising integrated approach for analyzing urban water and energy conservation, as well as associated carbon emission reduction, at the household level. The results provide useful insights for improving water and energy conservation at the household level, which can be realized with appropriate incentives created by utilities or through governmental policies. The findings are also useful for practitioners to better understand household water and energy conservation potentials.
Author Contributions
Writing—original draft preparation, J.Z.; review and editing, T.Z. All authors have read and agreed to the published version of the manuscript.
Funding
This study was supported by the “Water–Energy–Food–Ecosystem Nexus in the Yangtze River Delta” project funded by Jiaxing City, Zhejiang Province, China, the National Key Research and Development Program of China (2020YFA0608603), and the Dynamic Research Enterprise for Multidisciplinary Engineering Science of the ZJU-UIUC Joint Research Center through the “Center for Infrastructure Resilience in Cities as Livable Environments (CIRCLE)”.
Institutional Review Board Statement
Ethical review and approval were waived for this study due to the logical legislation and institutional requirements, as well as due to the fact that this study involved no more than minimum risk to the subjects.
Informed Consent Statement
Informed consent was obtained from all subjects involved in the study.
Data Availability Statement
The data presented in this study are available on request from the corresponding author.
Conflicts of Interest
The authors declare no conflicts of interest.
Nomenclature
| Variable | Description, Unit |
| Z | Total cost of household water and energy consumption after conservation actions implemented, CNY. |
| Annual water expense, CNY. | |
| Annual energy expense, CNY. | |
| Annual water saving of Shanghai households, CNY/household. | |
| Original water use of Shanghai households, CNY/household. | |
| Water saving of short-term water conservation actions, CNY/household. | |
| Water saving of long-term water conservation actions, CNY/household. | |
| Annual energy saving of Shanghai households, kgce 1. | |
| Original energy use of Shanghai households, kgce. | |
| Energy saving of short-term energy conservation actions, kgce. | |
| Energy saving of long-term energy conservation actions, kgce. | |
| Reduced carbon emission associated with household water and energy uses by implementing conservation actions, kgCO2. | |
| Target of carbon emission reduction in Shanghai, kgCO2. | |
| Number of households taking short-term water conservation measures, household. | |
| Number of households taking short-term energy conservation measures, household. | |
| Number of households taking short-term water and energy conservation measures, household. | |
| Number of households taking long-term water conservation measures, household. | |
| Number of households taking long-term energy conservation measures, household. | |
| Number of households taking long-term water and energy conservation measures, household. | |
| Number of households taking short-term water conservation measures when certain long-term measures are conducted, household. | |
| Number of households taking short-term water conservation measures when certain long-term measures are not conducted, household. | |
| Number of households taking short-term energy conservation measures when certain long-term measures are conducted, household. | |
| Number of households taking short-term energy conservation measures when certain long-term measures are not conducted, household. | |
| Number of households taking short-term water and energy conservation measures when certain long-term measures are conducted, household. | |
| Number of households taking short-term energy conservation measures when certain long-term measures are not conducted, household. | |
| Parameter | Description, Unit |
| Unit cost of short-term water conservation actions, CNY/household. | |
| Unit cost of short-term energy conservation actions, CNY/household. | |
| Unit cost of short-term water and energy conservation actions, CNY/household. | |
| Unit cost of long-term water conservation actions, CNY/household. | |
| Unit cost of long-term energy conservation actions, CNY/household. | |
| Unit cost of long-term water–energy conservation actions, CNY/household. | |
| Unit water conservation efficiency of short-term water conservation actions, m3/household. | |
| Unit water conservation efficiency of short-term water and energy conservation actions, m3/household. | |
| Unit energy conservation efficiency of short-term energy conservation actions, kgce/household. | |
| Unit energy conservation efficiency of short-term water and energy conservation actions, kgce/household. | |
| Unit efficiency of short-term water conservation actions with certain long-term actions being implemented, m3/household. | |
| Unit efficiency of short-term water conservation actions without certain long-term actions being implemented, m3/household. | |
| Unit efficiency of short-term energy conservation actions with certain long-term actions being implemented, kgce/household. | |
| Unit efficiency of short-term energy conservation actions without certain long-term actions being implemented, kgce/household. | |
| Unit efficiency of short-term water and energy conservation actions with certain long-term actions being implemented, kgce/household. | |
| Unit efficiency of short-term water and energy conservation actions without certain long-term actions being implemented, kgce/household. | |
| Reduced carbon emission efficiency of long-term energy conservation actions, kgCO2/kwh or kgCO2/m3. | |
| Reduced carbon emission efficiency of long-term water and energy conservation actions, kgCO2/kwh or kgCO2/m3. | |
| Reduced carbon emission efficiency of short-term energy conservation actions, kgCO2/kwh or kgCO2/m3. | |
| Reduced carbon emission efficiency of short-term water and energy conservation actions, kgCO2/kwh or kgCO2/m3. | |
| 1 “kgce” means kilogram of coal equivalent (energy intensity). | |
References
- Lishan, Z. Analysis on the current situation and optimization countermeasures of water conservation management in residential quarters of Shanghai. Evironment Manag. 2020, 2, 209–210. [Google Scholar] [CrossRef]
- Escriva-Bou, A.; Lund, J.R.; Pulido-Velazquez, M.; Hui, R.; Medellín-Azuara, J. Developing a water-energy-GHG emissions modeling framework: Insights from an application to California’s water system. Environ. Model. Softw. 2018, 109, 54–65. [Google Scholar] [CrossRef]
- Scott, C.A.; Pierce, S.A.; Pasqualetti, M.J.; Jones, A.L.; Montz, B.E.; Hoover, J.H. Policy and institutional dimensions of the water-energy nexus. Energy Policy 2011, 39, 6622–6630. [Google Scholar] [CrossRef]
- Meng, F.; Liu, G.; Liang, S.; Su, M.; Yang, Z. Critical review of the energy-water-carbon nexus in cities. Energy 2019, 171, 1017–1032. [Google Scholar] [CrossRef]
- Hardy, L.; Garrido, A.; Juana, L. Evaluation of Spain’s water-energy nexus. Int. J. Water Resour. Dev. 2012, 28, 151–170. [Google Scholar] [CrossRef]
- Beal, C.D.; Bertone, E.; Stewart, R.A. Evaluating the energy and carbon reductions resulting from resource-efficient household stock. Energy Build. 2012, 55, 422–432. [Google Scholar] [CrossRef]
- Haseeb, M.; Kot, S.; Iqbal Hussain, H.; Kamarudin, F. The natural resources curse-economic growth hypotheses: Quantile–on–Quantile evidence from top Asian economies. J. Clean. Prod. 2021, 279, 123596. [Google Scholar] [CrossRef]
- Guan, D.; Hubacek, K. A new and integrated hydro-economic accounting and analytical framework for water resources: A case study for North China. J. Environ. Manag. 2008, 88, 1300–1313. [Google Scholar] [CrossRef] [PubMed]
- Griffiths-sattenspiel, B.; Wilson, W. The Carbon Footprint of Water. 2009. Available online: http://eec.ucdavis.edu/events/documents/water-energy_rivernetwork_carbon-footprint-of-water.pdf (accessed on 22 December 2021).
- Klein, G.; Krebs, M. California’ s Water–Energy Relationship Final Staff Report; Stanford University: Stanford, CA, USA, 2005. [Google Scholar]
- Vieira, A.S.; Beal, C.D.; Stewart, R.A. Residential water heaters in Brisbane, Australia: Thinking beyond technology selection to enhance energy efficiency and level of service. Energy Build. 2014, 82, 222–236. [Google Scholar] [CrossRef]
- Mazzoni, F.; Alvisi, S.; Blokker, M.; Buchberger, S.G.; Castelletti, A.; Cominola, A.; Gross, M.P.; Jacobs, H.E.; Mayer, P.; Steffelbauer, D.B.; et al. Investigating the characteristics of residential end uses of water: A worldwide review. Water Res. 2023, 230, 43–1354. [Google Scholar] [CrossRef]
- Chen, S.; Chen, B. Urban energy–water nexus: A network perspective. Appl. Energy 2016, 184, 905–914. [Google Scholar] [CrossRef]
- Kenway, S.J.; Lam, K.L. Quantifying and managing urban water-related energy use systemically: Case study lessons from Australia. Int. J. Water Resour. Dev. 2016, 32, 379–397. [Google Scholar] [CrossRef]
- Abdallah, A.M.; Rosenberg, D.E. Heterogeneous Residential Water and Energy Linkages and Implications for Conservation and Management. J. Water Resour. Plan. Manag. 2014, 140, 288–297. [Google Scholar] [CrossRef]
- Yu, M.; Wang, C.; Liu, Y.; Olsson, G.; Bai, H. Water and related electrical energy use in urban households—Influence of individual attributes in Beijing, China. Resour. Conserv. Recycl. 2018, 130, 190–199. [Google Scholar] [CrossRef]
- Arbués, F.; García-Valiñas, M.Á.; Martínez-Espiñeira, R. Estimation of residential water demand: A state-of-the-art review. J. Socio. Econ. 2003, 32, 81–102. [Google Scholar] [CrossRef]
- Zhou, Y.; Zhang, B.; Wang, H.; Bi, J. Drops of energy: Conserving urban water to reduce greenhouse gas emissions. Environ. Sci. Technol. 2013, 47, 10753–10761. [Google Scholar] [CrossRef] [PubMed]
- Escriva-Bou, A.; Lund, J.R.; Pulido-Velazquez, M. Optimal residential water conservation strategies considering related energy in California. Water Resour. Res. 2015, 51, 4482–4498. [Google Scholar] [CrossRef]
- Ren, Z.; Chan, W.Y.; Wang, X.; Anticev, J.; Cook, S.; Chen, D. An integrated approach to modelling end-use energy and water consumption of Australian households. Sustain. Cities Soc. 2016, 26, 344–353. [Google Scholar] [CrossRef]
- Byers, E.A.; Hall, J.W.; Amezaga, J.M. Electricity generation and cooling water use: UK pathways to 2050. Glob. Environ. Chang. 2014, 25, 16–30. [Google Scholar] [CrossRef]
- Venkatesh, G.; Chan, A.; Brattebø, H. Understanding the water-energy-carbon nexus in urban water utilities: Comparison of four city case studies and the relevant influencing factors. Energy 2014, 75, 153–166. [Google Scholar] [CrossRef]
- Escriva-Bou, A.; Lund, J.R.; Pulido-Velazquez, M. Saving Energy From Urban Water Demand Management. Water Resour. Res. 2018, 54, 4265–4276. [Google Scholar] [CrossRef]
- Wu, J.; Li, C.; Zhang, X.; Zhao, Y.; Liang, J.; Wang, Z. Seasonal variations and main influencing factors of the water cooling islands effect in Shenzhen. Ecol. Indic. 2020, 117, 106699. [Google Scholar] [CrossRef]
- Friedrich, E.; Pillay, S.; Buckley, C.A. Carbon footprint analysis for increasing water supply and sanitation in South Africa: A case study. J. Clean. Prod. 2009, 17, 1–12. [Google Scholar] [CrossRef]
- Zhang, H. Enlightenment of Low Carbon Electricity Consumption and Carbon Justice for Shenzhen Residents on Electricity Saving and Carbon Reduction in Shanghai. Shanghai Energy Sav. 2023, 10, 1400–1404. [Google Scholar] [CrossRef]
Figure 1.
Overall organization of the study.

Figure 2.
Average water-use intensity across the municipal districts in Shanghai.

Figure 3.
Water-use structure of the households in Shanghai.
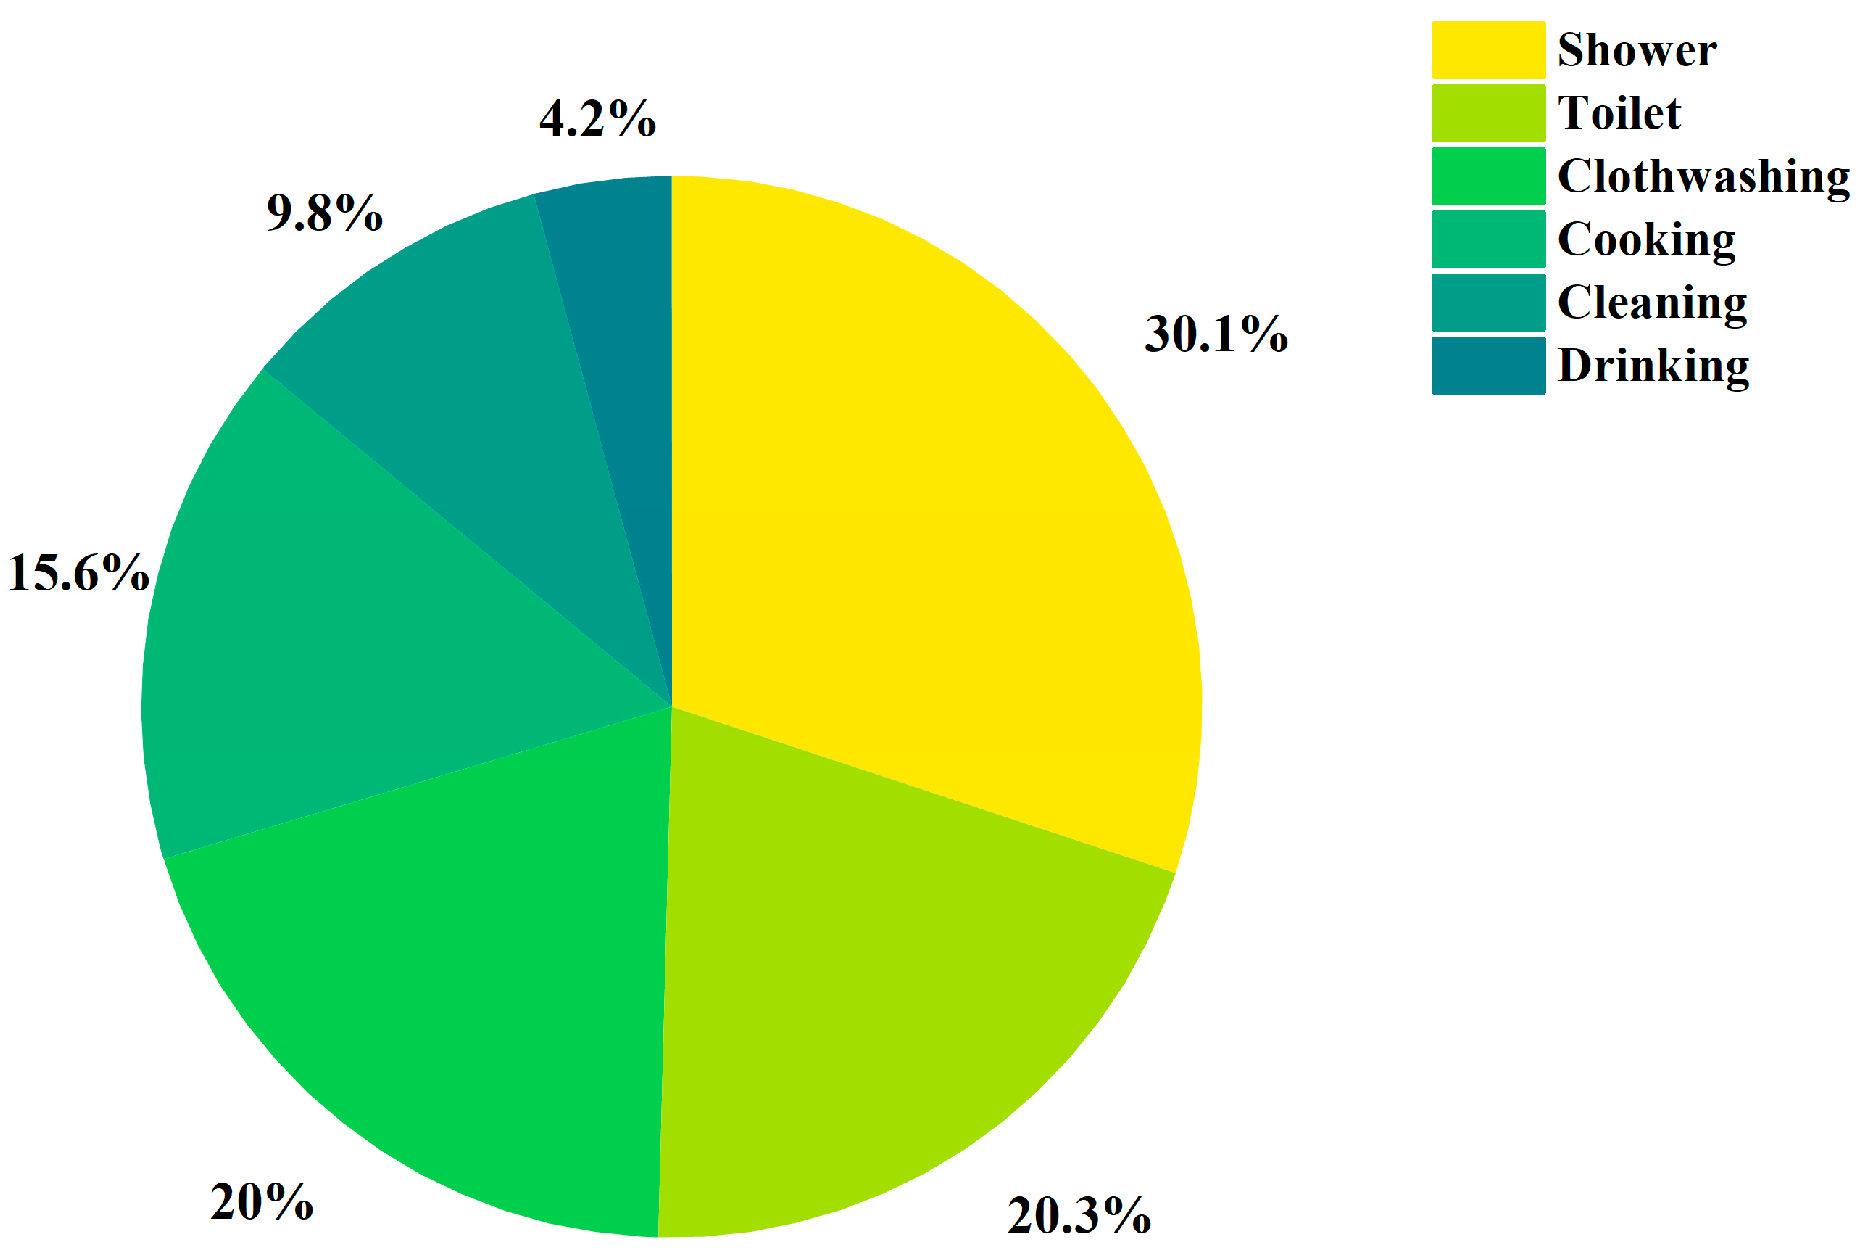
Figure 4.
(a) Distribution of the optimized water and energy cost in Shanghai households obtained from Monte Carlo simulation; the green lines denote the quartile scores, dividing the data into four equal parts. The red line represents the average score across the dataset. (b) percent contribution to water and energy total cost savings in the households of Shanghai through appliance upgrades (GHU, EHU, and SHU in the pie chart) and short-term behavior changes (“others” in the arc). SHU—shower head upgrade; EHU—electric heater upgrade; GHU—gas heater upgrade; RSL—reducing shower duration; RSF—reducing shower frequency; RFL—reducing faucet duration; RFF—reducing faucet frequency; REHT—reducing temperature of electric heater; and RCWF—reducing cloth washing frequency.

Figure 5.
The distribution of the water–energy cost composition among Shanghai urban residential users.
Figure 5.
The distribution of the water–energy cost composition among Shanghai urban residential users.

Figure 6.
Analysis of the correlations between short-term conservation measures and water–energy savings. WSC—water saving cost; ESC—electricity saving cost; GSC—gas saving cost; RCWF—reducing cloth washing frequency; RSL—reducing shower duration; RSF—reducing shower frequency; RFL—reducing faucet duration; RFF—reducing faucet frequency; REHT—reducing temperature of electric heater; and RGHT—reducing temperature of gas heater.

Figure 7.
(a) The seasonal efficiency distribution of short-term conservation behavior among household users in Shanghai. (b) The correlations between seasonal savings efficiency and short-term conservation behaviors. RCWF—reducing cloth washing frequency; RSL—reducing shower duration; RSF—reducing shower frequency; RFL—reducing faucet duration; RFF—reducing faucet frequency; REHT—reducing temperature of electric heater; and RGHT—reducing temperature of gas heater. The ‘’ symbol indicates that there is no significant relationship between the two parameters.
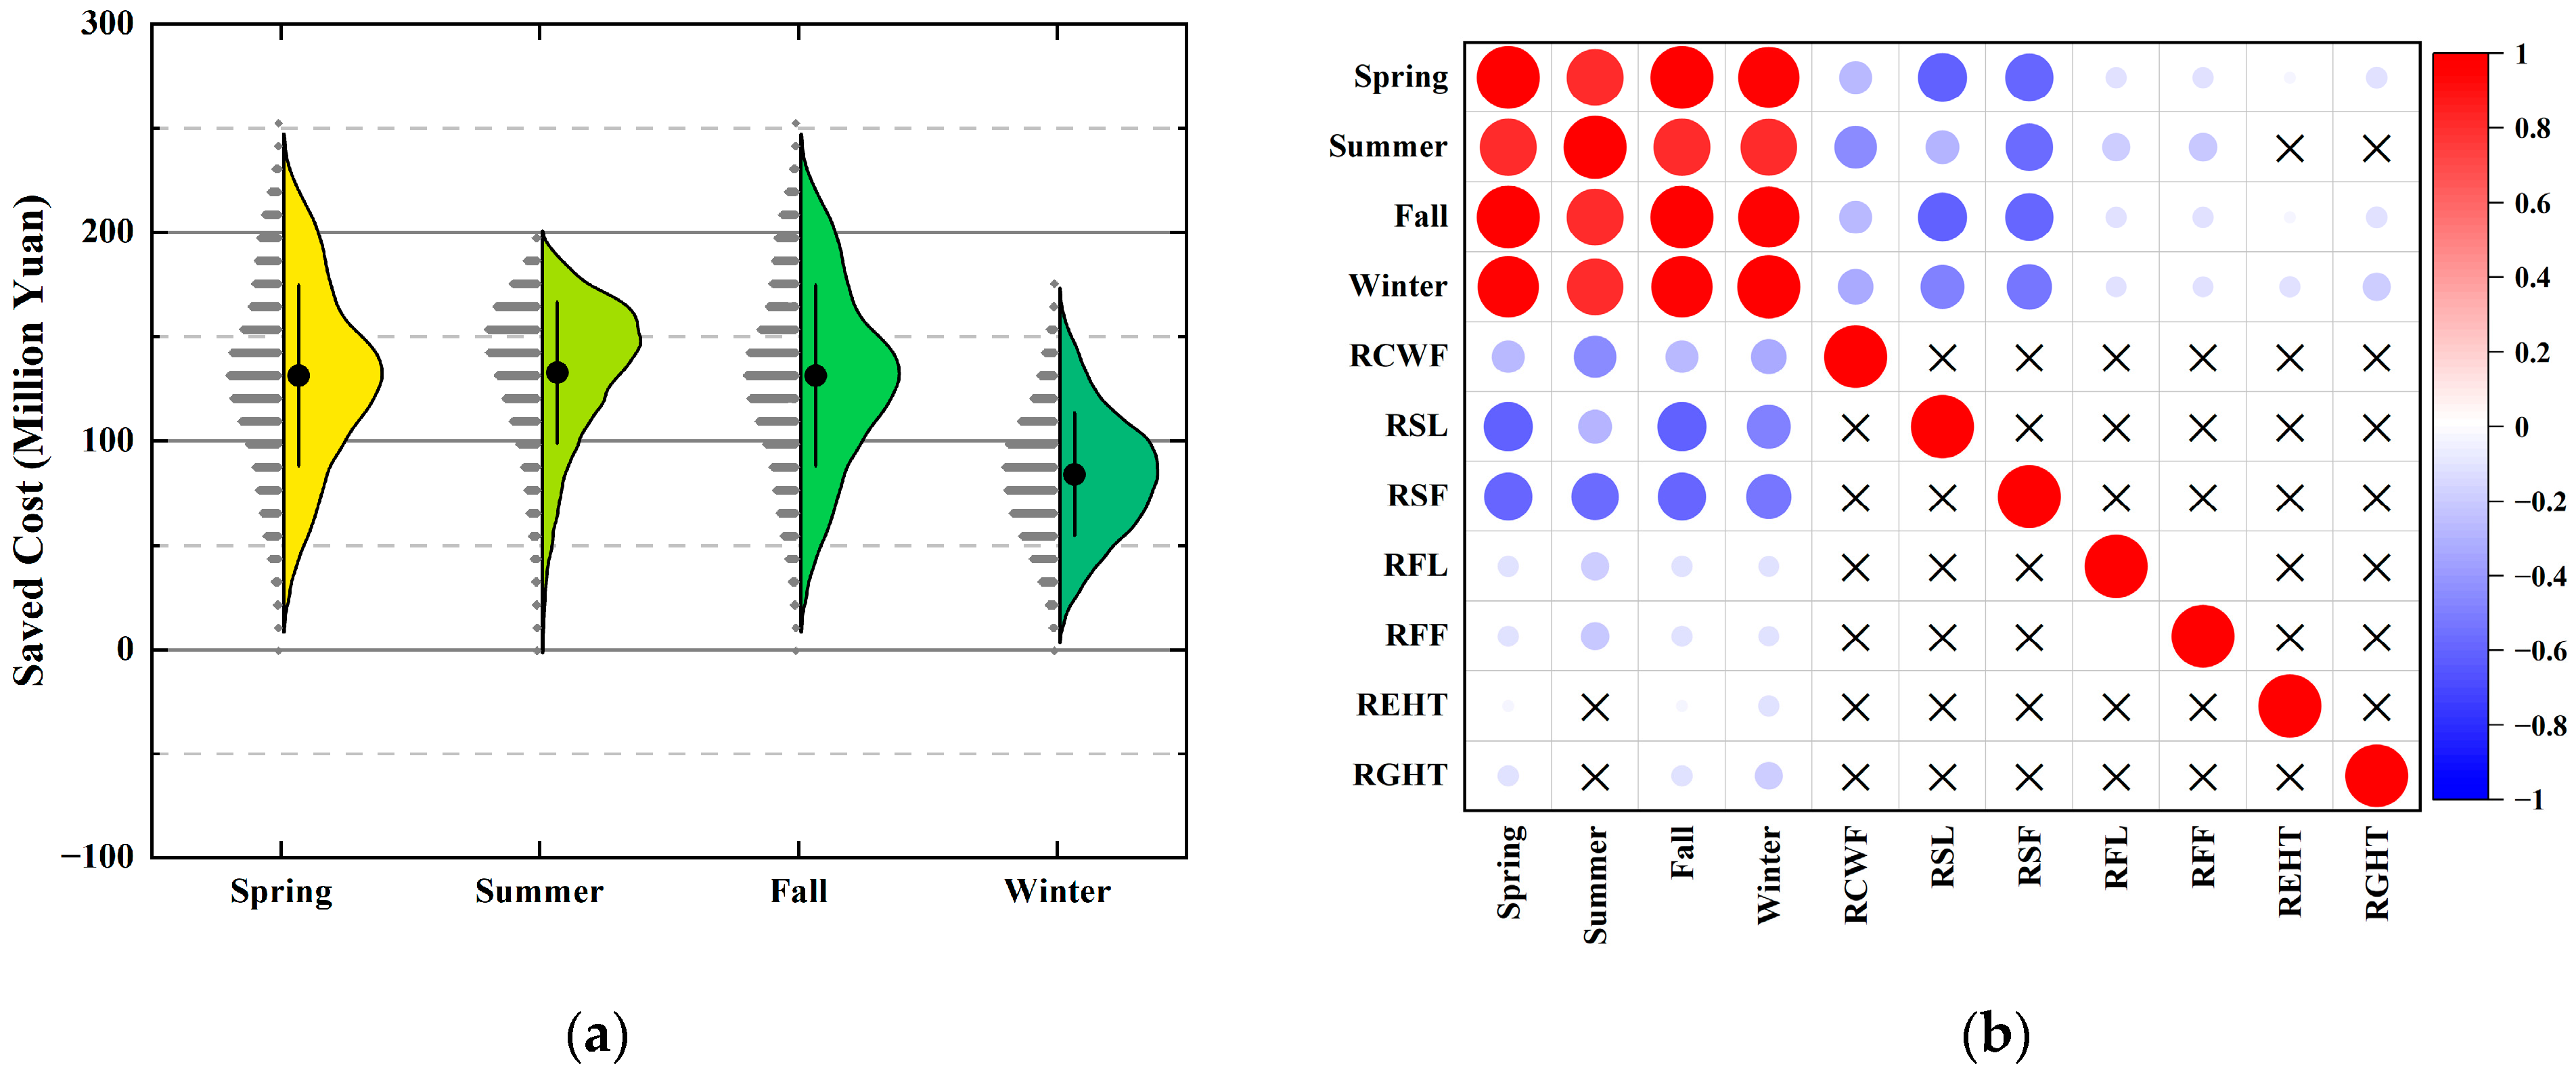
Figure 8.
(a) Carbon emission reduction distribution in the Shanghai urban households (GRCE and ERCE refer to reduced carbon emission by implementing gas and electricity conservation measures, respectively, and TRCE refers to total reduced carbon emission). (b) The carbon emission reduction structure among Shanghai urban residents. EHU—electric heater upgrade; GHU—gas heater upgrade; RCWF—reducing cloth washing frequency; REHTSP—reducing electric heater temperature in spring; REHTS—reducing electric heater temperature in summer; REHTF—reducing electric heater temperature in fall; and REHTW—reducing electric heater temperature in winter.

Table 1.
List of the long-term and short-term conservation measures.
| Duration | Saving Type | Conservation Measure | Abbreviation |
|---|---|---|---|
| Long-term | Water | Showerhead upgrade 1 | SHU |
| Faucet upgrade | FU | ||
| Toilet upgrade | TU | ||
| Energy | Electric heater upgrade | EHU | |
| Gas heater upgrade | GHU | ||
| Water and Energy | Washing machine upgrade | WMU | |
| Dishwasher upgrade | DU | ||
| Short-term | Water | Reducing shower duration | RSD |
| Reducing shower frequency | RSF | ||
| Reducing faucet duration | RFD | ||
| Reducing faucet frequency | RFF | ||
| Energy | Lowering temperature of electric heater | RFHT | |
| Lowering temperature of gas heater | RGHT | ||
| Water and Energy | Reducing cloth washing frequency | RCWF |
1 “upgrade” means replacing the water-use equipment with a more efficient one.
Table 2.
Parameter values of the probability density function for short-term conservation measures.
| Short-Term Conservation Measure | a | b |
|---|---|---|
| Reducing shower duration | 14.48 | 2.13 |
| Reducing shower frequency | 14.96 | 2.20 |
| Reducing faucet duration | 14.00 | 2.07 |
| Reducing faucet frequency | 14.48 | 2.13 |
| Lowering temperature of electric heater | 14.59 | 2.15 |
| Lowering temperature of gas heater | 14.57 | 2.14 |
| Reducing cloth washing frequency | 13.49 | 1.96 |
Table 3.
The monthly water fee, from the survey results, by district in Shanghai.
| Municipal District | Number of Survey Participants | Monthly Water Fee (CNY) | Monthly Water Use (m3) |
|---|---|---|---|
| Minhang | 59 | 109.10 | 26.67 |
| Changning | 10 | 106.70 | 26.09 |
| Jing’an | 10 | 106.20 | 25.97 |
| Chongming | 2 | 105.50 | 25.79 |
| Putuo | 12 | 101.67 | 24.86 |
| Xuhui | 12 | 100.17 | 24.49 |
| Songjiang | 48 | 99.92 | 24.43 |
| Fengxian | 100 | 99.43 | 24.31 |
| Huangpu | 6 | 99.33 | 24.29 |
| Pudong | 132 | 98.01 | 23.96 |
| Qingpu | 27 | 97.00 | 23.72 |
| Jiading | 18 | 94.83 | 23.19 |
| Baoshan | 22 | 93.36 | 22.83 |
| Jinshan | 24 | 92.13 | 22.53 |
| Hongkou | 5 | 73.00 | 17.85 |
| Yangpu | 8 | 72.75 | 17.79 |
Disclaimer/Publisher’s Note: The statements, opinions and data contained in all publications are solely those of the individual author(s) and contributor(s) and not of MDPI and/or the editor(s). MDPI and/or the editor(s) disclaim responsibility for any injury to people or property resulting from any ideas, methods, instructions or products referred to in the content. |
© 2024 by the authors. Licensee MDPI, Basel, Switzerland. This article is an open access article distributed under the terms and conditions of the Creative Commons Attribution (CC BY) license (https://creativecommons.org/licenses/by/4.0/).
Share and Cite
MDPI and ACS Style
Zhou, J.; Zhu, T. Optimization of the Water–Energy–Carbon Nexus in the Residential Water Uses of Shanghai, China. Sustainability 2024, 16, 3529. https://doi.org/10.3390/su16093529
AMA Style
Zhou J, Zhu T. Optimization of the Water–Energy–Carbon Nexus in the Residential Water Uses of Shanghai, China. Sustainability. 2024; 16(9):3529. https://doi.org/10.3390/su16093529
Chicago/Turabian StyleZhou, Jianyu, and Tingju Zhu. 2024. "Optimization of the Water–Energy–Carbon Nexus in the Residential Water Uses of Shanghai, China" Sustainability 16, no. 9: 3529. https://doi.org/10.3390/su16093529
Note that from the first issue of 2016, this journal uses article numbers instead of page numbers. See further details here.