
Roles of Microbial Community and Keystone Taxa in Rice Productivity under Green Manuring in South China

1
College of Plant Protection, Yunnan Agricultural University, Kunming 650500, China
2
College of Resources and Environmental Sciences, Nanjing Agricultural University, Nanjing 210095, China
3
Soil and Fertilizer Institute of Hunan Province, Hunan Academy of Agricultural Sciences, Changsha 410125, China
4
College of Resources and Environment, Yunnan Agricultural University, Kunming 650500, China
5
State Key Laboratory of Efficient Utilization of Arid and Semi-Arid Arable Land in Northern China, Institute of Agricultural Resources and Regional Planning, Chinese Academy of Agricultural Sciences, Beijing 100081, China
*
Authors to whom correspondence should be addressed.
Sustainability 2024, 16(9), 3565; https://doi.org/10.3390/su16093565
Submission received: 15 March 2024
/
Revised: 19 April 2024
/
Accepted: 22 April 2024
/
Published: 24 April 2024
(This article belongs to the Special Issue Soil Improvement and Crop Productivity Increase in Sustainable Agriculture: Mechanism and Technology)
Abstract
:Green manure (GM)–rice–rice rotation is an important management practice for improving soil fertility and rice productivity. The microbiological mechanisms for the increase in grain yield in GM–rice–rice rotation remain unclear. The responses of soil biodiversity, bacterial and fungal communities, and their interactions in the GM–rice–rice rotation were investigated based on two long-term field experiments in Gaoqiao (GQ) and Nanxian (NX) in Hunan Province, south China. Results showed that rice yields were raised by 11.79% and 15.03% under GM in GQ and NX, respectively. GM promoted Shannon diversity and Pielou’s evenness and changed the community structures of bacteria and fungi. The co-occurrence network analysis found that the percentages of negative edges were higher in GM (40.79% and 44.32% in GQ and NX, respectively) than those in the corresponding winter fallow (34.86% and 29.13% in GQ and NX, respectively) in the combined bacterial–fungal networks, suggesting more stable microbial community under GM. Moreover, GM had higher percentages of bacterial–fungal and fungal–fungal edges than winter fallow, indicating that GM increased the interaction between bacteria and fungi and fungi play more essential roles in affecting soil processes under GM. The keystone taxa in GM were positively linked with C metabolism-related enzymes and soil multifunctionality, and were important in improving soil fertility and rice productivity. We concluded that the fungal community was more sensitive to GM application than the bacterial community and that keystone taxa had important influences on soil properties and rice productivity in the GM–double-rice cropping system, which can effectively support the sustainable development of the paddy field ecosystem in southern China.
1. Introduction
Green manure, also called cover crop, plays a crucial role in sustainable development by increasing crop yield and improving soil fertility and structure, which reduces the need for chemical fertilizers and promotes ecological balance. Additionally, it helps to prevent soil erosion and enhances the soil’s water retention capacity, contributing to a more resilient agricultural system [1,2,3,4,5]. In south China, green manure in paddy fields can sufficiently use heat and light resources during winter and improve soil fertility and rice productivity [6]. Milk vetch (Astragalus sinicus L.) is one of the most commonly used leguminous green manures in paddy fields in south China. The incorporation of milk vetch into the soil before rice transplantation can release a large amount of nutrients to cultivate the soil and support the growth of subsequent rice [7].
Soil microbial communities are crucial for soil function and quantity. The impact of green manure on soil bacterial communities has been well studied. A previous study reported that using green manure in a rice cropping system increases soil enzyme activity, which is closely related to soil nutrient transformation and microbial activity [8]. The community structure, richness, and diversity of soil bacteria and functional microbes related to C and N cycling are altered by green manure in rice paddies [9,10,11]. Studies on the changes in the quantity and community structure of soil microorganisms under green manuring can provide a mechanistic understanding of their roles in improving soil quality and rice production.
Most of the soil nutrient transformation processes are mediated by bacteria and fungi. Fungi are the primary decomposers in the soil, contributing to the decomposition of the polymerized fraction of residues, such as cellulose and lignin [12], and are sensitive to changes in the substrate, such as nutrient availability [13]. The incorporation of green manure leads to large amounts of organic amendments into the soil and may have important effects on fungi. An improved understanding of the effects of green manure on fungal communities and interactions between bacteria and fungi is required.
Co-occurrence networks of bacterial and fungal communities are increasingly being analyzed to predict cooperative and competitive relationships between species [14]. Network-related analyses have shown that bacterial and fungal communities are related to soil properties [15]. Highly connected taxa (kinless hubs as keystone taxa) within the network have higher levels of ecosystem function than minimally connected taxa (peripherals) [16]. Soil microorganisms, especially keystone taxa, play important roles in regulating ecosystem processes by catalyzing soil nutrient cycling, and are closely linked to soil health and crop productivity [17]. The coexistence of microbes is affected by various environmental factors. The effects of green manuring on soil microbial networks and ecosystem functions have not been sufficiently explored, and relationships between keystone taxa and rice productivity are worthy of investigation in green manure–rice cropping systems.
Two long-term field experiments with green manure–rice and winter fallow–rice rotation practices are used to explore the responses of soil multifunctionality (SMF), bacterial and fungal diversities, and their interactions on green manuring and reveal the microbiological mechanisms of green manuring on increasing the grain yield in rice cropping systems. We hypothesized that fungal communities would be sensitive to the utilization of green manure, and that the keystone taxa diversity may be an important foundation of rice productivity under green manuring.
2. Materials and Methods
2.1. Experimental Sites
Two field experiments were conducted in Gaoqiao village (28°28′ N, 113°21′ E, altitude = 85.0 m), Changsha, Hunan, and Sanxianhu village (29°13′ N, 112°28′ E, altitude = 28.8 m), Nanxian, Hunan. The locations of the two sites are illustrated in Figure S1. These two experimental sites have significant differences in their basic soil properties, where GQ is acidic soil and NX is alkaline soil. Conducting field experiments in both types of soil simultaneously is beneficial for obtaining more credible results. The paddy soil at the Gaoqiao site (GQ) was classified as an Entisol Fluvent derived from river alluvium (USDA soil taxonomy). Prior to the trial, the properties of 0–20 cm topsoil were as follows: the soil pH (H2O) was 4.81, and the soil organic matter (SOM) and total N (TN) contents were 17.93 and 1.05 g kg−1, respectively. Soil alkali-hydrolysable N (AN), available P (Olsen P, AP), and available K (ammonia acetate-extractable K, AK) contents were 68.7, 11.7, and 39.8 mg kg−1, respectively. The paddy soil at the Nanxian site (NX) was a typical alkaline paddy soil in the Donting Lake floodplain region, classified as a purple alluvial soil, which is an Entisol Fluvent soil derived from lake sediment, according to the USDA soil taxonomy. Prior to the trial, the properties of 0–20 cm topsoil were as follows: the soil pH (H2O) was 7.7, and the SOM and TN contents were 46.63 and 3.28 g kg−1, respectively. Soil AN, AP, and AK contents were 261, 15.6, and 98.1 mg kg−1, respectively. Before the experiment, the fields in the two sites were used for rice cropping for more than 30 years, and the annual cropping system was rice–rice winter fallow.
2.2. Experimental Design and Soil Sampling
Experiments at GQ and NX were established in 2016 and 2011, respectively. And the soils were sampled in 2019 in both sites. Treatments and field management were the same for both sites. To investigate the effects of milk vetch as green manure on rice productivity and soil microorganisms, the experiments included two treatments: milk vetch (Astragalus sinicus L.) as green manure–double rice (GM) and winter fallow–double rice (WF), and each treatment had six replicates. The plots had areas of 20 m2 (4 m × 5 m). The plots were physically separated by a ridge to prevent the transfer of water and nutrients across plot boundaries. In the double-rice cropping system, early rice was transplanted in mid-April or late April and harvested in early July. Late rice was transplanted in middle or late July and harvested in early November. Rice seedlings were transplanted at 15 cm × 20 cm for early rice and 20 cm × 20 cm for late rice. To evaluate the effects of green manure on soil properties and to exclude the interaction with chemical fertilizer, no chemical fertilizer was used in the experiment in either the GQ or NX sites. The seeding rate of milk vetch was 37.5 kg ha−1, and it was sowed 15–25 days before the harvest of late rice in the GM treatment. Each year, the fresh biomass of milk vetch was measured at its full bloom stage and subsequently incorporated into the soil approximately 10 days before early rice transplanting at an amount of 22.5 Mg ha−1 of fresh biomass and on a range of 2.1–2.3 Mg ha−1 of dry biomass. The N supported by the incorporated milk vetch was in a range of 65.23–69.5 kg ha−1 in each year. After harvest, all rice straw was removed from the plots. And all the rice grain was threshed and weighed to monitor the rice yield plot by plot [15].
Plow layer soil samples (0–20 cm) were collected at the harvest stage of early rice (16th and 10th of July in NX and GX, respectively) in 2019. The sampled soils were divided into two portions: one was stored at 4 °C for subsequent chemical analysis, while the other was kept at −80 °C for DNA extraction.
2.3. Chemical Analysis
Soil chemical properties (i.e., pH, SOM, TN, AP, AK, NH4+-N, and NO3−-N) were tested in accordance with the method described by [18]. Soil pH was tested at a soil-to-water ratio of 1:2.5. SOM and TN contents were determined using an elemental analyzer (Flash Smart, Thermo Fisher Scientific, Waltham, MA, USA). AP and AK contents were extracted using 0.5 mol L−1 NaHCO3 and 1 mol L−1 CH3COONH4, respectively. Soil NH4+-N and NO3−-N contents were extracted using 2 mol L−1 KCl and measured using a continuous flow analyzer (SAN++, Skalar, Breda, The Netherlands). Dissolved organic matter (DOM) content was extracted using ultrapure water, shaken, and centrifuged. The extracted liquid was filtered using a 0.45 μm filter. The dissolved organic carbon (DOC) and nitrogen (DON) contents were measured using a TOC analyzer (TOC-L CPH, Shimadzu, Kyoto, Japan).
The potential activities (nmol h−1 g−1) of five types of soil enzymes included in C cycling were measured using the methods described by [8]. These enzymes included α-glucosidase (AG), β-glucosidase (BG), N-acetyl-glucosaminidase (NAG), β-cellobiosidase (CB), and β-xylosidase (XYL). Briefly, fresh soil (1.0 g) was homogenized in 100 mL acetate buffer (50 mM, pH 5.0). The sample suspension, 10 μM reference, and 200 μM substrate were dispensed into a black 96-well microplate. The microplates were covered and incubated at 25 °C for 4 h in the dark, and fluorescence was quantified using a microplate fluorometer (Scientific Fluoroskan Ascent FL, Thermo, Waltham, MA, USA) with excitation and emission filters of 365 and 450 nm, respectively.
2.4. DNA Extraction, Real-Time Quantitative PCR, and Pyrosequencing
Total genomic DNA was extracted using the OMEGA Soil DNA Kit (D5625–01, Omega Bio-Tek, Norcross, GA, USA) in accordance with the manufacturer’s instructions. Extracted DNA samples were stored at −20 °C prior to further analysis. The quantity and quality of the extracted DNAs were measured using the NanoDrop ND-1000 spectrophotometer (Thermo Fisher Scientific, Waltham, MA, USA) and agarose gel electrophoresis, respectively.
Real-time quantitative PCR assays were conducted in triplicate for functional genes involved in the nitrogen cycle (NFG; nifH, archaeal and bacterial amoA, narG, nirS, nirK, and nosZ). The assays were performed on an ABI 7500 Thermocycler (Applied Biosystems, San Francisco, CA, USA). The 20 μL reaction mixture was composed of the following components: 10 μL of 2× SYBR Real-Time PCR premixture, 0.4 μL of 10 μM forward primer, 0.4 μL of 10 μM reverse primer, 9 μL ddH2O, and 1 μL extracted DNA sample. The primers and amplification efficiencies are listed in Table S1. PCR products were ligated into pMD 18-T vectors and transformed into competent E. coli cells to generate standards. Serial dilutions of purified plasmids carrying target genes served as qPCR standards.
The PCR amplification of bacterial 16S rRNA genes in the V3–V4 region was performed using the primers 338F/806R (ACTC CTAC GGGA GGCA GCA/GGAC TACH VGGG TWTC TAAT) [19]. The PCR amplification of the fungal ITS1 region was performed using the primers ITS1F/ITS1R (CTTG GTCA TTTA GAGG AAGT AA/GCTG CGTT CTTC ATCG ATGC) [20]. Sample-specific 7 bp barcodes were incorporated into the primers for multiplex sequencing. For 16S RNA and ITS, PCR mixture included 5 μL of 5× buffer, 0.25 μL Fast pfu DNA Polymerase (5 U/μL), 2 μL of dNTPs (2.5 mM), 1 μL of each forward and reverse primer (10 μM), 1 μL of DNA template, and 14.75 μL of ddH2O. PCR amplicons underwent purification via Vazyme VAHTSTM DNA Clean Beads (Vazyme, Nanjing, China), and their quantification was performed using the Quant-iT PicoGreen dsDNA Assay Kit (Invitrogen, Carlsbad, CA, USA). Purified amplicons were combined in equal proportions and analyzed using the Illumina MiSeq PE250 (San Diego, CA, USA) platform under the guidance of the user’s manual.
2.5. Bioinformatics Analysis
Microbiome bioinformatics analysis was performed using QIIME2 2019.4 in accordance with official tutorials (https://docs.qiime2.org/2019.4/tutorials/ (accessed on 1 April 2019)). Briefly, raw sequences were demultiplexed using the demux plugin followed by primer cutting by using the cutadapt plugin. Sequences were then quality-filtered, denoised, merged, and subjected to chimera removal by using the DADA2 plugin. The remaining high-quality sequences were 2,289,821 for bacteria and 2,226,564 for fungi in all 24 samples. Nonsingleton amplicon sequence variants (ASVs) were aligned with mafft and used to construct a phylogeny by using fasttree2 [21]. Alpha diversity metrics (including observed species, Shannon index, Pielou’s evenness, and Good’s coverage (Table S2) [22]) and beta-diversity metrics (including weighted UniFrac [23], unweighted UniFrac [23], Jaccard distance, and Bray–Curtis dissimilarity) were calculated using QIIME’s diversity plugin. For bacteria and fungi, samples were rarefied to 62,909 and 5898 sequences per sample, respectively. Taxonomic assignments of ASVs were made using the naïve Bayes classifier in the feature-classifier plugin, with the SILVA Release 132 database for bacteria and the UNITE Release 8.0 database for fungi as a reference.
The differentiation of microbiota structure across groups was evaluated using permutational multivariate analysis of variance (PermANOVA). This analysis was based on several metrics, including weighted UniFrac, unweighted UniFrac, Jaccard distance, and Bray–Curtis dissimilarity, utilizing the Psat v2.16 software. Taxon abundance at ASV levels was statistically compared across groups using the MetagenomeSeq and presented in the form of Manhattan plots [24].
The pyrosequencing data generated in this study can be accessed from the NCBI Sequence Read Archive database with the accession number PRJNA782819.
2.6. Co-Occurrence Network
Co-occurrence networks were constructed utilizing the Molecular Ecological Network Analysis pipeline, available at http://ieg2.ou.edu/MENA/ (accessed on 1 May 2012) [25]. Rare ASVs with relative abundance < 0.01% were deleted. Spearman’s correlation coefficient and default threshold values were used in the analysis. The random matrix theory (RMT)-based approach was used to identify the threshold for the network automatically. Networks were visualized using the Gephi 0.9.2 (http://gephi.github.io/ (accessed on 1 September 2017)). Keystone taxa were defined using Z- and P-scores. Network hubs (Z-score > 2.5, P-score > 0.62), module hubs (Z-score > 2.5, P-score < 0.62), connectors (Z-score < 2.5, P-score > 0.62), and peripherals (Z-score < 2.5, P-score < 0.62) were defined in the network structure, and the network hubs, module hubs, and connectors were regarded as keystone taxa [26].
2.7. Statistical Analysis
Four ecological clusters were defined to reveal soil biodiversity and functionality. Ecological clusters included soil properties and C metabolism-related enzymes with SMF, NFG, bacterial diversity (Bac_Div), and fungal diversity (Fun_Div). Normality tests were conducted to ensure that the calculated data followed a normal distribution. The values of the ecological clusters were calculated using the Z-score transformation by averaging the standardized relative values of each index. Relationships between treatment and site, SMF, NFG, bacterial and fungal diversity (Micro_div), ASVs that were significantly enriched by different treatments based on metagenomeSeq analysis (Sdif), keystone taxa in the combined bacterial–fungal ecological networks (Keystone), and rice yield (yield) were explored using partial least squares path modeling (PLS-PM) [27]. The R package “plspm” [28] was used to construct the model. The goodness of fit (GoF) index, reflecting the overall predictive performance of the model, was calculated as the geometric mean of the average communality and R2 value [29]. The replicates numbered 6 in the analysis of soil microbiome, enzyme, and soil nutrient.
3. Results
3.1. Rice Yields, Soil Properties, Enzyme Activity, and Quantity of Functional Genes
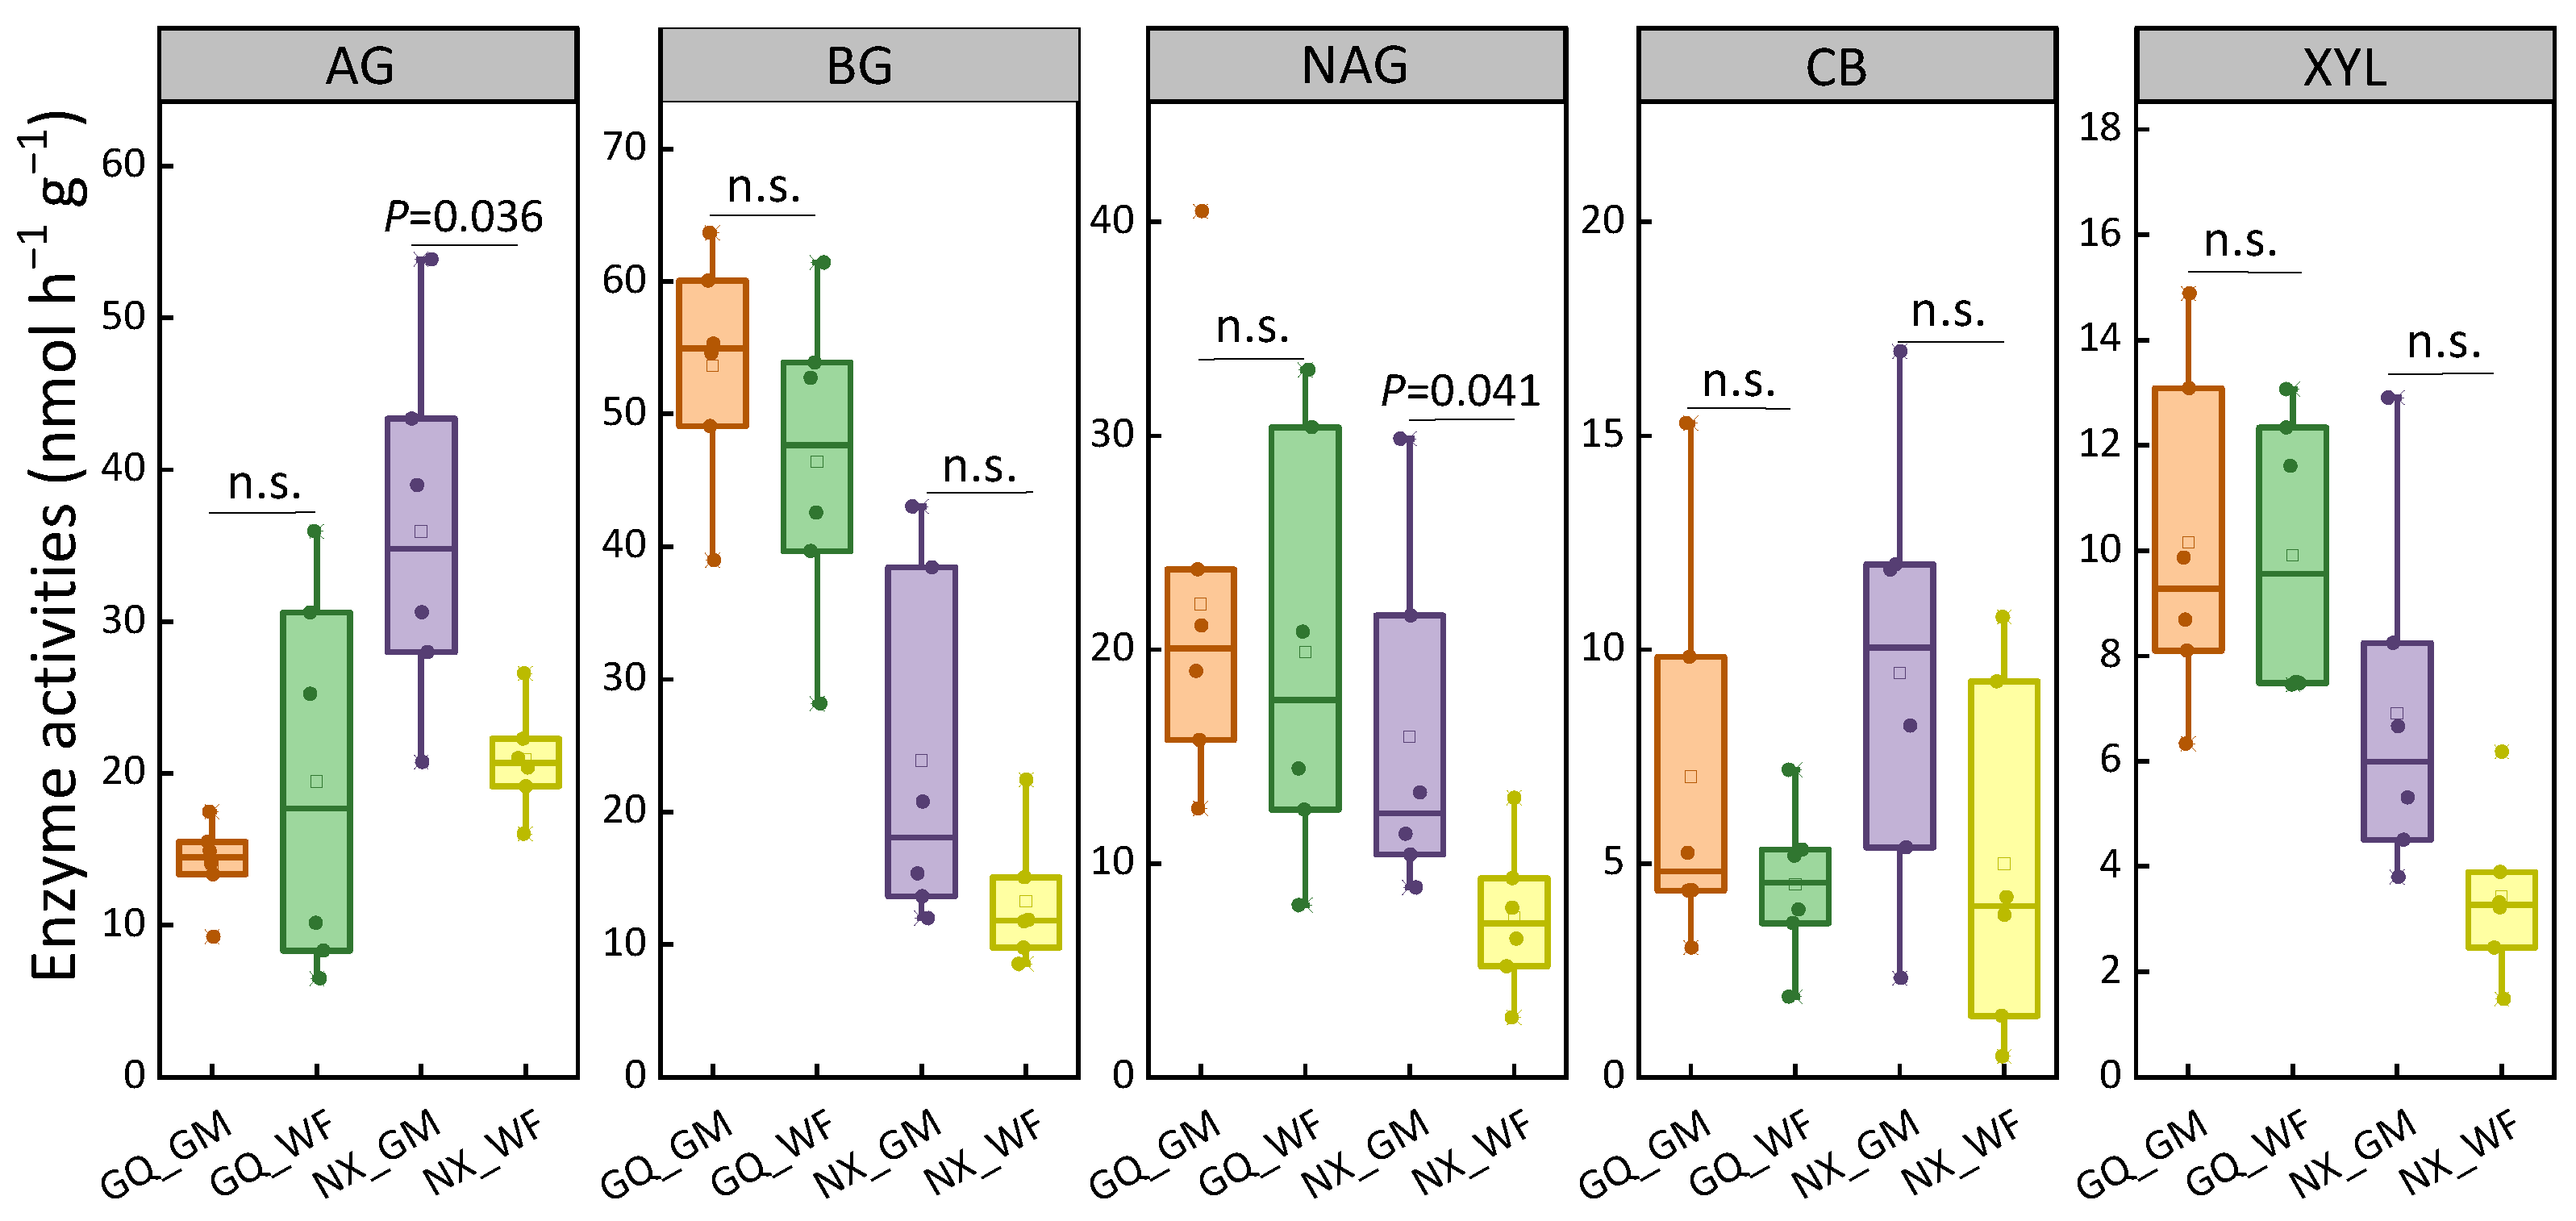
Rice yields from 2016 to 2019 at the two sites were analyzed (Figure 1). GM significantly increased rice yield by 11.79% and 15.03% at GQ and NX, respectively, on average compared with WF. In the sampling season, except for NO3−-N concentration, which decreased in GM at GQ, the soil properties were not significantly different (Table S3). The soil C metabolism-related enzymes AG and NAG were significantly increased in the GM at NX. No significant difference in soil C metabolism-related enzymes was found at GQ (Figure 2). For N-related functional genes, the copy numbers of the nifH gene in N fixation and nosZ gene in denitrification significantly decreased in GM at GQ. nifH and amoA genes in ammonia-oxidizing bacteria and archaea, narG, nirS, nirK, and nosZ genes, which were related to the denitrification process, decreased in GM at NX (Figure 3).
3.2. Alpha-Diversity and Communities of Bacteria and Fungi
The observed species, Shannon index, and Pielou’s evenness were selected to reflect the richness, diversity, and evenness of bacteria and fungi. For bacteria, the observed species showed no difference, whereas the Shannon index and Pielou’s evenness increased in the GM at NX (Figure 4). For fungi, the Shannon index and Pielou’s evenness increased at GQ, whereas the observed species and Shannon index increased at NX in the GM (Figure 4). The equilibrium between bacterial and fungal diversities at the two sites after receiving green manure was investigated using the fungal-to-bacterial species ratio (ITS/16S). The ITS/16S of the Shannon index and Pielou’s evenness significantly increased in GM at GQ, and no change was found at NX (Figure S2).
Bacterial and fungal communities shifted after green manuring by enriching some ASVs in accordance with their taxonomy and showing their enrichment in GM or WF. At GQ, five and three bacterial ASVs were enriched in GM and WF, respectively. At NX, 69 and 9 bacterial ASVs were enriched in GM and WF, respectively (Figure S3). Among fungal ASVs, 93 and 28 ASVs were enriched by GM and WF, respectively. At NX, 11 ASVs were enriched by GM, and no ASV was enriched by WF (Figure S4).
PermANOVA was conducted to investigate the differences in bacterial and fungal communities between GM and WF based on Jaccard, Bray–Curtis, Unweighted UniFrac, and weighted UniFrac distances. Bacterial and fungal communities were altered by green manure at NX, whereas no difference was found in GQ (Table 1).
3.3. Ecological Clusters
Soil chemical properties and C metabolism-related soil enzymes were clustered as SMF using the Z-score method. The SMF of GM was higher than that of WF (Figure 5). The NFG decreased in the GM at GQ and NX (Figure 5). Bacterial and fungal diversity indices showed the same trends, i.e., increased in GM at GQ and NX (Figure 5).
3.4. Co-Occurrence Networks of Bacteria and Fungi
Bacterial and fungal networks and combined bacterial–fungal networks were constructed using RMT, and bacterial and fungal ASVs with relative abundance >0.01% were used to construct the network (Figure 6 and Figure S5). Networks were characterized as scale-free (connectivity distribution followed power–law distributions), small-world (average clustering coefficient and average path length were larger than the random networks), and modularity (modularity values were higher than the random networks and higher than 0.4; Table 2 and Table S4) [25]. Topological properties indicated that the networks could efficiently reveal the effects of green manure on microbial co-occurrence and interactions between bacteria and fungi.
For the bacterial network, the node and edge numbers in GM were higher than those in WF at GQ, indicating that the bacterial network was complex under green manuring (Figure S5 and Table S4). The complexity of the bacterial network did not differ between treatments at NX (Figure S5 and Table S4). For the fungal network, the node and edge numbers in GM were higher than those in WF at GQ and NX, respectively. Green manuring enhanced the complexity and stability of the fungal network (Figure S5 and Table S4). The keystone taxa confirmed by Z- and P-scores showed that GM had more keystone taxa (1.98% and 7.16% at GQ and NX, respectively) than WF (1.35% and 1.25% at GQ and NX, respectively) in the bacterial network (Figure S6). For the fungal network, the percentages of keystone taxa in GM were 4.47% and 4.20% at GQ and NX, respectively, and higher than those in WF, which were 4.03% and 1.18%, respectively (Figure S6).
The combined bacterial–fungal networks were used to review the interactions between bacteria and fungi. The module number and modularity of the combined bacterial–fungal network in GM were higher than those in WF, indicating that green manuring increased network modularity (Table 2). Unlike in NX, GQ was observed with an increased number of nodes and edges due to GM treatment (Figure 6 and Table 2). In GM treatment, module hubs and connectors were identified in 1.32% and 0.73%, respectively, of the nodes at GQ and in 0.80% and 0.40%, respectively, of the nodes at WF. At NX, the percentages of module hubs and connectors in WF were higher than those in GM (Figure 6).
The nodes in the combined bacterial–fungal networks included bacterial and fungal nodes. GM increased the proportion of fungal nodes. Approximately 18.11% and 15.12% of the nodes belonged to fungi in GM at GQ and NX, respectively, whereas 13.30% and 9.20% of the nodes belonged to fungi in WF at GQ and NX, respectively (Figure 7). The edges in the combined networks included bacterial–bacterial, bacterial–fungal, and fungal–fungal edges. GM treatment had higher percentages of bacterial–fungal edges (30.17% and 30.52% at GQ and NX, respectively) than WF treatment (27.28% and 18.09% at GQ and NX, respectively), indicating that green manuring enhanced the interactions between bacteria and fungi. GM had higher percentages of fungal–fungal edges than WF, whereas WF had more bacterial–bacterial edges (Figure 7). GM increased the percentages of negative edges (40.79% and 44.32% at GQ and NX, respectively) over WF (34.86% and 29.13% at GQ and NX, respectively) in the combined bacterial–fungal networks. The same trends were found in bacterial–bacterial, bacterial–fungal, and fungal–fungal edges (Figure 7).
3.5. Relationships among Keystone Taxa, Soil Properties, and Rice Productivity
The keystone taxa in the combined bacterial–fungal networks were kinless hubs according to Z- and P-scores, and were highly connected taxa within the ecological network. A total of eighteen bacterial (classified into seven phyla) and seven fungal (three ASVs were Leotiomycetes, and four ASVs were unclassified fungi) ASVs were defined as keystone taxa in GM at GQ (Table S5). A total of twelve bacterial (classified into five phyla) and one fungal (unclassified fungi) ASVs were defined as keystone taxa in the WF at GQ (Table S5). A total of three bacterial (classified into Nitrospinae and Proteobacteria) and one fungal (classified as Ascomycota) ASVs were defined as keystone taxa in GM at NX. A total of fourteen bacterial (classified into seven phyla) and two fungal (two ASVs were Ascomycota, and one ASV was an unclassified fungus) ASVs were defined as keystone taxa in WF at NX (Table S5).
The relationships among keystone taxa in the combined bacterial–fungal networks, soil properties, and rice productivity were analyzed using the Mantel test (Figure 8). The keystone taxa in the GM at GQ showed strong positive correlations with soil properties, enzyme activities, SMF, NFG, and rice productivity (Figure 8d). At GQ, the keystone taxa in GM had strong positive correlations with soil properties, including soil pH and TN, AP, AK, DOC, and ammonium-N contents, whereas the keystone taxa in WF only had a positive correlation with soil pH. At NX, SOM and TN contents were positively correlated with keystone taxa in GM, whereas no relationship was found in WF (Figure 8a). For the C metabolism-related enzyme, BG was significantly positively correlated with keystone taxa in GM at GQ and WF at NX. XYL was positively correlated with the keystone taxa in the WF at GQ and NX (Figure 8b). Among the NFG, the AOA–amoA gene had a strong positive correlation with keystone taxa in GM at GQ and in WF at NX. The AOB–amoA gene was positively correlated with the keystone taxa in the WF at NX (Figure 8c).
3.6. Ecological Relationships among Soil Properties, Biodiversity of Microbial Communities, Keystone Taxa, and Rice Productivity
PLS-PM was conducted to evaluate the ecological relationships among microbial diversity, keystone taxa, and rice production (Figure 9). The results of the model showed that GM or WF treatment had a negative effect on NFG, but had no significant effect on SMF. The site had a negative effect on NFG and a positive effect on SMF (Figure 9a). NFG and SMF had no direct effect on Micro_div or Sdif. The path coefficients of total effects were −0.292 and −0.211 for Micro_div and −0.051 and 0.253 for Sdif (Figure 9a–c). Keystone taxa were significantly correlated with NFG and SMF. The direct path coefficients of NFG and SMF for keystone taxa were 0.163 and 0.375, respectively, and the total path coefficients were 0.163 and 0.373, respectively (Figure 9a,d). The site, NFG, SMF, and keystone taxa had significantly negative effects on rice production. The direct effects of the path coefficients of NFG and SMF on yield were −0.399 and −0.250, respectively, and the total path coefficients were −0.518 and −0.511, respectively. For the three types of microbial diversity, Micro_div and Sdif had no effect on yield, whereas keystone taxa had significantly negative effects on yield. The path coefficient was −0.723 (Figure 9a,e).
4. Discussion
4.1. Rice Yield, SMF, and Microbial Communities
The utilization of green manure has been widely proven to be an effective method for increasing crop production and improving soil fertility and quality [28,30,31,32]. The application of milk vetch as winter green manure in paddy soil can save 20–40% of chemical fertilizer and maintain high rice yield, and the improved soil fertility due to green manuring may be the main reason for supporting yield effects [31]. Leguminous green manures contain a high content of organic nitrogen, which is easily mineralized to NH4+, and then nitrification from NH4+ to NO3− might be responsible for decreasing soil pH [33,34]. In addition, legumes might uptake more cations than anions in soils during the growth stage, and their roots secrete protons to maintain charge balance, which might be another important reason to reduce pH [35]. Previous studies have reported that cover cropping can lead to an increase in soil carbon and nitrogen stocks [36,37]. A global meta-analysis found that cover cropping results in an average increase in soil organic carbon of 15.5% [2], and that the soil organic carbon in the topsoil increases by an average of 320 kg ha−1 per year [38]. Green manure can be utilized as an essential component of soil conservation practices to improve soil health [39]. The application of green manure enhances the ecological functional stability of soil organic carbon [40,41] and promotes the activities of enzymes, which are related to C, N, P, and S cycling and are closely related to soil microbial activity [8]. In this study, grain yields, C metabolism-related enzymes, and SMF increased after green manuring, confirming that improved soil quality and soil health support increased crop productivity.
Studies on the changes in the quantity and community structure of soil microorganisms under green manuring can provide a mechanistic understanding of their roles in improving soil quality. This study showed that green manuring increases bacterial and fungal richness and diversity and changes community structures. The roots of green manure are widely distributed in soil, changing the microenvironment by providing organic matter and affecting the soil redox status, moisture, and other soil properties [42]. Thus, green manure influences microbial communities and functions. Previous studies showed that the community structures, richness, and diversity of endophytic bacteria in the soil–root system are changed by green manuring [11] and the distribution of beneficial microorganisms in the rice rhizosphere increases due to green manuring, thus promoting the nutrient uptake by rice [43]. In this study, there was a significant positive correlation between nitrogen transformation-related functional genes and keystone species (Figure 9), indicating that keystone species that play an important role in the soil are likely associated with the nitrogen transformation process. As a leguminous green manure, milk vetch can bring a large amount of nitrogen to the soil through biological nitrogen fixation, thereby affecting the soil nitrogen transformation process [44]. There is study that indicates that the enhancement of nitrogen cycle-related gene abundance is closely related to the increase in N-acetylglucosaminidase activity; therefore, green manure can build a soil environment with efficient nutrient cycling by regulating soil microbes [45]. The community structure and diversity of soil microorganisms are closely linked to ecosystem functions. The application of varying management practices and organic amendments results in substantial alterations to nutrient transformation processes occurring in soils [46,47]. SMF, including soil chemical properties, activities of soil C metabolism-related enzymes, and Z-scores of bacterial and fungal communities, was increased by green manuring in this study. Bacteria and fungi produce enzymes that regulate soil nutrient cycling. Microbial diversity is associated with soil and plant processes, and interactions among plant roots, soil nutrient pools, and microbial communities are important for regulating soil quality and crop production [17]. A previous study also found that the long-term combined utilization of green manure and chemical fertilizer alters microbial community composition and enhances the quantity of SOC and the activity of organic carbon hydrolases [6]. Our results also suggest that the utilization of green manure promotes the functional potential of bacteria and fungi by increasing soil biodiversity and mediating microbial groups related to nutrient cycling.
4.2. Important Roles of Fungi
As decomposers, fungi strongly influence the ecosystem structure and function and play fundamental roles in driving soil nutrient cycling. In this study, the fungi-to-bacteria ratio significantly increased with the green manure treatment, showing that green manure has profound effects on fungal diversity compared to on bacterial diversity [48]. Treatment with green manure has more fungal nodes and higher percentages of bacterial–fungal edges and fungal–fungal edges than those in the winter fallow treatment, indicating that green manuring has a more evident effect on the fungal network and increases the interaction between bacteria and fungi. This finding may be because green manuring changes the substrates and ecological niches of fungal decomposers. Bacteria and fungi live in the same environment, and interactions between them occur at any time, including substance and energy exchanges. Interactions within and among bacterial and fungal communities play essential roles in enhancing ecosystem performance, and a taxonomically rich soil microbiome can support multiple ecosystem functions [49]. A previous study found that green manure amendment increases the composition of the main microbial groups and has a high fungi-to-bacteria ratio [50]. The shifts in fungal communities induced by cover cropping lead to high ecosystem resilience and promote the efficient use of limited resources [51]. The abundance and community structure of fungi affect the decomposition rate of milk vetch and rice straw residues [43]. In our study, most of the fungal keystone taxa are classified as Ascomycota, showing that Ascomycota are dominant in abundance and function in the studied paddy soil. This finding is consistent with the conclusions of earlier research [51].
4.3. Keystone Taxa and Rice Productivity
Ecological networks are important for investigating the roles and functions of soil microbes [49,52]. Soil microorganisms have complex interactions through positive, negative, or neutral ecological relationships [14]. Co-occurrence networks provide a useful method for investigating the interactions between coexisting microorganisms and reflect the responses of communities to environmental change [53]. A network with negative links stabilizes co-oscillations and promotes a stable network [54]. Green manuring increases the percentage of negative edges, indicating that the utilization of green manure contributes to stable microbial communities.
Keystone taxa are positively associated with plant productivity in natural ecosystems [52]. This study provides evidence that keystone taxa are more sensitive to management practices than bacterial or fungal diversity and the significantly enriched microorganisms in the rice cropping system. Additionally, keystone taxa are positively correlated with grain yield under green manure utilization. Microbial diversity and network complexity are correlated with ecosystem functions related to nutrient cycling [49]. Previous studies have revealed that green manuring influences the biogeochemical cycling of plant nutrients by changing the functional microbes related to N cycling and increasing the populations of methane-oxidizing bacteria and sulfur-reducing bacteria in paddy soils [10]. In green manure–rice systems, the growth and decomposition of green manure changes the N status of paddy soil, consequently inducing changes in nitrogen cycling and associated microbial communities [10]. Keystone taxa influence key soil processes, and the biodiversity of keystone phylotypes plays a fundamental role in maintaining soil function and crop productivity by mediating soil C, N, P, and S cycling [55]. Green manure promotes the transformation of soil nutrients and regulates key soil processes, supporting the high-efficiency use of nutrients and contributing to rice production.
5. Conclusions
Green manuring increased rice yields by 11.79% and 15.03% at GQ and NX, respectively; promoted the alpha-diversity; and changed the community structures of bacteria and fungi. Co-occurrence network analysis suggested that the utilization of green manure increased the stability of the microbial community, enhanced the interaction between bacteria and fungi, and had a more profound influence on the fungal community than on the bacterial community. The keystone taxa under the green manure–rice cropping system have disproportionately large effects on soil fertility and rice production relative to their abundance.
Supplementary Materials
The following supporting information can be downloaded at: https://www.mdpi.com/article/10.3390/su16093565/s1. Figure S1: Pearson correlation analysis between properties and rice traits; Figure S2: Fungi-to-bacteria ratios (ITS/16S ratios) of observed species, Shannon index, and Pielou’s evenness; Figure S3: Manhattan plots based on the MetagenomeSeq analysis of bacterial community showing GM-enriched ASVs at GQ (a), WF-enriched ASVs at GQ (b), GM-enriched ASVs at NX (c), and WF-enriched ASVs at NX (d) of bacteria; Figure S4: Manhattan plots based on the MetagenomeSeq analysis of fungal community showing GM-enriched ASVs at GQ (a), WF-enriched ASVs at GQ (b), GM-enriched ASVs at NX (c), and WF-enriched ASVs at NX (d) of bacteria; Figure S5: Co-occurrence networks of bacterial and fungal communities. Table S1: Path analysis results of indirect effects on rice yield and nutrients uptake; Table S2: Good’s coverage for each sample (%); Table S3: Soil properties in different treatments at the two sites in 2019; Table S4: Topological properties of bacterial and fungal co-occurrence networks; Table S5: Keystone ASVs identified in the combined bacterial-fungal networks documented with taxonomy assignments and the degree of co-occurrence values. References [56,57,58,59,60,61] are cited in Supplementary Materials.
Author Contributions
Y.F. and H.L. contributed to the conception and design of the study. Y.F. and H.L. completed the sample collection. Y.F. and H.L. performed the statistical analysis. Y.F. and H.L. wrote the manuscript. Y.F. and H.L. contributed to the revision of manuscript. All authors contributed to the article and approved the submitted version. All authors have read and agreed to the published version of the manuscript.
Funding
The study was funded by the National Natural Science Foundation of China (No. 32072678;), the National Key Research and Development Program of China (2021YFD1700200), the earmarked fund for China Agriculture Research System-Green manure (CARS-22).
Institutional Review Board Statement
Not applicable.
Informed Consent Statement
Not applicable.
Data Availability Statement
Data are available from the authors.
Acknowledgments
We thank the anonymous reviewers and editors for their helpful comments regarding the manuscript.
Conflicts of Interest
The authors declare that they have no known competing financial interests or personal relationships that could have appeared to influence the work reported in this paper.
References
- Aulakh, M.S.; Khera, T.S.; Doran, J.W.; Singh, K.; Singh, B. Yields and nitrogen dynamics in a rice–wheat system using green manure and inorganic fertilizer. Soil Sci. Soc. Am. J. 2000, 64, 1867–1876. [Google Scholar] [CrossRef]
- Jian, J.; Du, X.; Reiter, M.S.; Stewart, R.D. A meta-analysis of global cropland soil carbon changes due to cover cropping. Soil Biol. Biochem. 2020, 143, 107735. [Google Scholar] [CrossRef]
- Fontana, M.B.; Novelli, L.E.; Sterren, M.A.; Uhrich, W.G.; Benintende, S.M.; Barbagelata, P.A. Long-term fertilizer application and cover crops improve soil quality and soybean yield in the Northeastern Pampas region of Argentina. Geoderma 2021, 385, 114902. [Google Scholar] [CrossRef]
- Kelly, C.; Schipanski, M.E.; Tucker, A.; Trujillo, W.; Holman, J.D.; Obour, A.K.; Johnson, S.K.; Brummer, J.E.; Haag, L.; Fonte, S.J. Dryland cover crop soil health benefits are maintained with grazing in the U.S. High and Central Plains. Agriculture. Ecosyst. Environ. 2021, 313, 107358. [Google Scholar] [CrossRef]
- Repullo-Ruibérriz de Torres, M.A.; Carbonell-Bojollo, R.M.; Moreno-García, M.; Ordóñez-Fernández, R.; Rodríguez-Lizana, A. Soil organic matter and nutrient improvement through cover crops in a Mediterranean olive orchard. Soil Tillage Res. 2021, 210, 104977. [Google Scholar] [CrossRef]
- Xu, P.; Wu, J.; Wang, H.; Han, S.; Zhu, J.; Fu, Q.; Geng, M.; Hu, H.; Huang, Q. Long-term partial substitution of chemical fertilizer with green manure regulated organic matter mineralization in paddy soil dominantly by modulating organic carbon quality. Plant Soil 2021, 468, 459–473. [Google Scholar] [CrossRef]
- Jiang, Y.; Zhang, J.; Manuel, D.-B.; de Beeck, M.O.; Shahbaz, M.; Chen, Y.; Deng, X.; Xu, Z.; Li, J.; Liu, Z. Rotation cropping and organic fertilizer jointly promote soil health and crop production. J. Environ. Manag. 2022, 315, 115190. [Google Scholar] [CrossRef] [PubMed]
- Zhou, G.; Gao, S.; Lu, Y.; Liao, Y.; Nie, J.; Cao, W. Co-incorporation of green manure and rice straw improves rice production, soil chemical, biochemical and microbiological properties in a typical paddy field in southern China. Soil Tillage Res. 2020, 197, 104499. [Google Scholar] [CrossRef]
- Fan, K.; Delgado-Baquerizo, M.; Guo, X.; Wang, D.; Wu, Y.; Zhu, M.; Yu, W.; Yao, H.; Zhu, Y.G.; Chu, H. Suppressed N fixation and diazotrophs after four decades of fertilization. Microbiome 2019, 7, 143. [Google Scholar] [CrossRef]
- Gao, S.; Cao, W.; Zhou, G.; Rees, R.M. Bacterial communities in paddy soils changed by milk vetch as green manure: A study conducted across six provinces in South China. Pedosphere 2021, 31, 521–530. [Google Scholar] [CrossRef]
- Zhou, G.; Fan, K.; Gao, S.; Chang, D.; Li, G.; Liang, T.; Liang, H.; Li, S.; Zhang, J.; Che, Z.; et al. Green manuring relocates microbiomes in driving the soil functionality of nitrogen cycling to obtain preferable grain yields in thirty years. Sci. China Life Sci. 2023, 67, 596–610. [Google Scholar] [CrossRef]
- Poll, C.; Brune, T.; Begerow, D.; Kandeler, E. Small-scale diversity and succession of fungi in the detritusphere of rye residues. Microb. Ecol. 2010, 59, 130–140. [Google Scholar] [CrossRef]
- Looby, C.I.; Treseder, K.K. Shifts in soil fungi and extracellular enzyme activity with simulated climate change in a tropical montane cloud forest. Soil Biol. Biochem. 2018, 117, 87–96. [Google Scholar] [CrossRef]
- Faust, K.; Raes, J. Microbial interactions: From networks to models. Nat. Rev. Microbiol. 2012, 10, 538–550. [Google Scholar] [CrossRef] [PubMed]
- de Menezes, A.B.; Prendergast-Miller, M.T.; Richardson, A.E.; Toscas, P.; Farrell, M.; Macdonald, L.M.; Baker, G.; Wark, T.; Thrall, P.H. Network analysis reveals that bacteria and fungi form modules that correlate independently with soil parameters. Environ. Microbiol. 2015, 17, 2677–2689. [Google Scholar] [CrossRef] [PubMed]
- Shi, Y.; Delgado-Baquerizo, M.; Li, Y.; Yang, Y.; Zhu, Y.G.; Penuelas, J.; Chu, H. Abundance of kinless hubs within soil microbial networks are associated with high functional potential in agricultural ecosystems. Environ. Int. 2020, 142, 105869. [Google Scholar] [CrossRef] [PubMed]
- Fan, K.; Delgado-Baquerizo, M.; Zhu, Y.G.; Chu, H. Crop production correlates with soil multitrophic communities at the large spatial scale. Soil Biol. Biochem. 2020, 151, 108047. [Google Scholar] [CrossRef]
- Lu, R.K. Analytical Method for Soil and Agro-Chemical; Agricultural Science and Technology Press: Beijing, China, 2000. (In Chinese) [Google Scholar]
- Chu, Z.R.; Wang, K.; Li, X.K.; Zhu, M.T.; Yang, L.; Zhang, J. Microbial characterization of aggregates within a one-stage nitritation–anammox system using high-throughput amplicon sequencing. Chem. Eng. J. 2015, 262, 41–48. [Google Scholar] [CrossRef]
- Orgiazzi, A.; Lumini, E.; Nilsson, R.H.; Girlanda, M.; Vizzini, A.; Bonfante, P.; Bianciotto, V. Unravelling soil fungal communities from different Mediterranean land-use backgrounds. PLoS ONE 2012, 7, e34847. [Google Scholar] [CrossRef]
- Price, M.N.; Dehal, P.S.; Arkin, A.P. FastTree: Computing large minimum evolution trees with profiles instead of a distance matrix. Mol. Biol. Evol. 2009, 26, 1641–1650. [Google Scholar] [CrossRef]
- Good, I.J. The population frequencies of species and the estimation of population parameters. Biometrika 1953, 40, 237–264. [Google Scholar] [CrossRef]
- Lozupone, C.; Lladser, M.E.; Knights, D.; Stombaugh, J.; Knight, R. UniFrac: An effective distance metric for microbial community comparison. ISME J. 2011, 5, 169–172. [Google Scholar] [CrossRef] [PubMed]
- Zgadzaj, R.; Garrido-Oter, R.; Jensen, D.B.; Koprivova, A.; Schulze-Lefert, P.; Radutoiu, S. Root nodule symbiosis in Lotus japonicus drives the establishment of distinctive rhizosphere, root, and nodule bacterial communities. Proc. Natl. Acad. Sci. USA 2016, 113, E7996–E8005. [Google Scholar] [CrossRef] [PubMed]
- Deng, Y.; Jiang, Y.H.; Yang, Y.F.; He, Z.L.; Luo, F.; Zhou, J. Molecular ecological network analyses. BMC Bioinform. 2012, 13, 113–133. [Google Scholar] [CrossRef] [PubMed]
- Poudel, R.; Jumpponen, A.; Schlatter, D.C.; Paulitz, T.C.; Gardener, B.B.; Kinkel, L.L.; Garrett, K.A. Microbiome Networks: A Systems Framework for Identifying Candidate Microbial Assemblages for Disease Management. Phytopathology 2016, 106, 1083–1096. [Google Scholar] [CrossRef] [PubMed]
- Sanchez, G. PLS Path Modeling with R; Trowchez Editions: Berkeley, CA, USA, 2013. [Google Scholar]
- Yang, L.; Zhou, X.; Liao, Y.; Lu, Y.; Nie, J.; Cao, W. Co-incorporation of rice straw and green manure benefits rice yield and nutrient uptake. Crop Sci. 2019, 59, 749–759. [Google Scholar] [CrossRef]
- Sanchez, G.; Trinchera, L. plspm: Partial Least Squares Data Analysis Methods. R Package Version 0.2-2. 2012. Available online: https://cran.r-project.org/package=plspm (accessed on 1 February 2012).
- Lee, C.H.; Park, K.D.; Jung, K.Y.; Ali, M.A.; Lee, D.; Gutierrez, J.; Kim, P.J. Effect of Chinese milk vetch (Astragalus sinicus L.) as a green manure on rice productivity and methane emission in paddy soil. Agric. Ecosyst. Environ. 2010, 138, 343–347. [Google Scholar] [CrossRef]
- Zhou, C.; Zhao, Z.; Pan, X.; Huang, S.; Tan, X.; Wu, J.; Shi, Q. Integration of growing milk vetch in winter and reducing nitrogen fertilizer application can improve rice yield in double-rice cropping system. Rice Sci. 2016, 23, 132–143. [Google Scholar]
- Xie, Z.; Zhou, C.; Shah, F.; Iqbal, A.; Ni, G. The role of Chinese Milk Vetch as cover crop in complex soil nitrogen dynamics in rice rotation system of South China. Sci. Rep. 2018, 8, 12061. [Google Scholar] [CrossRef]
- Mao, J.; Xu, R.K.; Li, J.Y.; Li, X.H. Dicyandiamide enhances liming potential of two legume materials when incubated with an acid Ultisol. Soil Biol. Biochem. 2010, 42, 1632–1635. [Google Scholar] [CrossRef]
- Xiao, K.; Xu, J.; Tang, C.; Zhang, J.; Brookes, P.C. Differences in carbon and nitrogen mineralization in soils of differing initial pH induced by electrokinesis and receiving crop residue amendments. Soil Biol. Biochem. 2013, 67, 70–84. [Google Scholar] [CrossRef]
- Thorup-Kristensen, K.; Magid, J.; Jensen, L.S. Catch crops and green manures as biological tools in nitrogen management in temperate zones. Adv. Agron. 2003, 79, 227–302. [Google Scholar]
- Abdalla, M.; Hastings, A.; Cheng, K.; Yue, Q.; Chadwick, D.; Espenberg, M.; Truu, J.; Rees, R.M.; Smith, P. A critical review of the impacts of cover crops on nitrogen leaching, net greenhouse gas balance and crop productivity. Glob. Chang. Biol. 2019, 25, 2530–2543. [Google Scholar] [CrossRef] [PubMed]
- Wulanningtyas, H.S.; Gong, Y.; Li, P.; Sakagami, N.; Nishiwaki, J.; Komatsuzaki, M. A cover crop and no-tillage system for enhancing soil health by increasing soil organic matter in soybean cultivation. Soil Tillage Res. 2021, 205, 104749. [Google Scholar] [CrossRef]
- Poeplau, C.; Don, A. Carbon sequestration in agricultural soils via cultivation of cover crops—A meta-analysis. Agriculture, Ecosyst. Environ. 2015, 200, 33–41. [Google Scholar] [CrossRef]
- Koudahe, K.; Allen, S.C.; Djaman, K. Critical review of the impact of cover crops on soil properties. Int. Soil Water Conserv. Res. 2022, 10, 343–354. [Google Scholar] [CrossRef]
- Chen, Y.; Hu, N.; Zhang, Q.; Lou, Y.; Li, Z.; Tang, Z.; Kuzyakov, Y.; Wang, Y. Impacts of green manure amendment on detritus micro-food web in a double-rice cropping system. Appl. Soil Ecol. 2019, 138, 32–36. [Google Scholar] [CrossRef]
- Li, T.; Gao, J.; Bai, L.; Wang, Y.; Huang, J.; Kumar, M.; Zeng, X. Influence of green manure and rice straw management on soil organic carbon, enzyme activities, and rice yield in red paddy soil. Soil Tillage Res. 2019, 195, 104428. [Google Scholar] [CrossRef]
- Thorup-Kristensen, K.; Halberg, N.; Nicolaisen, M.; Olesen, J.E.; Crews, T.E.; Hinsinger, P.; Kirkegaard, J.; Pierret, A.; Dresboll, D.B. Digging Deeper for Agricultural Resources, the Value of Deep Rooting. Trends Plant Sci. 2020, 25, 406–417. [Google Scholar] [CrossRef]
- Zhang, X.; Zhang, R.; Gao, J.; Wang, X.; Fan, F.; Ma, X.; Yin, H.; Zhang, C.; Feng, K.; Deng, Y. Thirty-one years of rice-rice-green manure rotations shape the rhizosphere microbial community and enrich beneficial bacteria. Soil Biol. Biochem. 2017, 104, 208–217. [Google Scholar] [CrossRef]
- Cai, S.; Pittelkow, C.M.; Zhao, X.; Wang, S. Winter legume-rice rotations can reduce nitrogen pollution and carbon footprint while maintaining net ecosystem economic benefits. J. Clean. Prod. 2018, 195, 289–300. [Google Scholar] [CrossRef]
- Li, Y.; Pan, F.; Yao, H. Response of symbiotic and asymbiotic nitrogen-fixing microorganisms to nitrogen fertilizer application. J. Soils Sediments 2019, 19, 1948–1958. [Google Scholar] [CrossRef]
- Fontaine, D.; Eriksen, J.; Sørensen, P. Cover crop and cereal straw management influence the residual nitrogen effect. Eur. J. Agron. 2020, 118, 126100. [Google Scholar] [CrossRef]
- Ichihashi, Y.; Date, Y.; Shino, A.; Shimizu, T.; Shibata, A.; Kumaishi, K.; Funahashi, F.; Wakayama, K.; Yamazaki, K.; Umezawa, A.; et al. Multi-omics analysis on an agroecosystem reveals the significant role of organic nitrogen to increase agricultural crop yield. Proc. Natl. Acad. Sci. USA 2020, 117, 14552–14560. [Google Scholar] [CrossRef]
- Li, M.; Dai, B.; Tang, Y.; Lei, L.; Li, N.; Liu, C.; Ge, T.; Zhang, L.; Xu, Y.; Hu, Y.; et al. Altered Bacterial-Fungal Interkingdom Networks in the Guts of Ankylosing Spondylitis Patients. mSystems 2019, 4, e00176-18. [Google Scholar] [CrossRef]
- Wagg, C.; Schlaeppi, K.; Banerjee, S.; Kuramae, E.E.; van der Heijden, M.G.A. Fungal-bacterial diversity and microbiome complexity predict ecosystem functioning. Nat. Commun. 2019, 10, 4841. [Google Scholar] [CrossRef]
- Khan, M.I.; Gwon, H.S.; Alam, M.A.; Song, H.J.; Das, S.; Kim, P.J. Short term effects of different green manure amendments on the composition of main microbial groups and microbial activity of a submerged rice cropping system. Appl. Soil Ecol. 2020, 147, 103400. [Google Scholar] [CrossRef]
- Schmidt, R.; Mitchell, J.; Scow, K. Cover cropping and no-till increase diversity and symbiotroph:saprotroph ratios of soil fungal communities. Soil Biol. Biochem. 2019, 129, 99–109. [Google Scholar] [CrossRef]
- Delgado-Baquerizo, M.; Reich, P.B.; Trivedi, C.; Eldridge, D.J.; Abades, S.; Alfaro, F.D.; Bastida, F.; Berhe, A.A.; Cutler, N.A.; Gallardo, A.; et al. Multiple elements of soil biodiversity drive ecosystem functions across biomes. Nat. Ecol. Evol. 2020, 4, 210–220. [Google Scholar] [CrossRef]
- de Vries, F.T.; Griffiths, R.I.; Bailey, M.; Craig, H.; Girlanda, M.; Gweon, H.S.; Hallin, S.; Kaisermann, A.; Keith, A.M.; Kretzschmar, M.; et al. Soil bacterial networks are less stable under drought than fungal networks. Nat. Commun. 2018, 9, 3033. [Google Scholar] [CrossRef]
- Coyte, K.Z.; Jonas, S.; Foster, K.R. The ecology of the microbiome: Networks, competition, and stability. Science 2015, 350, 663–666. [Google Scholar] [CrossRef] [PubMed]
- Fan, K.; Delgado-Baquerizo, M.; Guo, X.; Wang, D.; Zhu, Y.G.; Chu, H. Biodiversity of key-stone phylotypes determines crop production in a 4-decade fertilization experiment. ISME J. 2021, 15, 550–561. [Google Scholar] [CrossRef]
- Chen, Z.; Liu, J.; Wu, M.; Xie, X.; Wu, J.; Wei, W. Differentiated response of denitrifying communities to fertilization regime in paddy soil. Microb. Ecol. 2012, 63, 446–459. [Google Scholar] [CrossRef] [PubMed]
- Kandeler, E.; Deiglmayr, K.; Tscherko, D.; Bru, D.; Philippot, L. Abundance of narG, nirS, nirK, and nosZ genes of denitrifying bacteria during primary successions of a glacier foreland. Appl. Environ. Microbiol. 2006, 72, 5957–5962. [Google Scholar] [CrossRef] [PubMed]
- Levy-Booth, D.J.; Prescott, C.E.; Grayston, S.J. Microbial functional genes involved in nitrogen fixation, nitrification and denitrification in forest ecosystems. Soil Biol. Biochem. 2014, 75, 11–25. [Google Scholar] [CrossRef]
- Park, S.-J.; Park, B.-J.; Rhee, S.-K. Comparative analysis of archaeal 16S rRNA and amoA genes to estimate the abundance and diversity of ammonia-oxidizing archaea in marine sediments. Extremophiles 2008, 12, 605–615. [Google Scholar] [CrossRef] [PubMed]
- Rotthauwe, J.H.; Witzel, K.-P.; Liesack, W. The ammonia monooxygenase structural gene amoA as a functional marker, molecular fine-scale analysis of natural ammonia-oxidizing populations. Appl. Environ. Microbiol. 1997, 63, 4704–4712. [Google Scholar] [CrossRef]
- Shu, W.; Pablo, G.P.; Jun, Y.; Danfeng, H. Abundance and diversity of nitrogen-fixing bacteria in rhizosphere and bulk paddy soil under different duration of organic management. World J. Microbiol. Biotechnol. 2012, 28, 493–503. [Google Scholar] [CrossRef]
Figure 1.
Yields of early rice at the two sites from 2016 to 2019. The n values is 48 at both sites in each treatment. GQ_GM, green manure treatment at the Gaoqiao site; GQ_WF, winter fallow treatment at the Gaoqiao site; NX_GM, green manure treatment at the Nanxian site; NX_WF, winter fallow treatment at the Nanxian site. Within each box, the solid line represents the median value, while the hollow block depicts the mean value. Top and bottom edges represent 75 and 25 percentiles, respectively. The solid circle represents value of each sample.

Figure 2.
Activities of enzymes in C metabolism. AG, α-glucosidase; BG, β-glucosidase; NAG, N-acetyl-glucosamidase; CB, β-cellobiosidase; XYL, β-xylosidase. n.s., no significant difference at p < 0.05 level. Figure 1 shows treatment abbreviations. Within each box, the solid line represents the median value, while the hollow block depicts the mean value. Top and bottom edges represent 75 and 25 percentiles, respectively. The solid circle represents value of each sample.

Figure 3.
Quantities of function genes involved in N cycling. AOA–amoA, amoA gene of ammonia-oxidizing archaea; AOB–amoA, amoA gene of ammonia-oxidizing bacteria. Figure 1 shows treatment abbreviations. Within each box, the solid line represents the median value, while the hollow block depicts the mean value. Top and bottom edges represent 75 and 25 percentiles, respectively. The solid circle represents the value of each sample. n.s. indicates there is no significant difference between two treatments.

Figure 4.
Observed species, Shannon index, and Pielou’s evenness of soil bacteria and fungi. Figure 1 shows treatment abbreviations. Within each box, the solid line represents the median value, while the hollow block depicts the mean value. Top and bottom edges represent 75 and 25 percentiles, respectively. The solid circle represents value of each sample. n.s. indicates there is no significant difference between two treatments.

Figure 5.
Z-score of soil multifunctionality (SMF), functional genes involved in N cycling (NFG), bacterial diversity (Bac_Div), and fungal diversity (Fun_Div). Figure 1 shows treatment abbreviations.
Figure 5.
Z-score of soil multifunctionality (SMF), functional genes involved in N cycling (NFG), bacterial diversity (Bac_Div), and fungal diversity (Fun_Div). Figure 1 shows treatment abbreviations.

Figure 6.
Combined bacterial–fungal co-occurrence networks (a). ASVs with relative abundance >0.01% (1986 ASVs for bacteria and 1088 ASVs for fungi) were included in the construction of network. Co-occurrence networks are colored by kingdom. Red and green nodes indicate bacterial and fungal ASVs, respectively. The size of each node is proportional to the degree. Red and green edges indicate positive and negative interactions, respectively, between two individual nodes. Network roles of analyzing feature at the ASV level determined in accordance with within- (Zi) and among-module (Pi) connectivity (b). The green text indicate the percentage of module hubs, the purple text indicate the percentage of connectors, the red text indicate the percentage of network hubs. Figure 1 shows treatment abbreviations.

Figure 7.
Node (a) and edge properties (b,c) of combined bacterial–fungal co-occurrence networks. Figure 1 shows treatment abbreviations.
Figure 7.
Node (a) and edge properties (b,c) of combined bacterial–fungal co-occurrence networks. Figure 1 shows treatment abbreviations.

Figure 8.
Mantel tests on keystone taxa in the combined bacterial–fungal ecological network and soil geochemical variables. SOM, soil organic matter; TN, soil total nitrogen; AP, soil available phosphorus; AK, soil available potassium; DOC, dissolved organic carbon; DON, dissolved organic nitrogen (a). AG, α-glucosidase; BG, β-glucosidase; NAG, N-acetyl-glucosamidase; CB, β-cellobiosidase; XYL, β-xylosidase (b). AOA, ammonia-oxidizing archaea amoA; AOB, amoA gene of ammonia-oxidizing bacteria (c). Soil, Z-score of soil properties; Enzyme, Z-score of C metabolism-related enzyme activities; SMF, soil multifunctionality, including soil properties and C metabolism-related enzymes; NFG, Z-score of copies of functional genes involved in N cycling (d). †, p < 0.1; *, p < 0.05; **, p < 0.01; ***, p < 0.0001. Figure 1 shows treatment abbreviations.

Figure 9.
Partial least squares path modeling of the effects of treatment; site; copies of functional genes involved in N cycling (NFG); and soil multifunctionality, including soil properties and C metabolism-related enzyme activities (SMF); bacterial and fungal diversity (Micro_div); ASVs that are significant enriched by different treatment based on MetagenomeSeq analysis (Sdif); and keystone taxa in the combined bacterial–fungal ecological networks (Keystone) on rice production (yield). Values in the graph (a) are path coefficients that indicate the direct relationships between latent variables, and values are reflected by the width of the arrows. Blue and red arrows indicate positive and negative correlations, respectively. The dashed arrows represent path coefficients that are not significantly different from zero (p > 0.05). The significance levels were determined based on 1000 bootstrapped resamples. The goodness of fit (GoF) index evaluates the overall predictive performance of the model. The composition and values of total effects on Micro_div (b), Sdif (c), Keystone (d), and yield (e) are also shown in the graph.


Table 1.
The differences between green manure and winter fallow, tested by permutational multivariate analysis of variance (PermANOVA).
Table 1.
The differences between green manure and winter fallow, tested by permutational multivariate analysis of variance (PermANOVA).
| Distance | Bacteria | Fungi | ||
|---|---|---|---|---|
| GQ | NX | GQ | NX | |
| Jaccard distance | 0.517 | 0.032 * | 0.183 | 0.015 * |
| Bray–Curtis distance | 0.612 | 0.011 * | 0.116 | 0.036 * |
| Unweighted UniFrac distance | 0.906 | 0.038 * | 0.064 | 0.027 * |
| Weighted UniFrac distance | 0.421 | 0.045 * | 0.084 | 0.163 |
The values in the table were p value in pairwise comparisons. *, p < 0.05.
Table 2.
Topological properties of the combined bacterial–fungal co-occurrence networks.
| Network Indexes | GQ_GM | GQ_WF | NX_GM | NX_WF |
|---|---|---|---|---|
| Empirical networks | ||||
| Number of nodes | 1082 | 1000 | 800 | 978 |
| Number of edges | 3278 | 2361 | 1979 | 4755 |
| R2 of power–law | 0.879 | 0.754 | 0.88 | 0.638 |
| Average connectivity | 6.059 | 4.722 | 4.947 | 9.724 |
| Average clustering coefficient (avgCC) | 0.447 | 0.448 | 0.516 | 0.495 |
| Average path length (GD) | 6.890 | 7.865 | 6.511 | 5.789 |
| Transitivity | 0.487 | 0.479 | 0.505 | 0.55 |
| Connectedness | 0.619 | 0.688 | 0.343 | 0.803 |
| Modularity and (the number of modules) | 0.745 (96) | 0.836 (84) | 0.800 (139) | 0.737 (49) |
| Random networks | ||||
| avgCC ± SD | 0.016 ± 0.002 | 0.008 ± 0.002 | 0.017 ± 0.003 | 0.034 ± 0.002 |
| GD ± SD | 3.835 ± 0.016 | 4.390 ± 0.021 | 3.977 ± 0.031 | 3.245 ± 0.012 |
| Modularity ± SD | 0.380 ± 0.003 | 0.459 ± 0.004 | 0.434 ± 0.004 | 0.271 ± 0.003 |
Figure 1 shows treatment abbreviations.
Disclaimer/Publisher’s Note: The statements, opinions and data contained in all publications are solely those of the individual author(s) and contributor(s) and not of MDPI and/or the editor(s). MDPI and/or the editor(s) disclaim responsibility for any injury to people or property resulting from any ideas, methods, instructions or products referred to in the content. |
© 2024 by the authors. Licensee MDPI, Basel, Switzerland. This article is an open access article distributed under the terms and conditions of the Creative Commons Attribution (CC BY) license (https://creativecommons.org/licenses/by/4.0/).
Share and Cite
MDPI and ACS Style
Feng, Y.; Liang, H.; Nie, J.; Li, Y.; Cao, W. Roles of Microbial Community and Keystone Taxa in Rice Productivity under Green Manuring in South China. Sustainability 2024, 16, 3565. https://doi.org/10.3390/su16093565
AMA Style
Feng Y, Liang H, Nie J, Li Y, Cao W. Roles of Microbial Community and Keystone Taxa in Rice Productivity under Green Manuring in South China. Sustainability. 2024; 16(9):3565. https://doi.org/10.3390/su16093565
Chicago/Turabian StyleFeng, Yu, Hai Liang, Jun Nie, Yongmei Li, and Weidong Cao. 2024. "Roles of Microbial Community and Keystone Taxa in Rice Productivity under Green Manuring in South China" Sustainability 16, no. 9: 3565. https://doi.org/10.3390/su16093565
Note that from the first issue of 2016, this journal uses article numbers instead of page numbers. See further details here.