
Financial Risk Factor Analysis for Facility Gas Leakages of H2 and NG

1
Department of Safety Engineering, Incheon National University, Incheon 22012, Korea
2
Department of Safety Engineering, Fire Disaster Prevention Research Center, Incheon National University, Incheon 22012, Korea
*
Author to whom correspondence should be addressed.
Sustainability 2016, 8(9), 944; https://doi.org/10.3390/su8090944
Submission received: 28 June 2016
/
Revised: 25 August 2016
/
Accepted: 12 September 2016
/
Published: 18 September 2016
(This article belongs to the Section Sustainable Engineering and Science)
Abstract
:Fuel cells may be the key to a more environmentally-friendly future because they emit low carbon dioxide per unit of energy supplied. However, little work has investigated the potential financial risks pertaining to fuel cell systems. Often used in the analysis of the safety of systems involving flammable or hazardous materials, risk factor analysis has recently been used to analyze the potential financial losses that may occur from industrial hazards. Therefore, this work undertakes a financial risk factor analysis to determine the costs of leakages of hydrogen and natural gas, which are used in fuel cell systems. Total leakage was calculated from an analysis of several leakage rates and modes. The impact of applying appropriate detection and prevention systems was also investigated. The findings were then used to analyze the consequences for various sections of the system and to calculate the overall cost based on facility outage or damage, and the cost of taking safety precautions. This provides a basis for comparison among proposed potential reactionary measures.
1. Introduction
Fuel cells are energy-conversion devices that directly convert a fuel’s chemical energy to electrical energy via chemical reactions [1]. Unlike conventional batteries, which require charging, fuel cells can continuously supply electricity as long as they have a supply of fuel [2]. Fuel cells consist of an electrolyte material sandwiched between two electrodes, which are surrounded by oxygen and hydrogen (H2), respectively. Hydrogen ions and electrons cross the electrolyte to produce electricity and water. Various fuels—including natural gas (NG), methanol, and gasoline—can be used to produce H2 via a fuel reformer [3]. The potential for decreased emissions of carbon dioxide per unit of electricity supplied has given rise to fuel cells that are being touted as a core technology for a low-carbon, green-growth society that is more dependent on new and renewable energy sources and less dependent on fossil fuels [4].
In the Republic of Korea, several large companies are developing and testing fuel cell systems in industrial research facilities. However, systems that include H2 fuel cells or processes that use H2 as a fuel source risk significant losses from accidental explosions caused by H2 leaks. Despite these risks, research and investments in H2 energy mainly focus on technological development and commercialization of the technology and less so on the associated safety aspects.
To ensure sustainable management of the fuel cell system, this research investigates the potential financial costs of H2 and NG leakage from fuel cell systems. The theoretical leakage rates, and modes of leakage were used to calculate the total leakage amount, which was then adjusted according to whether various appropriate detection and prevention systems were in place. The findings were then used to analyze the consequences for various sections of the system and to calculate the overall cost based on facility stoppage or damage, and the cost of taking safety precautions.
2. Problem Statement
Risk analyses on existing facilities have been conducted using qualitative analysis methods; however, these have mostly been limited to calculating the potential frequency and magnitude of accidents that may occur. Even though an accident at an industrial facility would likely also carry significant financial risk, no analyses of costs arising from accidents in industrial facilities in Korea have been reported. The studies on risk analysis of the associated H2 gas have been mainly devoted to hazard evaluation by Event Tree Analysis [5] or extraordinary phenomena associated with the release of hydrogen in a hydrogen fueled vehicle [6,7,8]. However, little research has been reported that implements exemplar case studies to investigate the consequences of accidents related to H2 gas facilities. In addition, it is necessary to analyze processes (including the production, installation, and operation of these facilities) that generate H2 from NG using reforming technology [9]. Because leaks of these two gases can lead to severe accidents such as fires, explosions, and the poisoning of ecosystems, quantitative risk evaluation analyses including financial consequences and the implementation of appropriate safety prevention mechanisms to address any risks must be carried out.
3. Methodology
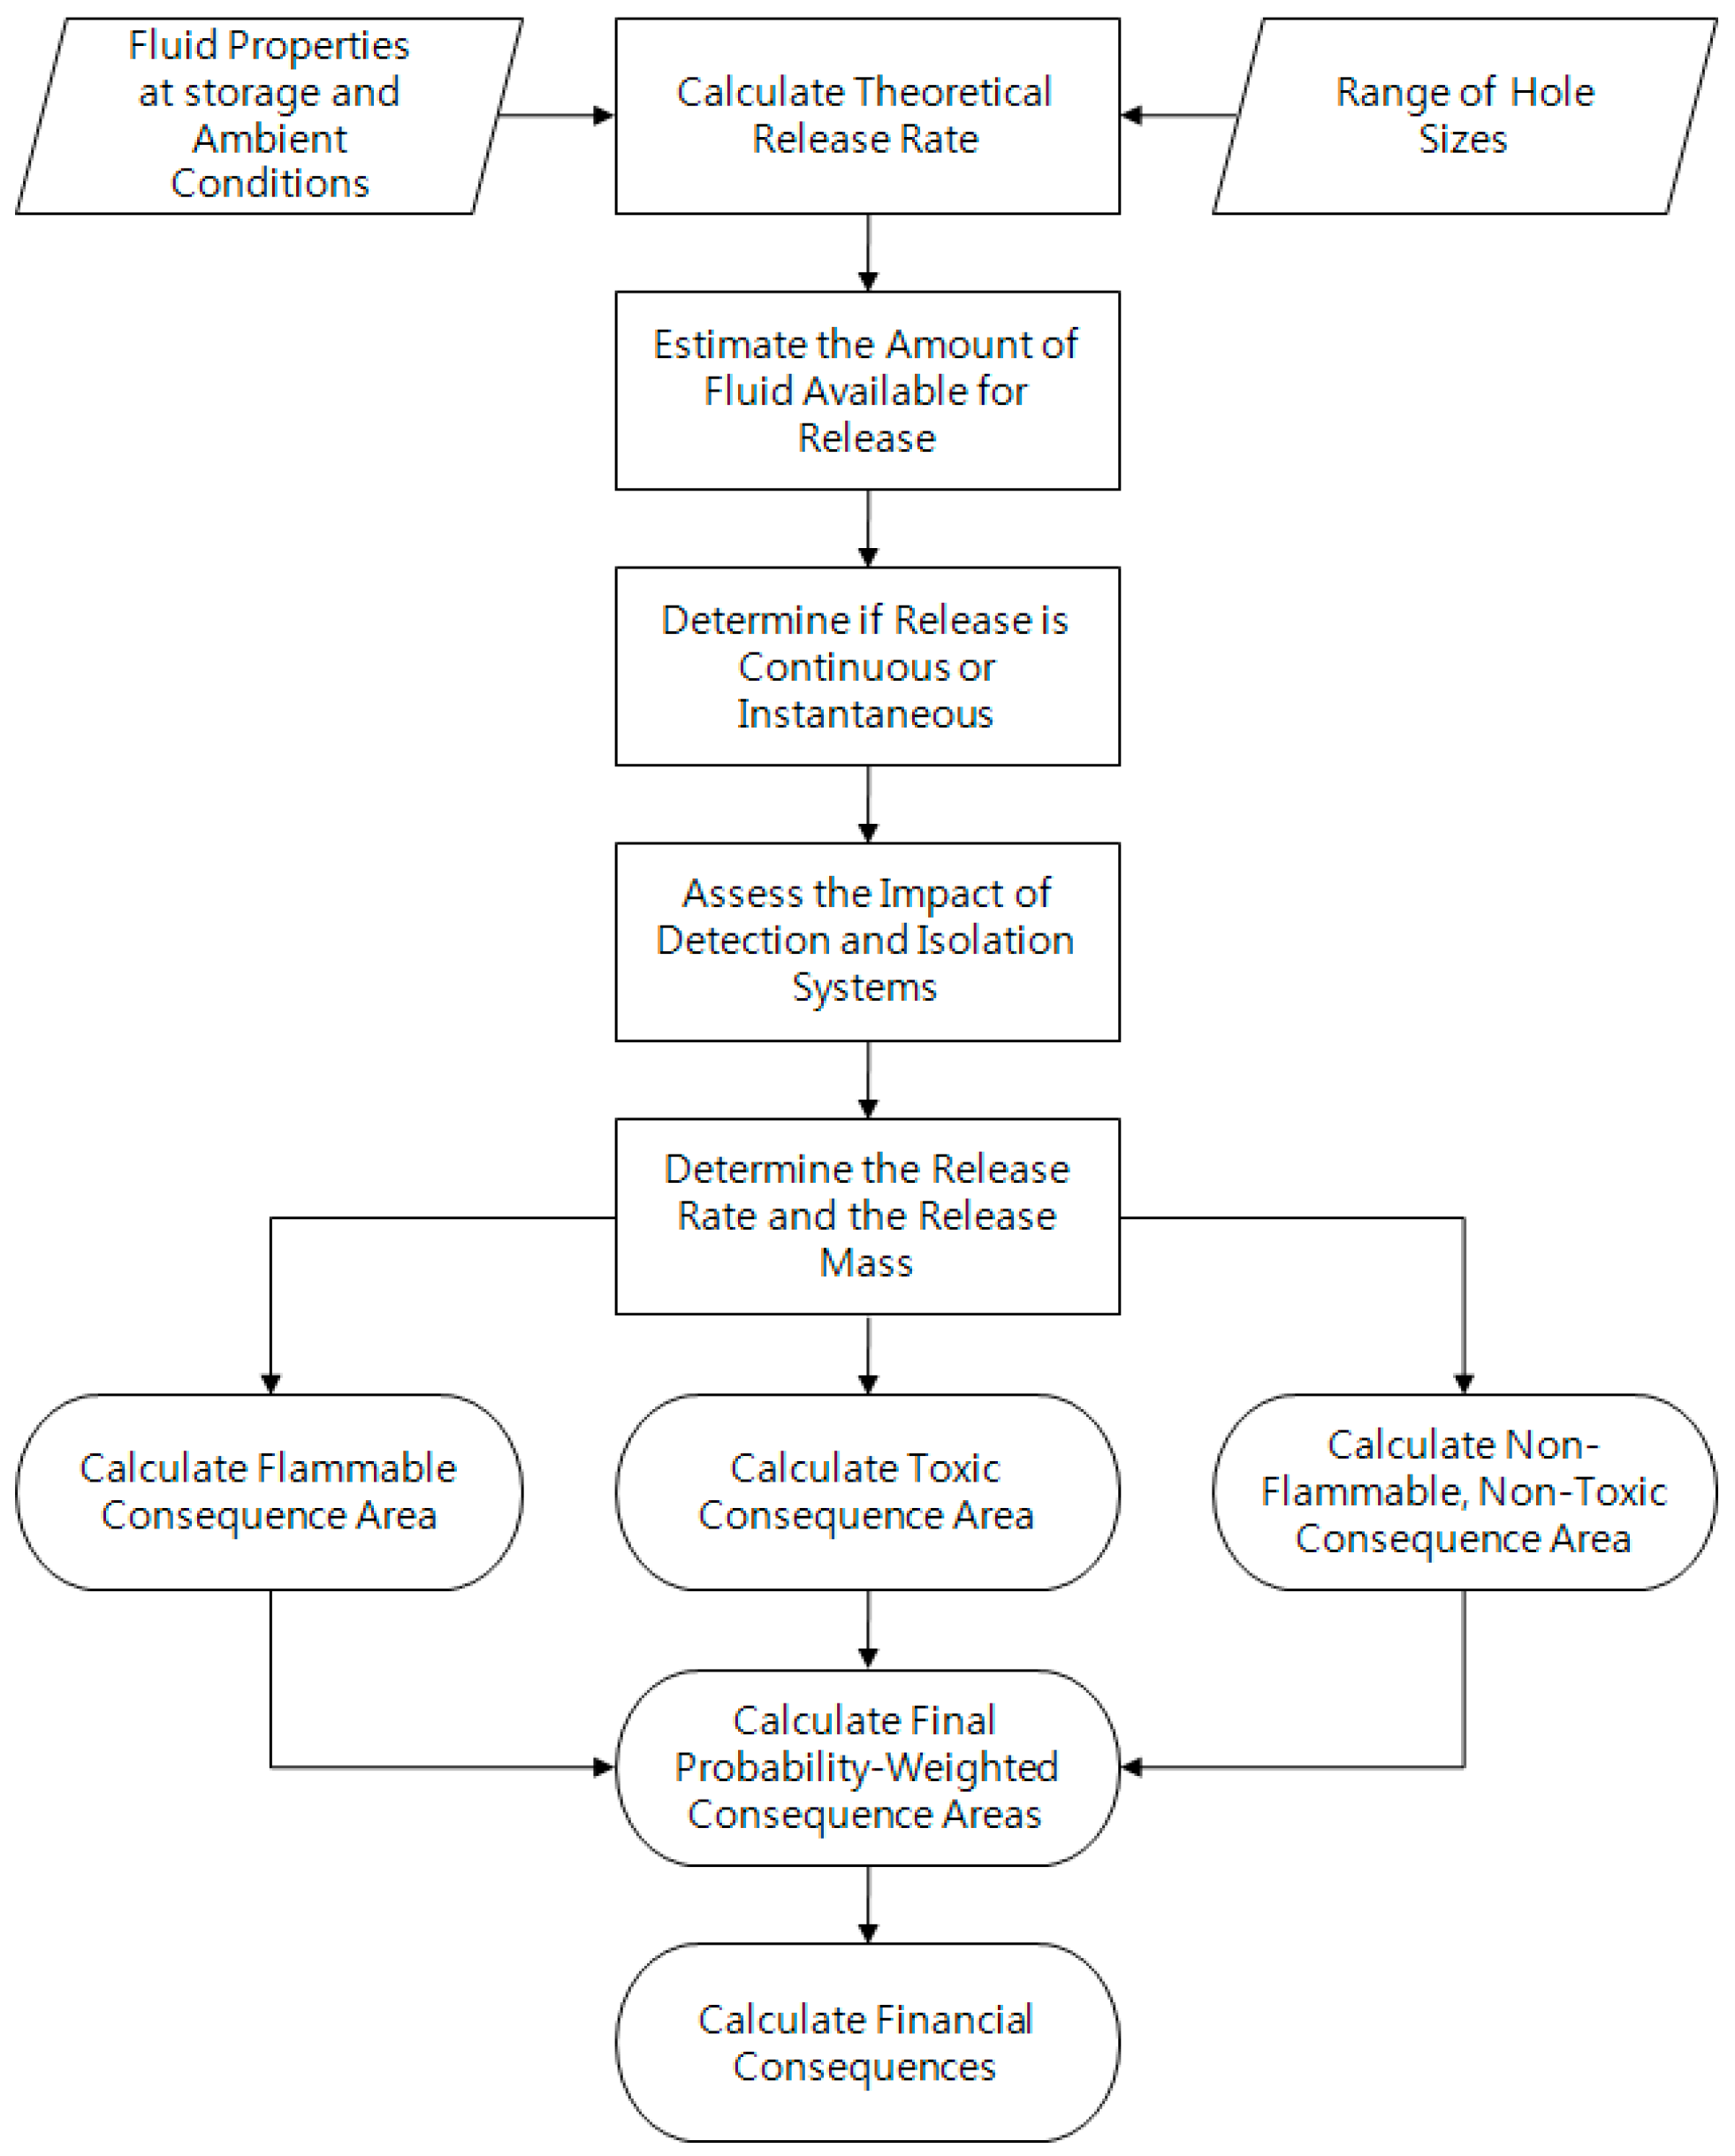
The schematic diagram shown in Figure 1 outlines the methodology used to calculate the potential financial consequences of a leak of H2 or NG. The leakage scenario, characteristics of the fluids, nominal leakage rate, gas inventory, mode of release, and impact of any detection/isolation systems are necessary to determine leakage rate and leakage mass. These results were then used to estimate the magnitude of the associated consequences and the associated costs.
3.1. Physiochemical Characteristics of NG and H2
Quantifying the leakage impact of H2 or NG requires the fluids’ physical properties, such as the normal boiling point (NBP), molecular weight (), specific heat of the ideal gas (), heat capacity (), and auto-ignition temperature (AIT). The physical properties of NG and H2, shown in Table 1, were sourced from the American Petroleum Institute (API) [10]. The heat capacities of the fluids were calculated using Equation (1):
where is the heat capacity of the ideal gas (J/mol·K), , , , and are coefficients of [11], and is the process temperature (K).
3.2. Determining Leakage Hole Size and Pipe
To accurately assess the magnitude of the accident consequence, the leakage hole size must be selected within the range of an actually implementable size, but this is not always realistic. Therefore, it is recommended to use leakage holes that have been assessed as possible through previous experience and practice, and the leakage holes are classified as small, medium, large and rupture hole sizes according to API categorization [10]. Table 2 shows the size of the leakage holes defined in order to predict the consequence in accordance to the guidelines of API. The upper limit of the range (6.4 mm) was used for small holes. The midpoint of the respective ranges was used for medium and large holes. For ruptures (>152 mm) smaller than the pipe diameter, 406 mm was chosen.
3.3. Leakage Rate Calculation
The leakage rate is related to the physical characteristics of the gas, the initial state, and the physical conditions of the fluid in the process. The rate was calculated using Bernoulli and Torricelli’s equation [12]:
where is the fluid leakage rate (kg/s), is the leakage coefficient (0.60–0.64), is the cross-sectional area of the leakage hole (mm2), is the density of the fluid (kg/m3), is the pressure gradient, and is the transfer factor (1.0 kg·m/N·s2).
In addition, the leakage may be either characterized as sonic or subsonic. When the pressure in the facility is greater than , as defined by Equation (3) and the flow was, therefore, sonic, Equation (4) was employed. Otherwise, when the flow was subsonic, Equation (5) was used [11].
3.4. Calculation of Potential Leakage Capacity
The leakage capacity of a system can be calculated by summing the individual inventories of gas in each process unit. For the leakage capacity, the smaller value between the summation of the capacity of all the facilities within the inventory group, and the additional leakage capacity to the inventory of each of the individual facilities, is used. In the event of an accident, the actual leakage capacity can be limited by separating the fluid flow using detection and isolation systems. The maximum capacity of the inventory group is calculated from the sum of the inventory capacities of the individual facilities, as shown in Equation (6) and the limiting capacity of the individual facilities. The additional capacity in the event of an accident is computed by Equation (7) with leakage rate associated with n-th release hole size and , which is the maximum flow rate that can be added to the release as contributed from the surrounding equipment in the inventory group. The release hole size of is limited to a maximum diameter of 8 inches because this diameter represents a practical maximum value for a release calculation with consideration of the leakage diameter 406 mm (16 inches) by rupture in Table 2 and disintegration of the equipment item together. Then, the unique inventory capacity and additional capacity of the individual facilities are summed together to calculate the capacity. The additional mass presented in Equation (7) was computed by assuming leakage for three minutes from the component’s inventory group. Accordingly, the coefficient 180 is the factor converting the unit of leakage rate and (kg/s) into required amount of released material.
The inventory capacity and the limiting capacity were then compared and the smallest of the two was taken as the mass available to leak ():
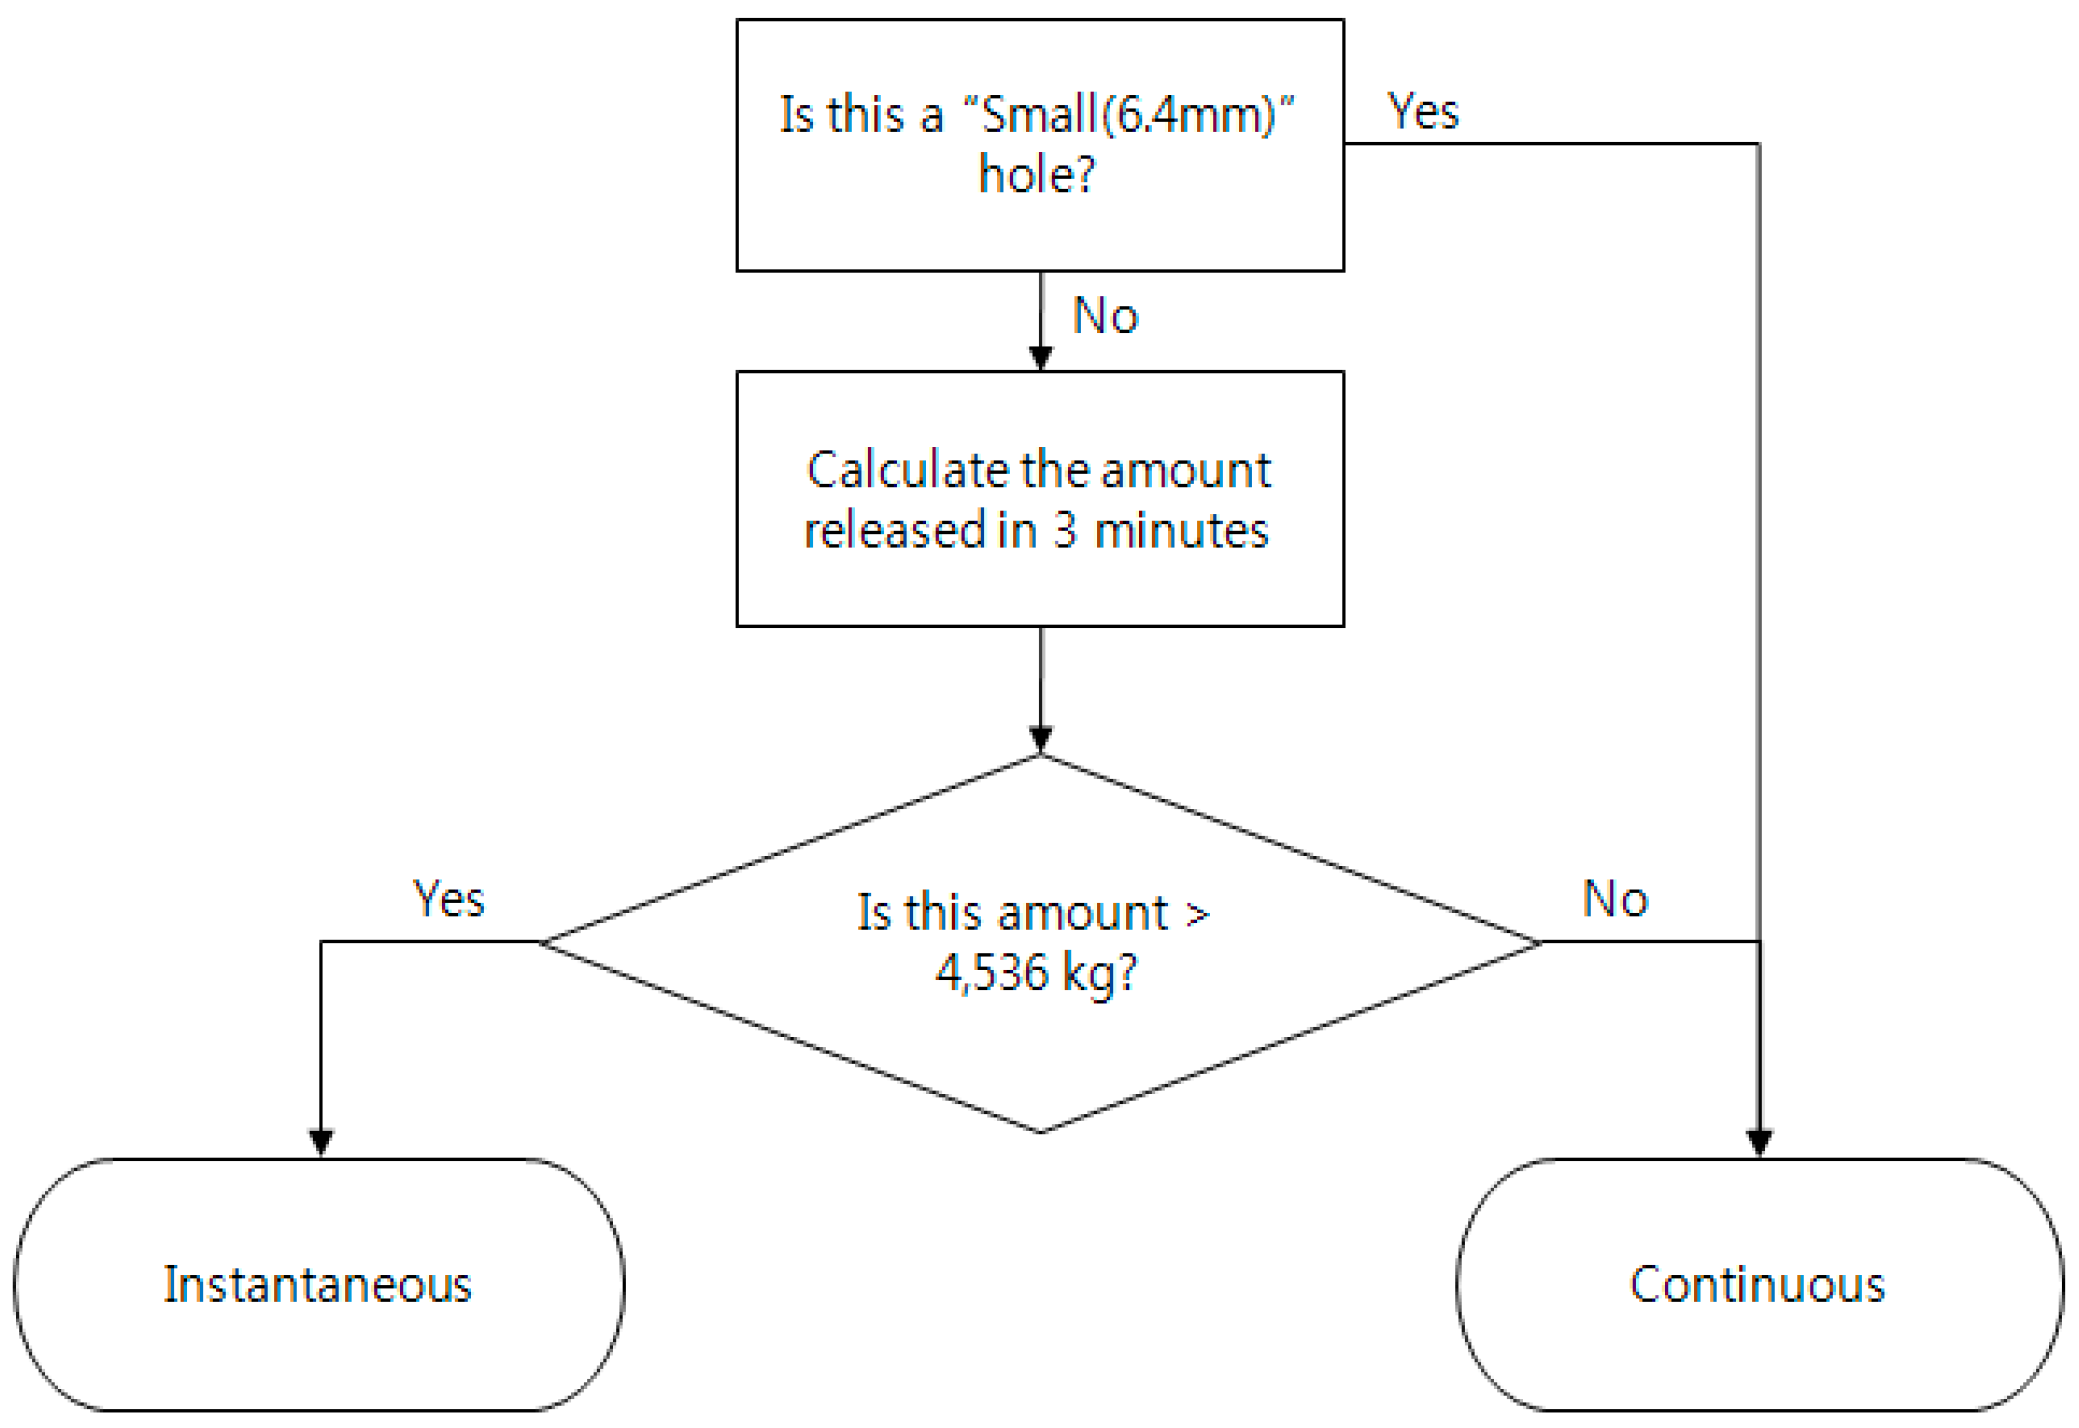
3.5. Determination of Leakage Type
3.6. Detection and Isolation Systems
Fault detection usually refers to identifying the presence of a fault in a system, in this case a leak, and fault isolation represents the separation of the faulty component among the hazards. Most process facilities have detection and isolation systems installed to minimize the consequences of accidents that may occur. Consequently, both the detection and isolation systems have a direct influence on the leakage duration (). API [10] classified the type of the detection and isolation systems as shown in Table 3, and recommended the use of the reduction factor, . Table 4 shows the leakage adjustment rate with graded activation of detection and isolation. The practical and empirical leakage reduction rates, according to the detection level of Table 3, were assumed as 0.5 (A), 0.375 (B), and 0 (C), respectively. This means that when the leakage is observed by the naked eye, the leakage reduction by detection cannot be achieved. The release rates lowered by isolation were presumed to be 0.5 (A), 0.4 (B), and 0.2 (C), which gives a better reduction rate compared with detection. The multiplications of these two detection and isolation rates provide the values presented in the last column of Table 4. With this information, the leakage rate associated with the n-th release hole size () is corrected by the reduction factor as shown in Equation (9), and the leakage mass for n-th release hole size () is obtained by Equation (10).
The actual duration of the release for n-th release hole size () is determined by Equation (11). It is quantified by selecting a minimum value between the release mass divided by the release rate and the maximum leak duration () for each of the selected release hole sizes presented in Table 5. API [10] implemented a series of consequence analysis by a PHAST software program with release durations of 5 min, 10 min, 20 min, 30 min, 40 min, and 60 min, and evaluated the consequence area for varying release hole sizes. is the sum of the time to detect and isolate the leak, time to analyze the incident and decide upon corrective actions, and time to complete appropriate response measures. In Table 5, the maximum leak duration is confined by 60 min because it is expected that the personnel will shut down the plant and take appropriate actions to limit the release, and will move out or evacuate workers within 60 min of the initial exposure. The unit of in Equation (11) is seconds while has minute dimension, and hence is multiplied by 60 to meet the dimensional homogeneity.
3.7. Impact of an Accident and Its Consequences
API [10] provides guidelines for predicting the consequences of accidental continuous () and instantaneous () leakages, such as fires and explosions, as follows:
where is the impacted area (ft2) and and are coefficients determined by the conditions in Table 6.
The Continuous Auto-Ignition Not Likely (CAINL), Continuous Auto-Ignition Likely (CAIL), Instantaneous Auto-Ignition Not Likely (IAINL), and Instantaneous Auto-Ignition Likely (IAIL) shown in Table 6 differentiate between instantaneous and continuous leakages and also between flammable and non-flammable fluids. For leakages that lie between the instantaneous and continuous leakages as they have been defined, the correction factor, , was calculated using Equation (14), and the magnitude of the consequences () was corrected by Equation (15).
A further correction factor () with normal operating temperature () and auto-ignition temperature (AIT) was introduced to represent the portion of gas that cannot spontaneously combust.
The value of was set as 0 when + 55.6 > AIT and as 1 when − 55.6 < AIT.
The weighted average was then computed by Equation (18) with the generic failure frequency for n-th release hole size () and the total generic failure frequency defined by . The summation from 1 to 4 is used because it is usual to evaluate four release hole sizes.
3.8. Calculation of Financial Impact
The total cost that could be attributed to an accident’s consequences () included: Maintenance and replacement costs (); damage costs to facilities affected by the consequences of any leak (); facility stoppage or outage costs (); industrial costs (); and environmental cleaning costs ().
was calculated using Equation (20), by taking into consideration the leakage hole size and the material of the facility:
where is the damage-related cost according to the type of facility for each leakage scenario and is a conversion factor that accounts for the facility material.
was calculated using Equation (21) with the damaged area and the facility cost () obtained by the density of the facilities in the range.
was calculated by summing the duration for which the facility itself () and the wider affected processes () were out of service and multiplying this sum by the cost of lost production ().
was calculated by Equation (25) using the damaged area, population density () and per capita human-related costs of an accident ().
represents the fee associated with cleaning up residue material after the leaked fluid had evaporated. The evaporation rate was calculated using Equation (26). The amount of fluid remaining after evaporation was calculated using Equation (27). was then calculated using Equation (28).
where is the evaporation rate; is the volume of the residue after evaporation; and is the cleaning cost associated with cleaning 1 kg of residue. Other subjective factors such as reputational damage were not considered.
4. Case Study
An example scenario was created according to the procedure in Figure 1 and the parameters in Table 7 were used to analyze the potential impacts of fire and explosion caused by leakage of H2 or NG from a fuel cell system. Pipe size, vessel type, temperature, pressure, and gas inventories were selected to represent typical operating conditions. Automatic internal (A), external (B), and naked eye (C) detection systems were considered. Three isolation systems were also analyzed: One was automatically connected to the detection device (A); one required manual intervention by a worker in a control room (B); and one required the worker to isolate the leak manually (C). Because the financial loss differs significantly depending on the material used to construct the facilities, the analysis was conducted using carbon steel (CS, 1.25Cr-0.5Mo, 5Cr-0.5Mo) and stainless steel (304SS, 316SS).
Delphi by Embarcadero Technologies (Ver. 7.0) was used to calculate the magnitude of the impacts and the associated costs arising from leakages of H2 and NG according to the parameter ranges described above (see Figure 3).
5. Discussion
Two methods are widely used to assess the financial consequence of a leakage accident. The first one is the worst scenario method. In this method, rupture is involved in the analysis, and the results are generally unrealistic with an overestimated prediction. In contrast, the weighted average method by Equation (18) is usually preferred because it uses a frequency concept for each leakage hole size, and hence provides appropriate evaluations.
In this study, the weighted average was calculated as follows. The release by small leakage and rupture was considered in 1 inch pipe. For 2 inches and 4 inches pipe, small, medium, and rupture leakage were implemented. The weighted average of vessel type included small, medium, large, and rupture leakage. As for the leakage by rupture of the vessel, the hole size was configured to 406 mm according to the guidelines presented by API [10].
5.1. Leakage Rate
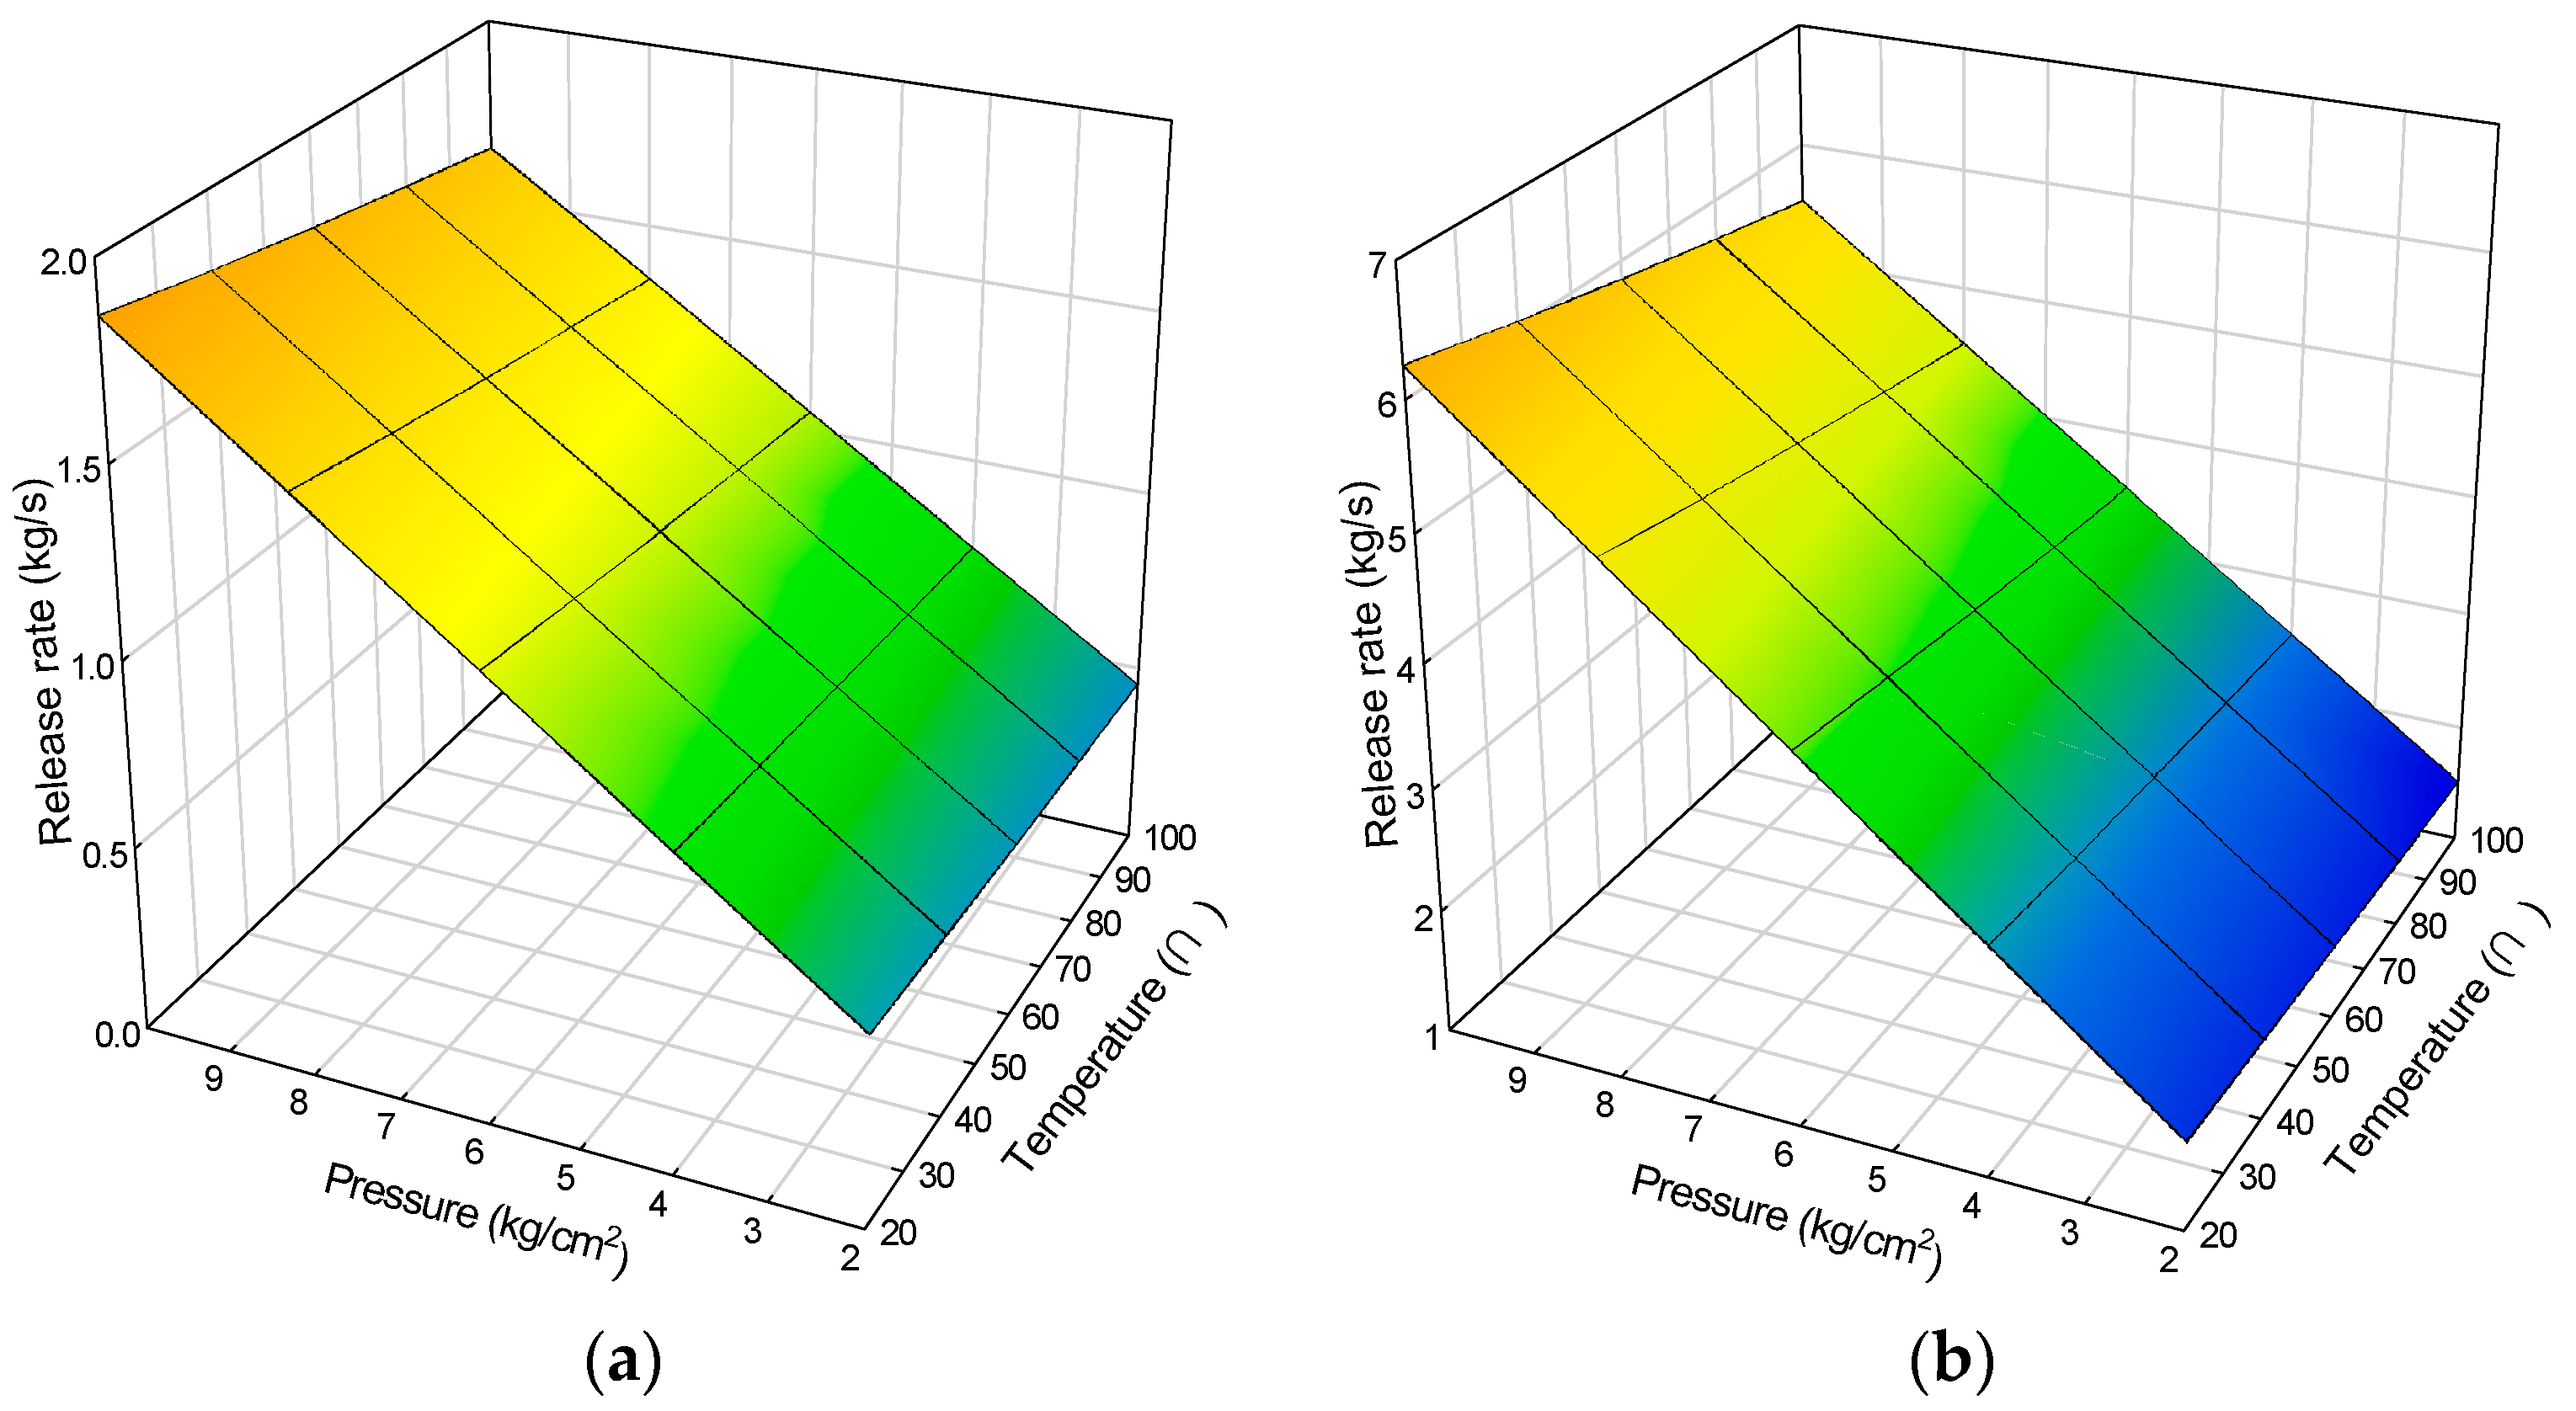
The impacts of the leakage rates of NG and H2, by varying the temperature and pressure, are shown in Figure 4. Pressure influenced the leakage rate more significantly than temperature, and at low pressures, changing the temperature had no noticeable influence on the leakage rate. However, at higher pressures, a decrease in temperature caused a moderate increase in leakage rate. This can be explained by considering that at high temperatures, the mass flow rate decreases even if the volumetric flow rate increases. The leakage rate from the 4-inch pipe was approximately 10 times higher than that from the 1-inch pipe. This disparity is explained by considering that the 1-inch pipe only permitted small leaks and ruptures while the larger pipe also permitted leakage from medium-sized holes.
The leakage rates for H2 (Figure 4a,c) were lower than those of NG (Figure 4b,d). This was because, at the same temperature and pressure, the molecular weight of NG ( = 16) is eight times greater than that of H2 ( = 2). Because the leakage rate is proportional to the square root of the molecular weight, this resulted in a leakage rate of NG that was approximately three times greater than that of H2. The amount of gas in the inventory and the detection and isolation systems were confirmed to have no effect on the leakage rate. Instead, these factors only affected the financial losses by influencing how long the leakage continued.
The weighted average leakage rates of H2 and NG from vessels are shown in Figure 5, which represented similar trends to those observed in Figure 4 for leakage from pipework. The leakage rate of NG was a factor of three greater than that of H2. However, the actual rates of leakage from the vessels were significantly higher than those observed from pipework because, unlike for pipework, leakage from all hole sizes was possible. For scenarios with leakage through large holes and ruptures, representative sizes of 102 and 406 mm were used, respectively.
5.2. Impact of Various Factors on Total Cost
Because both NG and H2 evaporate completely upon being leaked, there was no need to consider the environmental cleaning costs. Consequently, the total financial losses were calculated from the costs of stopping the facility, damage to the facility, and safety costs.
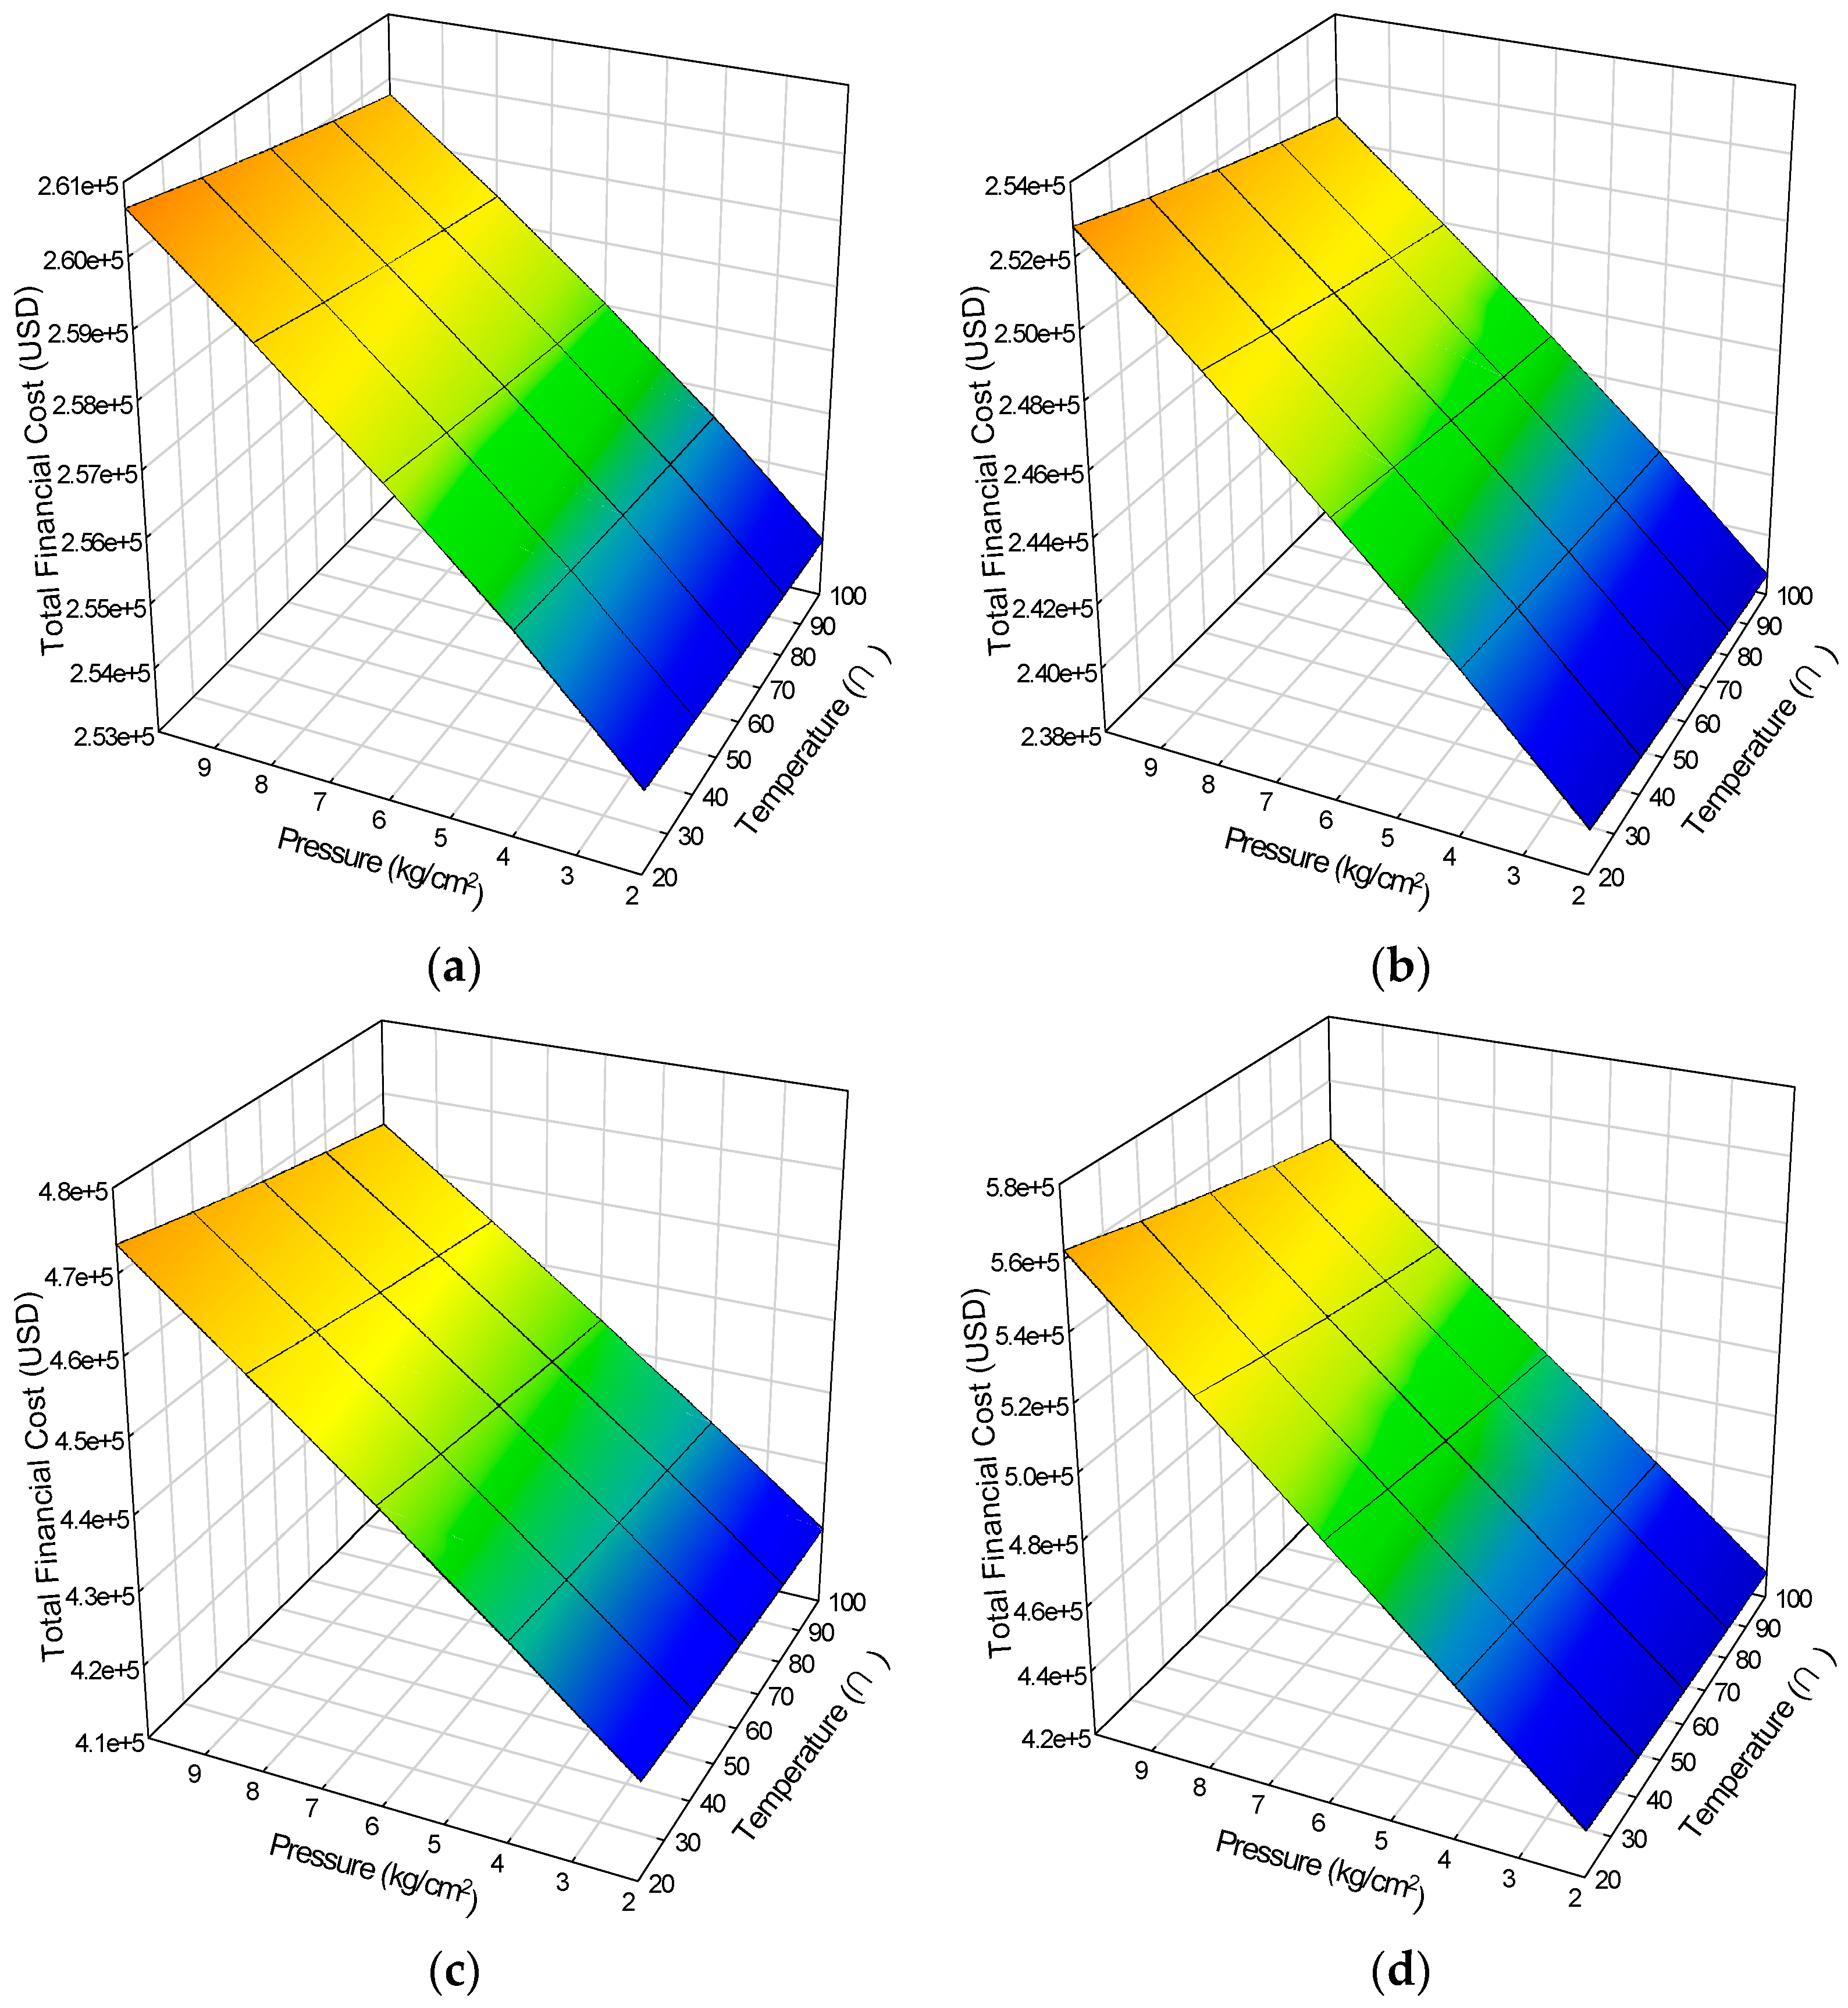
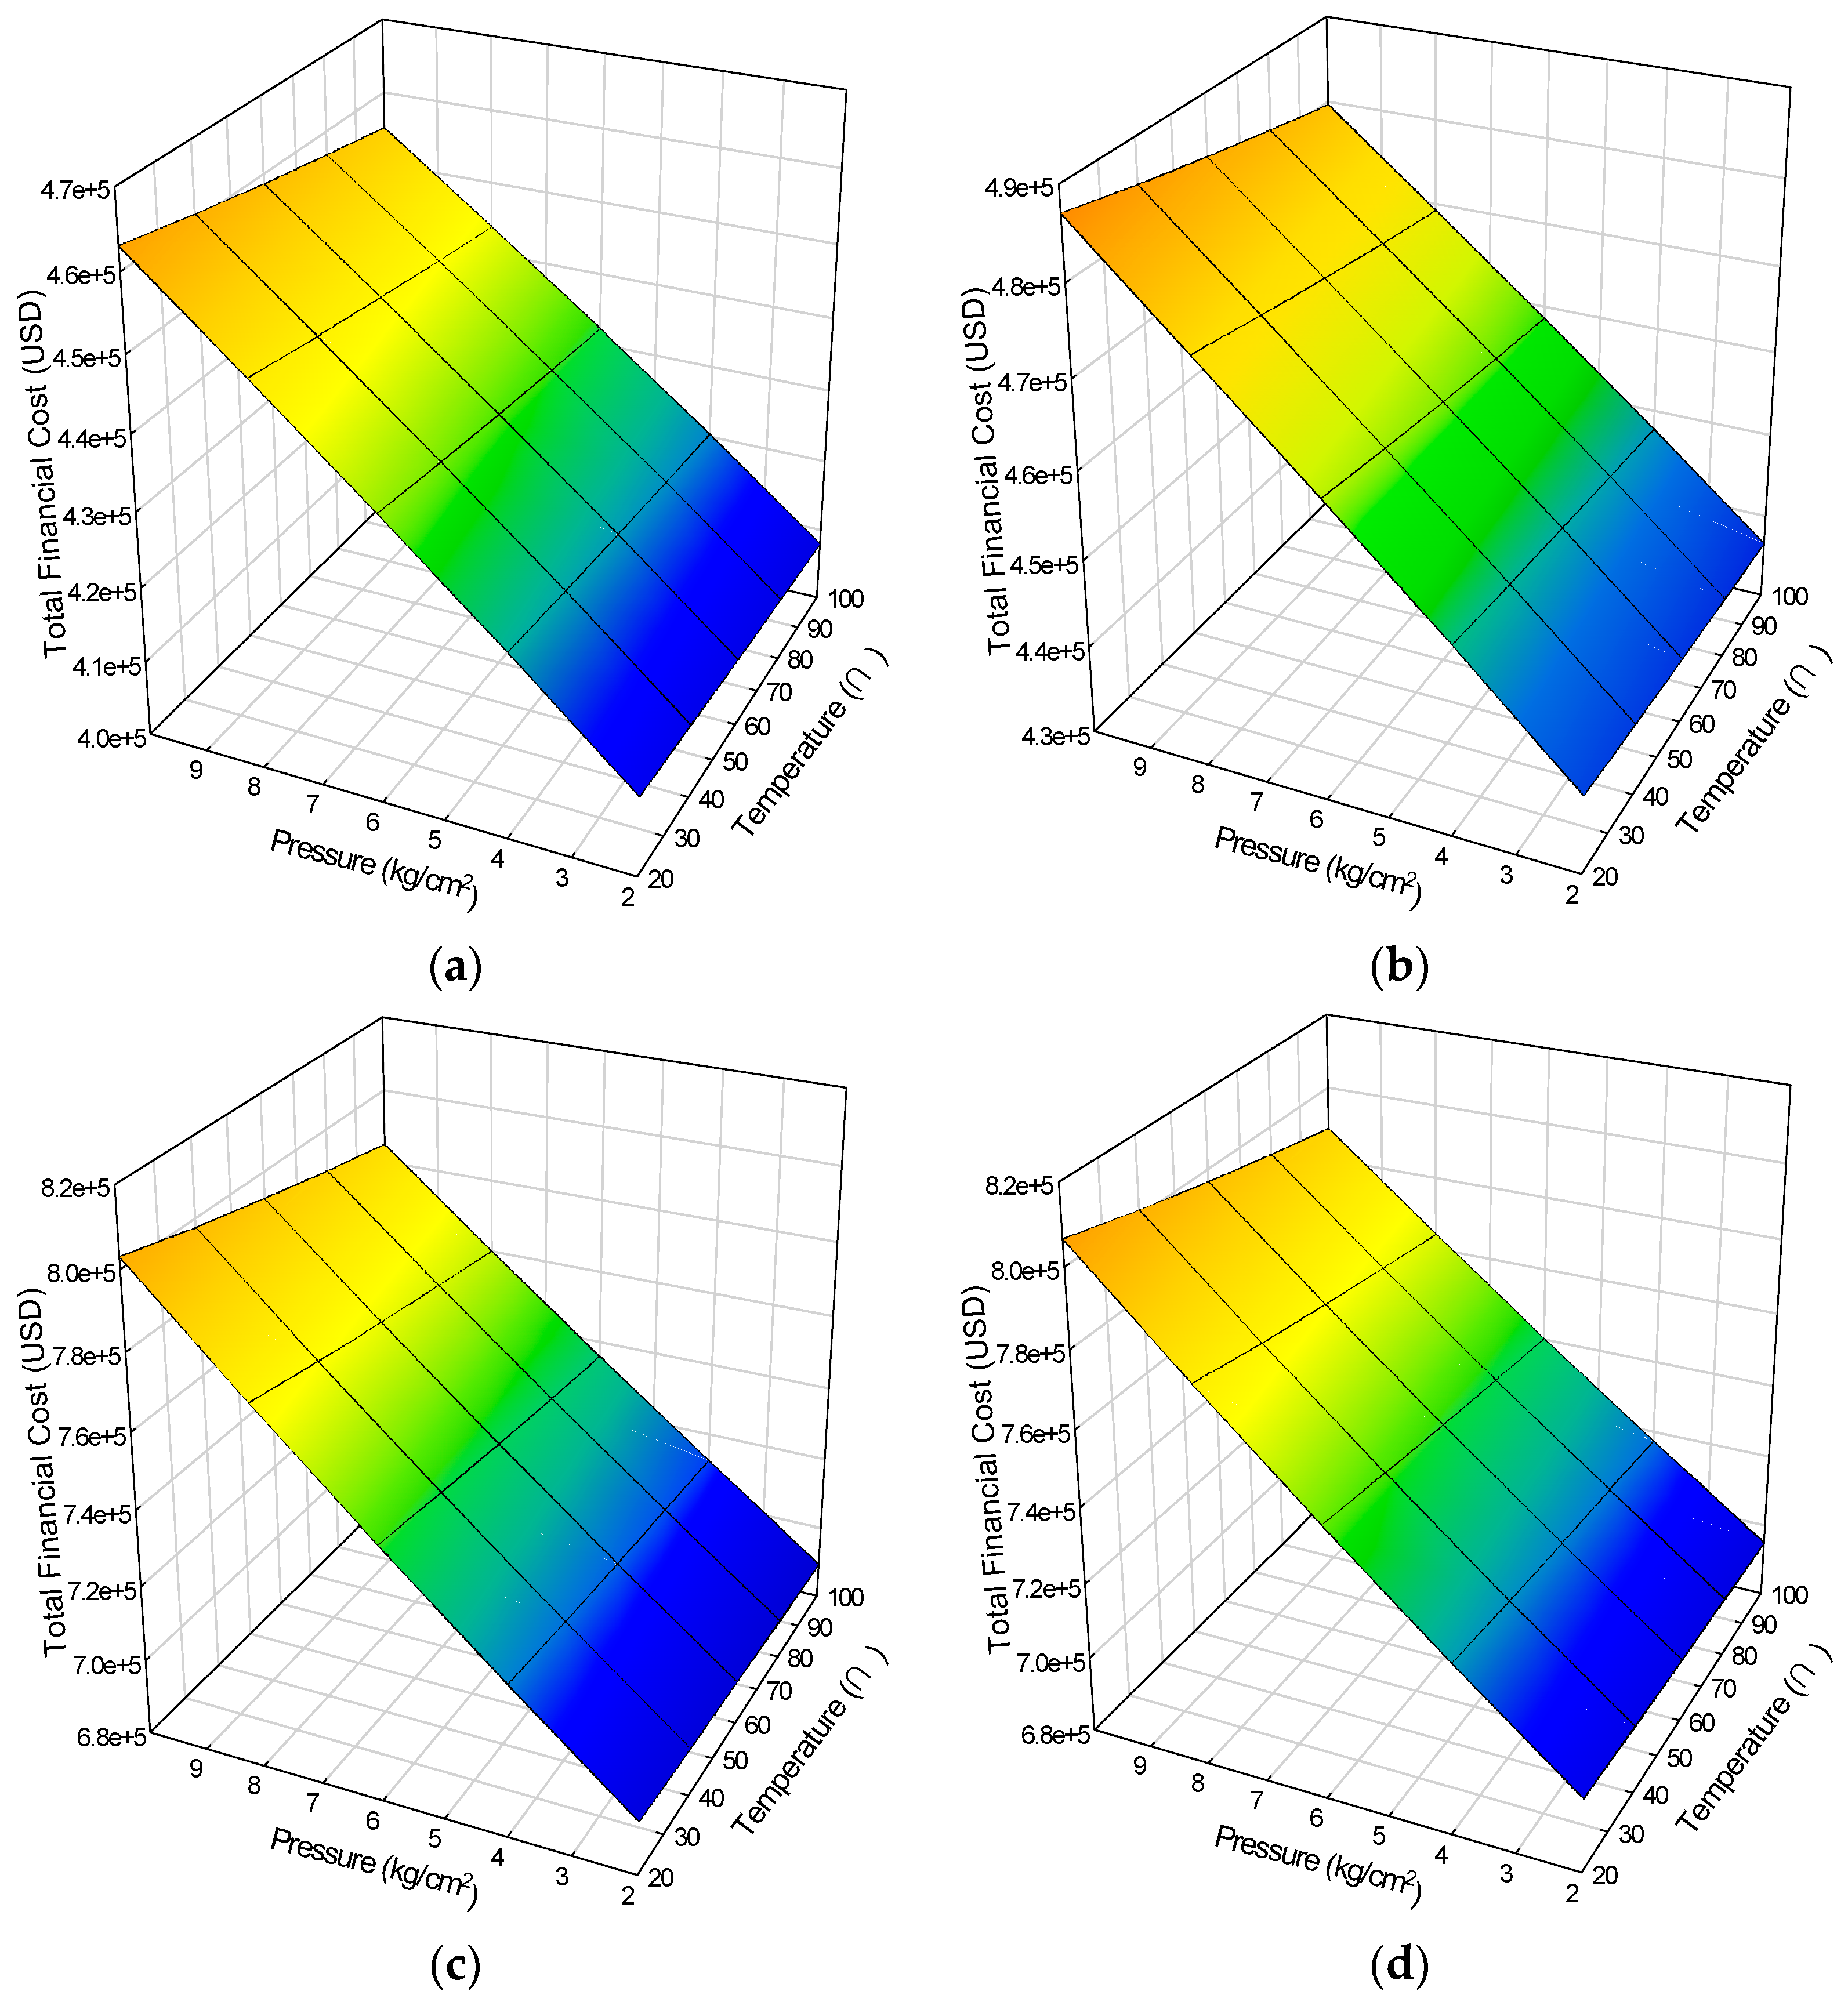
Figure 6 shows the weighted total financial costs for 1- and 4-inch pipe. Similar results were obtained for the individual components (not shown). For leakage from the 1-inch pipe, the maximum costs for H2 and NG were USD (The United States Dollar) 2.61 × 10⁵ and 2.53 × 10⁵, respectively. The respective amounts for the 4-inch pipe were USD 4.75 × 10⁵ and 5.60 × 10⁵. It is remarkable that the cost of H2 leakage was higher than that of NG in the case of the 1-inch pipe, but lower for the 4-inch pipe case. Additionally, the total costs were much more influenced by the costs associated with stopping production and safety than the costs associated with damage to the facility.
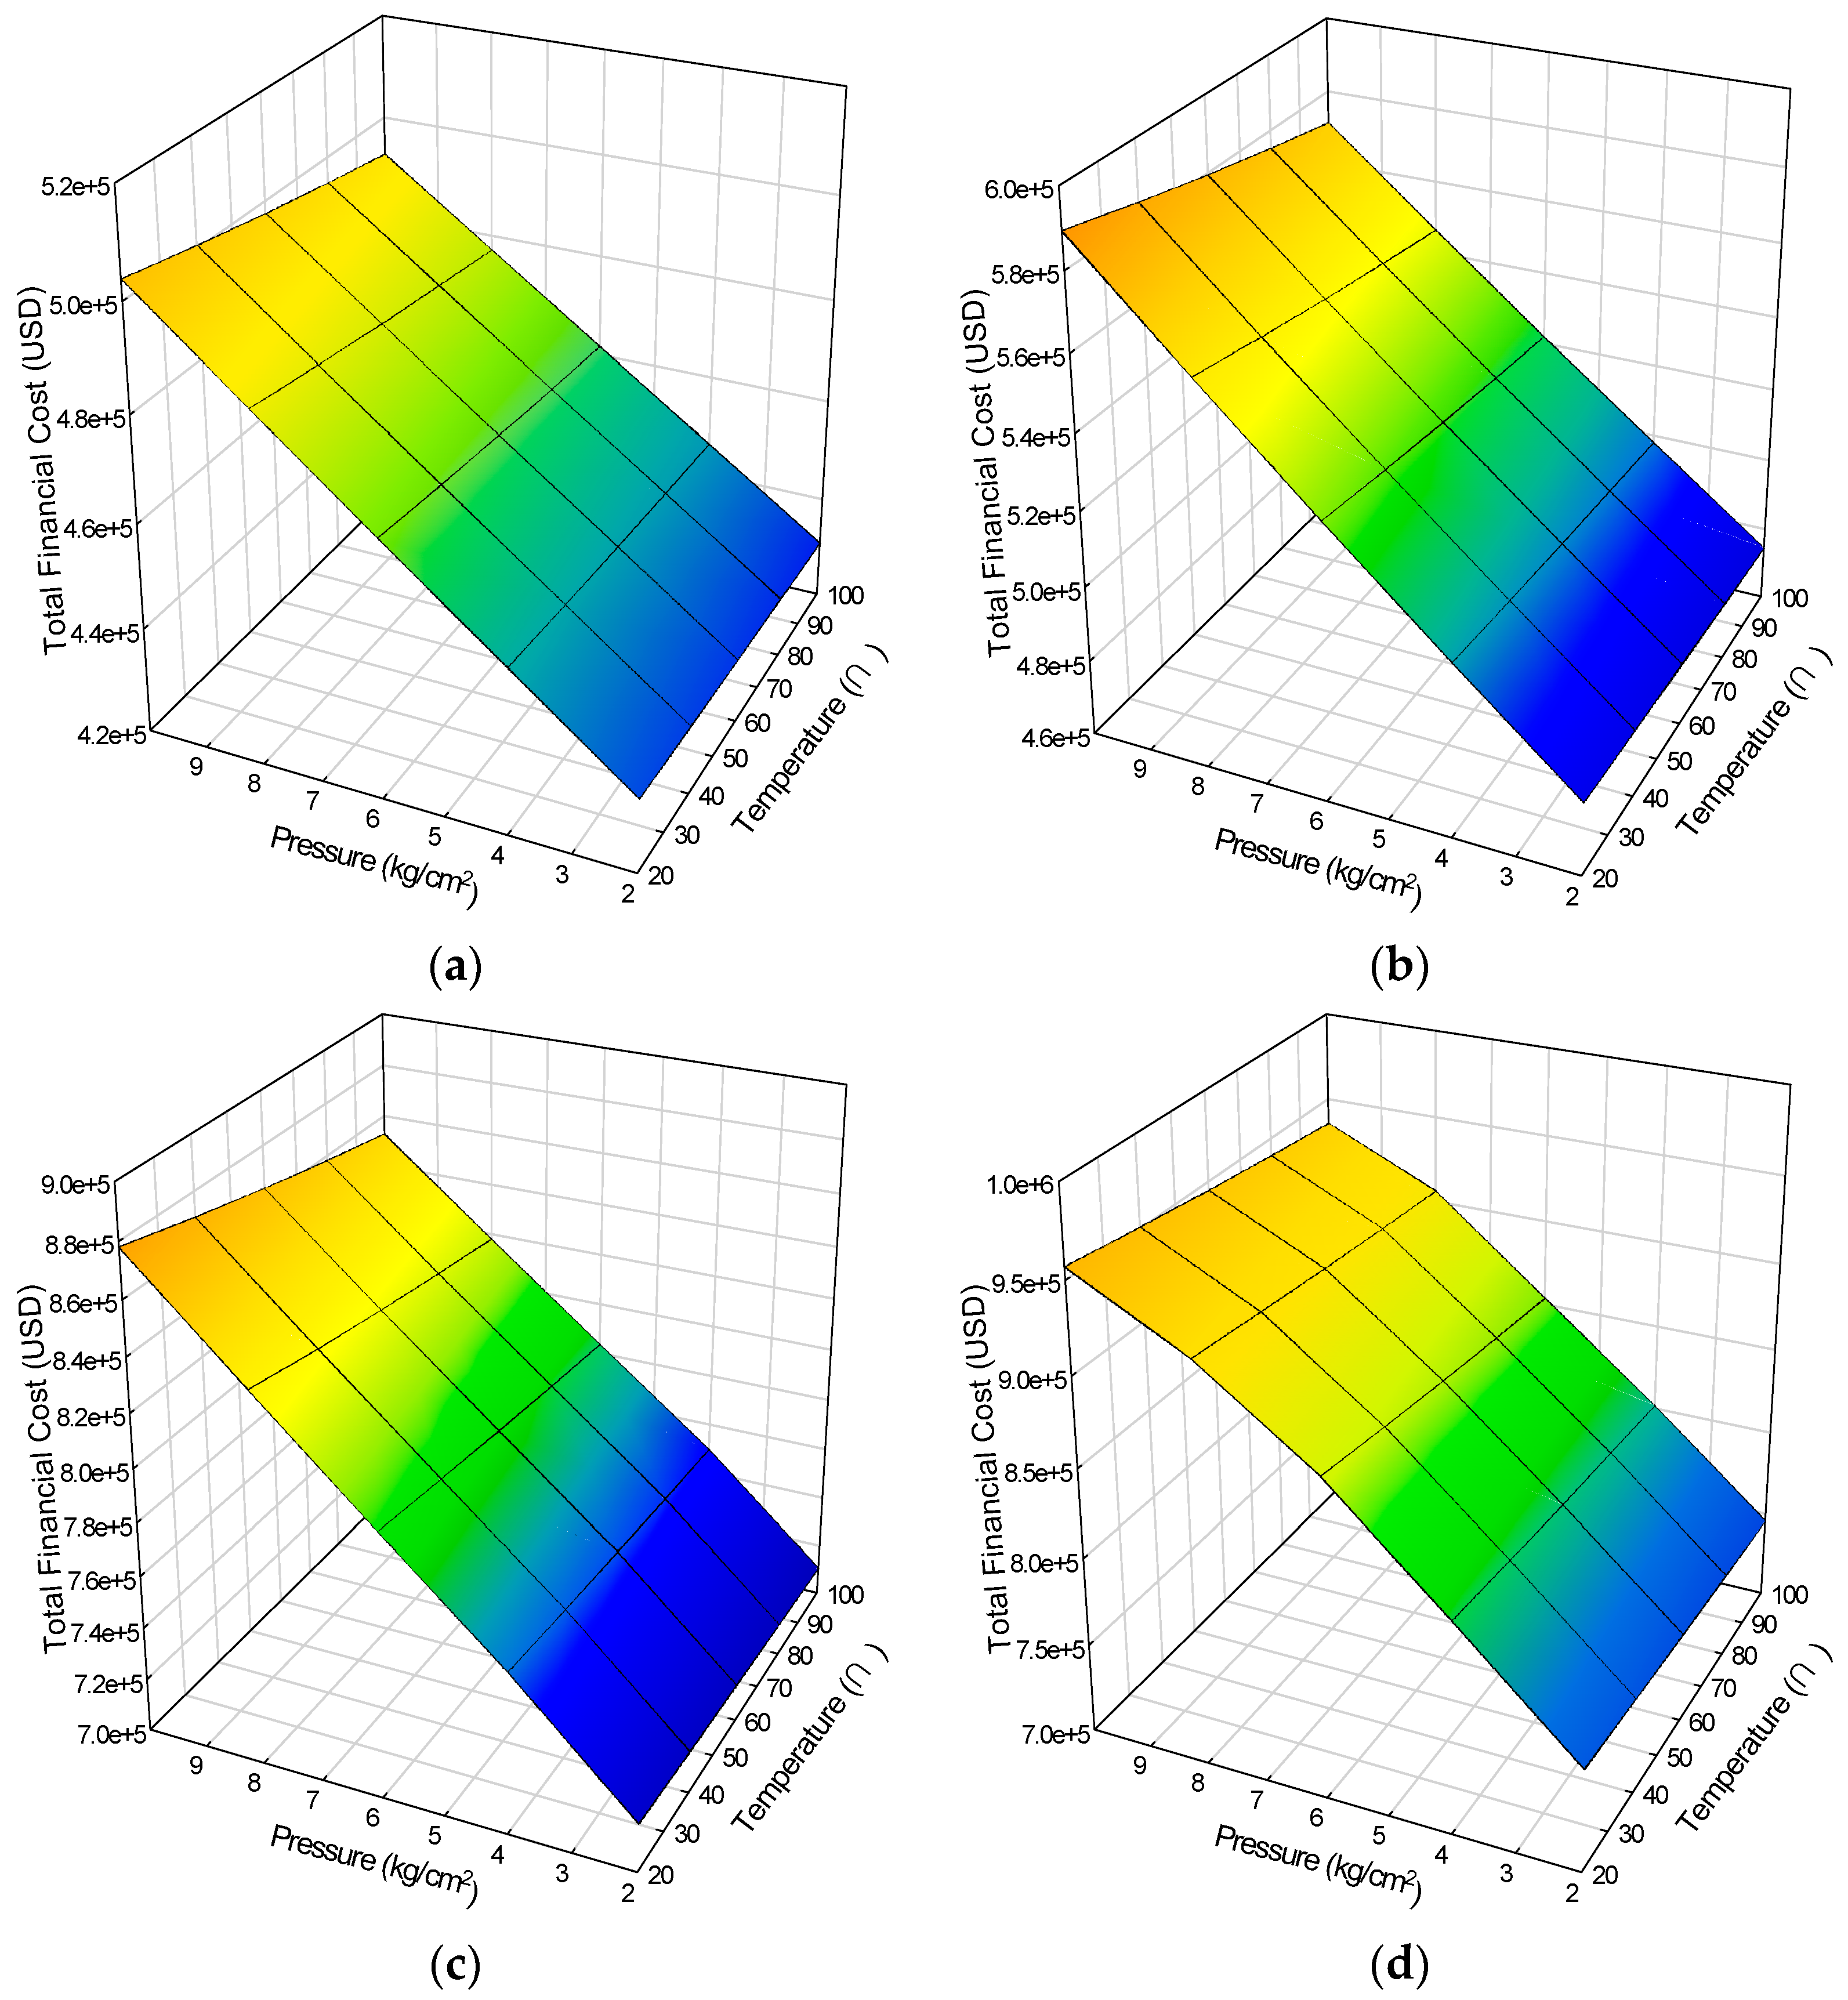
The costs of leakages from vessels are shown in Figure 7. Costs associated with leakages from the reactor (USD ) were greatest, followed by those from the drum (USD ), filter (USD ), and heat exchanger (USD ). The facility stoppage or outage costs were higher for the filter than those associated with the heat exchanger. The order was reversed for costs associated with damage to facilities, but these costs were less important to the total costs.
Figure 8 shows the results for leakages from pipes with H2 inventories of 1000 and 2000 kg. For the basal conditions (H2 inventory of 1400 kg), the total cost was USD (Figure 6c). The total cost appeared to change with the inventory: The total cost was slightly lower than the baseline value for an inventory of 1000 kg (USD ) and slightly higher for an inventory of 2000 kg (USD ). When the leakage occurred from the drum under the standard conditions, the total cost was insensitive to the inventory amount at USD (Figure 7a).
In normal qualitative risk analysis, increasing the size of the inventory increases the impact of any leakage. However, such analyses rarely consider the detection and isolation systems, instead modeling only the worst-case scenarios. Here, the leakage duration (and thus the ultimate leakage amount) was limited by these systems, as denoted in the methodology. Incorporating these systems decreased the total cost and negated any impact on it from changing the inventory amount. Because the leakage rate from pipes was lower than that from vessels, pipes required a longer leakage duration to achieve the maximum leakage amount and they were therefore more impacted by the implementation of detection and isolation systems. The results for leakages from pipes and vessels were similar to the trends shown in Figure 8.
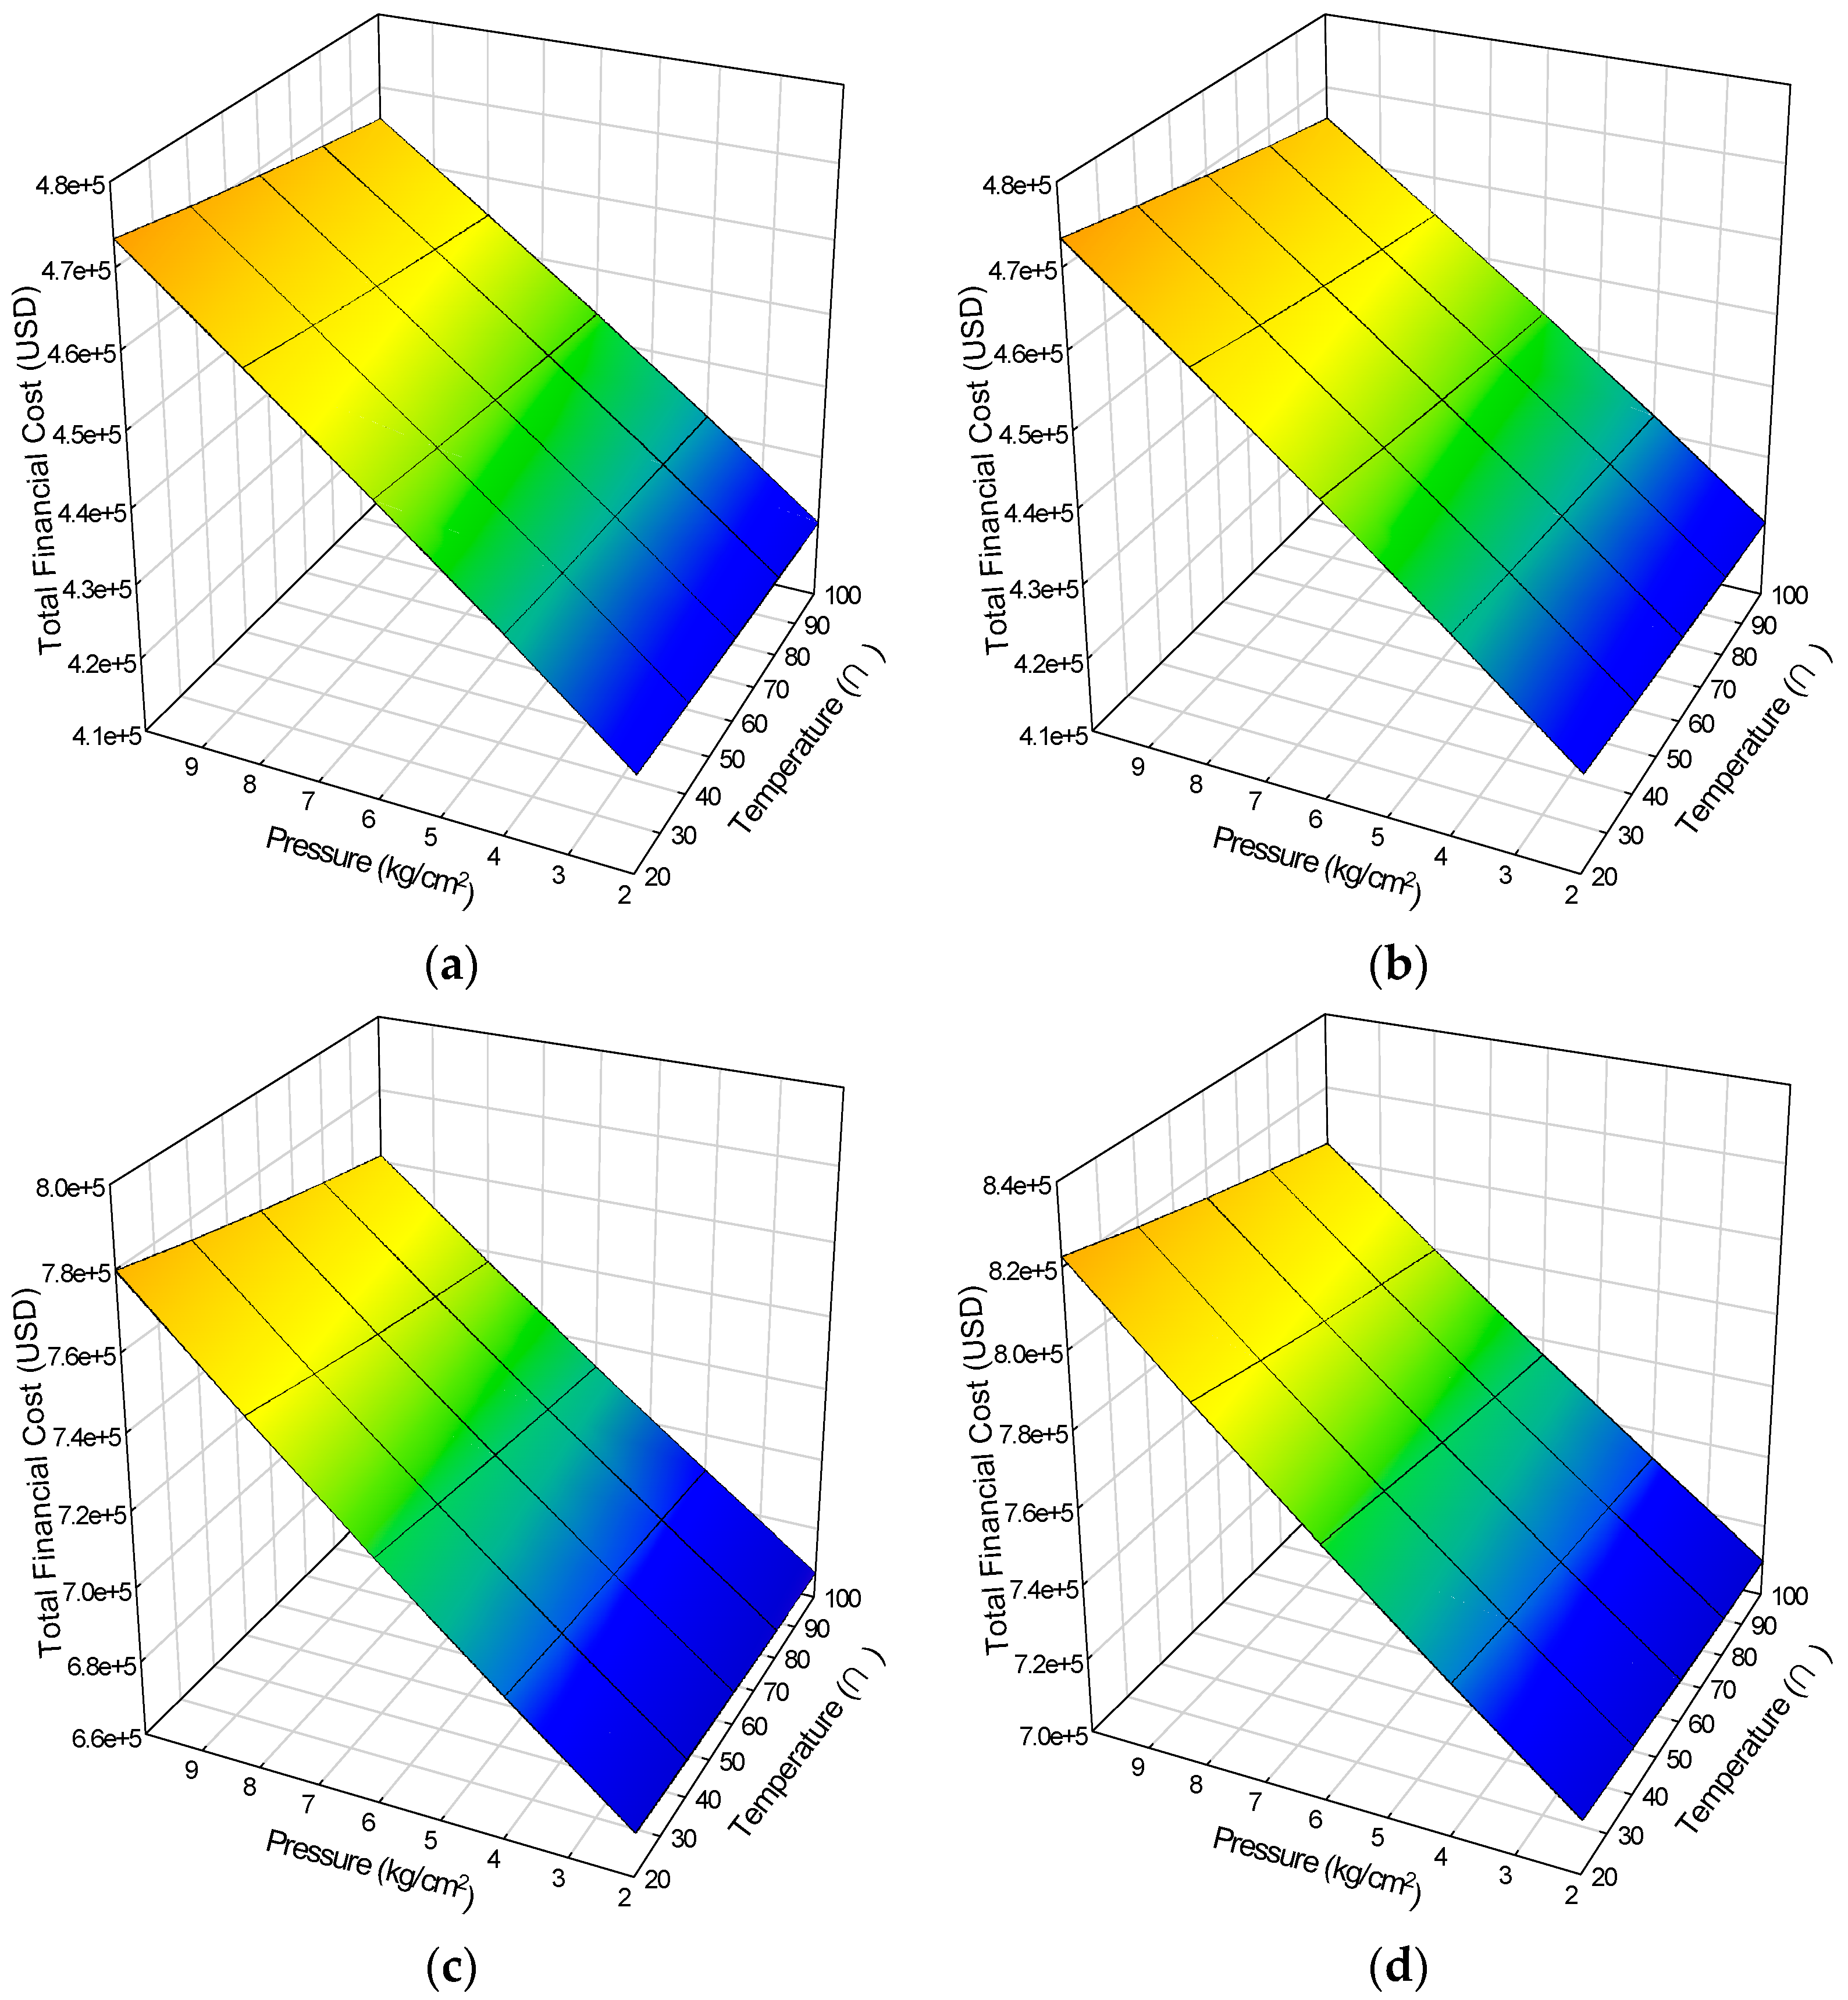
Figure 9 shows the total costs associated with various detection and isolation systems. Changes in temperature and pressure produced results that compared with the baseline trends (see Figure 6c and Figure 7a). For a leak from a 4-inch pipe, the maximum total costs, when using detection/isolation sets A, B, and C, were USD , , and , respectively. For leakage from a drum, the respective values were USD , , and . The ability of automatic detection and isolation systems to decrease the leakage duration by accelerating both detection and isolation decreased the amount of gas leaked, the fire and explosion risk the leak posed, and ultimately the total cost of the leak. The opposite was true when detection and isolation were carried out manually. These results suggest that minimizing the consequences of leakages in H2 fuel cell systems requires a system that can monitor the gas flow within the system and can automatically isolate any leakages that occur.
The higher cost of stainless steel meant that damage to a facility constructed of this material was more costly than one constructed of carbon steel. For leakage from a 4-inch pipe made of 304SS type stainless steel (Figure 10a) or 316SS, the total costs were USD , higher than those for a facility constructed of carbon steel. However, because costs related to facility damage were a relatively small portion of the total costs, changing the material only had a negligible impact on the total cost. However, the change was more clearly shown in the case of damage to the drum because the cost of vessels was higher than that of pipes. Here, the total costs when using the 316SS type stainless steel (Figure 10d), 304SS type stainless steel (Figure 7a), and carbon steel (Figure 10c) for the drum material were USD , , and , respectively.
6. Summary and Conclusions
Fuel cell systems in industrial facilities have the potential risk of leaking H2 or NG, and risk evaluation analysis, and the implementation of appropriate safety prevention mechanisms must be carried out. This study investigated the financial risk factors for leakages of H2 and NG from fuel cell systems by considering various leakage rates, modes, and total amounts. The impact of applying appropriate detection and prevention systems was also presented. The total cost for each scenario was determined according to the costs of facility outage or damage, and the costs of taking safety precautions. This study has reached the following conclusions:
(1) The leakage rates of H2 and NG in fuel cell systems were more significantly influenced by pressure than by temperature: At low pressures, the influence of temperature on leakage rate was very small, but, at high pressures, the leakage rate was higher for lower temperatures. For identical temperatures and pressure conditions, the leakage rate of NG was higher than that of H2.
(2) The reactor was the most costly vessel in terms of outage costs, followed by the drum, filter, and the heat exchanger. In terms of costs related to damage to equipment, the order was reactor > drum > heat exchanger > filter. For leaks from pipes, safety costs increased with pipe diameter but were unaffected by the type of vessel from which the leakage occurred.
(3) Systems with automatic detection and isolation systems decreased the leakage duration and total cost. The use of such systems is therefore recommended to ensure optimal safety levels and to protect against financial losses.
Acknowledgments
This research was supported by a grant ‘Development of the Evaluation Technology for Complex Causes of Inundation Vulnerability and the Response Plans in Coastal Urban Areas for Adaptation to Climate Change’ (MPSS-NH-2015-77) from the Natural Hazard Mitigation Research Group, Ministry of Public Safety and Security of Korea.
Author Contributions
In-Bok Lee collected data and designed this research after running analysis tool. Chang Geun Song implemented analysis and wrote this paper.
Conflicts of Interest
The authors declare no conflict of interest.
References
- Suther, T.; Fung, A.; Koksal, M.; Zabihian, F. Macro level modeling of a tubular solid oxide fuel cell. Sustainability 2010, 2, 3549–3560. [Google Scholar] [CrossRef]
- Khurmi, R.S. Materials Science; S. Chand Group: New Delhi, India, 2004. [Google Scholar]
- Schaeffer, J. Real Goods Solar Living Sourcebook: The Complete Guide to Renewable Energy Technologies and Sustainable Living; New Society Publishers: Gabriola Island, BC, Canada, 2015. [Google Scholar]
- Kim, C.J.; Hong, T.; Kim, J.; Kim, D.; Seo, D.Y. A Process for the Implementation of New Renewable Energy Systems in a Building by Considering Environmental and Economic Effect. Sustainability 2015, 7, 12870–12890. [Google Scholar] [CrossRef]
- Fotis, R.; Sklavounos, S. Evaluation of hazards associated with hydrogen storage facilities. Int. J. Hydrog. Energy 2005, 30, 1501–1510. [Google Scholar]
- Gupta, S.; Brinster, J.; Studer, E.; Tkatschenko, I. Hydrogen related risks within a private garage: Concentration measurements in a realistic full scale experimental facility. Int. J. Hydrog. Energy 2009, 34, 5902–5911. [Google Scholar] [CrossRef]
- LaChance, J. Risk-informed separation distances for hydrogen refueling stations. Int. J. Hydrog. Energy 2009, 34, 5838–5845. [Google Scholar] [CrossRef]
- Ekoto, I.W.; Merilo, E.G.; Dedrick, D.E.; Groethe, M.A. Performance-based testing for hydrogen leakage into passenger vehicle compartments. Int. J. Hydrog. Energy 2011, 36, 10169–10178. [Google Scholar] [CrossRef]
- Barelli, L.; Bidini, G.; Gallorini, F.; Servili, S. Hydrogen production through sorption-enhanced steam methane reforming and membrane technology: A review. Energy 2008, 33, 554–570. [Google Scholar] [CrossRef]
- API. API RP 581—Risk-Based Inspection Technology, 2nd ed.; API: Washington, DC, USA, 2008. [Google Scholar]
- Perry, R.H. Perry’s Chemical Engineers’ Handbook, 7th ed.; Mc-GraHill: New York, NY, USA, 1999. [Google Scholar]
- Crowl, D.A.; Louvar, J.F. Chemical Process Safety Fundamentals with Applications; Prentice Hall: New York, NY, USA, 1990. [Google Scholar]
Figure 1.
Procedure for determining the influence of financial consequence.

Figure 2.
Classification of the leakage type.

Figure 3.
Program for analysis with financial consequences.

Figure 4.
Weighted leakage rate by pressure and temperature at 1- and 4-inch pipe. (a) Hydrogen (1 inch); (b) NG (1 inch); (c) Hydrogen (4 inch); (d) NG (4 inch).
Figure 4.
Weighted leakage rate by pressure and temperature at 1- and 4-inch pipe. (a) Hydrogen (1 inch); (b) NG (1 inch); (c) Hydrogen (4 inch); (d) NG (4 inch).

Figure 5.
Weighted leakage rate by pressure and temperature at vessels. (a) Hydrogen; (b) NG.

Figure 6.
Total financial costs by pressure and temperature at 1- and 4-inch pipe. (a) Hydrogen (1 inch); (b) NG (1 inch); (c) Hydrogen (4 inch); (d) NG (4 inch).
Figure 6.
Total financial costs by pressure and temperature at 1- and 4-inch pipe. (a) Hydrogen (1 inch); (b) NG (1 inch); (c) Hydrogen (4 inch); (d) NG (4 inch).

Figure 7.
Total financial costs by pressure and temperature at vessels. (a) Hydrogen (Drum); (b) NG (Drum); (c) Hydrogen (Filter); (d) NG (Filter); (e) Hydrogen (Exchanger); (f) NG (Exchanger); (g) Hydrogen (Reactor); (h) NG (Reactor).
Figure 7.
Total financial costs by pressure and temperature at vessels. (a) Hydrogen (Drum); (b) NG (Drum); (c) Hydrogen (Filter); (d) NG (Filter); (e) Hydrogen (Exchanger); (f) NG (Exchanger); (g) Hydrogen (Reactor); (h) NG (Reactor).

Figure 8.
Total financial costs by inventory amount of hydrogen. (a) 1000 kg (4 inch); (b) 2000 kg (4 inch); (c) 1000 kg (Drum); (d) 2000 kg (Drum).
Figure 8.
Total financial costs by inventory amount of hydrogen. (a) 1000 kg (4 inch); (b) 2000 kg (4 inch); (c) 1000 kg (Drum); (d) 2000 kg (Drum).

Figure 9.
Total financial costs with detection and isolation systems for hydrogen. (a) Detection/Isolation = B (4 inch); (b) Detection/Isolation = C (4 inch); (c) Detection/Isolation = B (Drum); (d) Detection/Isolation = C (Drum).
Figure 9.
Total financial costs with detection and isolation systems for hydrogen. (a) Detection/Isolation = B (4 inch); (b) Detection/Isolation = C (4 inch); (c) Detection/Isolation = B (Drum); (d) Detection/Isolation = C (Drum).

Figure 10.
Effects of total financial cost with pressure, temperature and equipment at various materials for hydrogen. (a) CS (4 inch); (b) 316SS (4 inch); (c) CS (Drum); (d) 316SS (Drum).
Figure 10.
Effects of total financial cost with pressure, temperature and equipment at various materials for hydrogen. (a) CS (4 inch); (b) 316SS (4 inch); (c) CS (Drum); (d) 316SS (Drum).


| Fluid | MW | Density (kg/m3) | NBP (°C) | Ambient State | AIT (°C) | ||||
|---|---|---|---|---|---|---|---|---|---|
| A | B | C | D | ||||||
| NG | 16 | 250.5 | −125 | Gas | 12.3 | 1.15× 10⁻¹ | −2.87 × 10⁻⁵ | −1.30 × 10⁻⁹ | 558 |
| H2 | 2 | 71.0 | −250 | Gas | 27.1 | 9.27 × 10⁻³ | −1.38 × 10⁻⁵ | 7.65 × 10⁻⁹ | 400 |
| Leakage Hole Size | Range of Hole Diameters (mm) | Leakage Hole Diameter (mm) |
|---|---|---|
| Small | 0~6.4 | 6.4 |
| Medium | 6.4~51 | 25 |
| Large | 51~152 | 102 |
| Rupture | >152 | min [D, 406] |
| System Type | Descriptions | Classification |
|---|---|---|
| Detection | Instrumentation designed specifically to detect material losses by changes in operating conditions in the system. | A |
| Suitably located detectors to determine when the material is present outside the pressure-containing envelope. | B | |
| Visual detection, cameras, or detectors with marginal coverage. | C | |
| Isolation | Isolation or shutdown systems activated directly form process instrumentation or detectors, with no operator intervention. | A |
| Isolation or shutdown systems activated by operators in the control room or other suitable locations remote from the leak. | B | |
| Isolation dependent on manually-operated valves | C |
| System Classifications | Leakage Magnitude Adjustment | Reduction Factor, | |
|---|---|---|---|
| Detection | Isolation | ||
| A | A | Reduce leakage rate or mass by 25% | 0.25 |
| A | B | Reduce leakage rate or mass by 20% | 0.20 |
| A | C | Reduce leakage rate or mass by 10% | 0.10 |
| B | B | Reduce leakage rate or mass by 15% | 0.15 |
| C | C | No adjustment to leakage rate or mass | 0.00 |
| System Rating | Maximum Leak Duration, | |
|---|---|---|
| Detection | Isolation | |
| A | A | 20 min for 6.4 mm leaks |
| 10 min for 25 mm leaks | ||
| 5 min for 102 mm leaks | ||
| A | B | 30 min for 6.4 mm leaks |
| 20 min for 25 mm leaks | ||
| 10 min for 102 mm leaks | ||
| A | C | 40 min for 6.4 mm leaks |
| 30 min for 25 mm leaks | ||
| 20 min for 102 mm leaks | ||
| B | A or B | 40 min for 6.4 mm leaks |
| 30 min for 25 mm leaks | ||
| 20 min for 102 mm leaks | ||
| B | C | 60 min for 6.4 mm leaks |
| 30 min for 25 mm leaks | ||
| 20 min for 102 mm leaks | ||
| C | A, B or C | 60 min for 6.4 mm leaks |
| 40 min for 25 mm leaks | ||
| 20 min for 102 mm leaks | ||
| Type | Fluid | Continuous | Instantaneous | ||||||
|---|---|---|---|---|---|---|---|---|---|
| CAINL | CAIL | IAINL | IAIL | ||||||
| a | b | a | b | a | b | a | b | ||
| Damage | NG | 8.67 | 0.98 | 55.13 | 0.95 | 6.469 | 0.67 | 163.7 | 0.62 |
| H2 | 13.13 | 0.992 | 86.02 | 1.00 | 9.605 | 0.657 | 216.5 | 0.618 | |
| Injury | NG | 21.83 | 0.96 | 143.2 | 0.92 | 12.46 | 0.67 | 473.9 | 0.63 |
| H2 | 32.05 | 0.933 | 228.8 | 1.00 | 18.43 | 0.652 | 636.5 | 0.621 | |
| Fluid | Equip. | Op. Temp. (°C) | Op. Press. (Kg/cm2) | Inv. Amount (kg) | Det. Sys. | Isol. Sys. | Material |
|---|---|---|---|---|---|---|---|
| H2 | Pipe (1 in.) | 20 | 2 | 1000 | A * | A * | CS |
| NG | Pipe (2 in.) | 40 * | 4 | 1200 | B | B | 1.25Cr-0.5Mo |
| Pipe (4 in.) | 60 | 6 * | 1400 * | C | C | 5Cr-0.5Mo | |
| Drum | 80 | 8 | 1600 | 304SS * | |||
| Filter | 100 | 10 | 1800 | 316SS | |||
| Exchanger | 2000 | ||||||
| Reactor |
Note: The cells with asterisk represent standard conditions.
© 2016 by the authors; licensee MDPI, Basel, Switzerland. This article is an open access article distributed under the terms and conditions of the Creative Commons Attribution (CC-BY) license (http://creativecommons.org/licenses/by/4.0/).
Share and Cite
MDPI and ACS Style
Lee, I.-B.; Song, C.G. Financial Risk Factor Analysis for Facility Gas Leakages of H2 and NG. Sustainability 2016, 8, 944. https://doi.org/10.3390/su8090944
AMA Style
Lee I-B, Song CG. Financial Risk Factor Analysis for Facility Gas Leakages of H2 and NG. Sustainability. 2016; 8(9):944. https://doi.org/10.3390/su8090944
Chicago/Turabian StyleLee, In-Bok, and Chang Geun Song. 2016. "Financial Risk Factor Analysis for Facility Gas Leakages of H2 and NG" Sustainability 8, no. 9: 944. https://doi.org/10.3390/su8090944
Note that from the first issue of 2016, this journal uses article numbers instead of page numbers. See further details here.