Article

Annual Precipitation Fluctuation and Spatial Differentiation Characteristics of the Horqin Region

1
Northwest Institute of Eco-Environment and Resources, Chinese Academy of Sciences, Lanzhou 730000, China
2
Department of Geography and Tourist Science, Lu Dong University, Yantai 264025, China
*
Author to whom correspondence should be addressed.
Sustainability 2017, 9(1), 111; https://doi.org/10.3390/su9010111
Submission received: 1 December 2016 / Revised: 31 December 2016 / Accepted: 4 January 2017 / Published: 13 January 2017

Abstract

:
Precipitation is the main water source for vegetation survival in arid and semi-arid areas. However, previous studies always focus on the effects of precipitation in different time scales, but ignore the effects of precipitation in different spatial scales. To further study the effects of precipitation fluctuation in different spatial scales, we used the wavelet analysis method to analyze its temporal and spatial change based on data from eighteen meteorological stations during 1961–2015 in Horqin region. Results showed that: (1) from the overall tendency of precipitation changes, the precipitation inter-annual variations in Horqin region had the tendency of gradually decreasing from the southeast (District IV) to the northwest; (2) the precipitation anomalies of District I–IV between 1960 and 1980 were small and approximate to the normal value; (3) in the time scale of 23–32 years, the cyclical fluctuations were very significant and the annual precipitation underwent two cyclical fluctuations from a period of low precipitation to a period of high precipitation; and (4) as results of analyzing the spatial wavelet variance of sub-region, the main cycle of precipitation in District I, District II and District III was between 10 and 11 years, while the main cycle of precipitation in District IV was 25 years. The main conclusions include the following. (1) This region tended to be arid, and the precipitation gradually decreased from the southeast (District IV) to northwest (District I). (2) The influence of spatial differentiation characteristics on precipitation fluctuation in this region was cyclical fluctuation, which gradually decreased from the southeast to the northwest. The length of the cyclical change period gradually shortened. In the first main cycle, whose annual precipitation changes were most significant, the changing characteristic was District IV and District I decreased from 25 years to 10 years. (3) Predicated from the cyclical changing law that the annual precipitation decreases from high to low, the Horqin region will remain in a period of low precipitation between 2016 and 2020.

1. Introduction

Precipitation is the main water source for vegetation survival in arid and semi-arid areas. It is also the main driving factor of various ecological processes of different ecological scales [1,2,3,4,5]. For a certain region, the precipitation fluctuation in different time scales usually takes place by pulse. The time for its occurrence, duration period, strength and other characteristic parameters are all greatly differentiated. These characteristics make the soil water content and the vegetation process fluctuate in a short time scale [6,7]. In current research, the abnormal fluctuation of precipitation in the context of global warming also becomes an inevitable phenomenon in arid and semi-arid regions [8]. Therefore, the study of the precipitation fluctuation becomes one of the important scientific problems in the prediction and evaluation of vegetation productivity and ecological system security.
The appearance, structure, distribution and productivity of vegetation significantly changes within a short time, directly caused by precipitation fluctuation [9,10,11,12,13]. In former research, their common characteristics mainly laid in the influences of precipitation in different time scales on the ecological process. The obtained results are also mainly concentrated in the relations between precipitation distribution and productivity of ecological system in the large scale, between the precipitation distribution and plants’ functional types, and the role played by precipitation and evaporation in forming the vegetation distribution [14,15].
In recent years, precipitation fluctuation has gradually received increasing attention because global climatic changes may cause potential environmental effect and the widespread application of the stable isotope tracer technique in vegetable ecology [16]. The research on the precipitation fluctuation involved the influences of the seasonal precipitation pattern, the scale, frequency and time of precipitation events on biological process of water-restricting ecological system [9,11]. These studies jointly pointed out there were different time scales in precipitation fluctuation research: centennial, multi-decadal, annual, inter-seasonal and seasonal variation scales [7]. Among these results, centennial-scale precipitation changes may cause the composition ratio change of C3/C4 vegetation, which changes the vegetation functional types in the ecological system; multi-decadal precipitation variations change the function types of vegetation and the species composition of ecological system; and annual and seasonal precipitation changes can change the phenological period of plants and the productivity of ecological system [17]. The multi-decadal precipitation fluctuation was a crucial cycle that caused the vegetation to have qualitative changes [18,19].
In the research on annual precipitation change, the scale of daily precipitation, the time of precipitation duration and other indexes are always adopted. By carrying out statistical analysis and constructing the relations between water and soil environments and plant species’ water metabolic response relations, many achievements in these aspects have been made [9,11]. In the research on the inter-annual precipitation fluctuations, the annual precipitation and the precipitation in the growing season were crucial indexes, which had been the priorities of the focus, especially after Markhama et al. (1970) proposed the concept of vector precipitation. Because this index not only reflected the annual precipitation dynamics (monthly dynamics), but also had better relevance with the vegetation productivity, it was gradually adopted in many studies [7]. In the perspective of analyzing the long time sequence changing characteristics of annual precipitation, the Mann–Kendall rank correlation method (the M-K method) was gradually accepted and widely used to carry out in the trend test and mutation point detection [20,21]. However, the cycle and randomness included in the long time sequence of researched variables cause difficulties, challenging the application of the M-K method [22]. Comparatively, wavelet analysis can clearly reveal various change cycles hidden in the time sequence and reflect the changing tendency of the system in different time scales. This method is based on the Fourier transform; the window function is introduced (wavelet function), which allows decomposing the time series into time and frequency. This method can be used to analyze the climate change cycle at different time scales, which has the advantage of explaining the multi-structure changes in the climate and examining the main cycle in climate change and mutation characteristics, which has become an effective way to analyze the characteristics of multi time scale precipitation change. Besides, it can also carry out a qualitative estimation of the developmental tendencies in the future. This characteristic provides a basis for analyzing long time sequence precipitation fluctuations.
The spatial differentiation characteristics of the precipitation fluctuation means the changes of precipitation in one time scale (day, month or year) correspond to different analyzing space scale during the researched period. For the annual precipitation, the average precipitation of several years depends on the number of statistical years; for the regional precipitation, the number and the distribution pattern of meteorological stations also exert huge influences. Therefore, the fluctuating characteristic of the precipitation within a region is not only related to the precipitation in each year, but is also closely related to the analyzing time scale and the meteorological station’s spatial position [16,23]. However, previous studies always focused on the effects of precipitation in different time scales, while ignoring the effects of precipitation in different spatial scales. Yao et al. (2014) [24] adopted the M-K method, the wavelet analysis and other methods to research the precipitation changing characteristics of the Naiman Banner between 1970 and 2010, considering only the influence of precipitation in different time scales while neglecting the influence of spatial differences. Li et al. (2011) [25] adopted the Morlet wavelet function to carry out the wavelet analysis of the annual changes time sequence of precipitation of Beijing over the most recent 300 years, which revealed the cyclical changing laws of the precipitation changes in multiple time scales but did not take the spatial differentiation characteristics of precipitation fluctuation into consideration. Therefore, in this study, analyses were carried out not only based on the data of meteorological stations along a time series but also considered the expressions in spatial differences of precipitation fluctuations.
The Horqin region belongs to the transition zone of northeast temperate semi humid climate zone of northeast China and temperate semi-arid climate zone of Inner Mongolia and is the typical agro-pastoral transition zone in north China. Its ecological environment is fragile and easily affected by climate change. Furthermore, it is sensitive to precipitation fluctuation [9,14,26].
Hence, in this study, the annual precipitation fluctuation was analyzed based on its spatial differentiation characteristics in Horqin region, which would provide a new cognition and basis for the responses of vegetation changing process in semi-arid regions to climatic changes. Therefore, the objectives of this study are: (1) to find the spatial differentiation characteristics of precipitation according to the distribution of several meteorological stations in Horqin region; and (2) to find the influence of spatial differentiation characteristics on precipitation fluctuation in this region.

2. Study Area and Method

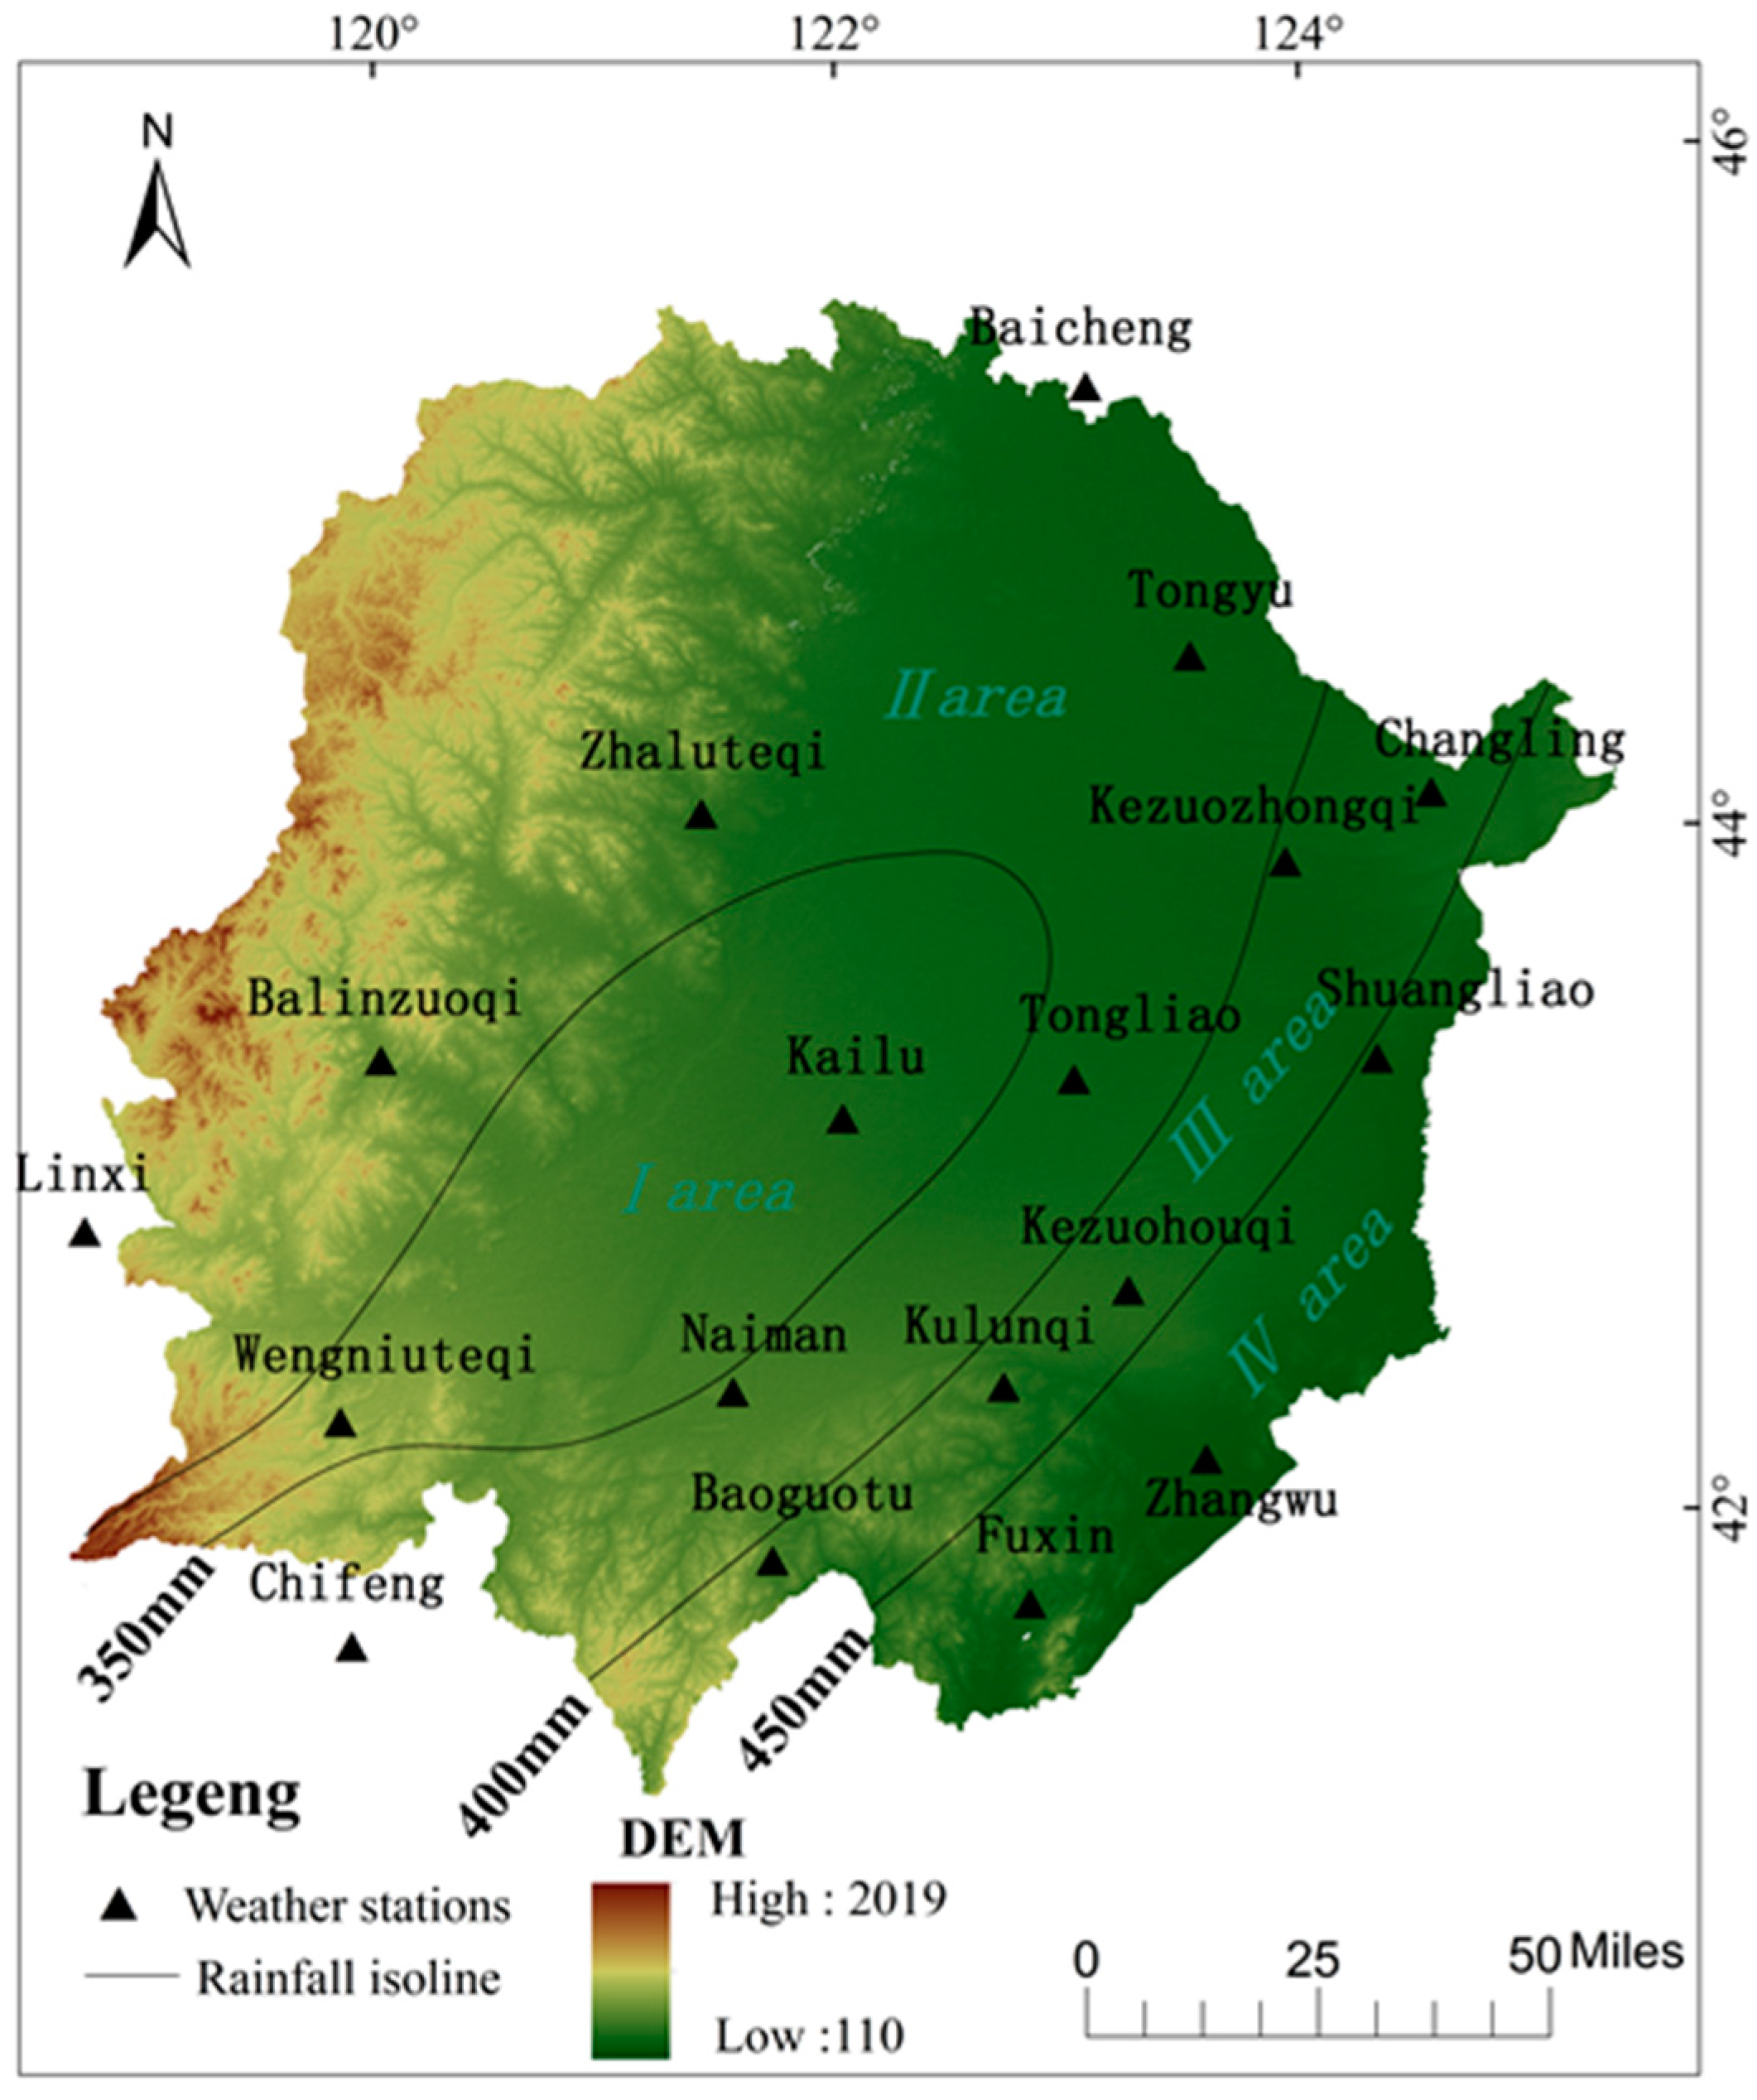
2.1. Overview of the Study Area

Horqin region is located in the west of Northeast China, including 22 Banners (counties, districts and cities). It includes the Inner Mongolia Autonomous Region, Liaoning Province and Jilin Province. Its overall area is 16.11 × 10⁴ km2. Regarding the climatic belt division, it is a semi-humid and semi-arid transitional zone. Regarding the mode of production, it is the typical agro-pastoral transition zone. Regarding the landform type, it is a region transiting from the Inner Mongolia Plateau and Great Khingan to the Northeast China Plain. In this region, there are 14 Chinese meteorological stations (meteorological data sharing points). With the aim of improving the isoline accuracy of precipitation, four non-meteorological data sharing points are added (Figure 1). With the overall view of 18 meteorological stations between 1961 and 2015, the precipitation fluctuations were within 123.0–775.7 mm, and the average value was 399.2 mm.

2.2. Selection of Meteorological Stations for Rainfall Distribution

As the average isoline of annual precipitation over 55 years (Figure 1), the Horqin region’s precipitation distribution represents the rule of gradually decreasing from the southeast to the northwest; the precipitation gradually decreases from over 500 mm in the southeast to less than 350 mm; in the central region, there is a region formed by centering on Ongniud and Kailu meteorological stations, whose annual precipitation is less than 350 mm. According to this characteristic, this paper divides Horqin region into four districts, whose average precipitation are, respectively, ≤350 mm, 350–400 mm, 400–450 mm and ≥450 mm. These four districts are, respectively, Districts I–IV. As there are only 2 and 3 stations in District I and District IV, respectively, to disperse the meteorological stations consistently, this paper selects Kailu County and Ongniud Banner in District I; Shuangliao City, Zhangwu County and Fuxin City in District IV; Tongyu County, Horqin District of Tongliao City and Naiman Banner in District II; and Changling County, the Horqin left-wing Rear banner and Baoguotu in District III. To ensure the selected stations are spatially distributed consistently with the precipitation isoline distribution tendency, the station’s average value is adopted for analyzing each subarea.

2.3. The Wavelet Analysis Method

The wavelet analysis [27,28] can clearly reveal various change cycles hidden in the time sequence; it can fully reflect the systems changing tendency in different time scales and carry out qualitative estimation of the system’s future developmental tendency. This paper adopts the plural form wavelet function, the Morlet wavelet, as the Mother Wavelet Function. Because the phase difference of the real and imaginary parts of the complex wavelet was π/2, using the model of complex wavelet transform coefficients as the discriminant of the scale and size of the periodic cycle in the climate data could eliminate false shock that produced with the real wavelet coefficient as a criterion, which would make the results more accurate. Therefore, the Morlet wavelet can be used to analyze the time sequence data [27]. The wavelet function is the key of the wavelet analysis, which refers to one type of functions that is concussive and can fade to zero fast, namely the wavelet function ψ ( t ) L 2 ( R ) meets:
+ ψ ( t ) d t = 0
In Equation (1), ψ ( t ) is the wavelet base function, which can form a cluster of function systems through the scale’s stretch and the translation on the time axis.
ψ a , b ( t ) = | a | 1 / 2 ψ ( t b a )   a , b R , a 0
For any function f ( t ) L 2 ( R ) , its continuous wavelet transform (CWT) is:
W f ( a , b ) = | a | 1 / 2 R f ( t ) ψ ¯ ( t b a ) d t
where Wf(a,b) is the wavelet transform coefficient; a is the stretch scale; and b is the translation factor.
The key and difficulty of the wavelet analysis is to select appropriate wavelet bases [28]. This paper selects the Morlet complex wavelet [29] that can faithfully reflect the time sequence various cycles and time domain distribution as the wavelet base. The real part and module of the Morlet complex wavelet exchange are two important variables in the wavelet analysis. The wavelet coefficient’s real part represents the distribution and phase information of different characteristic time scale signals; the module is the wavelet coefficient’s absolute value, which is used to represent the strength of the characteristic time scale signal.
To evaluate the main cycle of each sequence, namely the cycle that plays the main role in the changes of precipitation sequence, the following calculation is adopted to carry out the wavelet variance test:
V a r ( a ) = | W f ( a , b ) | 2 d b
where Var(a) is the wavelet variance [24]. In wavelet analysis, using wavelet variance to confirm the main time scale and the main cycle is widely used [24]. The wavelet variance diagram can accurately reflect the precipitation’s cyclical strength as the time scale changes, which reflects the distribution of the fluctuation energy with the scale changing and the main time scale of the precipitation sequence can be determined by the wavelet variance diagram. The scale corresponding to the peak value is called this sequence’s main time scale, and the cycle is the main cycle of the time sequence change.

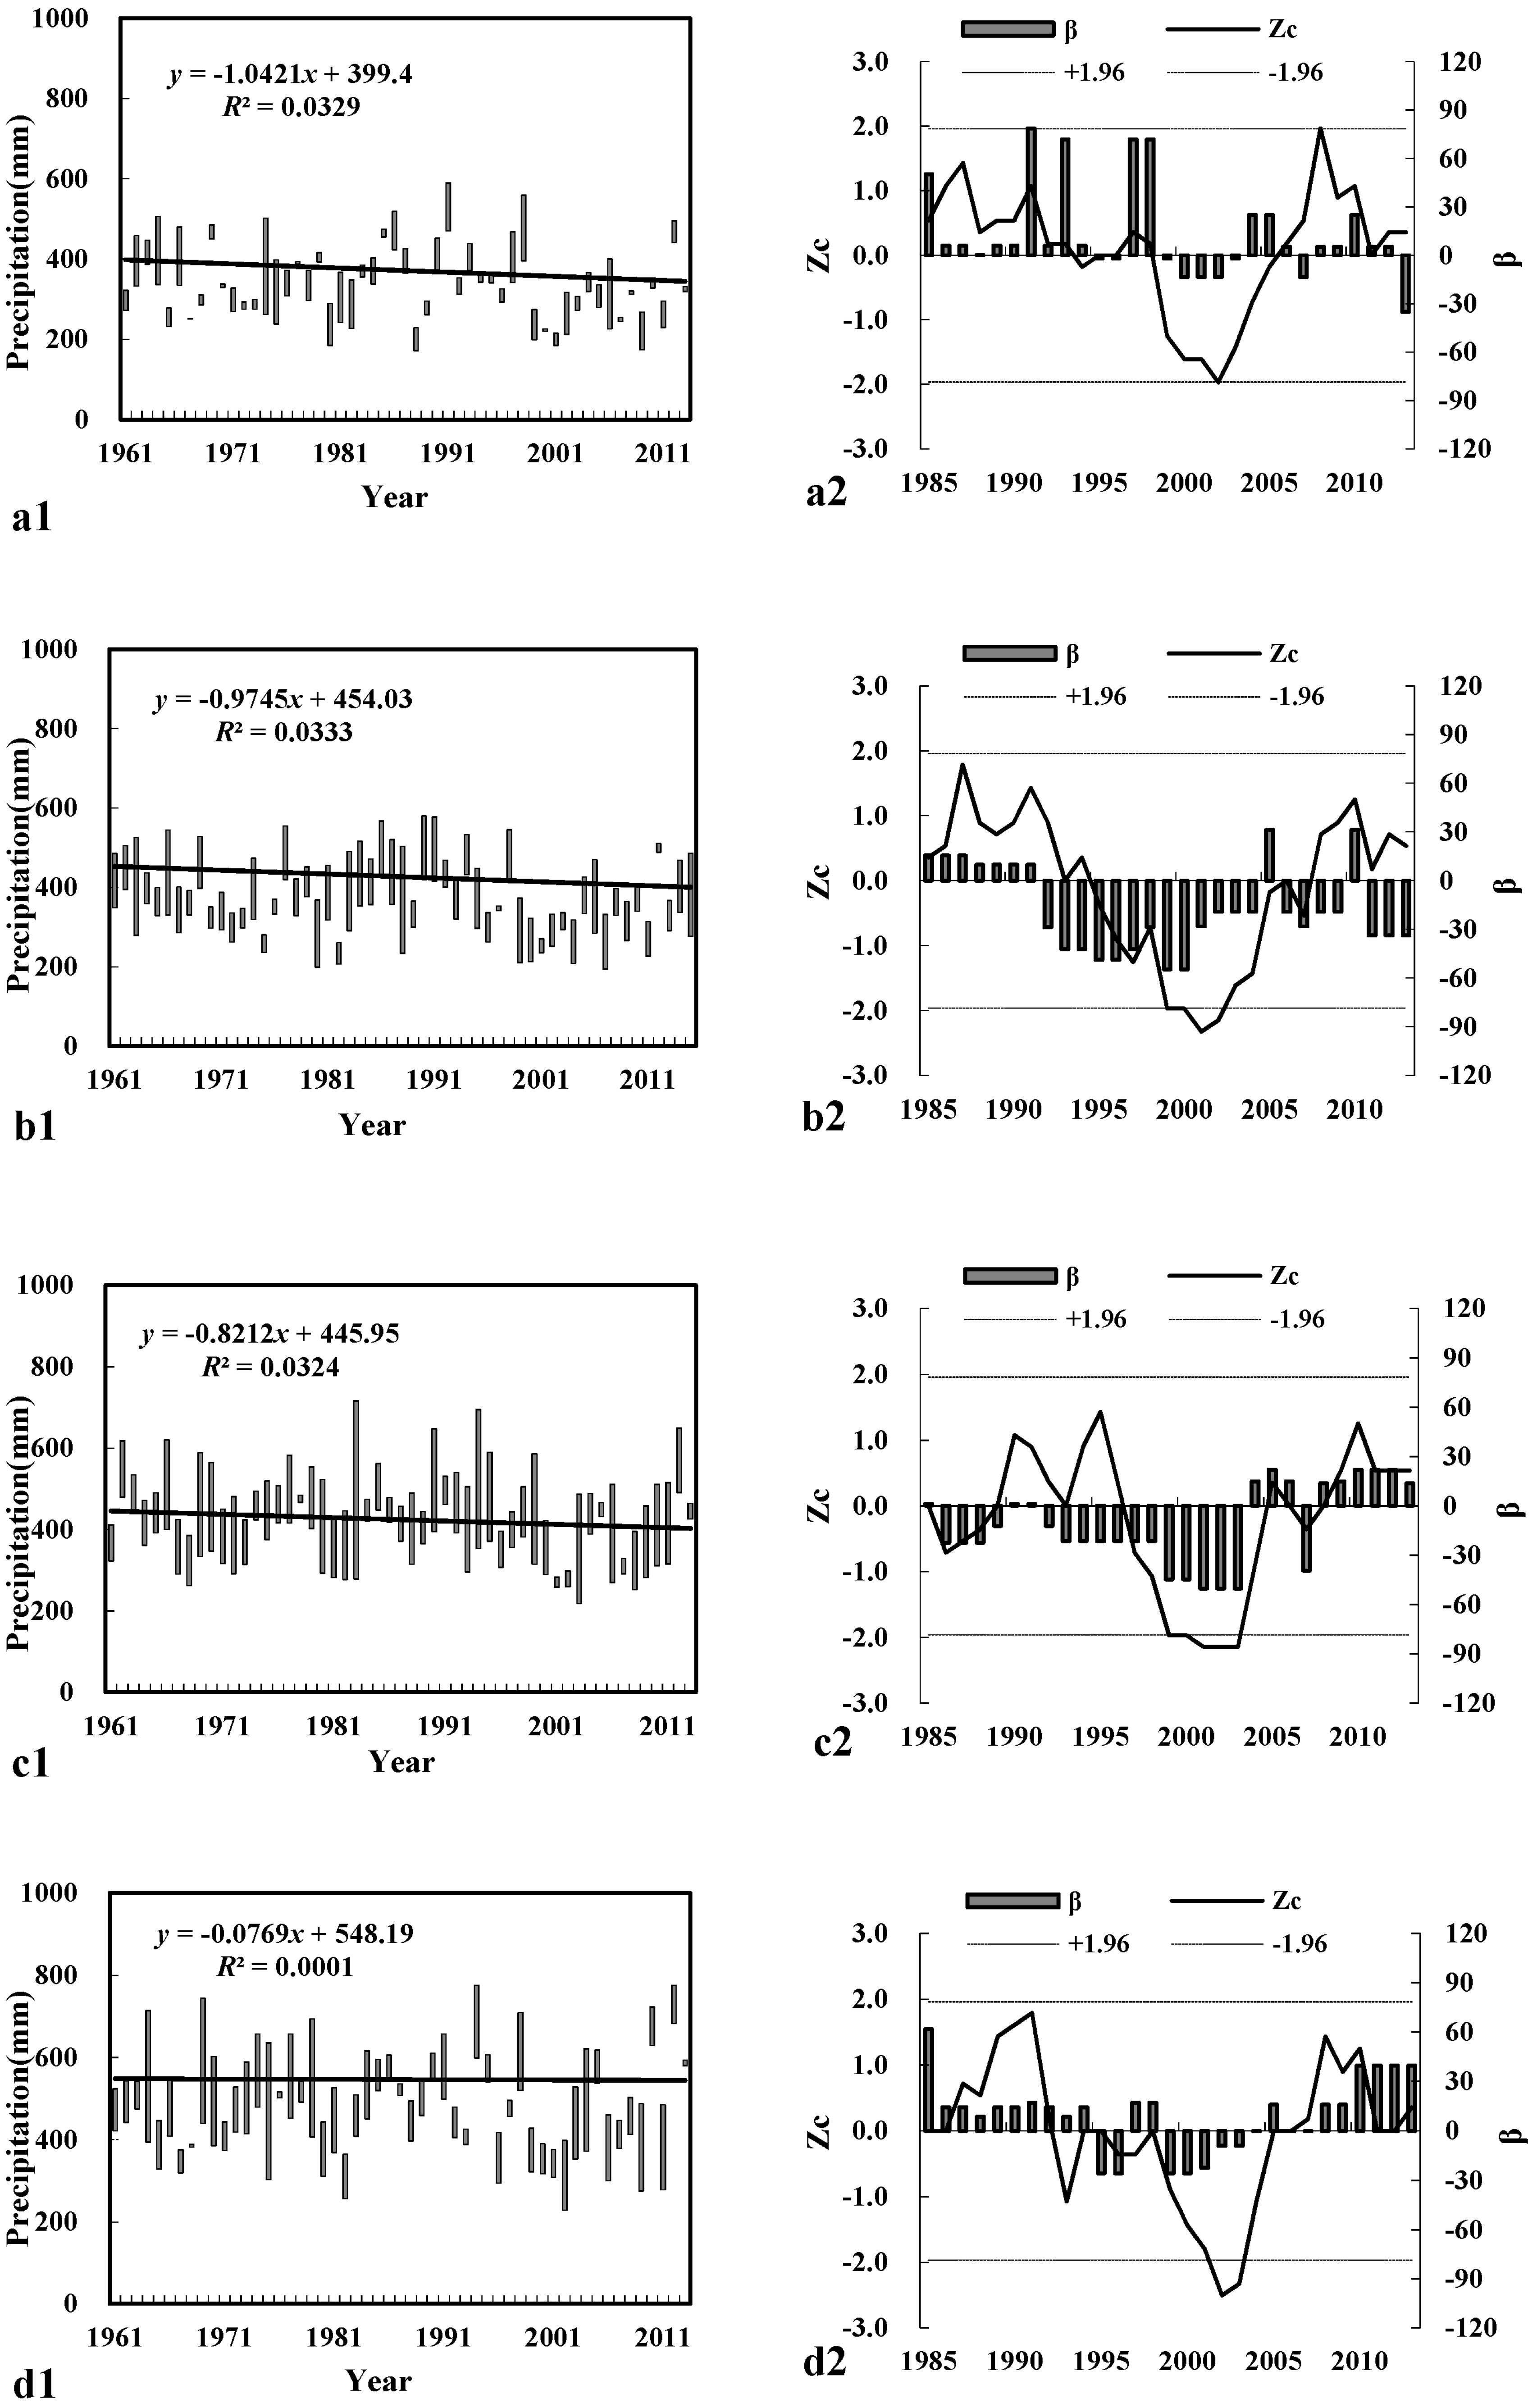
2.4. The Mann–Kendall (M-K) Rank Correlation Method

This paper adopts the Mann–Kendall [20,21] (M-K) rank correlation method to analyze the changing tendency of Horqin region’s annual precipitation fluctuations. The M-K method is usually adopted to test the tendency’s significance. Compared with the traditional method, the Mann–Kendall trend test has obvious advantages. It is a nonparametric statistical test method, which is also called the non-distributed test. Its advantage is that it does not require the sample to follow certain distribution, and is not interfered with by a few outliers, so the calculation is simple, and has been widely used in trend analysis [21]. Therefore, it is widely used in the research on the hydrology analysis, temperature and precipitation. Its definition is: X1, X2, …, Xn are time sequence variables; and n is the length of the time sequence (n > 8). In Equations (6) and (7), the M-K method defines the statistical amount S and variance V(S). It also assumes that it follows the normal distribution [19,30]:
Z c = { S 1 V ( S ) , S > 0 0 , S = 0 S 1 V ( S ) , S < 0
s = t = 1 n 1 k = t + 1 n sgn ( x k x t )
V ( S ) = n ( n 1 ) ( 2 n + 5 ) / 18
where Zc is a normal distribution statistical amount within a given time range. At the given α confidence level, if |Zc| ≥ Z1−α/2, the original hypothesis is rejected, namely the time sequence’s data X1, X2, …, Xn has a significantly rising or decreasing tendency. There are three main significance levels, α = 0.1 (Zc = 1.28), α = 0.05 (Zc = 1.96), α = 0.01 (Zc = 2.32), representing the reliability test of 90%, 95% and 99%, respectively. According to statistical rules, the 95% confidence level is the most widely used [20,21]. Therefore, in this paper, the significance level α = 0.05 is adopted, thus the relevant testing critical value is Zc = 1.96. In Equation (6), when XkXt > 0, XkXt = 0, or XkXt < 0, sgn (XkXt), respectively, equals 1, 0 and −1.
The time sequence’s date changing tendency is represented by β. The calculation is as follows:
β = M e d i a n ( X j X i j i ) j > I
where Xj and Xi are, respectively, the measurement values of Year j and Year i, and j > i. If β > 0, it means the time sequence has a rising tendency; if β < 0, it means the time sequence has a decreasing tendency [30].

3. Results

3.1. The Characteristic of Precipitation Fluctuation Year by Year

For the changing characteristics of District I, there was a decreasing tendency between 1961 and 2015 in total (Figure 2(a1)). In the period, the peak values of the annual precipitation had occurred three times, respectively, in 1964, 1991 and 2015. The precipitation was, respectively, 421.7 mm (±119.9), 530.2 mm (±84.1) and 468.6 mm (±9.2). The time difference between peak values are, respectively, 27 and 24 years; the low peak value occurred twice, in the year 1972 and 2007; the annual precipitation were 284.4 mm (±13.1) and 249.6 mm (±7.2), respectively. The time interval between peak values is 35 years. The difference between the maximum precipitation and the minimum precipitation is 280.6 mm. The precipitation sequence changing tendency showed that (Figure 2(a2)) there was a main rising tendency in the time period 1985–1994 (β > 0). After the year 1994, the changing tendency was alternate appearance between raising and decreasing. In these years, the changes in 2008 and 2005 reached a significant level (Zc values were above 95% of the confidence line).
The changing tendency of District II was consistent with that of District I (Figure 2(b1)). Three average peak values occurred in 1962, 1990 and 2012; the precipitation was, respectively, 458.1 mm (±57.1), 514.9 mm (±84.8) and 497.5 mm (±11.7). The time interval between peak values were 28 and 22 years; the time when two low-peak values occur was consistent with that of District I. The average precipitation was, respectively, 263.6 mm (±39.1) and 240.5 mm (±79.3). The difference between the maximum precipitation and the minimum precipitation was 274.4 mm. The precipitation sequence changing tendency showed that (Figure 2(b2)) there was a main rising tendency in the time period 1985–1991 (β > 0). There was a main decreasing tendency during 1992–2015, except in 2005 (β < 0). In these years, the changes from 1999 to 2002 reached a significant level (Zc values were above 95% of the confidence line).
The changing tendency of District III was consistent with that of District I and District II. The precipitation fluctuation’s changes between 1961 and 1990 were not huge. From the year 1991, a significantly downward fluctuating period occurred (Figure 2(c1)). The minimum value occurred in 2007, and the precipitation was 308.6 mm (±19.0). After that, the precipitation gradually increased and reached the peak value in 2012 of 590.1 mm (±86.4). The difference between the maximum precipitation and the minimum precipitation was 281.5 mm. The precipitation sequence changing tendency showed that (Figure 2(c2)) there was a main rising tendency in the time period 2004–2015 (β > 0). Before 2004, the changing tendency was mainly decreasing during 1986–2003 (β < 0), except in the years 1990 and 1991. In these years, the changes from 1999 to 2003 reached a significant level (Zc values were above 95% of the confidence line).
The changing tendency of District IV was similar to that of District III. Its changes were steady and slow before the year 1991. After that, there was a significantly downward fluctuating period (Figure 2(d1)). The minimum value occurred in the year 2006, and the precipitation was 373.2 mm (±80.9); after that, the precipitation gradually increased and reached the maximum value of 714.1 mm (±53.2) in 2012. The difference between the maximum precipitation and the minimum precipitation was 340.9 mm. The precipitation sequence changing tendency showed that (Figure 2(d2)) there were two main rising trends, in the time periods 1985–1994 and 1995–2013 (β > 0). The changing tendency of the remaining years was alternating rising and decreasing periods. In these years, the changes in 2002 and 2003 reached a significant level (Zc values were above 95% of the confidence line).

3.2. The Interdecadal Change of Precipitation Fluctuation

According to the meteorological station’s actual measured data, the inter-annual variations of the Horqin region’s precipitation were huge. Horqin region’s average annual precipitation anomaly between 1961 and 2015 is shown in Table 1. The precipitation anomalies of District I were positive in the 1960s, 1980s, 1990s and 2010s (Table 1), which meant the precipitation in this period was high; the precipitation in the 1990s was the maximum, 381.9 mm (±83.8). Its anomaly percentage was 12.95%. The precipitation anomalies in the 1970s and the 2000s were negative, meaning the precipitation in these two periods are low. Among them, the precipitation in the 2000s was the lowest (273.2 mm (±48.3)). The average precipitation anomaly reached −65 mm, and the anomaly percentage was −19.26%. Compared with other periods, its average deviation was large. The precipitation anomalies in the 1970s and the 1980s were approximate to normal values.
The changing tendency of District II was similar to that of District I. In the 1960s, 1980s, 1990s and 2010s, the precipitation anomalies were positive, meaning the precipitation in these periods were high; the precipitation in the 1990s was the maximum, 409.2 mm (±87.1). Its anomaly percentage was 11.21%. The precipitation anomalies in the 1970s and the 2000s were negative, meaning the precipitation in this period were low. Precipitation in the 2000s was minimum and was 301.2 mm (±49.5). Its anomaly percentage reached −18.04%.
The changing tendency of District III was similar to that of District I and District II (Figure 1). The precipitation anomalies in the 1960s, 1970s, 1990s and 2010s were positive. The precipitation in the 1990s was maximum, 458.7 mm (±70.4). Its anomaly percentage was 8.50%, which was significantly lower than that of District I and District II. The precipitation anomalies in the 1980s and 2000s were negative. The precipitation in the 2000s was minimum, 349.4 mm (±59.1). Its anomaly percentage reached −17.37%.
The changing tendency of District IV had large fluctuations, and the precipitation anomaly alternated with positive and negative values. The precipitation anomalies in the 1970s, 1990s and 2010s were positive. The precipitation in the 2010s was maximum, 583.9 mm (±163.5). Its anomaly percentage was 20.07%. The precipitation anomalies in the 1960s and 2000s were negative, meaning the precipitation in these periods were low. The precipitation in the 2000s was minimum, 417.9 mm (±78.8). Its anomaly percentage reached −14.27%.

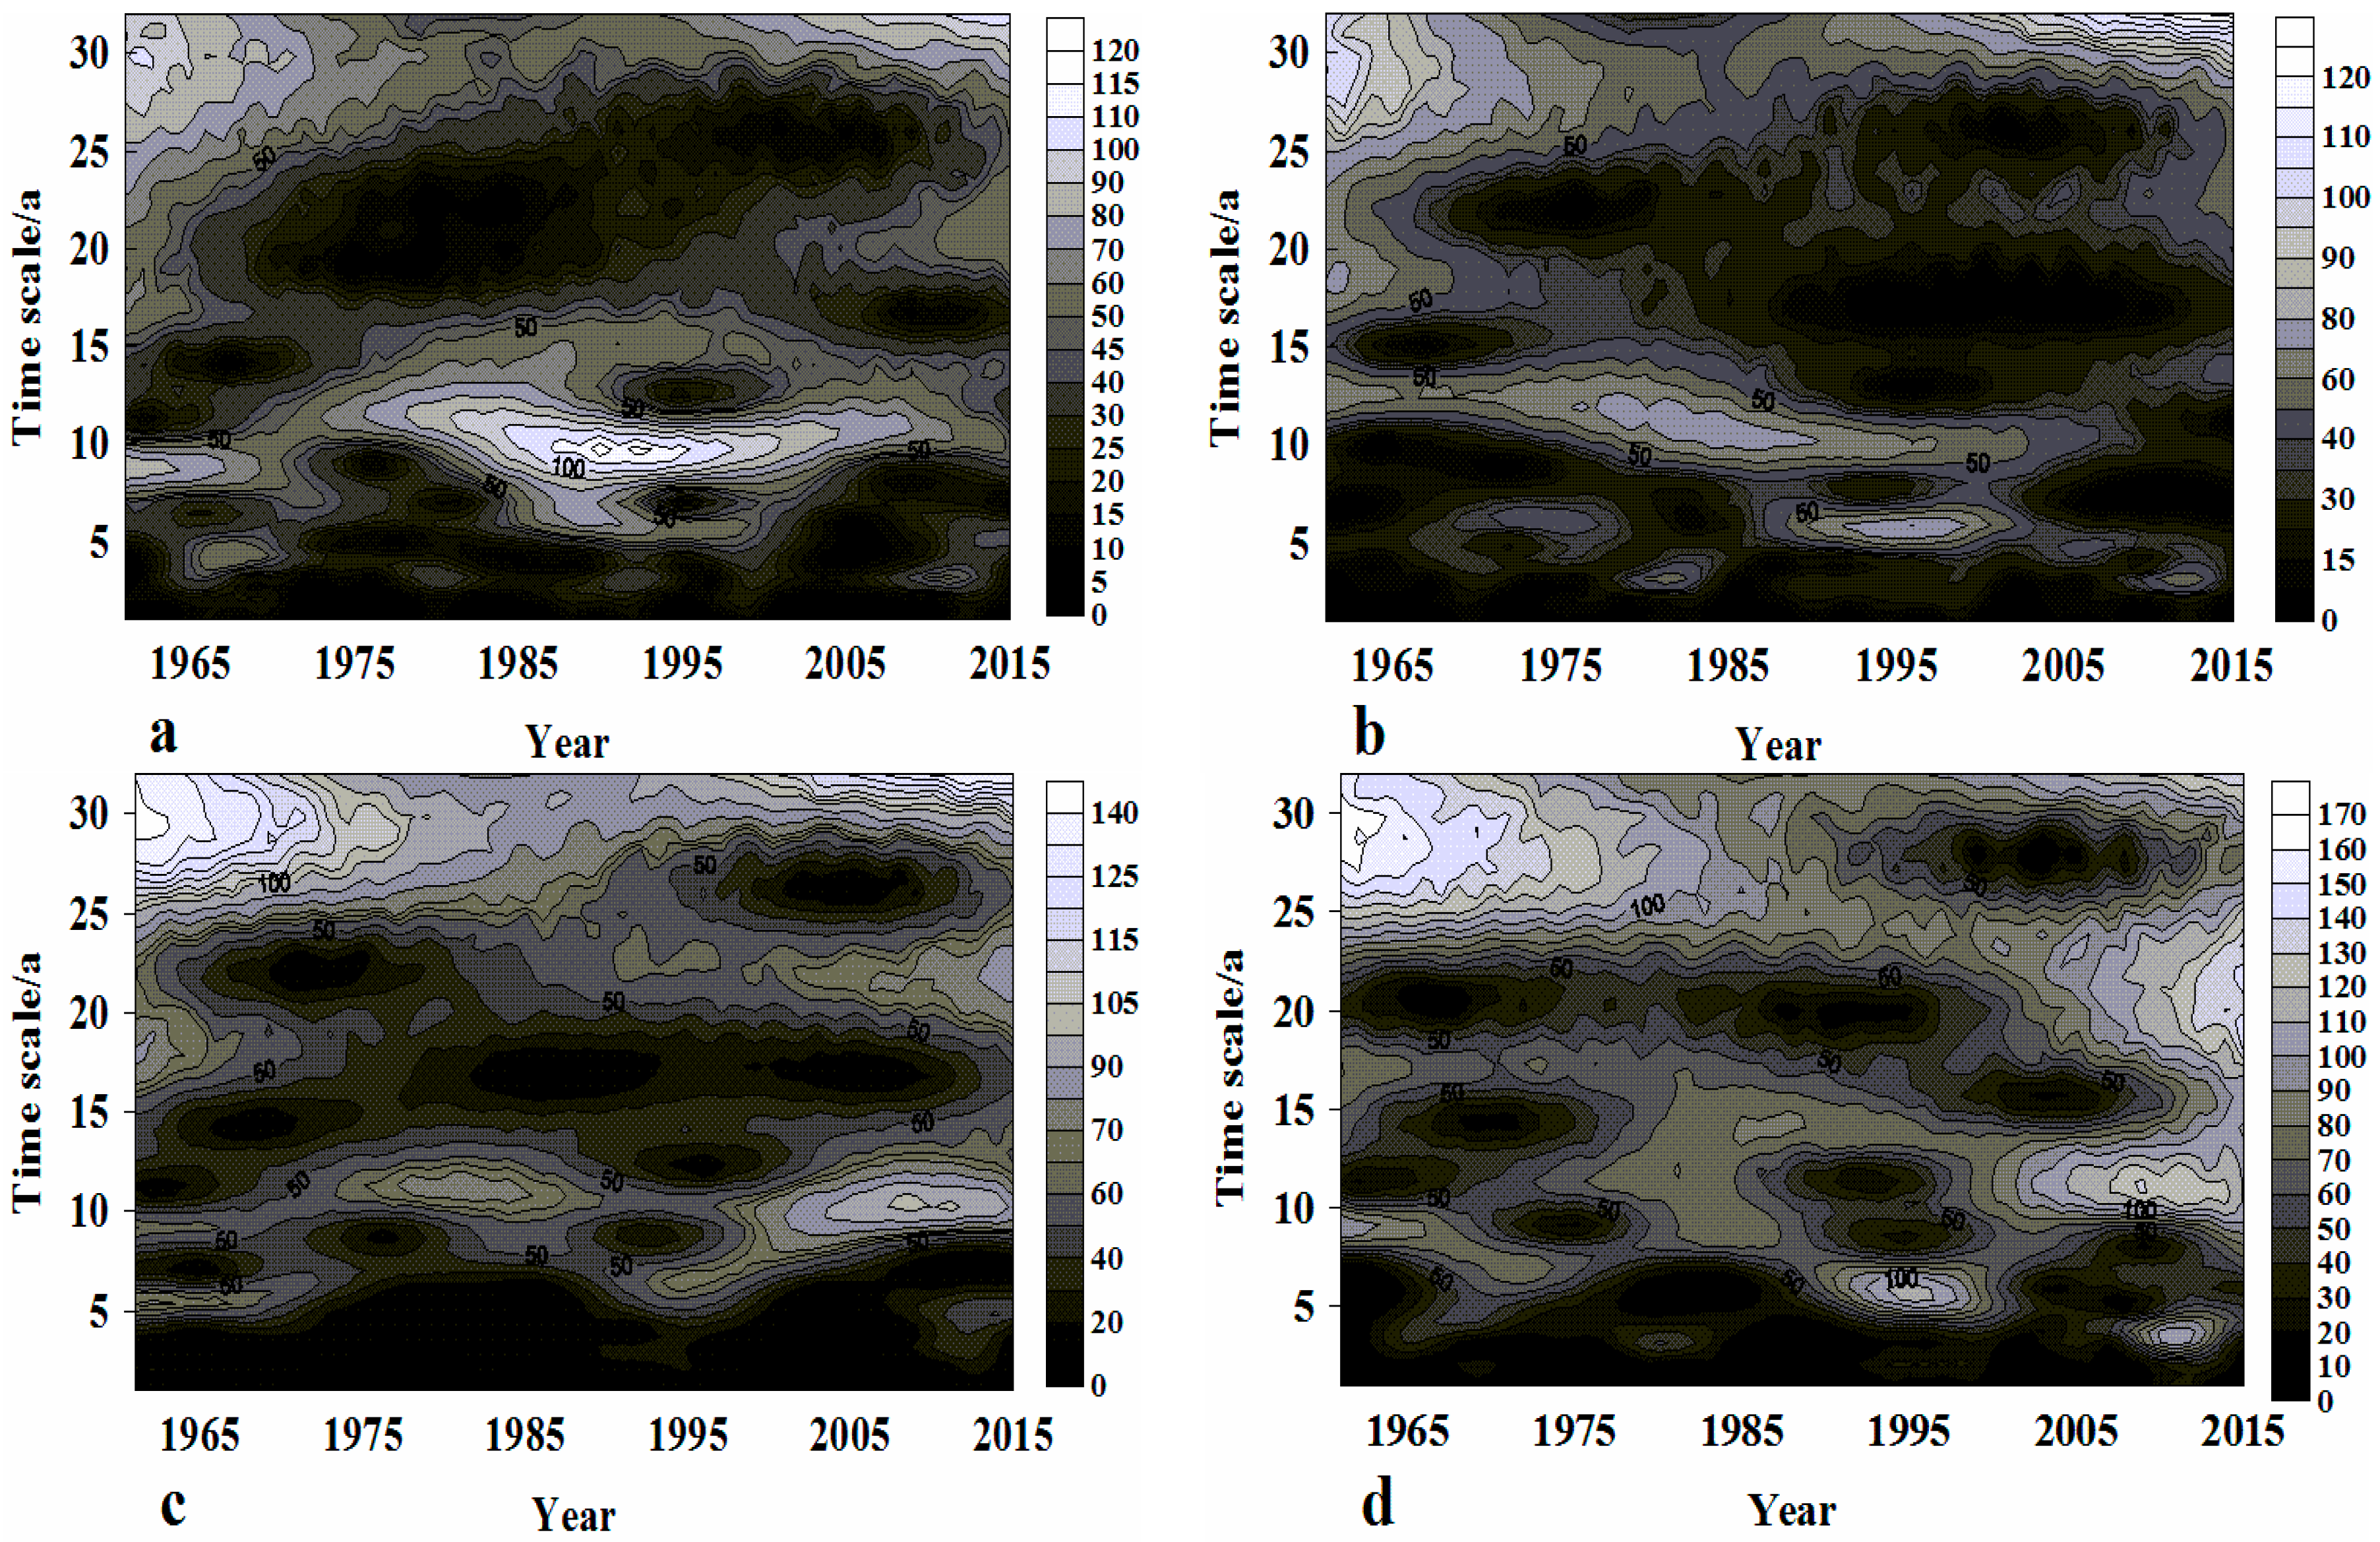
3.3. The Inter-Annual Fluctuation of Precipitation

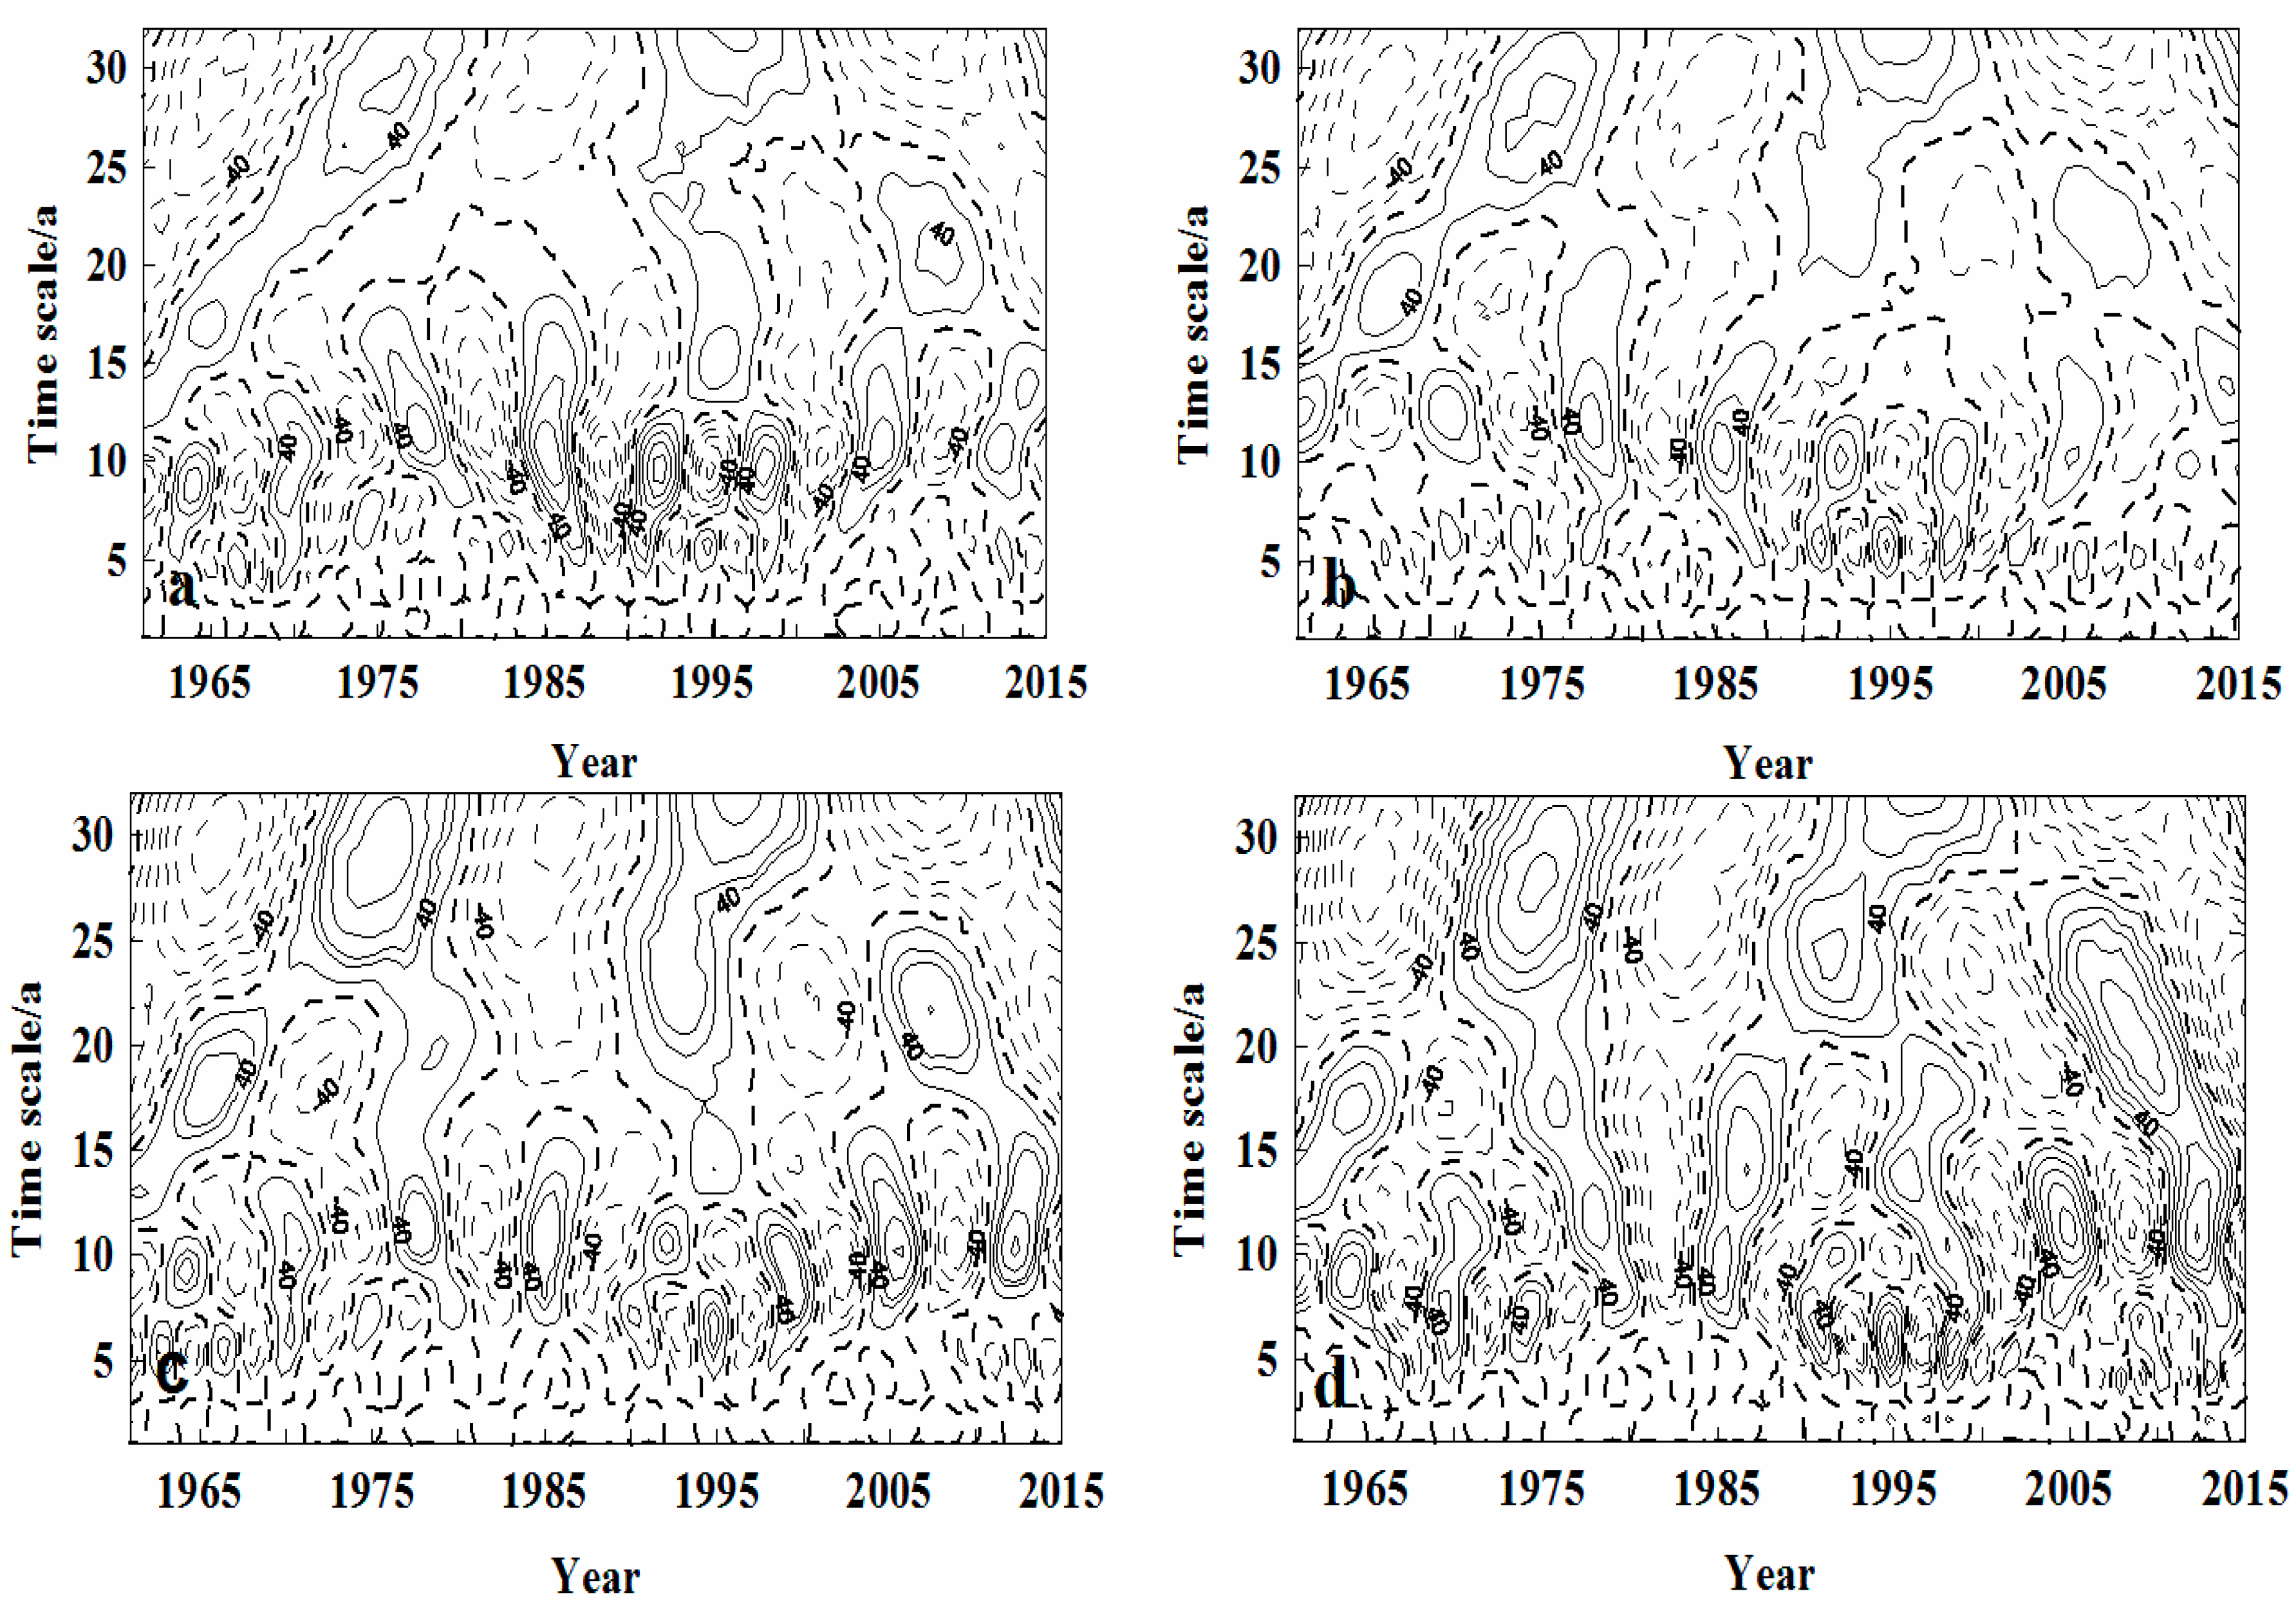
3.3.1. Analysis of the Isoline of Wavelet Coefficient Real Part of Precipitation Sequence Change

The distribution characteristics of the wavelet coefficient real part reflect the variable changing cyclical scope in the sequence. Morlet complex wavelet exchange was used to analyze Horqin region’s precipitation time sequences, as shown in Figure 3. The solid line means the real part coefficient was positive and the precipitation was high. The spotted line means the real part coefficient was negative and the precipitation was low. The real part coefficient of bold spotted line is 0, meaning anomalies occurred at this spot. As the maximum sequence was 32, this research mainly considered cyclical changes that did not exceed 32 years. In Figure 3a, the precipitation of District I between 1961 and 2015 mainly had the multi-time scale characteristics, which were, respectively, two change cycles of 5–14 years and 23–32 years. In the time scale of 24–32 years, the cyclical fluctuations were very significant, and the annual precipitation experienced two standard cyclical fluctuations from low to high precipitation. The periods of low precipitation were: 1961–1972, 1983–1992 and 2002–2015. The periods with high precipitation were: 1973–1982 and 1993–2001. In the time scale of 5–14 years, there were many cycles, of alternating between high precipitation periods and low precipitation periods, as well as many precipitation change-points. Meanwhile, it can be seen that the cyclical changes of the above two scales were also very stable during the entire analyzed period.
The time scale cyclical changes of District II were consistent with those of District I (Figure 3b). There were also two changing periods of 5–14 years and 23–32 years. In the time scale of 23–32 years, the cyclical fluctuations were very significant and the annual precipitation experienced two cyclical fluctuations of low to high precipitation. The periods with low and high precipitation were the same as those in District I. In the time scale of 5–14 years, there were cycles of alternating periods of high low precipitation. Its cyclical fluctuations were fewer than those of District I; before 1976, cyclical changes were unstable, while, after 1976, cyclical changes appear to be very stable.
Compared with the changes of District I and District II, the changing tendency of District III had significant differences (Figure 3c). There were mainly three changing periods: 5–11 years, 12–22 years and 23–32 years. In the time scale of 23–32 years, the cyclical fluctuations were very significant, and the annual precipitation experienced two cyclical fluctuations from low to high precipitation, which was consistent with the period of low and high precipitation in District I and District II. In the time scale of 12–22 years, there were four cyclical fluctuations. In the time scale of 5–11 years, there were many cycles of alternating between periods of high and the low precipitation. In the time scale of 5–11 years, there were many cycles of alternating between periods of low and high precipitation.
The changing tendency of District IV was similar to that of District III (Figure 3d), which mainly had three change cycles: 5–11 years, 12–22 years and 21–32 years. In the time scale of 21–32 years, cyclical fluctuations were very significant. The annual precipitation experienced two cyclical fluctuations of low to high precipitation, which was consistent with the periods of low and high precipitation in District I and District II. In the time scale of 12–20 years, there were five cyclical fluctuations. In the time scale of 5–11 years, there were many cycles between periods of high and low precipitation. The precipitation change-points increased.

3.3.2. Analysis of the Isoline of Wavelet Module Change of Precipitation Sequence

The distribution characteristics of the wavelet module reflect the strength of researched variables in the sequence. The bigger the Morlet wavelet module value is, the stronger the periodicity of its response time period (scale), namely the bigger the image gray level is, the smaller the module value is. In District I (Figure 4a), there were two time sections whose periodicity was stronger. Between 1980 and 2015, the time scale of 7–11 had the minimum gray level and the strongest periodicity; before 1980, the time scale of 26–32 had a bigger module value and stronger periodicity. Compared to the real part, the cyclical rhythm between them corresponded to each other. However, the module value’s cycle decreased by 2–3 years. The module value of other time scales was smaller, and the cyclical change was smaller.
The wavelet coefficient module isoline diagram of District II was different from that of District I (Figure 4b). It had four stronger cycles, and two of them overlap with the real part’s cycles. Before 2010, the gray level of the time scale of 10–14 was smaller, yet its periodicity was stronger; before 1980, the module value of the time scale of 25–32 in the real part cycle of 23–32 was bigger, and the periodicity was stronger. Compared with the real part’s periodicity, the module value’s cycle decreased by 2–5 years.
In District III, there were two regions with stronger periodicity (Figure 4c). After 2000, the cyclical changes were bigger in the time period of 5–10 years; before 1980, the module value of the time scale of 26–32 years was maximum, and this time scale’s cyclical changes were the most significant. Compared with the real part’s cycles, the module value’s cycle decreased by 1–3 years.
In District IV, there were three intervals with stronger periods that overlap with the real part’s cycles (Figure 4d). Between 1988 and 2002, the gray level of the time scale of 7–11 years was smaller, yet the periodicity was stronger. After 2000, the gray level of the time scale of 12–15 years was smaller, yet the periodicity was stronger; before 1990, the module value of the time scale of 24–32 was maximum in the real part’s cycle of 21–32 years, and the periodicity was strongest. Compared with the real part’s cycles, the module value’s cycle decreased by 2–7 years.

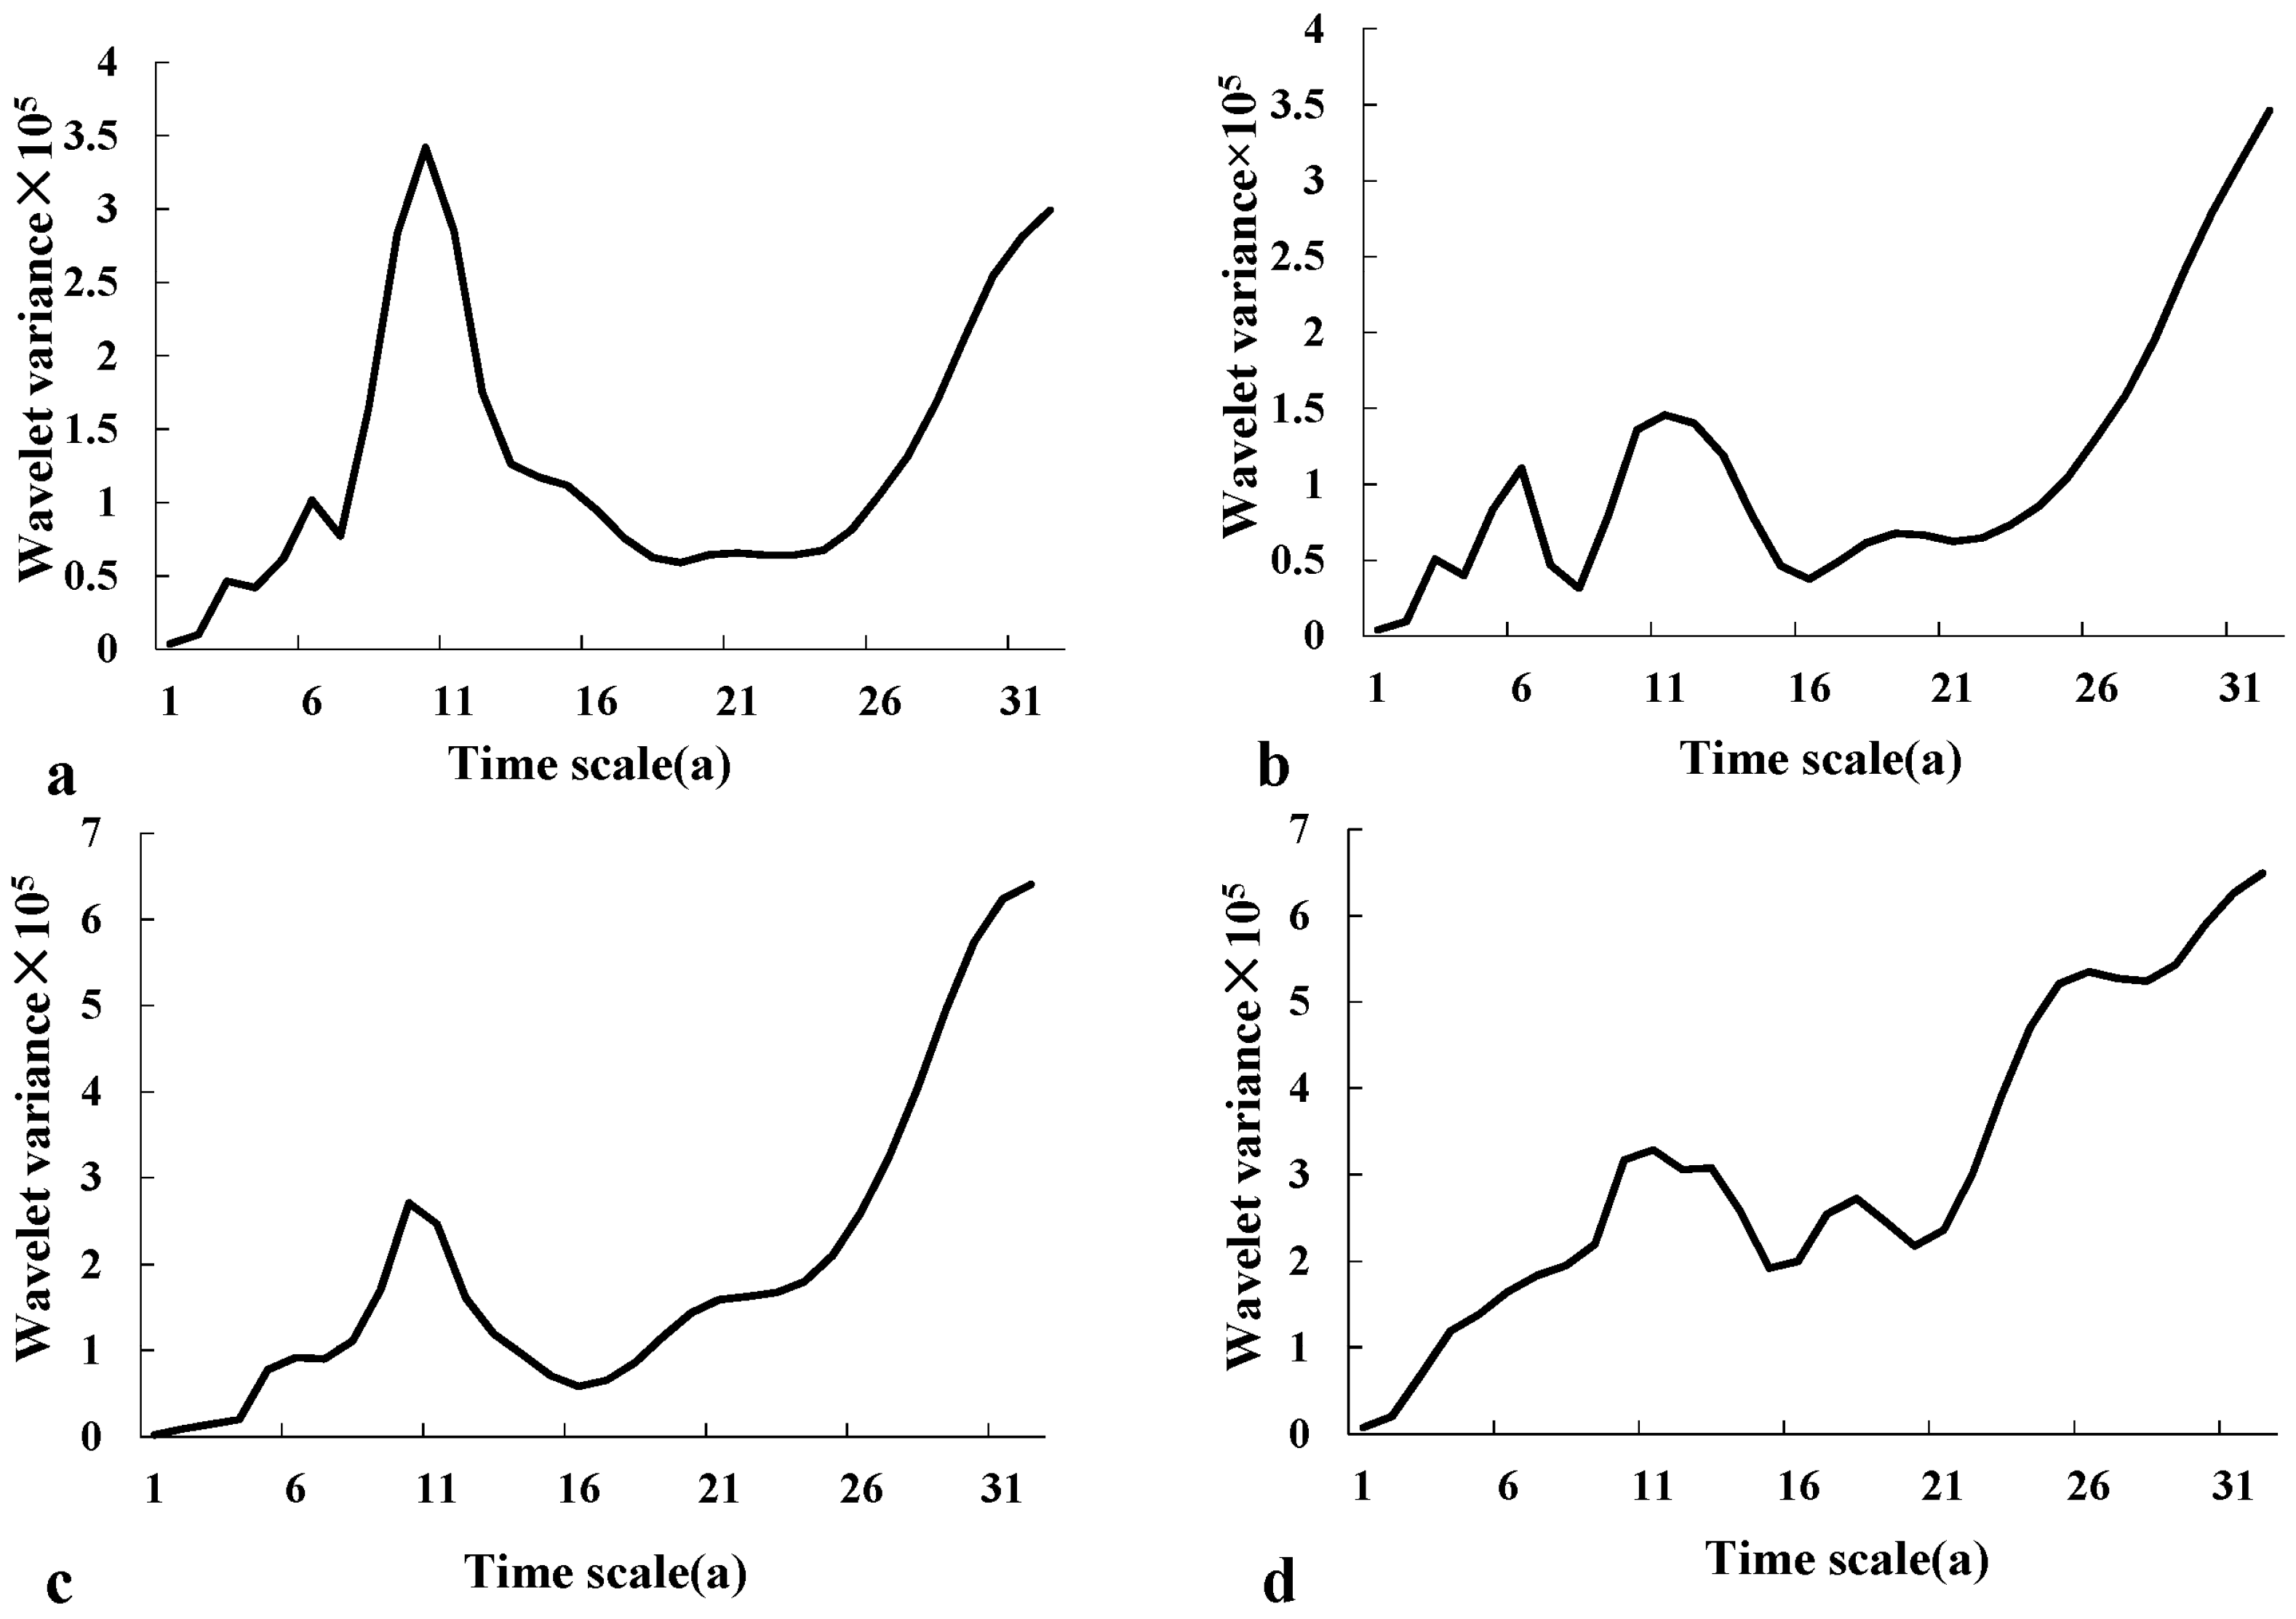
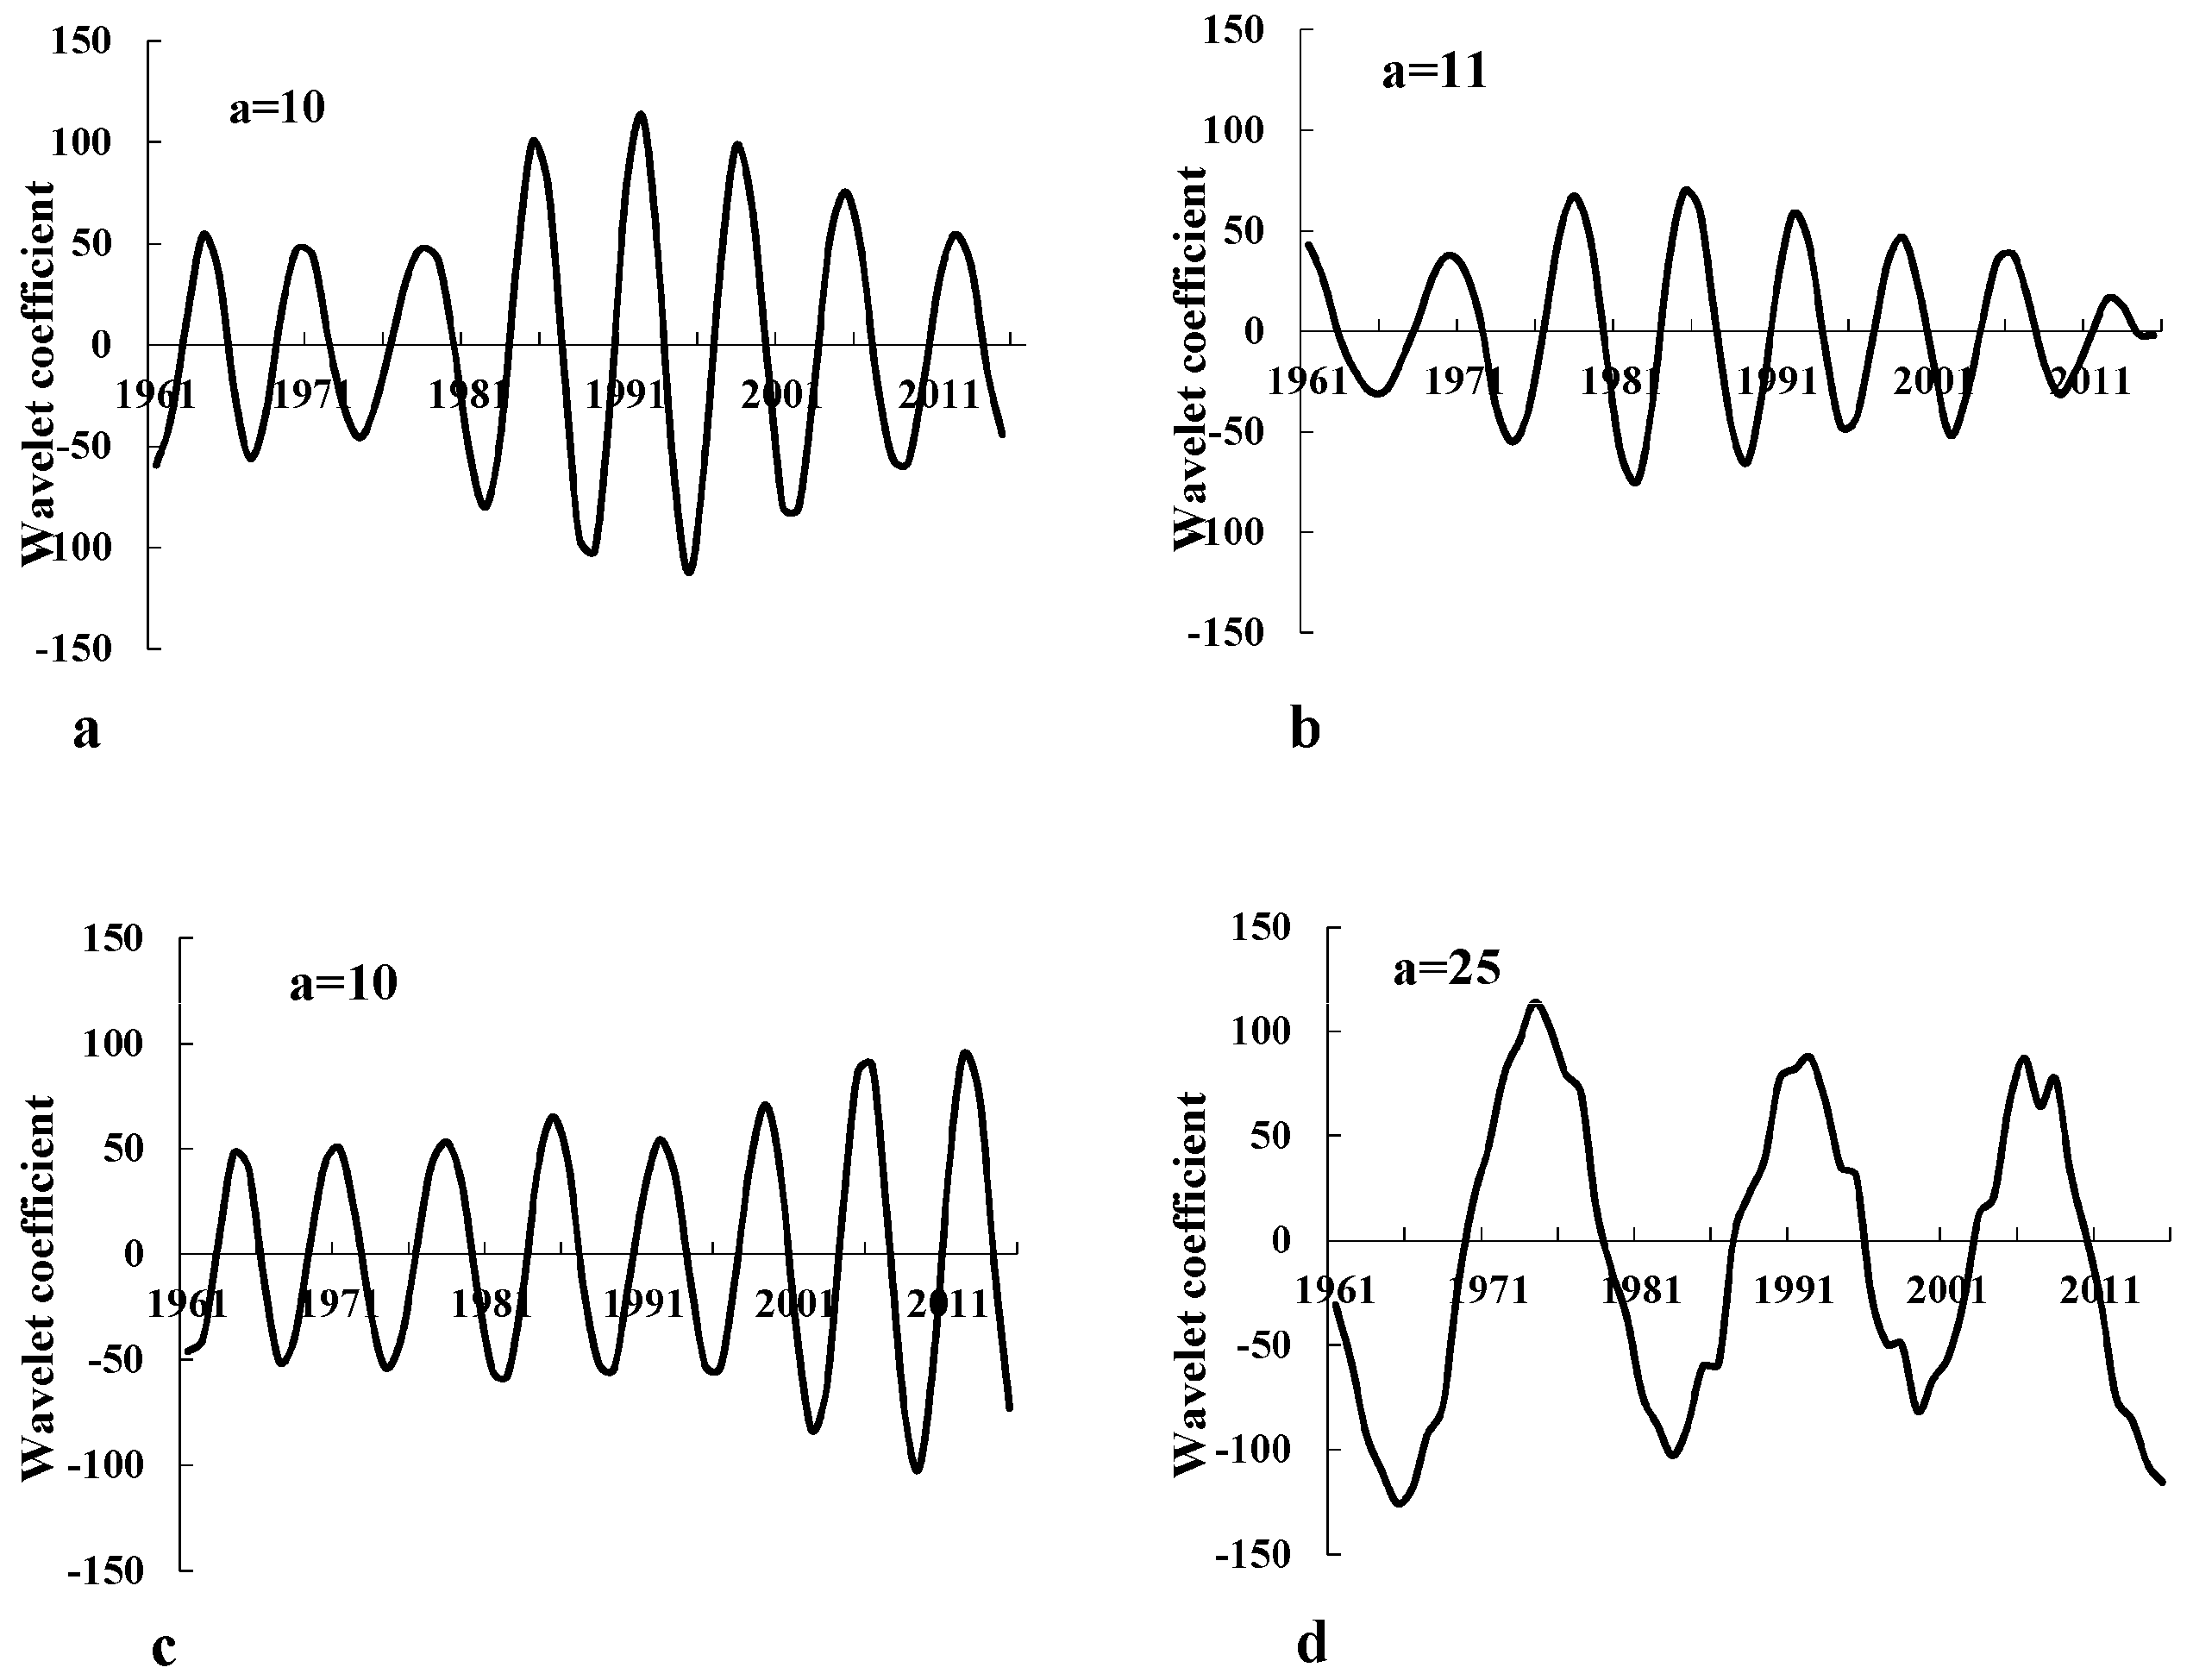
3.3.3. Wavelet Variance Analysis of the Precipitation Sequence

The wavelet variance was used to test the peak values in the cycles of researched variables. It adopted the wavelet variance to test the change cycles of the precipitation between 1961 and 2015 (Figure 5a). It was found that there are three cycles in the precipitation sequence wavelet variance diagram in District I, two of which were significant and correspond to the time scales of six and 10 years. Among them, the maximum peak value corresponds to the time scale of 10 years, meaning the cyclical fluctuation of 10 years was strongest and was the first main cycle of the annual precipitation changes. The cyclical fluctuation of six years was the second main cycle of the annual precipitation changes.
There were four cycles in the annual precipitation changes of District II, among which two were significant (Figure 5b), corresponding to the time scales of six years and 11 years. Among them, the maximum peak value corresponded to the time scale of 11 years, meaning the cyclical fluctuation of 11 years was strongest and was the first main cycle of the annual precipitation changes. The cyclical fluctuation of six years was the second main cycle of the annual precipitation changes.
There were two cycles in the annual precipitation changes of District III, and one cycle was significant (Figure 5c). The maximum value corresponded to the time scales of 10 years, meaning the cyclical fluctuation of 10 years was strongest and was the first main cycle of precipitation changes.
There were four cycles in the precipitation changes of District IV, and three cycles were significant (Figure 5d), corresponding to the time scales of 11, 17 and 25 years. Among them, the maximum peak value corresponds to the time scale of 25 years, meaning the cyclical fluctuation of District IV was strongest in the time scale of 25 years and was the first main cycle of precipitation changes. The cyclical fluctuations of 11 years and 17 years were, respectively, the second and third main cycles.
According to the results of the wavelet variance analysis, a peak value of the cycles was found, which was regarded as the first main cycle in this time scale. Then, the wavelet coefficient real part curve of the precipitation in the first main cycle’s time scale of each district was drawn, which showed the times of the main cyclical changes in each District (Figure 6). In Figure 6, the cyclical changes of annul precipitation was about seven years in the characteristic time scale of 10 years in District I. The annual precipitation’s cyclical changes were about seven years, which have mainly experienced eight changes from high precipitation to low precipitation (Figure 6a). In the characteristic time scale of 11 years, District II’s cyclical change of annual precipitation was about eight years and it experienced approximately seven cyclical changes from high precipitation to low precipitation (Figure 6b); in the characteristic time scale of 10 years, District III’s annual precipitation cycle was about seven years and it experienced approximately eight cyclical changes from high precipitation to low precipitation (Figure 6c); in the characteristic time scale of 25 years, District IV’s annual precipitation cyclical change was about 17 years and it experienced approximately three cyclical changes from high precipitation to low precipitation (Figure 6d).

4. Discussion

Horqin region is a typical agro-pastoral transition zone in north China, which belongs to the transition zone of northeast temperate semi humid climate zone of northeast China and temperate semi-arid climate zone of Inner Mongolia. Its ecological environment is fragile and it is regarded as a climatic zone that is divided into semi-humid and semi-arid areas. Besides, it is sensitive to precipitation fluctuations [9,14].
From the overall tendency of precipitation changes, the precipitation inter-annual variations in Horqin region were different in different districts between 1961 and 2015 (Figure 2(a2–d2)), but had the tendency of gradually decreasing in different sub-regions. The decreasing tendency of precipitation had spatial variations (Figure 2(a1–d1)). The annual precipitation of District I, District II, District III and District IV were, respectively, 337.4 mm, 369.2 mm, 422.6 mm and 483.4 mm; and as the spatial distribution characteristics showed, the precipitation has a tendency of decreasing from the southeast to the northwest. The degree of the decreasing tendency is increasing. These results are consistent with the conclusions of the research carried out by Liu et al. (2011) [31], in the sand land Naiman Banner station in Horqin (this station is located in District II). This is because Horqin region is located in the transitional zone between semi-humid and semi-arid areas. The regional distribution of the average precipitation over several years is greatly influenced by the land–sea factor. This area is affected by the temperate monsoon climate. The characteristics of temperate monsoon climate is alternatingly controlled by the winter and summer monsoons. There is a tendency of weakening summer monsoon in some studies [32,33,34]. Thus, the land–sea distribution has significantly influenced the annual precipitation’s changes. Therefore, the distance from the sea, the landform, the climate and other factors jointly cause this precipitation distribution pattern. Hence, the annual precipitation variation of this region is tending toward being arid.
From this region’s precipitation inter-annual variation characteristics, the precipitation anomalies of District I, District II, District III and District IV between 1960 and 1980 were small and approximate to the normal value. In the 1990s, the precipitation anomaly increased and the precipitation was high. The precipitation anomaly in the 2000s decreased, and the precipitation was low. Besides, the decreasing tendencies were huge. Among them, the anomaly percentage in District I was maximum when the precipitation anomaly increased and was 12.95%; when the anomaly precipitation decreased, the average deviation value was maximum and was −19.26%. This was consistent with the multi-time scale analysis of the Horqin sand Naiman Banner’s precipitation carried out by Yao (2014) [24] between 1970 and 2010, who showed that the precipitation increased in 1990 and decreased after 1995.
The precipitation inter-annual fluctuation had a complex periodicity, while the wavelet analysis method had an extremely advantage in explaining the multiple-scale periodicity [35,36]. As seen from the results of analyzing the time scale, the common aspects of precipitation change in different regions of Horqin region are as follows. In the time scale of 23–32 years, the cyclical fluctuations were very significant and the annual precipitation undergone two cyclical fluctuations from periods of low precipitation to high precipitation. Periods of low precipitation included: 1961–1972, 1983–1992 and 2002–2015. Periods of high precipitation included: 1973–1982 and 1993–2001. In the time scale of 5–11 years, there were many cyclical changes from periods of high precipitation to low precipitation. Precipitation change points also increased. As seen from the strength of the periodicity, the time scale of 26–32 years had a bigger module value in the cycle of 23–32 years, meaning this period was the time of significant precipitation cyclical change. The cyclical change of the time scale of 5–11 years were secondary. The cyclical changes of other time scales were smaller. There were also differences between some years. However, the overall changing tendency was consistent.
As the results of analyzing the spatial wavelet variance of sub-region (Figure 5), the main cycle of precipitation in District I, District II and District III was between 10 and 11 years. However, the main cycle of precipitation in District IV was 25 years. This means Horqin region’s precipitation fluctuating characteristics were consistent within regions with less than 450 mm annual precipitation. When the value exceeded this, the changing laws were significantly different. Meanwhile, it can be estimated from the cyclical tendency of changing from high to low precipitation in different sub-regions’ annual precipitation wavelet variance picture that Horqin region will be in a period of low precipitation between 2016 and 2020.

5. Conclusions

The spatial differentiation characteristics of Horqin region’s annual precipitation fluctuation were mainly represented in the following. (1) This region is trending towards being arid and precipitation gradually decreases from the southeast (District IV) to northwest (District I). (2) The influence of spatial differentiation characteristics on precipitation fluctuation in this region was represented in the cyclical fluctuation, which gradually decreased from the southeast to the northwest. The cyclical change’ time was gradually shortened. In the first main cycle whose annual precipitation changes were most significant, the changing characteristic in District IV and District I decreased from 25 years to 10 years. (3) It is predicated from the cyclical changing law that the annual precipitation is currently decreasing from high to low, and Horqin region will remain in a period of low precipitation between 2016 and 2020.
Spatial differentiation characteristics of precipitation were studied and the future precipitation situation was predicated by cyclical changing law of wavelet. Furthermore, artificial neural network and other new methods were also used in this research for prediction of precipitation. We will compare and combine these methods in further studies [37,38,39,40,41,42]. The influences of this precipitation fluctuation change to vegetation change will also be further studied.

Acknowledgments

The authors would like to thank all the members of Urat Desert-grassland Research Station, China Academy of Sciences (CAS), for their help in fieldwork. This research is funded by Mechanism of landscape process response of precipitation fluctuation on Kerqin Sandy Land (41271193); National Natural Science Foundation of China (41371053); and Water driving mechanism and Simulation of carbon and nitrogen processes in the sandy soil-vegetation system (41541003); National Natural Science Foundation of China(41501572).

Author Contributions

Liangxu Liu wrote the paper; Xueyong Zhao conceived and designed the experiments; Qinglan Meng, He Zhao, Xiaoqian Lu and Junkai Gao analyzed part of the data; and Xueli Chang help Liangxu Liu analyzed part of the data and corrected the English.

Conflicts of Interest

The authors declare no conflict of interest. The founding sponsors had no role in the design of the study; in the collection, analyses, or interpretation of data; in the writing of the manuscript, and in the decision to publish the results.

References

  1. Gao, Q.; Reynolds, J.F. Historical shrub-grass transitions in the northern Chihuahuan Desert: Modeling the effects of shifting rainfall seasonality and event size over a landscape gradient. Glob. Chang. Biol. 2003, 9, 1475–1493. [Google Scholar] [CrossRef]
  2. Noy-Meir, I. Desert ecosystems: Environment and producers. Annu. Rev. Ecol. Evol. Syst. 1973, 4, 25–51. [Google Scholar] [CrossRef]
  3. Sala, O.; Lauenroth, W. Small rainfall events: An ecological role in semiarid regions. Oecologia 1982, 53, 301–304. [Google Scholar] [CrossRef]
  4. Reynolds, J.F.; Kemp, P.R.; Ogle, K.; Fernández, R.J. Modifying the ‘pulse-reserve’ paradigm for deserts of North America: Precipitation pulses, soil water, and plant responses. Oecologia 2004, 141, 194–210. [Google Scholar] [CrossRef] [PubMed]
  5. Reichmann, L.G.; Sala, O.E.; Peters, D.P. Precipitation legacies in desert grassland primary production occur through previous-year tiller density. Ecology 2013, 94, 435–443. [Google Scholar] [CrossRef] [PubMed]
  6. Jankju-Borzelabad, M.; Griffiths, H. Competition for pulsed resources: An experimental study of establishment and coexistence for an arid-land grass. Oecologia 2006, 148, 555–563. [Google Scholar] [CrossRef] [PubMed]
  7. Shihai, L.; Liu, J.; Zheng, Z.; Shengxing, Y.E.; Chang, X. Effects of the Annual Precipitation Fluctuation on Primary Productivity in Hulunbeier Meadow-Steppe. Res. Environ. Sci. 2015, 28, 550–580. [Google Scholar]
  8. Chesson, P.; Gebauer, R.L.; Schwinning, S.; Huntly, N.; Wiegand, K.; Ernest, M.S.; Sher, A.; Novoplansky, A.; Weltzin, J.F. Resource pulses, species interactions, and diversity maintenance in arid and semi-arid environments. Oecologia 2004, 141, 236–253. [Google Scholar] [CrossRef] [PubMed]
  9. Knapp, A.K.; Fay, P.A.; Blair, J.M.; Collins, S.L.; Smith, M.D.; Carlisle, J.D.; Harper, C.W.; Danner, B.T.; Lett, M.S.; McCarron, J.K. Rainfall variability, carbon cycling, and plant species diversity in a mesic grassland. Science 2002, 298, 2202–2205. [Google Scholar] [CrossRef] [PubMed]
  10. Lu, L.; Li, X.; Cheng, G. Landscape evolution in the middle Heihe River Basin of north-west China during the last decade. J. Arid Environ. 2003, 53, 395–408. [Google Scholar] [CrossRef]
  11. Schwinning, S.; Starr, B.I.; Ehleringer, J.R. Dominant cold desert plants do not partition warm season precipitation by event size. Oecologia 2003, 136, 252–260. [Google Scholar] [CrossRef] [PubMed]
  12. Ryel, R.J.; Leffler, A.; Peek, M.; Ivans, C.; Caldwell, M. Water conservation in Artemisia tridentata through redistribution of precipitation. Oecologia 2004, 141, 335–345. [Google Scholar] [CrossRef] [PubMed]
  13. Hamerlynck, E.P.; Scott, R.L.; Stone, J.J. Soil moisture and ecosystem function responses of desert grassland varying in vegetative cover to a saturating precipitation pulse. Ecohydrology 2012, 5, 297–305. [Google Scholar] [CrossRef]
  14. Smith, S.D.; Monson, R.K.; Anderson, J.E. Physiological Ecology of North American Desert Plants; Springer: Berlin, Germany, 2012. [Google Scholar]
  15. Loik, M.E.; Breshears, D.D.; Lauenroth, W.K.; Belnap, J. A multi-scale perspective of water pulses in dryland ecosystems: Climatology and ecohydrology of the western USA. Oecologia 2004, 141, 269–281. [Google Scholar] [CrossRef] [PubMed]
  16. Ehleringer, J.R.; Phillips, S.L.; Schuster, W.S.; Sandquist, D.R. Differential utilization of summer rains by desert plants. Oecologia 1991, 88, 430–434. [Google Scholar] [CrossRef]
  17. Snyder, K.; Tartowski, S. Multi-scale temporal variation in water availability: Implications for vegetation dynamics in arid and semi-arid ecosystems. J. Arid Environ. 2006, 65, 219–234. [Google Scholar] [CrossRef]
  18. Xu, Z.; Li, J.; Liu, C. Long-term trend analysis for major climate variables in the Yellow River basin. Hydrol. Process. 2007, 21, 1935–1948. [Google Scholar] [CrossRef]
  19. Yang, Y.; Tian, F. Abrupt change of runoff and its major driving factors in Haihe River Catchment, China. J. Hyrol. 2009, 374, 373–383. [Google Scholar] [CrossRef]
  20. Hamed, K.H.; Rao, A.R. A modified Mann-Kendall trend test for autocorrelated data. J. Hyrol. 1998, 204, 182–196. [Google Scholar] [CrossRef]
  21. Mondal, A.; Kundu, S.; Mukhopadhyay, A. Rainfall trend analysis by Mann-Kendall test: A case study of north-eastern part of Cuttack district, Orissa. Int. J. Geol. Earth Environ. Sci. 2012, 2, 70–78. [Google Scholar]
  22. Yan-Sheng, Y.U.; Chen, X.W. Study on the Percentage of Trend Component in a Hydrological Time Series Based on Mann-Kendall Method. J. Nat. Resour. 2011, 26, 1585–1591. [Google Scholar]
  23. Rodriguez-Iturbe, I. Ecohydrology: A hydrologic perspective of climate-soil-vegetation dynamies. Water Resour. Res. 2000, 36, 3–9. [Google Scholar] [CrossRef]
  24. Yao, S.; Zhang, T.; Zhao, C. Multiple-time-scale Analysis on Precipitation in Naiman Banner of Horqin Sandy Land in 1970–2010. J. Desert Res. 2014, 34, 542–549. [Google Scholar]
  25. Li, M.; Xia, J.; Meng, D. Long-Term Trend Analysis of Seasonal Precipitation for Beijing, China. J. Nat. Resour. 2012, 3, 64–72. [Google Scholar]
  26. Liu, X.; He, Y.; Zhao, X.; Zhang, T.; Li, Y.; Yun, J.; Wei, S.; Yue, X. The response of soil water and deep percolation under Caragana microphylla to rainfall in the Horqin Sand Land, northern China. Catena 2016, 139, 82–91. [Google Scholar] [CrossRef]
  27. Kumar, P.; Foufoula-Georgiou, E. Wavelet analysis for geophysical applications. Rev. Geophys. 1997, 35, 385–412. [Google Scholar] [CrossRef]
  28. Kantelhardt, J.W.; Rybski, D.; Zschiegner, S.A.; Braun, P.; Koscielny-Bunde, E.; Livina, V.; Havlin, S.; Bunde, A. Multifractality of river runoff and precipitation: Comparison of fluctuation analysis and wavelet methods. Physica A 2003, 330, 240–245. [Google Scholar] [CrossRef]
  29. Labat, D.; Ababou, R.; Mangin, A. Rainfall-runoff relations for karstic springs. Part II: Continuous wavelet and discrete orthogonal multiresolution analyses. J. Hyrol. 2000, 238, 149–178. [Google Scholar] [CrossRef]
  30. Hamed, K.H. Exact distribution of the Mann-Kendall trend test statistic for persistent data. J. Hyrol. 2009, 365, 86–94. [Google Scholar] [CrossRef]
  31. Liu, X.P.; He, Y.H.; Zhao, X.Y.; Zhang, T.H.; Li, Y.L.; Yun, J.Y. Characteristics of Precipitation in Naiman Region of Horqin Sandy Land. Aust. J. Soil Res. 2011, 18, 155–158. [Google Scholar]
  32. Hao, Q.Z. Onset of Asian desertification by 22 Myr ago inferred from loess deposits in China. Nature 2002, 416, 159–163. [Google Scholar]
  33. Ramstein, G.; Fluteau, F.; Besse, J.; Joussaume, S. Effect of orogeny, plate motion and land–sea distribution on Eurasian climate change over the past 30 million years. Nature 1997, 386, 788–795. [Google Scholar] [CrossRef]
  34. Qian, C.; Zhou, T. Multidecadal Variability of North China Aridity and Its Relationship to PDO during 1900–2010. J. Clim. 2014, 27, 1210–1222. [Google Scholar] [CrossRef]
  35. Nourani, V.; Alami, M.T.; Aminfar, M.H. A combined neural-wavelet model for prediction of Ligvanchai watershed precipitation. Eng. Appl. Artif. Intell. 2009, 22, 466–472. [Google Scholar] [CrossRef]
  36. Partal, T.; CiGiZoglu, H.K. Prediction of daily precipitation using wavelet-neural networks. Hydrol. Sci. J. 2009, 54, 234–246. [Google Scholar] [CrossRef]
  37. Gholami, V.; Chau, K.W.; Fadaee, F.; Torkaman, J.; Ghaffari, A. Modeling of groundwater level fluctuations using dendrochronology in alluvial aquifers. J. Hydrol. 2015, 529, 1060–1069. [Google Scholar] [CrossRef]
  38. Taormina, R.; Chau, K.W. Data-driven input variable selection for rainfall-runoff modeling using binary-coded particle swarm optimization and Extreme Learning Machines. J. Hydrol. 2015, 529, 1617–1632. [Google Scholar] [CrossRef]
  39. Wu, C.L.; Chau, K.W.; Li, Y.S. Methods to improve neural network performance in daily flows prediction. J. Hydrol. 2009, 372, 80–93. [Google Scholar] [CrossRef]
  40. Wang, W.; Chau, K.; Xu, D.; Chen, X. Improving forecasting accuracy of annual runoff time series using ARIMA based on EEMD decomposition. Water Resour. Manag. 2015, 29, 2655–2675. [Google Scholar] [CrossRef]
  41. Chen, X.Y.; Chau, K.W.; Busari, A.O. A comparative study of population-based optimization algorithms for downstream river flow forecasting by a hybrid neural network model. Eng. Appl. Artif. Intell. 2015, 46, 258–268. [Google Scholar] [CrossRef]
  42. Chau, K.W.; Wu, C.L. A hybrid model coupled with singular spectrum analysis for daily rainfall prediction. J. Hydroinform. 2010, 12, 458–473. [Google Scholar] [CrossRef]
Figure 1. Location of the study area.
Sustainability 09 00111 g001
Figure 2. Annual variations and M-K analysis of precipitation in different sub-areas ((a1,a2), (b1,b2), (c1,c2), (d1,d2) represent Districts I, II, III and IV , respectively).
Sustainability 09 00111 g002
Figure 3. Morlet wavelet real part contour plot of annual precipitation during 1961–2015 ((ad) represent Districts I, II, III and IV, respectively).
Sustainability 09 00111 g003
Figure 4. The isoline of Morlet wavelet module of annual precipitation during 1961–2015 ((ad) represent Districts I, II, III and IV, respectively).
Sustainability 09 00111 g004
Figure 5. Wavelet variance of precipitation sequence at different sub-areas ((ad) represent Districts I, II, III and IV, respectively).
Sustainability 09 00111 g005
Figure 6. Wavelet coefficient process of precipitation at different sub-areas ((ad) represent Districts I, II, III and IV, respectively).
Sustainability 09 00111 g006
Table 1. Annual precipitation decadal anomalies during 1961–2015.
ItemsDistrict I (mm)District II (mm)District III (mm)District IV (mm)
AverageAnomalyAverageAnomalyAverageAnomalyAverageAnomaly
1960s357.219401.533.7439.316.5475.5−11.4
1970s337.6−0.6355.2−12.6441.018.2515.228.3
1980s338.30.1373.05.2416.2−6.6478.2−8.7
1990s381.943.7409.241.4458.735.9508.021.1
2000s273.2−65301.2−66.6349.4−73.4417.9−69
2010s 1341.211.63856437.428518.897
1960–2015337.40369.20422.60483.40
1 Note: 2010s means the year 2010–2015.

