Article

Multi-Criteria Assessment of Spatial Robust Water Resource Vulnerability Using the TOPSIS Method Coupled with Objective and Subjective Weights in the Han River Basin

1
Department of Civil Engineering, Seoul National University of Science and Technology, Seoul 01811, Korea
2
Department of Civil and Environmental Engineering, Yonsei University, Seoul 03722, Korea
3
Department of Civil, Environmental and Plant Engineering, Konkuk University, Seoul 05029, Korea
*
Author to whom correspondence should be addressed.
Sustainability 2017, 9(1), 29; https://doi.org/10.3390/su9010029
Submission received: 9 November 2016 / Revised: 15 December 2016 / Accepted: 21 December 2016 / Published: 27 December 2016
(This article belongs to the Section Environmental Sustainability and Applications)

Abstract

:
This study developed a multi-criteria approach to spatially assess the robust water resource vulnerability in sub-basins and applied it to the Han River basin. The Intergovernmental Panel on Climate Change (IPCC) suggested three factors of vulnerability; namely, exposure, sensitivity and adaptive capacity were used in this study with respect to water quantity and quality. In this study, 16 water quantity indicators and 13 water quality indicators were selected to identify the vulnerability using the Technique for Order of Preference by Similarity to Ideal Solution (TOPSIS) method. Environmental and socioeconomic data were obtained from the national statistics database, and hydrological data were simulated using the calibrated Soil and Water Assessment Tool (SWAT) model. Expert surveys and Shannon entropy method were used to determine subjective and objective weights for all indicators, individually. As a result, water quantity-vulnerable sub-basins were associated with high water use and water leakage ratios. Water quality-vulnerable sub-basins were associated with relatively high values of maximum consecutive dry days and heatwave days. The water quantity indices of both weighting methods showed relatively similar spatial distributions, while the distribution of water quality indices was distinct. These results suggest that considering different weighting methods is important for assessing the robust water resource vulnerability of sub-basins.

1. Introduction

The Han River basin in South Korea is home to 24 million people and includes the densely populated Seoul metropolitan area; thus, there is high water usage/demand in the region. The Han River supplies the cities along its course with water for industrial, agricultural and domestic uses. The upper course of the river, which is located in a mountainous region, is used to generate hydroelectric power. As a larger population increases water demands and extreme droughts occur due to climate change, water shortages are expected to diminish the reliability of the water supply. Hence, it is vital for the water supply to be assessed quantitatively to minimize the risk of water scarcity. The water quality of the Han River basin has continued to decline due to the increasing economic activities in the basin, and the alteration of the landscape has an extensive influence on watershed hydrology. Water quality issues not only deteriorate river ecosystems but also threaten public health and socioeconomic sustainability. In that context, the water quality and hydrologic characteristics in the Han River basin play important roles in the spatial dynamics of a range of ecological patterns and processes that are often key components of river health assessments. Therefore, assessing water resource vulnerability in the Han River basin in terms of water quantity/quality is of vital importance for the implementation of efficient water quantity and quality strategies.
However, the national budget to protect the water quantity depletion and mitigate the water quality deterioration is always limited in the study region. Thus, the government has suffered from the severe conflicts among stakeholders including residents, citizens, local governments and central department of governments. In the meantime, many important projects on water quantity and quality have not been decided and had been postponed. So, first of all, the consensus building among all stakeholders should be necessary to prioritize the proper sites or areas through any democratic and systematic procedures. Therefore, many studies [1,2,3,4,5,6] have used vulnerability as a tool to objectively derive the spatial priority of sub-regions for the large study region.
Vulnerability is commonly used to describe a weakness or flaw in a system and its susceptibility to a specific threat or harmful event. Spatial water resource vulnerability, including water quantity and quality issues, has been frequently assessed in various quantitative manners [7,8,9,10,11,12,13]. Vulnerability is a function of the exposure and sensitivity of a system to a climate hazard and the ability to adapt to the effects of the hazard [10,14]. The United Nations International Strategy for Disaster Reduction (UNISDR) defines vulnerability as the conditions determined by physical, social, economic and environmental factors or processes that increase the susceptibility of a community to the impact of hazards [11], whereas the Intergovernmental Panel on Climate Change (IPCC) defined vulnerability as a function of the character, magnitude and rate of climate variation to which a system is exposed, its sensitivity and its adaptive capacity [8]. We use the IPCC definition of vulnerability in this study.
Nevertheless, “vulnerability” means different things to different researchers. From a water resource perspective, vulnerability has been defined as “the characteristics of a water resource system’s weaknesses and flaws that make the system difficult to function in the face of socioeconomic and environmental change” [15,16]. Hence, the assessment of water resource vulnerability is a systematic and analytical process used to evaluate the sensitivity of a water resource system to potential threats and identify challenges in mitigating the risks associated with negative impacts [17,18,19]. Furthermore, a study [20] improved the concept of IPCC vulnerability to comprehensively assess vulnerability of water resources system by integrating severity and potential severity with exposure, sensitivity and adaptive capacity. To assess vulnerability in a quantitative manner, key indicators must be selected to represent vulnerability, and multiple indicators are often aggregated to form a composite index [10], which is often used to assess human and environmental security and vulnerability to various hazards, as embodied in various well-known national-level indices such as the Human Development Index [21]. However, there are limited vulnerability studies that use any objective methods for the derivation of weights to vulnerability indicators.
Therefore, this study developed an indicator-based multi-criteria approach to assess water resource vulnerability in sub-basins and applied the approach in the Han River basin using the Technique for Order of Preference by Similarity to Ideal Solution (TOPSIS) approach [22]. The integrated vulnerability indices were quantified to identify potential risks and to analyze specific aspects that contribute to overall water resource risks. To determine the weight of each criterion, the Delphi weight [23] and Shannon entropy [24] methods were used to consider various views. Since decision making can best be implemented with a clear knowledge of both quantitative and quality studies, this research demonstrates the necessity of using both subjective and objective weights in terms of water quantity/quality in order to guide or help decision makers in management aspects related to vulnerability of water resources.

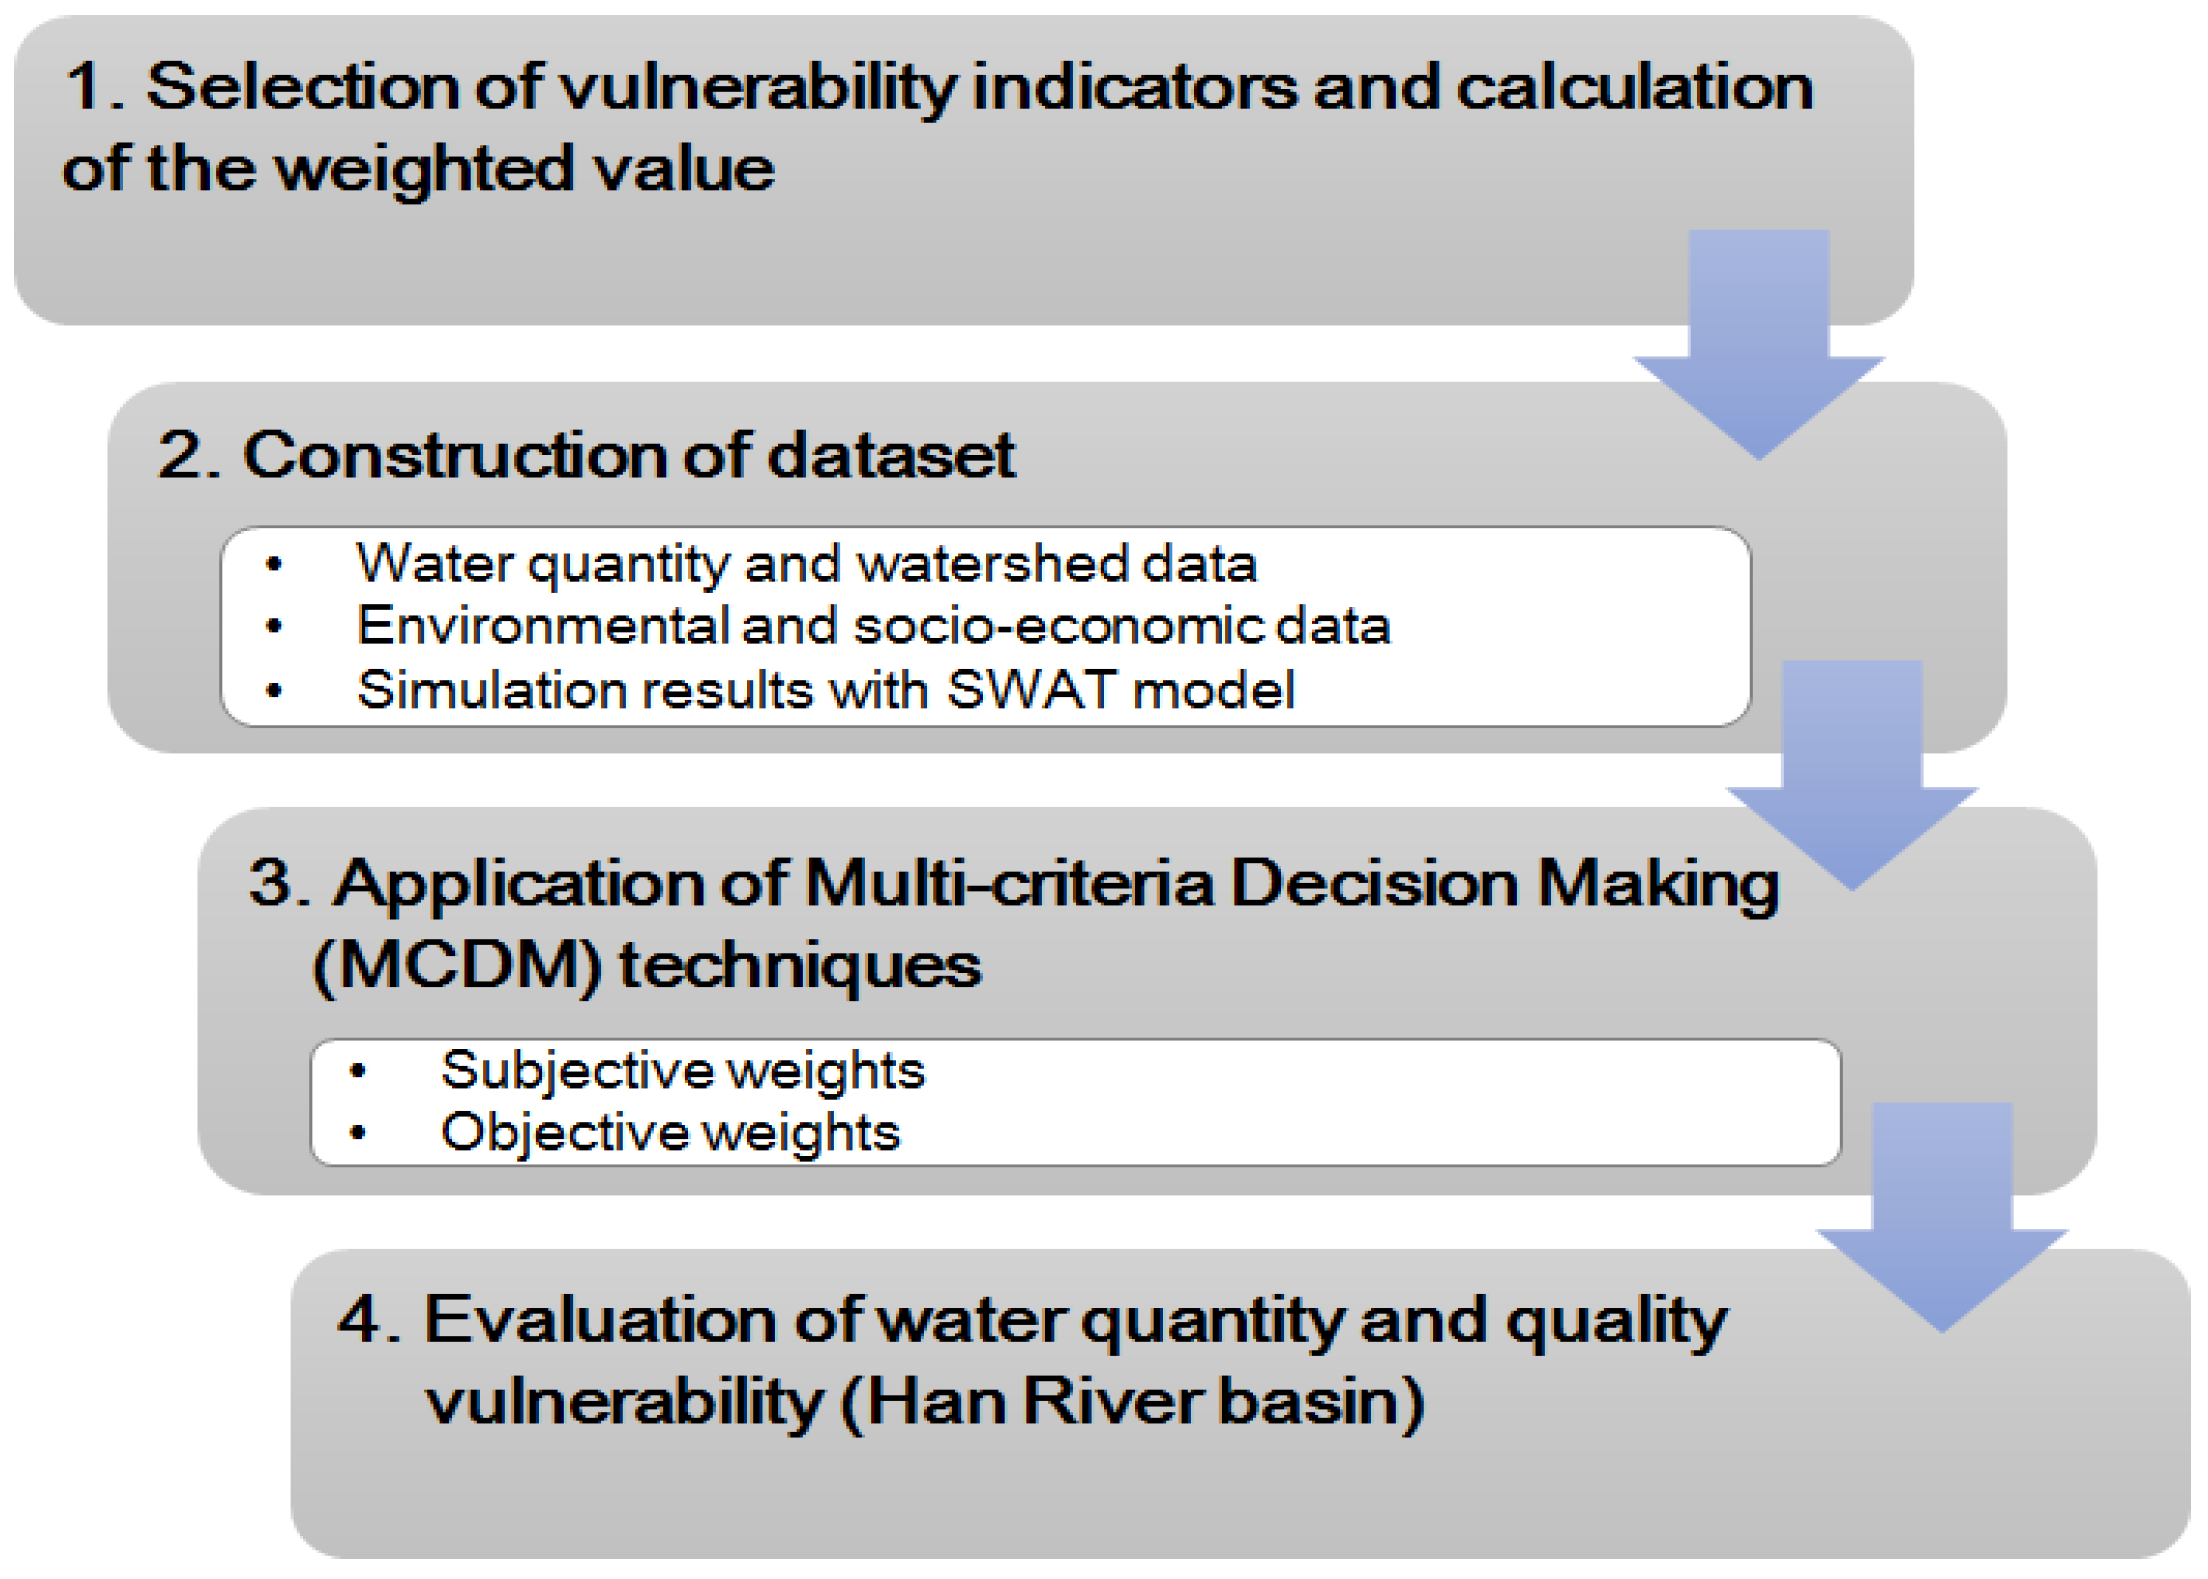
2. Materials and Methods

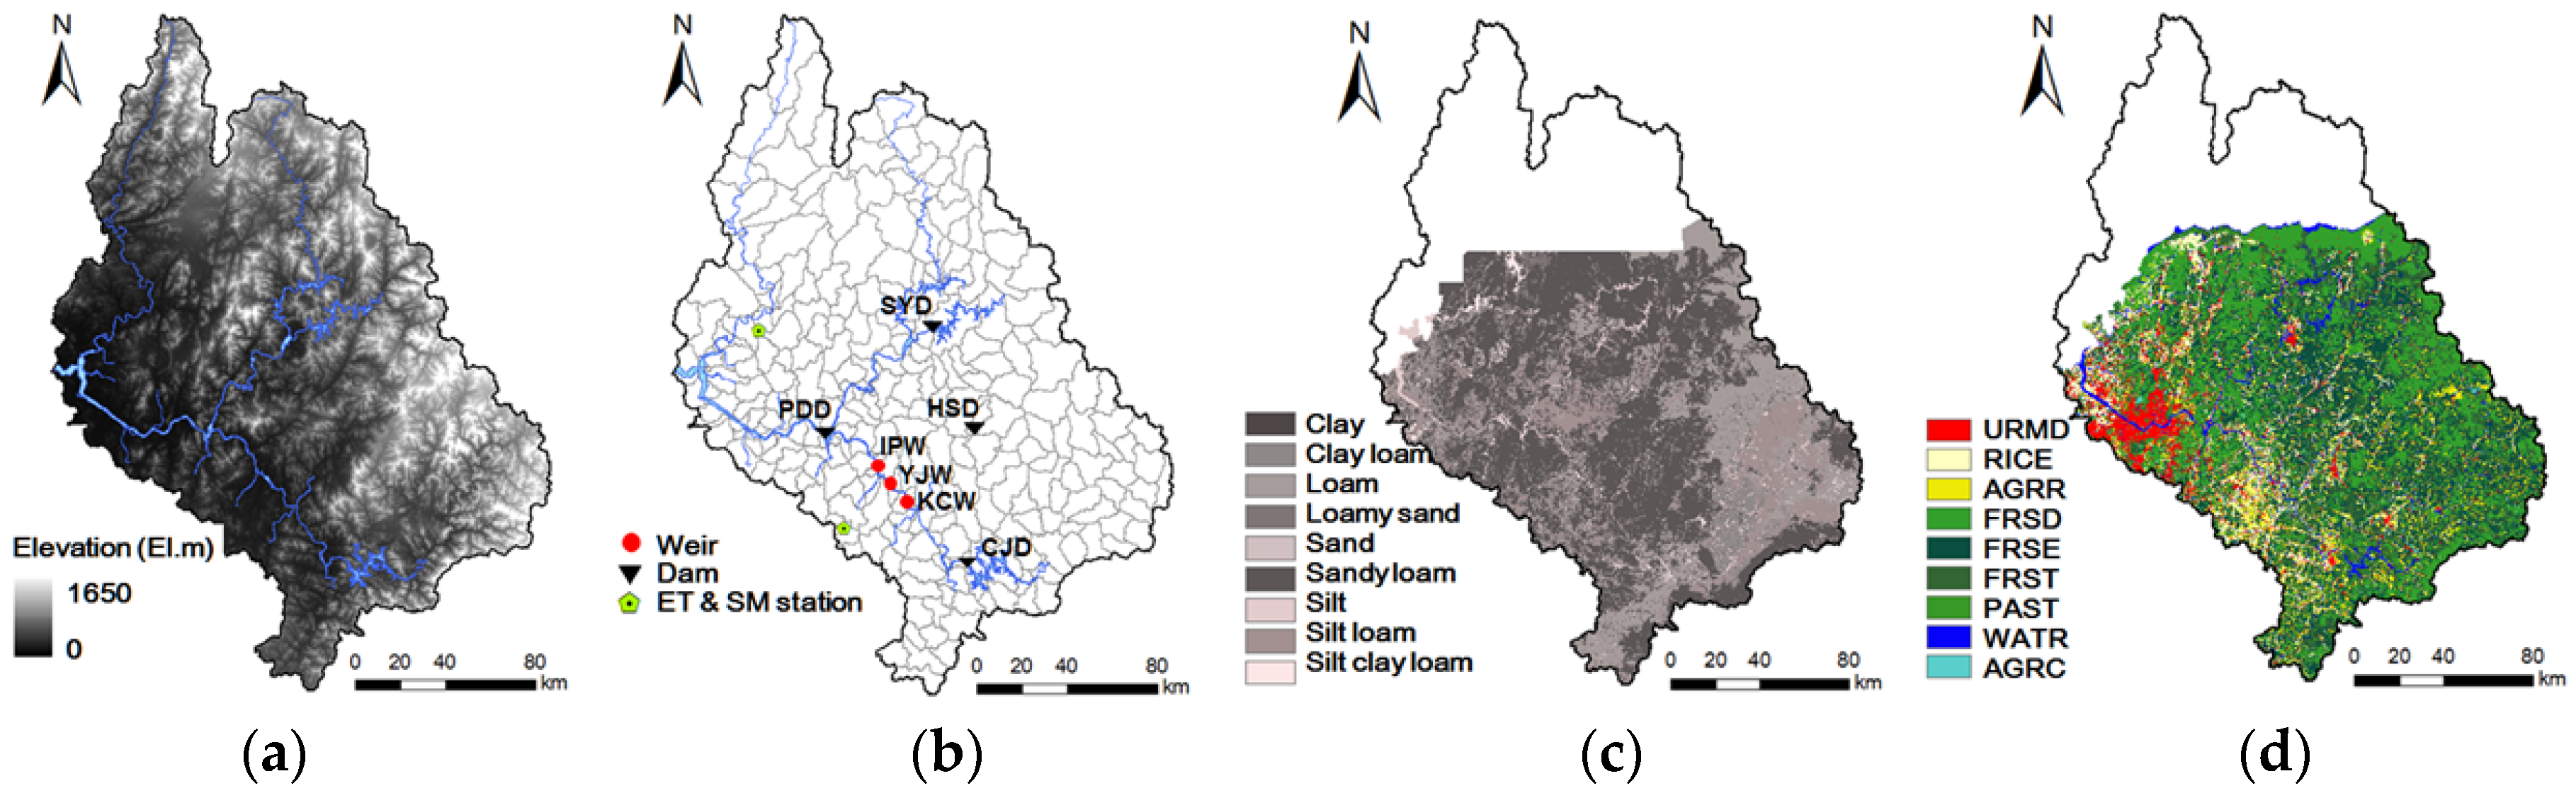
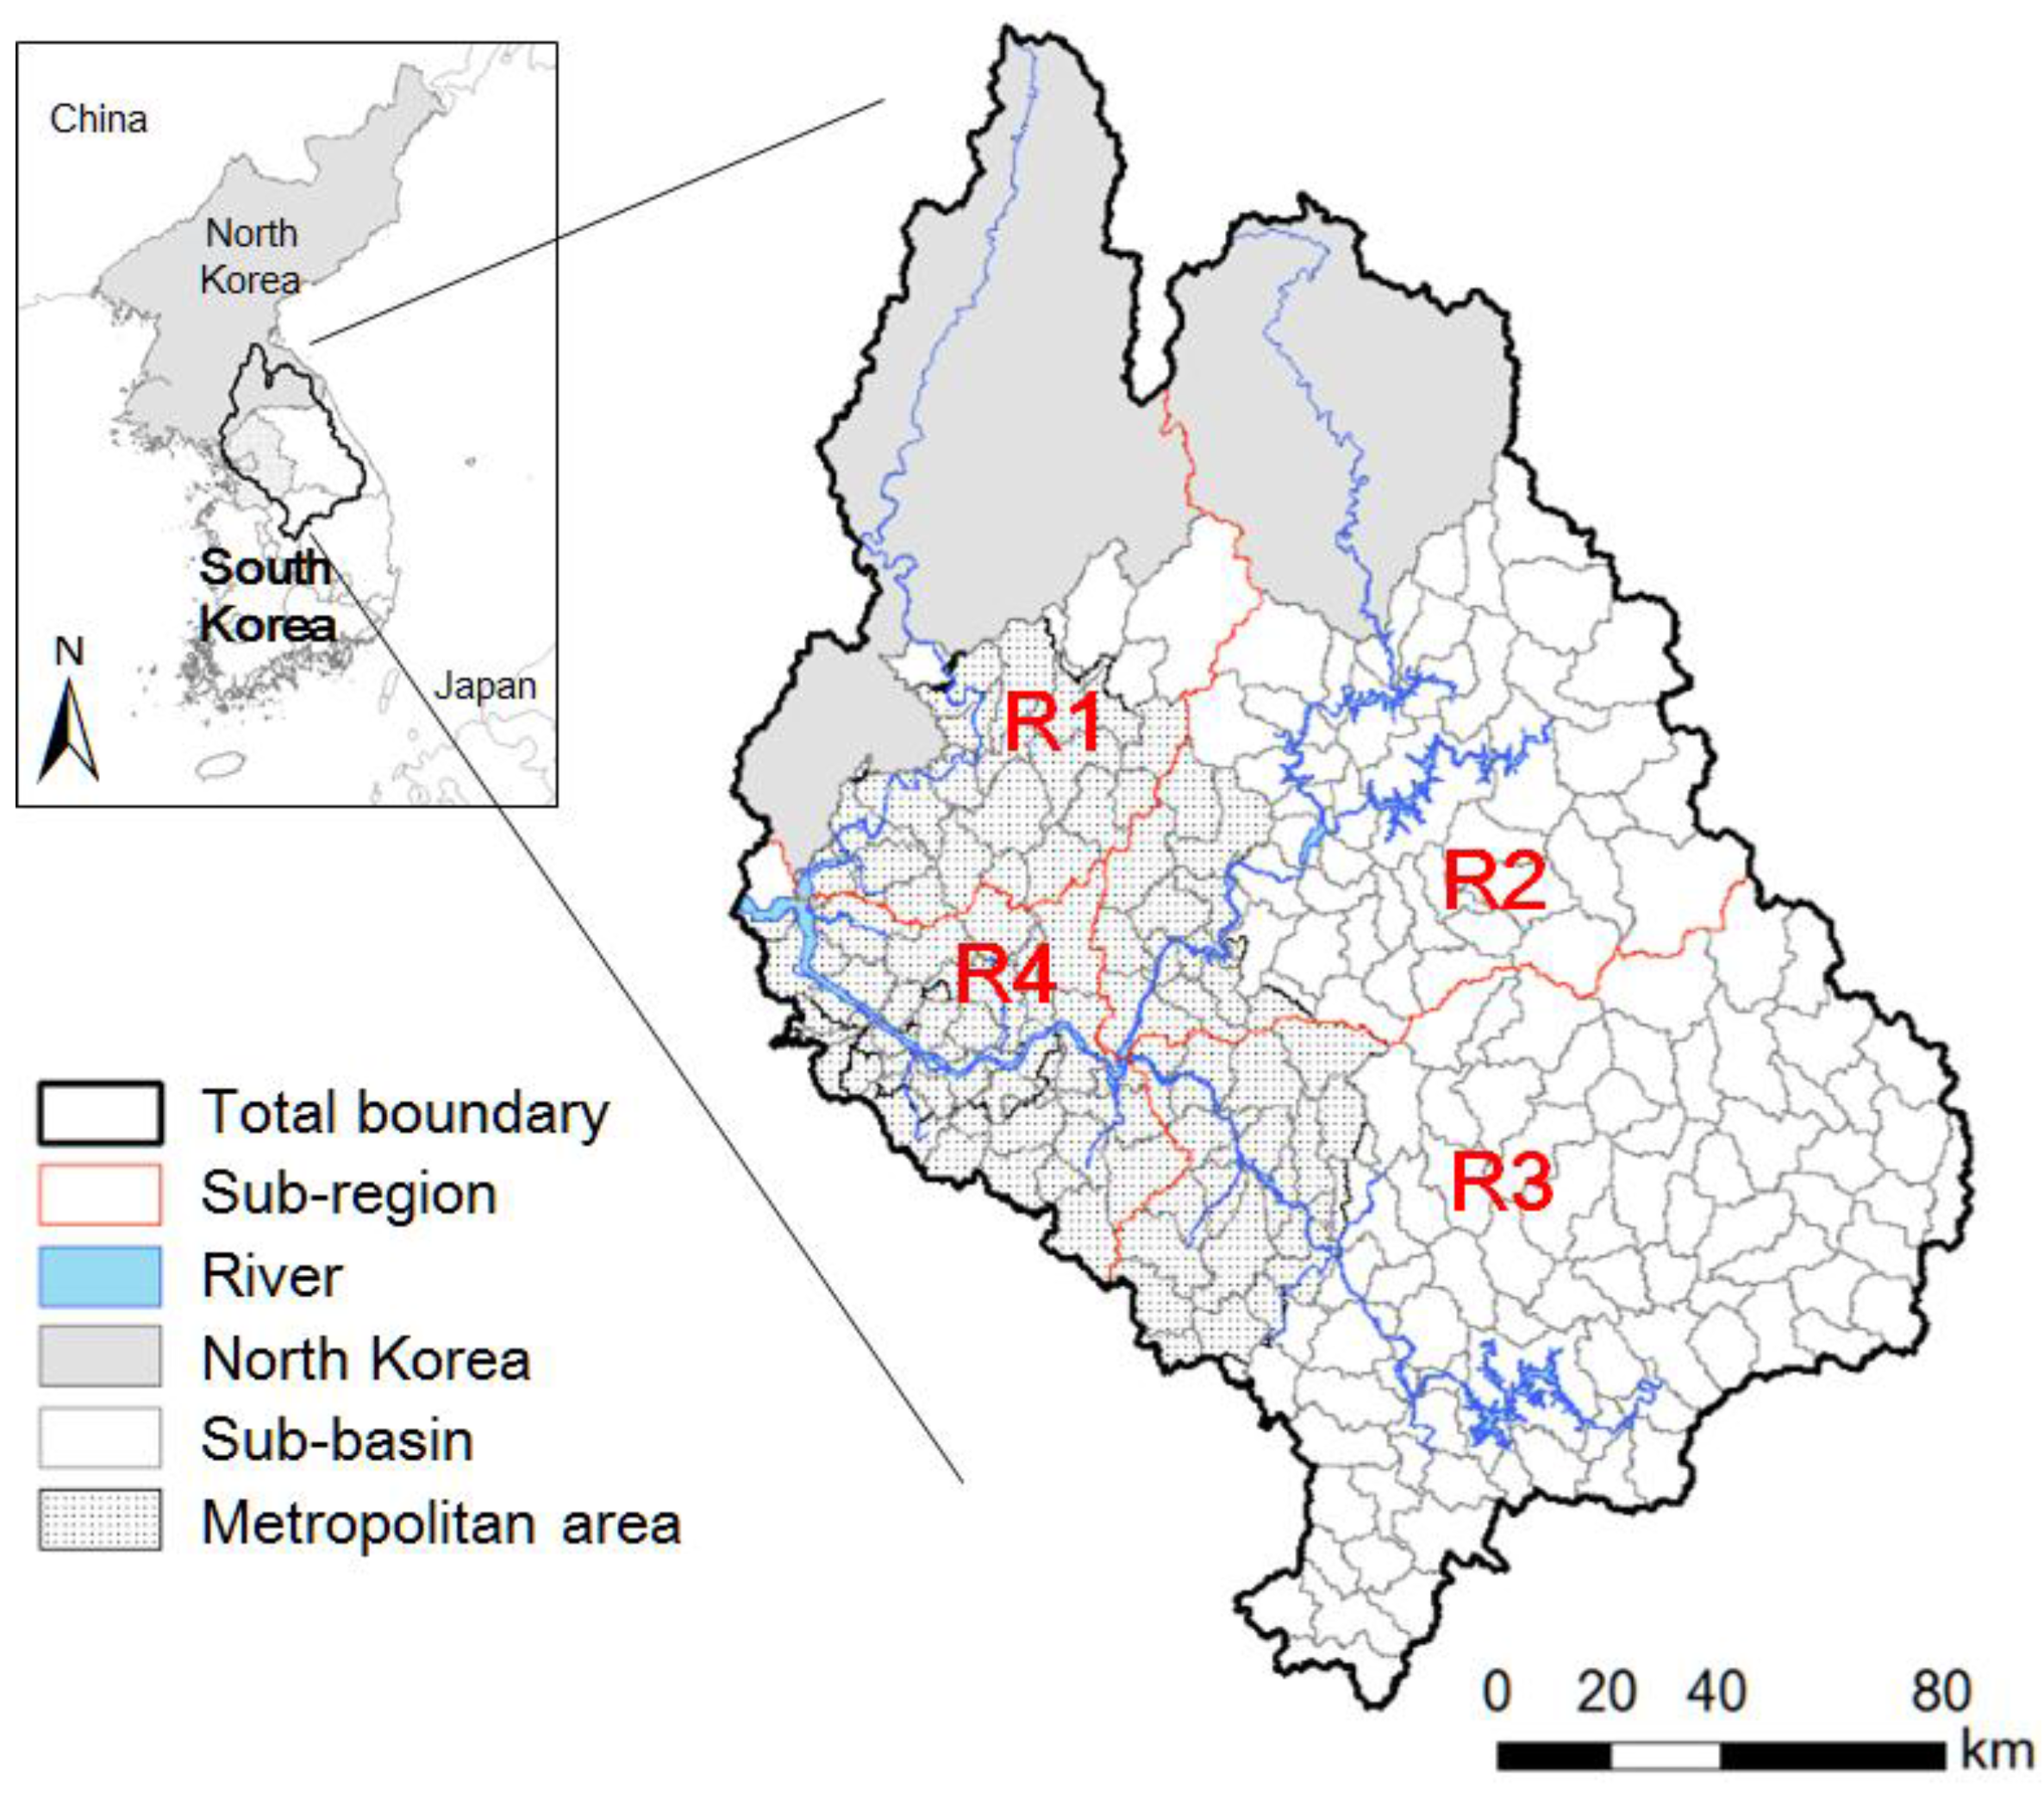
2.1. Description of the Study Area

The Han River basin is the second largest river basin (34,428 km2) in South Korea, occupying approximately a quarter of the country. It is located in the middle of the Korean peninsula at 36°03′–38°55′ N and 126°24′–129°02′ E and includes part of North Korea (Figure 1). The basin consists of two metropolitan cities (Seoul and Incheon) and four provinces (Gyeonggi-do, Gangwon-do, Chungcheongbuk-do and Gyeongsangbuk-do). As shown in Figure 1, the Han River basin was divided into four sub-regions: Imjin River (R1), North Han River (R2), South Han River (R3) and Han River (R4). This study identified 237 unit sub-basins across the Han River basin. Because the northern part of the Han River basin is located in North Korea, where socioeconomic data are not available, 205 of these unit sub-basins were analyzed with the proposed indicators, which will be detailed in the next section.

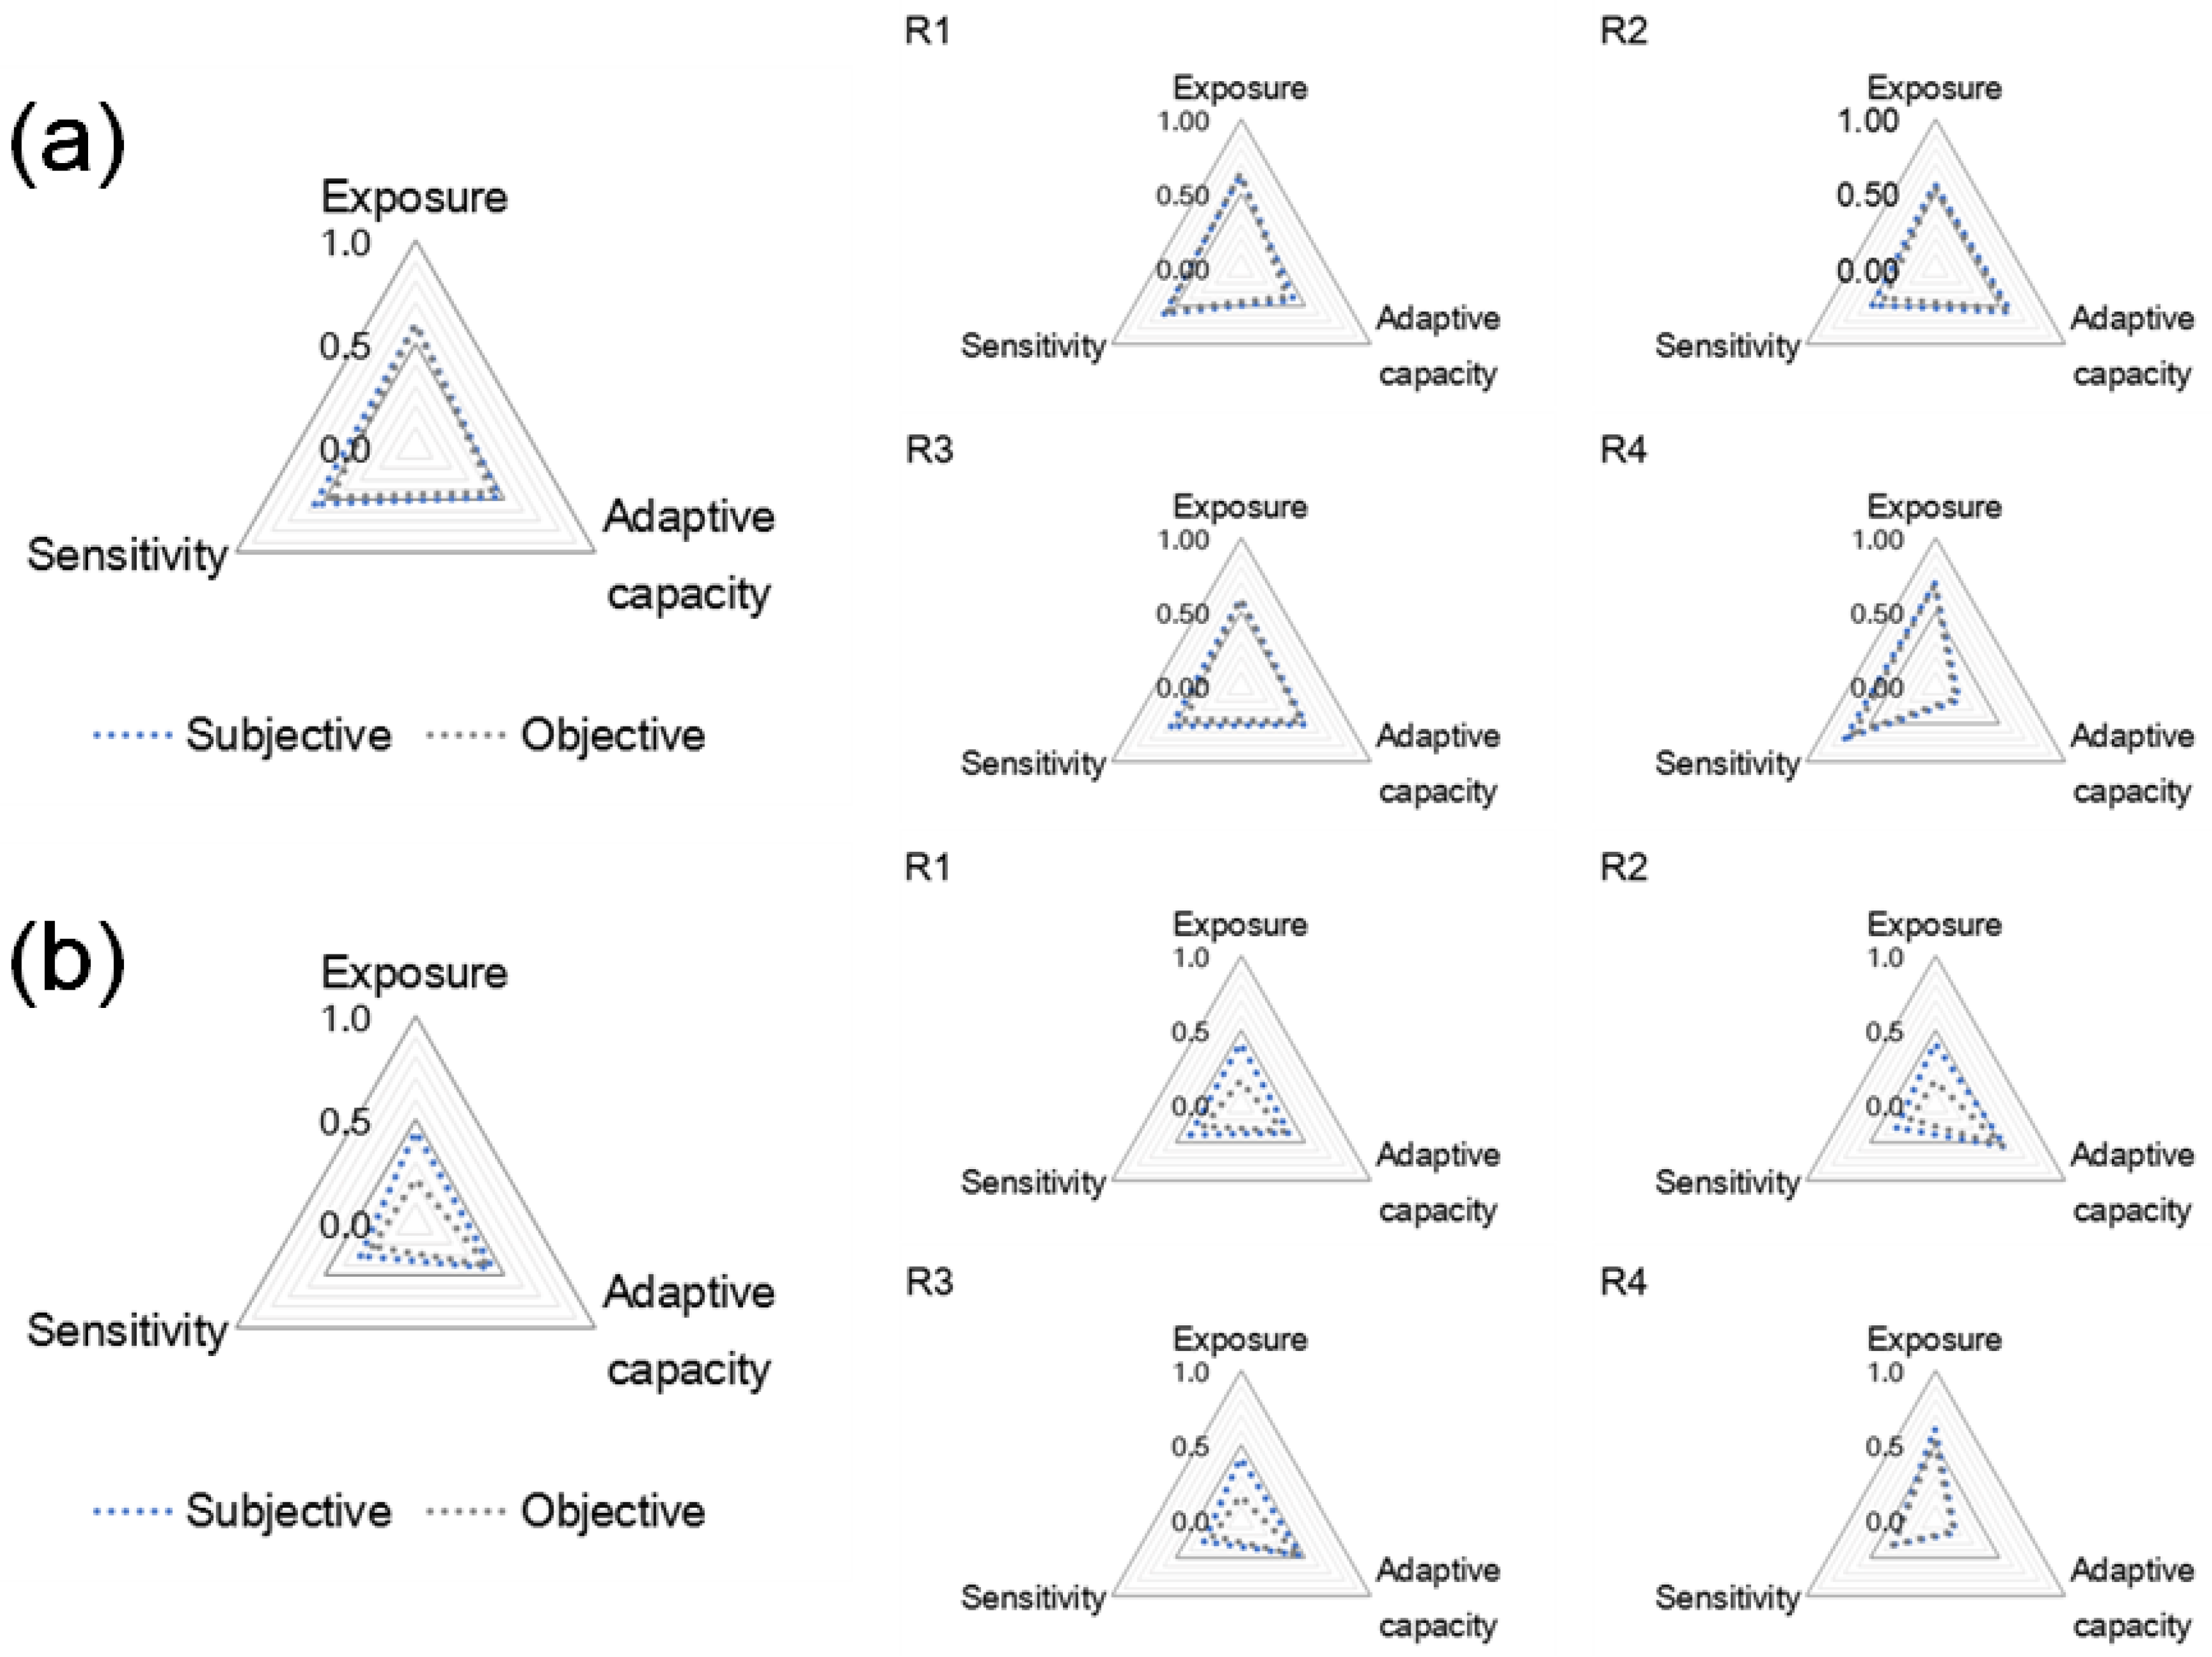
2.2. Indicator-Based Vulnerability Framework

This study used the IPCC-based vulnerability framework proposed in [25]. It suggests that the vulnerability of any system at any scale reflects the exposure and sensitivity of that system to hazardous conditions and the ability, capacity or resilience of the system to cope, adapt or recover from the effects of those conditions. Differently from previous studies, this paper defines the exposure not only from climate change and variability perspectives but also from environmental exposure such as pollution sources for water quality. Exposure, sensitivity and adaptive capacity are briefly explained below.
  • Exposure (E)—The anticipated frequency, magnitude and duration of potentially harmful events is referred to as exposure. Since exposure generally only accounts for those risks that can be quantified using probabilistic statistics, this concept introduces the prospect of overestimating certainty in vulnerability assessments.
  • Sensitivity (S)—Assuming a constant level of exposure, the vulnerability of a system may increase or decrease with changes to the internal conditions. Such internal threshold changes represent a capacity to cope that is referred to as sensitivity.
  • Adaptive capacity (AC)—Adaptive capacity represents the ability of a system to evolve and change to reduce vulnerability, the nature of which depends on the degree to which unsafe conditions have been transformed into harm or disaster by triggers.
Mathematically, vulnerability ( V ) can be defined as follows:
V = α × E + β × S γ × A C ,
where α , β and γ are the weights of E , S and A C , respectively.
To assess climate exposure, sensitivity and the adaptive capacity of a system, key indicators or proxy variables that quantify, measure and communicate relevant information must be identified for use in the assessment or model [26]. These indicators should simplify or summarize a number of important properties rather than focus on the isolated characteristics of the system. Indicators must be measurable, or at least observable, and the methodology used to construct them should be transparent and understandable [27,28].
This study consists of four steps, as shown in Figure 2. Step 1 is to select all available and appropriate vulnerability indicators that objectively describe the hydrologic conditions. Step 2 is to construct all sub-basins datasets for all the indicators. Step 3 is to derive the objective and subjective weighting values using the entropy and Delphi methods, respectively. Step 4 is to quantify the vulnerability of the quantity and quality of water using the TOPSIS method and the combined weighting value sets with objective and subjective values.

2.3. Subjective and Objective Weights

In a typical Multiple-Criteria Decision Making (MCDM) approach, the weights of the criteria reflect their relative importance in the decision-making process, and weighting methods can be grouped into subjective and objective methods [29]. Therefore, two representative weights are used in this study: objective weights from the Shannon entropy method and subjective weights from the Delphi method. Subjective methods determine weights based on the preferences or judgments of the decision makers, whereas objective methods determine weights by solving mathematical models without considering the decision makers’ preferences. It is noted in [30] that objective weighting is particularly applicable if reliable subjective weights cannot be obtained.
In physics, the word “entropy” has important physical implications regarding the level of disorder in a system [24]. The entropy associated with an event is a measurement of the degree of randomness of the event. Entropy has also been used as a measurement of fuzziness. In the entropy-based weighting approach, greater entropy values result in smaller entropy weights, smaller differences in alternatives for a specific criterion, less information provided by a specific criterion and less importance associated with a criterion in the decision-making process. In this study, we use Shannon entropy-based weights [29] in the objective weighting approach. Shannon entropy-based weights are determined using Equations (2)–(4). For the MCDM problem with alternative A i   ( i = 1 ,   ,   m ) and criteria C j   ( j = 1 ,   ,   n ) , the best x i + and worst x i values of all of the criteria functions are determined according to the benefit and cost functions.
Then, the normalized performance can be calculated using Equation (2) [24].
r i j = x i j x i x i + x i
The entropy of the j th criterion is defined as follows:
H j = k i = 1 m f i j ln f i j ,
where f i j = r i j / i = 1 m r i j and k = 1 / ln m . f i j ln f i j = 0 is also assumed when f i j = 0 . The entropy-based weight of the j th criterion can be defined as follows:
W j = 1 H j n j = 1 n H j ,   j = 1 n W j = 1 ,
where 0 W j 1 .

2.4. Technique for Order of Preference by Similarity to Ideal Solution (TOPSIS) Approach

TOPSIS was developed to solve MCDM problems in which preference information is not available. It is based on the concept that the ideal alternative provides the best values for all attributes, whereas the negative ideal is the alternative that includes all of the worst attribute values. The chosen alternative should have the ‘‘shortest distance” from the ideal solution and the ‘‘farthest distance” from the ‘‘negative ideal”. A TOPSIS solution is defined as the alternative that is simultaneously farthest from the negative ideal solution (NIS) and closest to the positive ideal solution (PIS) [22,31].
Given the normalized performance matrix in Equation (4), the weighted normalized value v i j is calculated as follows.
v i j = W j × r i j ,
Then, the weighted normalized matrix V = [ v i j ] m × n is constructed. Next, PIS A + and NIS A are calculated as follows:
A + = ( v 1 + ,   v 2 + ,   ,   v n + )   &   A = ( v 1 ,   v 2 ,   ,   v n ) ,
where v j + = max i   v i j and v j = min i   v i j .
Here, the PIS (NIS) for each criterion is the maximum (minimum) of weighted normalized values regardless of benefit and cost criteria, as they are considered in the normalization process. Then, the Euclidean distances of each alternative from PIS and NIS and the relative closeness R C i of each alternative with respect to PIS are calculated as follows:
d i + = j = 1 n ( v i j v j + ) 2   &   d i = j = 1 n ( v i j v j ) 2
R C i = d i d i + + d i ,
where R C i ranges from 0 to 1. The larger the value is, the better the performance of the alternative.

3. Water Quantity and Quality Simulations with Soil and Water Assessment Tool (SWAT)

The vulnerability assessment requires the indicator data to be simulated with the model, and a detailed selection of indicator data will be presented in Section 4. This study uses the formulated Soil and Water Assessment Tool (SWAT) model for the Han River basin. Because [26] extensively documented model formation, calibration, and validation for the Han River basin, this study briefly summarizes these processes below.

3.1. SWAT Formulation

The SWAT model requires spatial and meteorological data. The spatial data include a Digital Elevation Model (DEM) and land use and soil maps. In this study (Figure 3), the Han River basin was divided into 237 sub-basins and 1987 Hydrologic Response Units (HRUs) based on topography, land use and soil texture. The 90 m Shuttle Radar Topography Mission (SRTM) DEM data are used for topography. A watershed soil map from the Korea Rural Development Administration (RDA) contained texture, depth and drainage attributes. It was rasterized to a 90 m grid size from a 1:25,000 scale vector map. A map of watershed land use from 2008 was obtained from the Korea Ministry of Environment (ME). It included nine classes: coniferous forest, deciduous forest, mixed forest, paddy rice, upland crop, urban, grassland, bare field and water. The dominant land use in the Han River basin is forest (73%), followed by cultivated cropland in fertile lowland areas.
Daily meteorological data over 31 years (from 1984 to 2014) were collected from 19 weather stations operated by the Korea Meteorological Administration (KMA). The meteorological data include daily precipitation, maximum and minimum temperature, relative humidity, wind speed and solar radiation. Furthermore, the calibration and validation processes require hydrologic data such as dam inflow, dam outflow, dam storage, evapotranspiration and soil moisture. We obtained daily dam inflow, outflow and storage volume data for multipurpose dams from 2005 to 2014. We used data from three water level stations (HSD, SYD and CJD) monitored by the Korea Water Resources Corporation and one water level station (PDD) monitored by the Korea Hydro and Nuclear Power Co., Ltd. (Gyeongju, North Gyeongsang, Korea). In addition, we obtained daily dam inflow, outflow and storage volume data measured by three multifunction weirs (KCW, YJW and IPW) from 2012 to 2014. These weirs were monitored by the Korea Water Resources Corporation and used for dam operation.

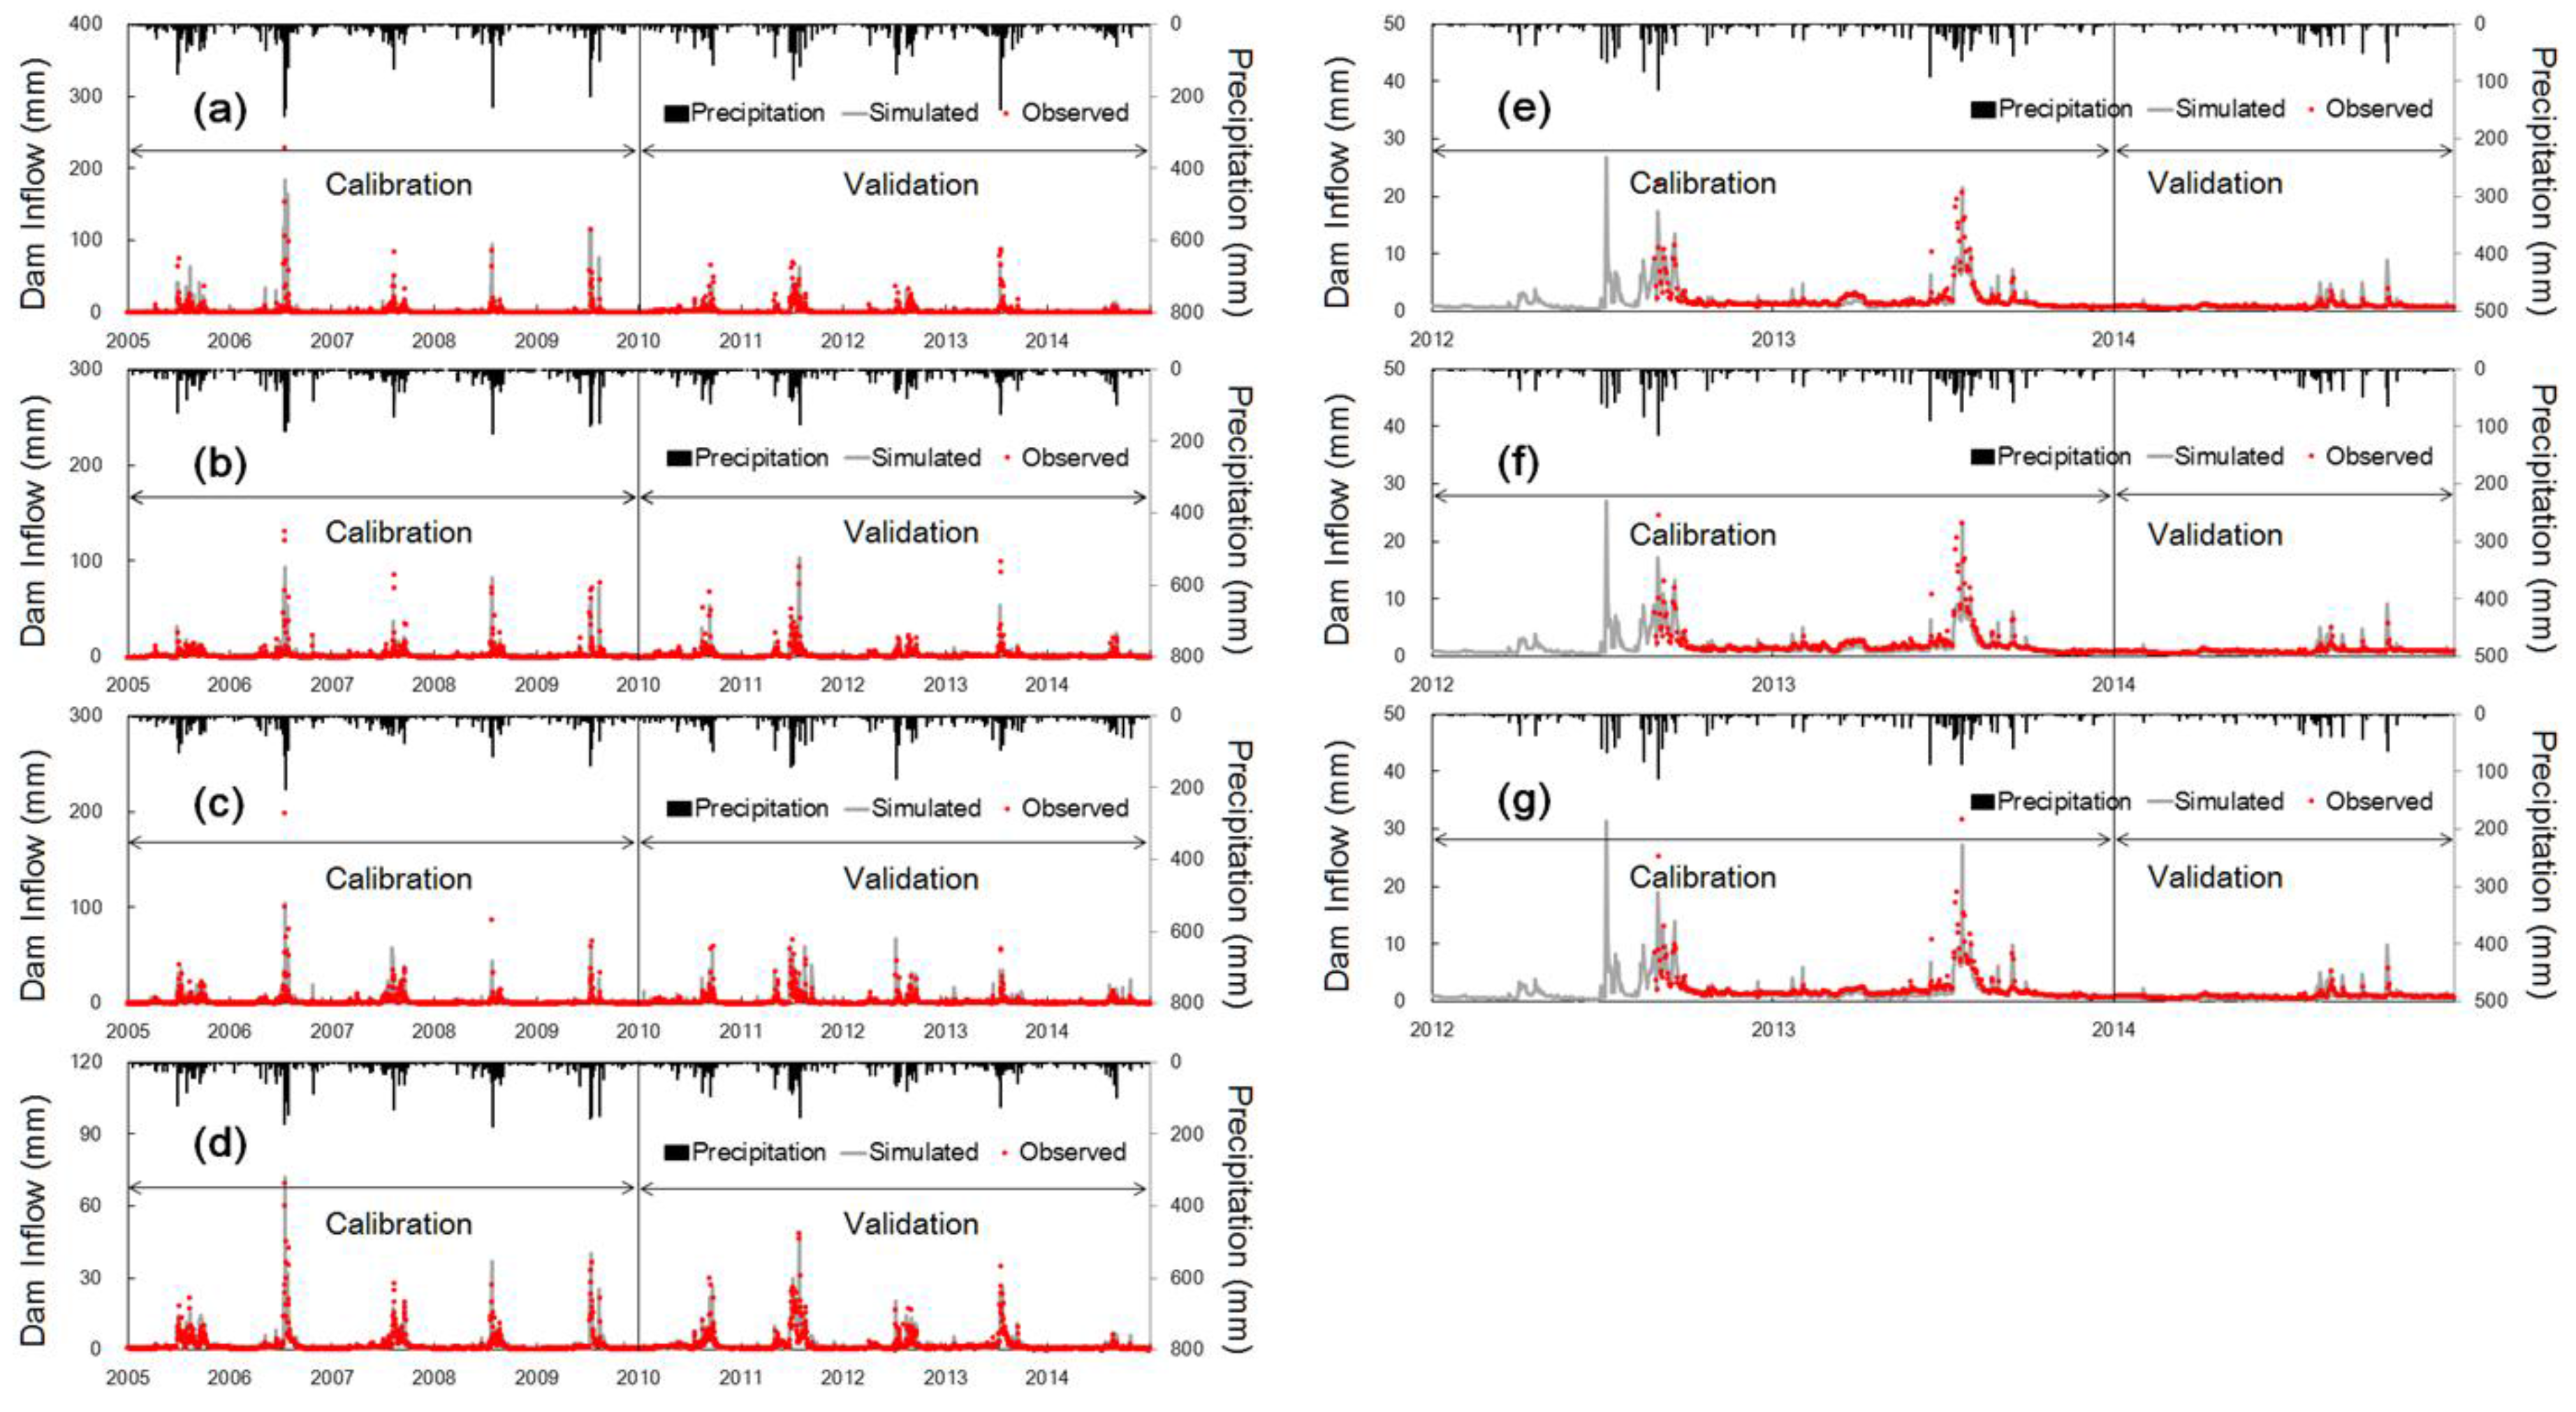
3.2. Calibration and Validation

The SWAT model was calibrated and validated in seven locations (HSD, SYD, CJD, PDD, KCW, YJW and IPW) in the main river reaches. In the calibration, we used daily inflow and storage volume data for the dams and weirs from 2005 to 2009. Then, validation was performed using data from 2010 to 2014.
In addition, the model was spatially calibrated and validated using evapotranspiration, soil moisture and groundwater levels over five years (2009–2013). The dam inflow calibration at seven points was performed for the hydrologic cycle. The parameters are related to runoff, evapotranspiration, soil moisture, interflow, groundwater and reservoir operation processes. These parameters were calibrated by trial and error until sufficient model performance was achieved. And then, 20 of the most influential parameters were selected for calibration (Table 1).
Figure 4 compares the observed and simulated daily dam inflow values at seven locations (HSD, SYD, CJD, PDD, KCW, YJW and IPW) over the ten-year period (2005–2014). The observed and simulated values agreed reasonably well at seven locations. The four multipurpose dams and three multifunction weirs in the main reach of the Han River basin represent not only the significant hydrological controls in the main reach but also major diversions of water resources for agricultural and other activities. Therefore, optimizing the SWAT model for accurate prediction of the storage volume of dams and weirs is important.
Two performance measures were used to evaluate how well the optimized parameters fit observations based on the Nash-Sutcliffe coefficient (NSE) [33] and coefficient of determination (R2). NSE and R2 values can range from 0 to 1, where 0 indicates no correspondence and 1 corresponds to a perfect match between the simulations and observations. Reference [34] suggested that model performance can be evaluated as “satisfactory” if NSE > 0.50. The average NSE values for the calibration (2005–2009) and validation (2010–2014) periods were 0.59 at HSD, 0.78 at SYD, 0.61 at CJD, 0.80 at PDD, 0.79 at KCW, 0.77 at YJW and 0.88 at IPW. The statistical results associated with the daily dam inflow and storage volume for model calibration and validation are summarized in Table 2.

4. Results

4.1. Selection of Vulnerability Indicators

In this step, the key indicators of two sectors of water resources, i.e., water quantity and water quality, are identified based on the IPCC vulnerability concept. After a series of discussions with researchers and civil servants, 16 key indicators of water quantity and 13 water quality indicators were identified to quantify the vulnerability. Because these indicators were not determined objectively, they were screened by a group of 16 experts, including hydrologists, water resource managers and climate change experts.
For water quantity, the 16 key indicators were included, as shown in Table 3. For climate and environmental exposure, effective precipitation, i.e., precipitation, actually added and stored in the soil, simulated using the SWAT model was chosen to represent seasonal variations in water availability in winter and spring (dry season in South Korea). Furthermore, the percentages of cropland and impervious surface were selected to represent the stresses on the sub-basin environments with higher runoff. For sensitivity, indicators that influenced the probability of damages due to water supply limitations were chosen, and for adaptive capacity, indicators representing the socioeconomic capacity to cope with damages associated with water supply issues were selected. Indicators such as the financial independence of the local government from the national government, number of civil servants for water management, gross regional domestic product (GRDP) and the number of civil servants related to water resources and the environment were used to represent the adaptive capacity of the water resource systems.
For water quality, 13 key indicators were considered, as shown in Table 4. The indicators for climate and environmental exposure include climate-related indicators such as consecutive dry days and heatwave days, as well as pollution-related indicators such as nitrogen and phosphorus loadings. Here, climate-related indicators were chosen, as environmental phenomena such as heatwaves and droughts can potentially cause water quality problems. For sensitivity, the indicators were related to the probability of water quality deterioration and mainly included indicators representing the pollutant sources and transport. Except for the forest area ratio, all proxies for sensitivity were positively related to vulnerability. The forested areas generally minimized surface runoff, soil erosion and sediment transport and exhibited the highest resilience to climate change and variability. For adaptive capacity, the indicators include indicators related to the socioeconomic aspects of coping with water quality problems, such as the waterworks distribution ratio.

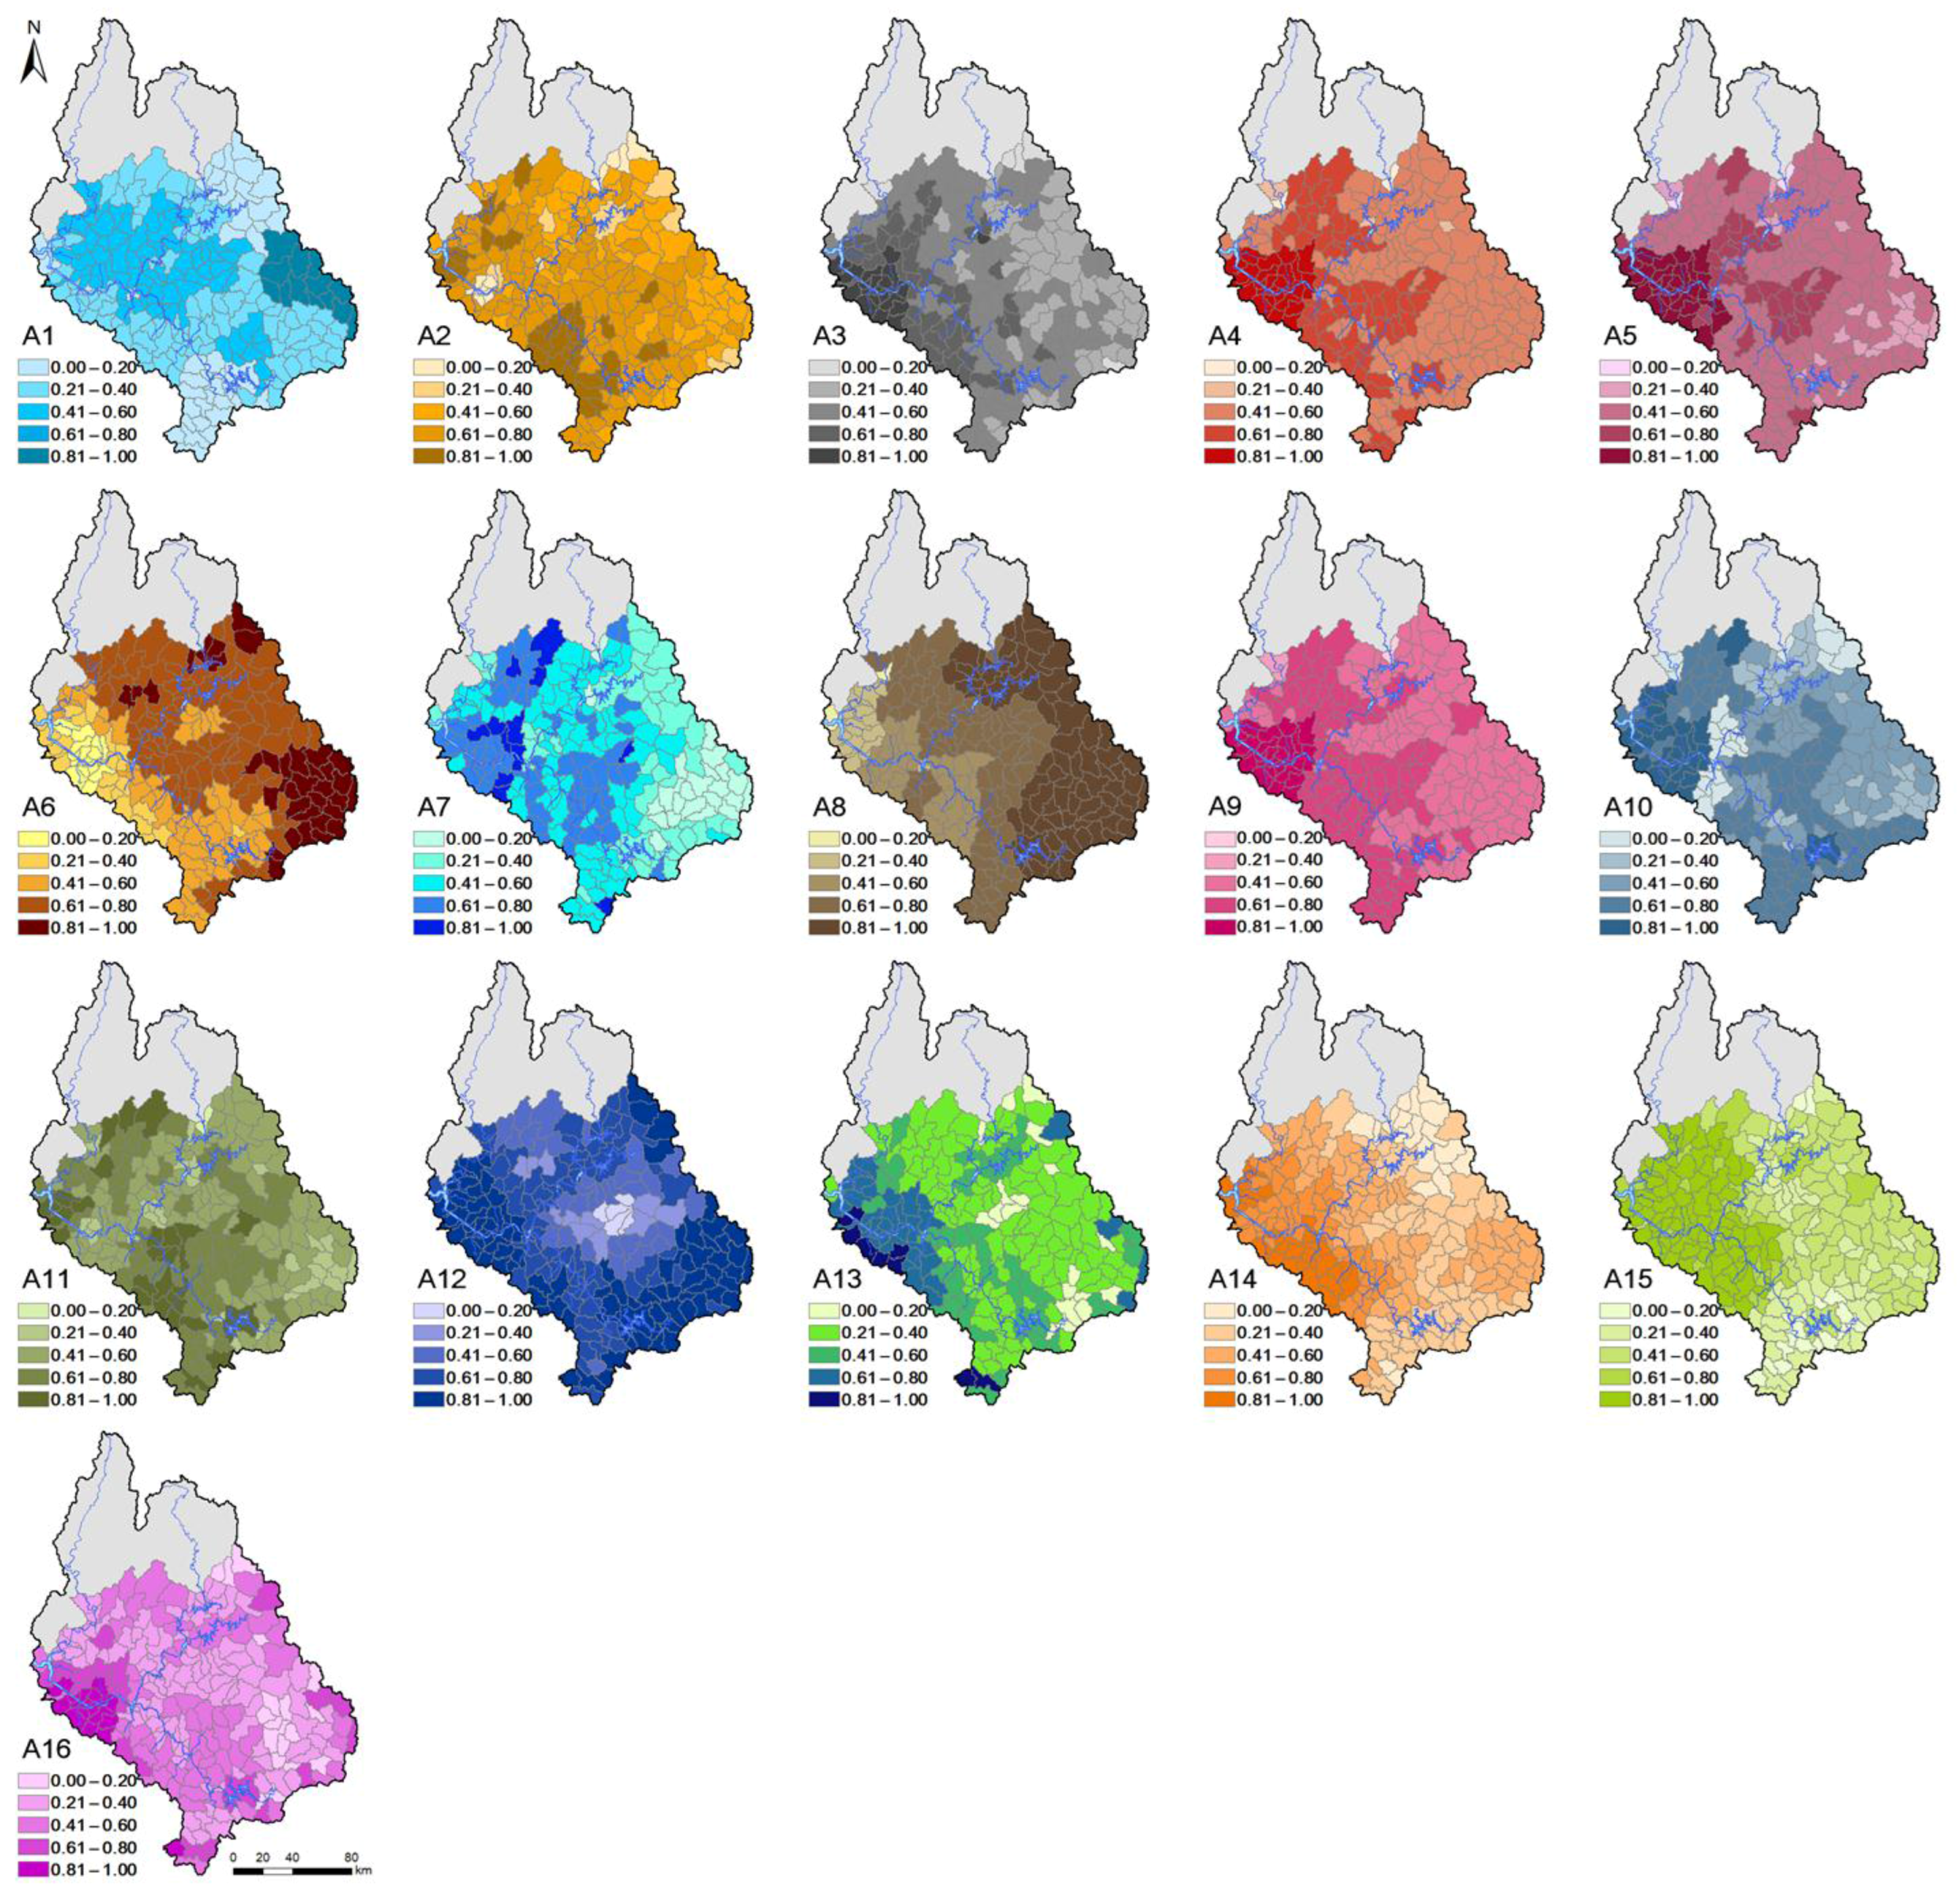
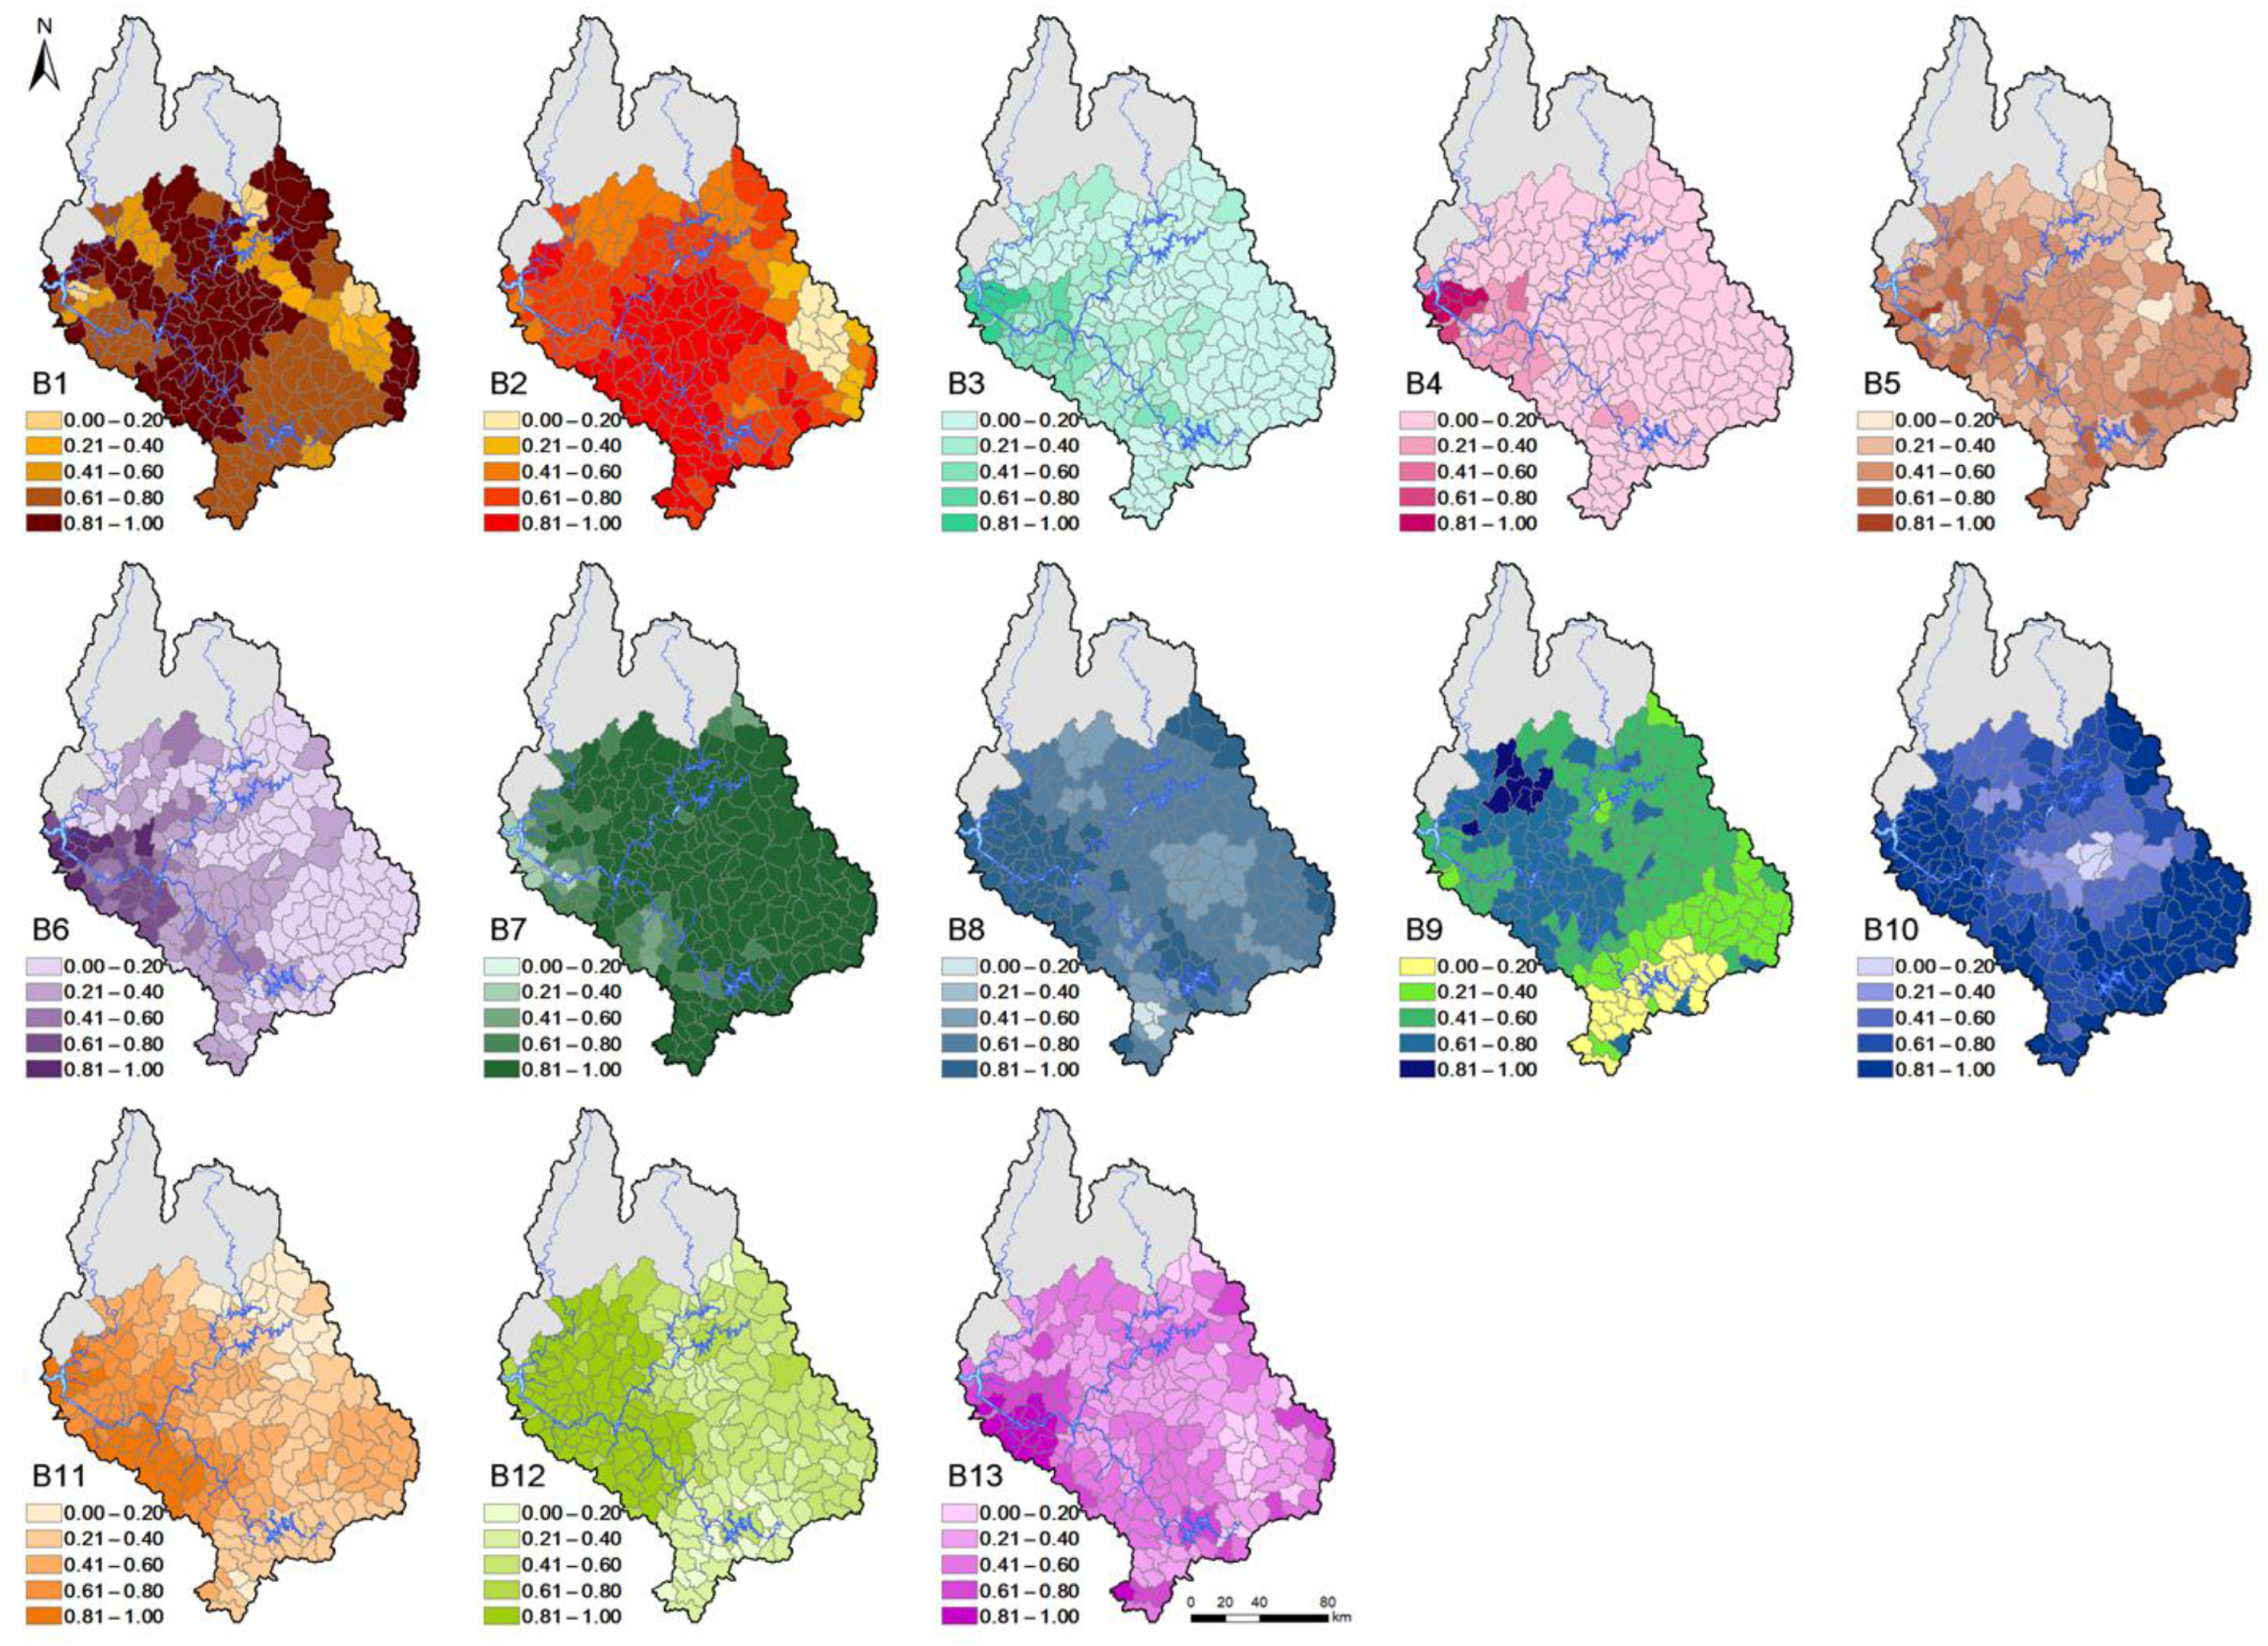
4.2. Collection and Standardization of Indicator Data

The indicators identified in Section 4.1 were collected from various sources, as shown in Table 3 and Table 4. The indicators of social and economic factors were based on statistical data from country reports at administrative district scale. As introduced in Section 3, the hydrologic data such as runoff and water quality were obtained from the SWAT simulation results.
The values of the selected indicators cannot be directly compared because of their different units. Therefore, values of indicators were individually normalized, as shown in Figure 5 and Figure 6. According to their distributions, the raw data were logarithmically transformed. Then we performed min-max normalization for each indicator. The lists of log-transformed indicators are shown in Table 3 and Table 4. The vulnerability was calculated according to standardized indicators based on the maximum vulnerability (1.0).
For quantity indicators, total population and water use were concentrated in the metropolitan area. Additionally, the waterworks distribution rate for the entire watershed was generally high, but the water leakage ratio was high in mountainous areas (Figure 5). For the water quality, total watershed except the mountainous area had high value of consecutive dry days and heatwave days. Moreover, the pollutants are the cause of major water quality degradation, and the pollutant loads were higher at downstream than upstream (Figure 6).

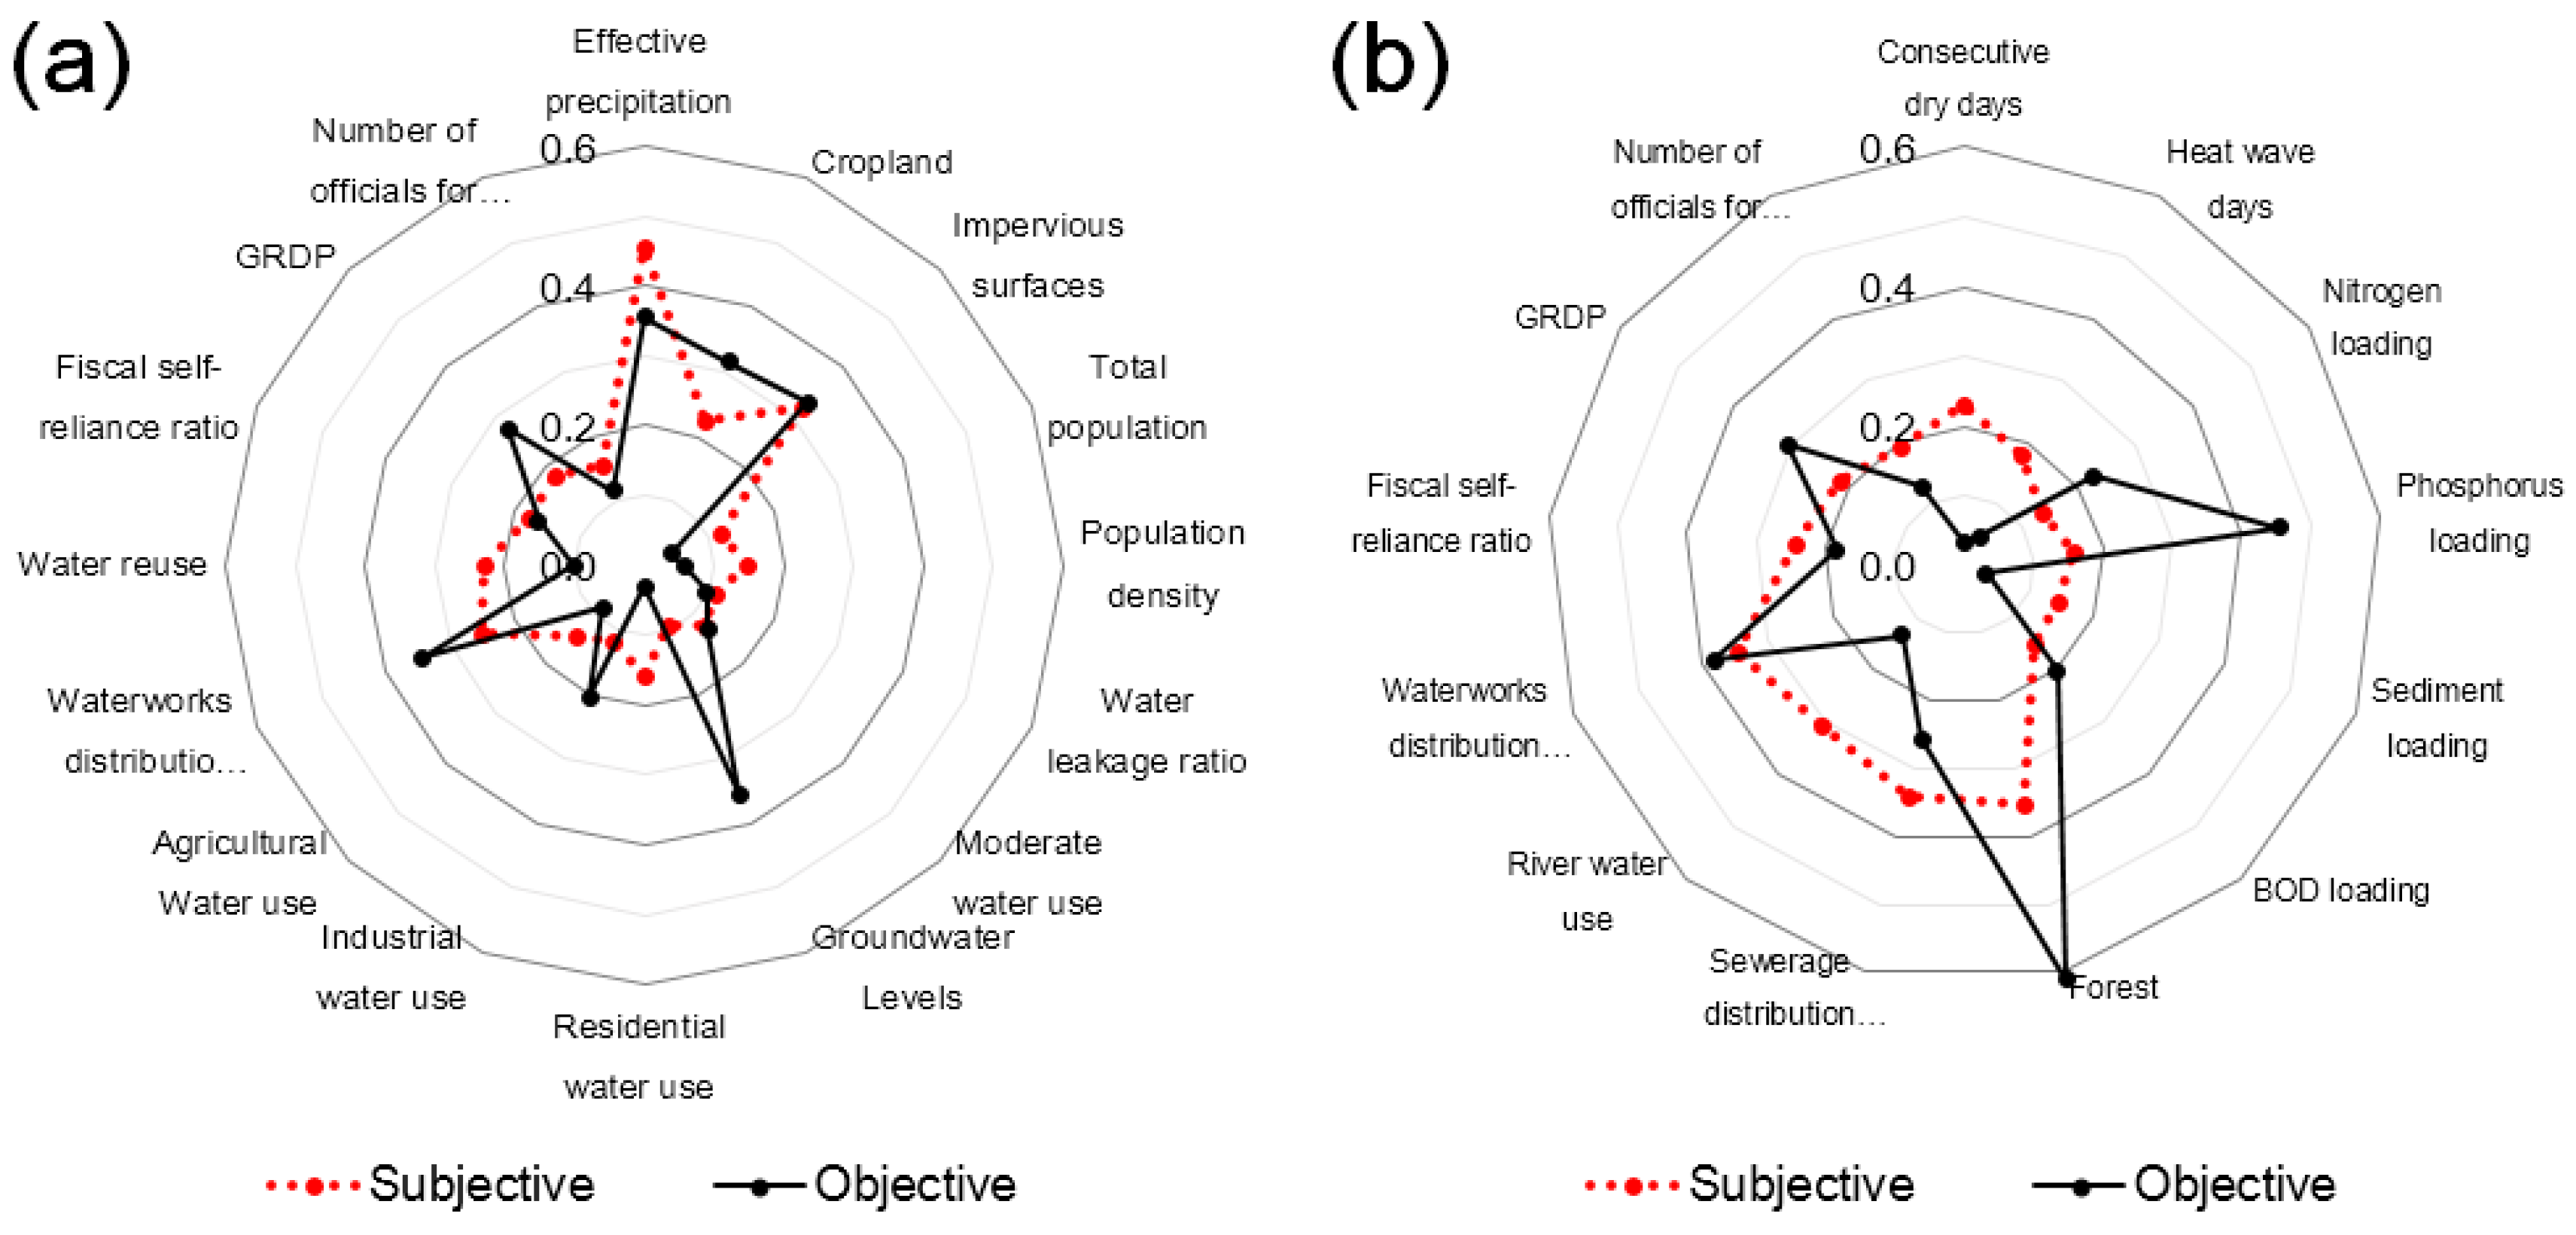
4.3. Derivation of Objective and Subjective Weights

The weighting factors for key indicators and vulnerability components were determined using two approaches: expert survey and entropy-based estimation of subjective and objective weights. For the subjective weights, we conducted expert surveys and estimated the average weight of each indicator (Figure 7). The distributions of weights for each indicator show variable patterns; in some cases, weights are distributed around the mode, but in other cases, weights are divided into two extremes. Many experts noted the importance of effective precipitation to the water quantity and the forest ratio to the water quality.
For the objective weights, the Shannon entropy-based method was employed to estimate the weights using the indicator data and no expert opinions. Based on the entropy concept, all indicators of exposure and groundwater level were found to be relatively important factors for water quantity vulnerability. For water quality vulnerability, the percentage of forest and phosphorus loading were determined to be relatively important proxies.

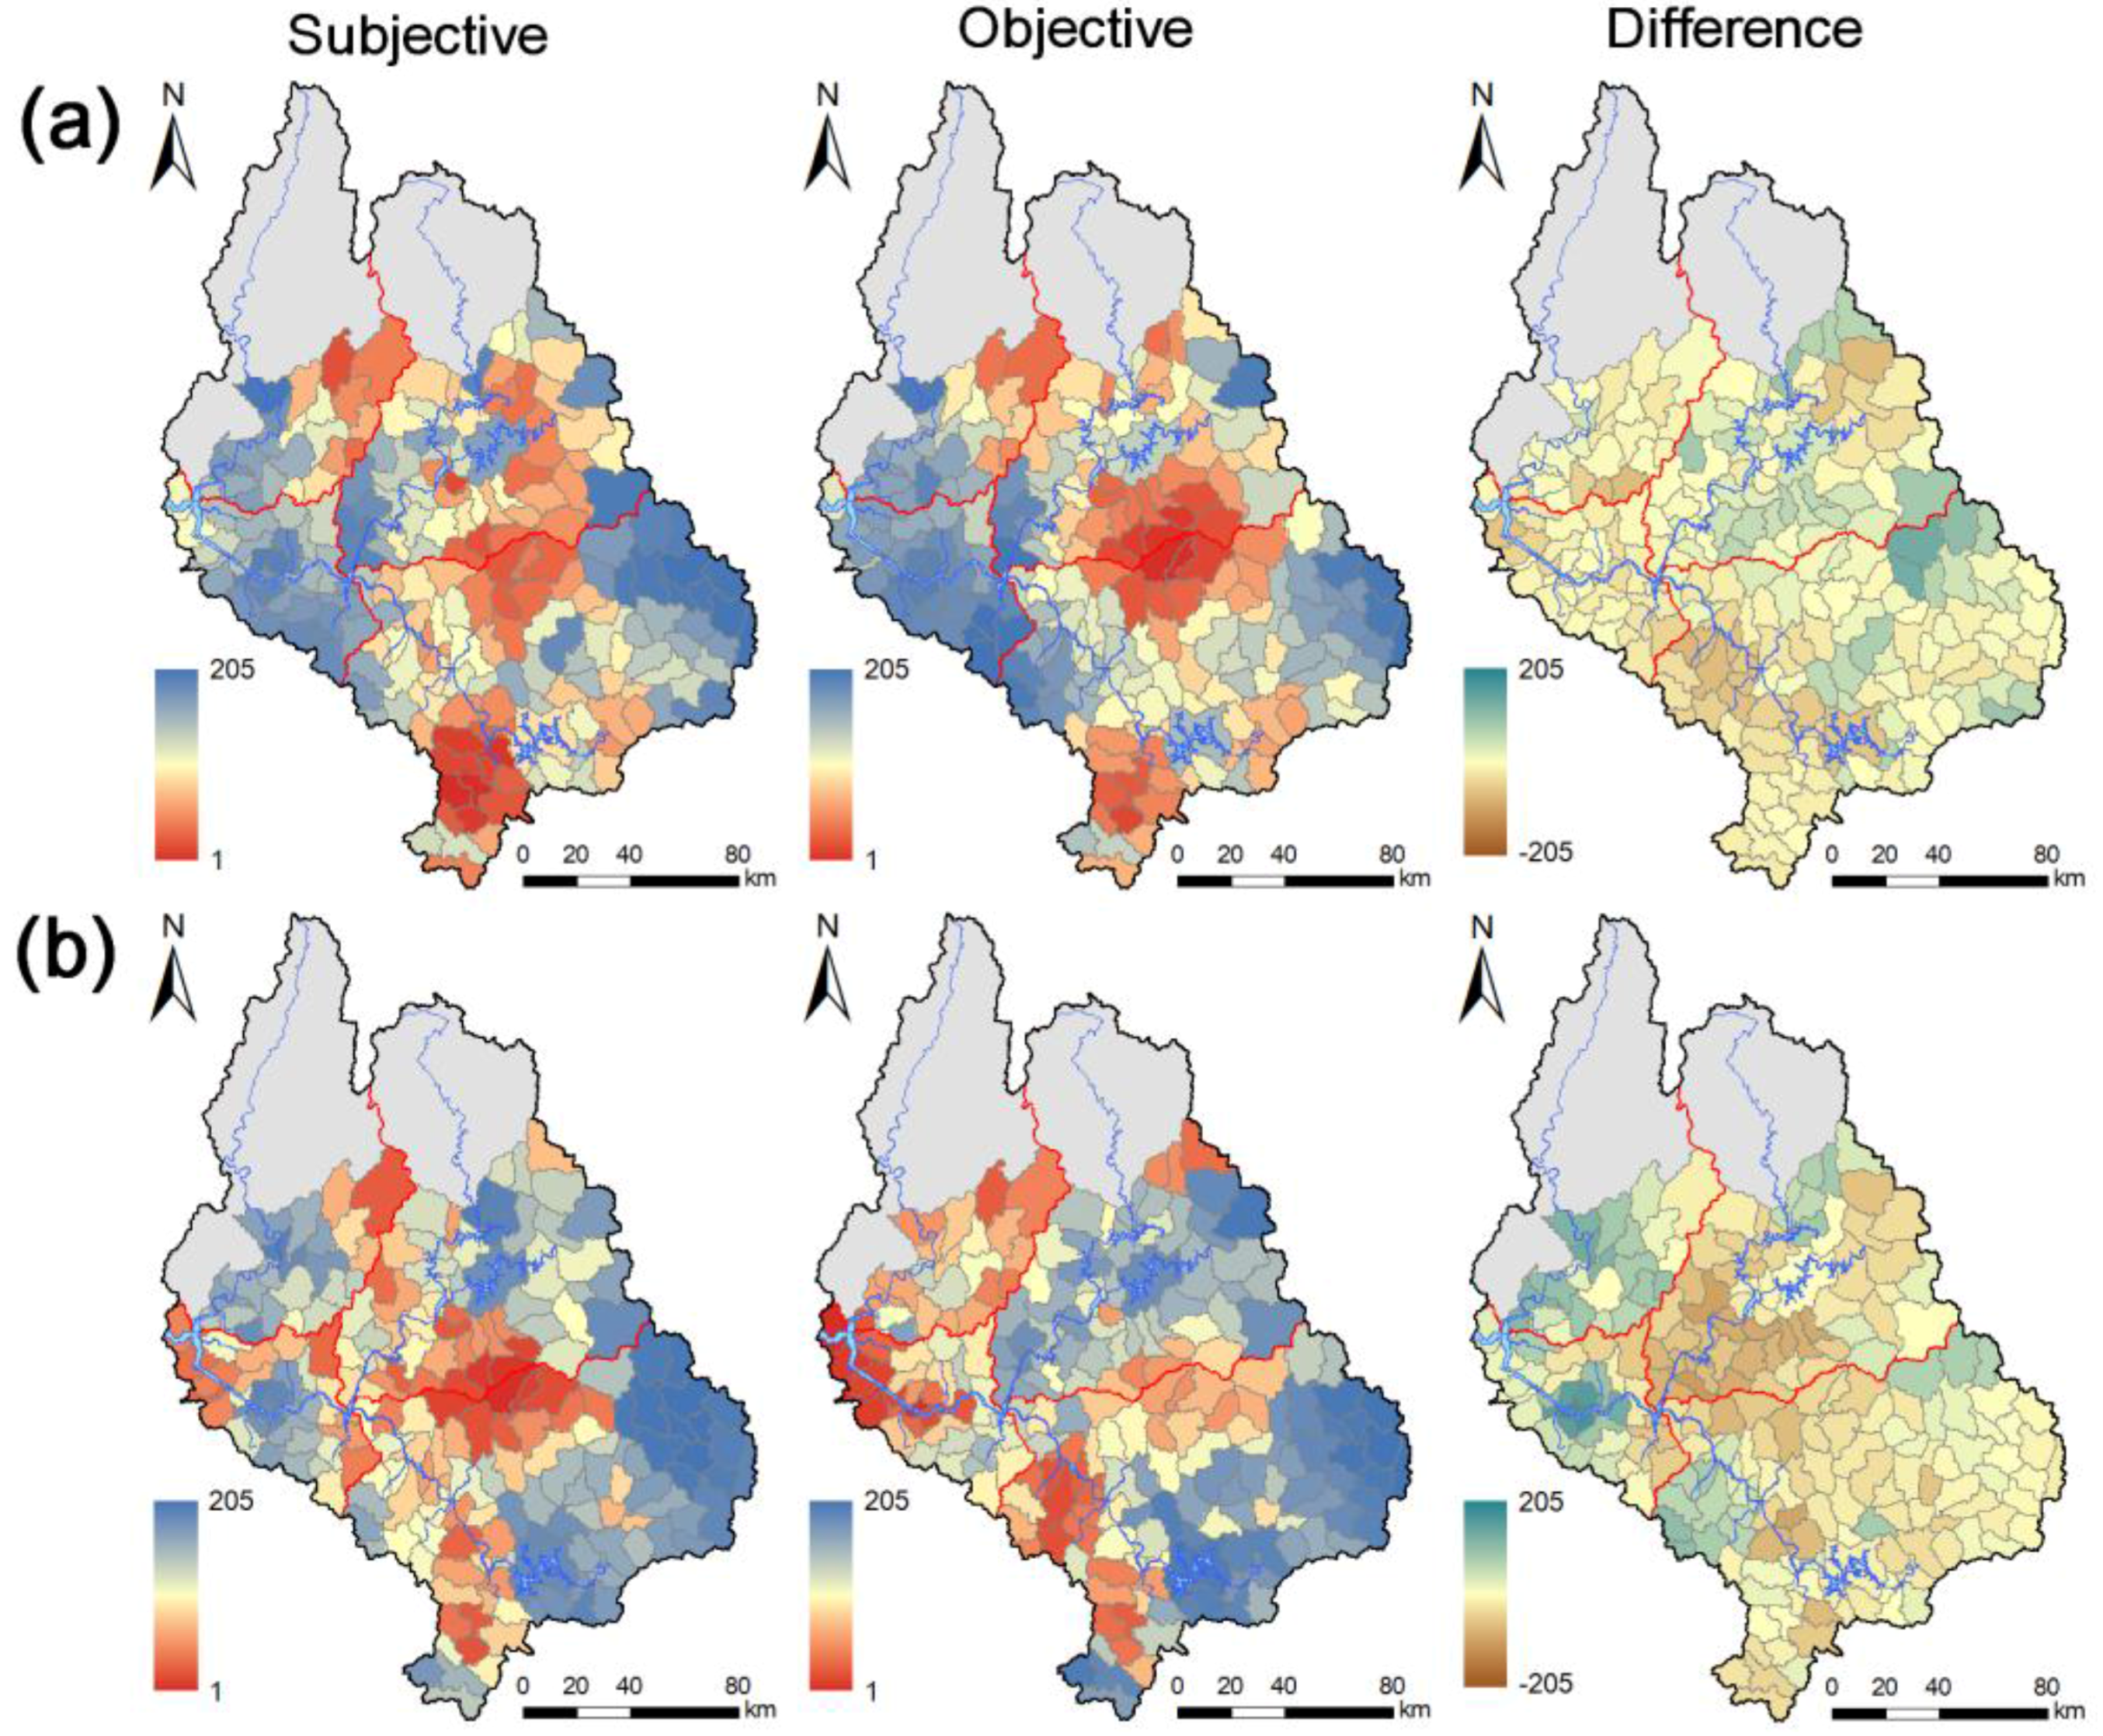
4.4. Water Resource Vulnerability Using Integrated Weighting Values

For each normalized index, subjective and objective weight data were used in TOPSIS techniques to incorporate all indicators according to the water quantity and quality. The vulnerability indices of all sub-basins were calculated, and their rankings were compared, as shown in Figure 8. The rankings of water quantity vulnerability in the downstream area of R3 show relatively similar distribution differences in some basins, including in R2, based on the weighting method. The most vulnerable basins are located in the upstream regions of R2 and R3, which have high water leakage ratios and water use. High adaptive capacity in metropolitan areas, such as the high waterworks distribution rate (Figure 5, A12), exhibited low vulnerability. In addition, effective rainfall (Figure 5, A1) can be advantageous for the utilization of water in some areas, such as R3.
The rankings of water quality vulnerability exhibited differences that were similar to those of the quantity vulnerability ranking based on the weighting method, and most differences were observed in metropolitan areas. The subjective weights yielded higher vulnerability in metropolitan areas, except in Seoul, where the objective weights displayed conflicting results based on the weighting method. In some areas, vulnerabilities were highest in metropolitan areas, including in Seoul, as shown in Figure 8. Thus, it was confirmed that metropolitan areas were the most vulnerable.
The middle Han River basin experienced numerous periods of consecutive dry days (Figure 6, B1) with high maximum temperatures, which can cause water quality degradation and ecosystem deterioration. Additionally, relatively high contaminant loads were observed, as shown in Figure 6 (B3–B6). The high rate of forested area in some sub-basins, such as in the upstream regions of R2 and R3, or low river water utilization, led to low vulnerability in areas of high water penetration. In addition, the results clearly indicate that all indicators of exposure and groundwater level are relatively important factors associated with water quantity vulnerability.
Table 4 shows the climate-related indicators of environmental phenomena such as heatwaves and droughts, and these indicators could potentially cause water quality problems. In the case of sensitivity, the indicators were related to the potential for water quality deterioration, mainly including indicators representing the pollutant sources and transport, as shown in Table 4. As expected, forested areas minimized surface runoff, soil erosion and sediment transport and exhibited the highest resilience to climate change and variability.
Figure 9 is divided into four different results from four different sub-regions of R1, R2, R3 and R4. The water quantity sector shows the difference index based on the weight, and R4 has higher maximum difference in the exposure index than in adaptive capacity index. That means the R4 region has lower vulnerability than R1–R3. The subjective weights have higher exposure and sensitivity index values compared to those of the objective weights. Regardless of the weighting methods, R2 shows a higher vulnerability associated with water quantity compared to that in R4. The water quality exhibits different results depending on the basin. The adaptive capacity index is highest in R4. Additionally, the sensitivity and adaptive capacity index values are low compared to those in other basins. In terms of the ranking of water quality vulnerability, R2 has the highest based on the subjective weights, whereas R4 has the highest based on the objective weights.

4.5. Vulnerability Correlation of the Weighting Method

We calculated the Spearman correlation coefficient of water resource vulnerability in accordance with the results of the two weighting methods. Table 5 shows the rank correlation of the weighting methods in different sub-regions. The water quantity vulnerabilities exhibited relatively similar distributions, with a rank correlation estimate of 0.80 in average. However, the water quality vulnerabilities exhibited relatively low correlation compared to that of the water quantity, with a value of 0.51 in average. In the case of assessing the water quality vulnerability based on the entropy weights, the sensitivity index was highly weighted. The large difference between the indicator values is reflected by the exposure and sensitivity classification values with low correlation. In addition, the water quantity vulnerability difference between the two weighting methods was larger than that for water quantity. The weights of approximately half of the sub-basins exhibited low correlations, reflecting relatively large differences.

5. Conclusions

This study evaluated the vulnerabilities associated with water quantity and quality in the Han River basin. We collected environmental and socioeconomic data from the national statistics database and used the Soil and Water Assessment Tool (SWAT) model to simulate water quantity and quality data. To estimate the weights of all indicators, expert surveys and the Shannon’s entropy method were used to determine subjective and objective weights, respectively. By comparing the vulnerability rankings and analyzing the rank correlation between the two methods, we evaluated the integrated hydrologic vulnerabilities of the Han River basin. In terms of water quantity, vulnerable sub-basins exhibited high water use and high water leakage ratios. For water quality, vulnerable sub-basins showed relatively high values of maximum consecutive dry days and temperature.
The water quantity indices from both weighting methods showed relatively similar spatial distributions, but the distribution of water quality indices was distinct based on the weighting methods. The water quantity vulnerability rankings with two weighting methods showed some differences between basins, and the rank correlation estimate was 0.80. Also, the correlation estimate for the water quality vulnerability was 0.51, which is significantly lower than the water quantity vulnerability. This result suggests that considering different weighting methods is important for reliably assessing robust water resource vulnerability.
This study provides useful information for water managers, hydrologists and environmentalists by suggesting the critical factors that should receive more focus in order to improve sustainable water management. These will help society better adapt to changes in climate or water quantity/quality in watersheds through development of strategies to be implemented in vulnerable areas. In addition, this study could be further applied to estimating vulnerabilities in future socioeconomic, environmental and climate scenarios. Furthermore, this study points out the importance of considering both stakeholders’ opinions and data-driven factors for a robust decision-making process. However, these approaches do not necessarily have to be implemented in parallel as presented in this study; rather, they could be implemented successively throughout the decision-making process: i.e., the stakeholders’ opinions could play a crucial role in a preliminary stage of project evaluation before utilizing the data-driven factors.

Acknowledgments

This research was supported by a grant (14AWMP-B082564-01) from the Advanced Water Management Research Program funded by the Ministry of Land, Infrastructure and Transport of the Korean government. Additionally, it was supported by a grant (2015K2A1A2070940) from the Global Research Collaboration Project of the National Research Foundation of Korea.

Author Contributions

Eun-Sung Chung, Patricia Jitta Abdulai, Hyesun Park and Yeonjoo Kim primarily wrote the article; Yeonjoo Kim designed the study; Hyesun Park performed the data process and analysis; So Ra Ahn and Seong Joon Kim provided the simulation results of SWAT and provided support in writing the article.

Conflicts of Interest

The authors declare no conflict of interest.

References

  1. Chung, E.S.; Lee, K.S. Identification of spatial ranking of hydrological vulnerability using multi-criteria decision making techniques: Case of Korea. Water Resour. Manag. 2009, 23, 2395–2416. [Google Scholar] [CrossRef]
  2. Jun, K.S.; Sung, J.Y.; Chung, E.S.; Lee, K.S. Development of spatial water resources vulnerability index considering climate change impacts. Sci. Total Environ. 2011, 409, 5228–5242. [Google Scholar] [CrossRef] [PubMed]
  3. Jun, K.S.; Chung, E.S.; Kim, Y.G.; Kim, Y. A fuzzy-multi-criteria approach to flood risk vulnerability in South Korea by considering climate change impacts. Expert Syst. Appl. 2013, 40, 1003–1013. [Google Scholar] [CrossRef]
  4. Lee, G.M.; Jun, K.S.; Chung, E.S. Integrated multi-criteria flood vulnerability approach using fuzzy TOPSIS and Delphi technique. Nat. Hazards Earth Syst. Sci. 2013, 13, 1293–1312. [Google Scholar] [CrossRef]
  5. Kim, Y.; Chung, E.S. Assessing climate change vulnerability with group multi-criteria decision making approaches: A case study with the water resources system in South Korea. Clim. Chang. 2013, 121, 301–315. [Google Scholar] [CrossRef]
  6. Chung, E.S.; Won, G.J.; Kim, Y.; Lee, H. Water resources vulnerability characteristics by district’s population size in a changing climate using subjective and objective weights. Sustainability 2014, 6, 6141–6157. [Google Scholar] [CrossRef]
  7. Gleick, P.H. Vulnerability of water systems. In Climate Change and US Water Resources; Waggoner, P.E., Ed.; John Wiley and Sons: New York, NY, USA, 1990. [Google Scholar]
  8. Intergovernmental Panel on Climate Change (IPCC). Climate Change 2001: Impacts, Adaptation Vulnerability. In Contribution of Working Group II to the Third Assessment Report of the Intergovernmental Panel on Climate Change; United Nations Environment Programme (UNEP)/World Meteorological Organization (WMO): Geneva, Switzerland, 2001. [Google Scholar]
  9. Eakin, H. The social vulnerability of irrigated vegetable farming households in Central Puebla. J. Environ. Dev. 2003, 12, 414–429. [Google Scholar] [CrossRef]
  10. Adger, W.N.; Brooks, N.; Bentham, G.; Agnew, M.; Eriksen, S. New Indicators of Vulnerability and Adaptive Capacity; Technical Report 7; Tyndall Centre for Climate Change Research: Norwich, UK, 2004. [Google Scholar]
  11. United Nations Office for Disaster Risk Reduction (UNISDR). Living with Risk: A Global Review of Disaster Reduction Initiatives; UNISDR: Geneva, Switzerland, 2004. [Google Scholar]
  12. Chung, E.S.; Lee, K.S. Prioritization of water management for sustainability using hydrologic simulation model and multicriteria decision making techniques. J. Environ. Manag. 2009, 90, 1502–1511. [Google Scholar] [CrossRef] [PubMed]
  13. Kim, D.; Jung, Y.; Park, M.J.; Yoon, J.Y.; Kim, S.; Choi, M. Vulnerability analysis of water resources considering climate change. J. Wetl. Res. 2011, 13, 25–33. [Google Scholar]
  14. Eakin, H.; Luers, A.L. Assessing the vulnerability of social-environmental systems. Annu. Rev. Environ. Resour. 2006, 31, 365–394. [Google Scholar] [CrossRef]
  15. Huang, Y.; Cai, M. Methodologies Guidelines: Vulnerability Assessment of Freshwater Resources to Environmental Change; United Nations Environment Programme (UNEP) and Peking University, China; UNEP, Regional Office for Asia and the Pacific: Bangkok, Thailand, 2009; pp. 1–28. [Google Scholar]
  16. Al-Kalbani, M.S.; Price, M.F.; Abahussain, A.; Ahmed, M.; O’Higgins, T. Vulnerability Assessment of Environmental and Climate Change Impacts on Water Resources in Al Jabal Al Akhdar, Sultanate of Oman. Water 2014, 6, 3118–3135. [Google Scholar] [CrossRef]
  17. Liu, X.Q.; Wang, Y.L.; Peng, J.; Braimoh, A.K.; Yin, H. Assessing vulnerability to drought based on exposure, sensitivity and adaptive capacity: A case study in middle Inner Mongolia of China. China Geogr. Sci. 2013, 23, 13–25. [Google Scholar] [CrossRef]
  18. Acosta, I.; Martínez, M. Assessment of surface runoff vulnerability to climate change in the Lerma-Chapala basin, Mexico. J. Water Resour. Plan. Manag. 2014. [Google Scholar] [CrossRef]
  19. Goharian, E.; Burian, S.; Lillywhite, J.; Hile, R. Vulnerability Assessment to Support Integrated Water Resources Management of Metropolitan Water Supply Systems. J. Water Resour. Plan. Manag. 2016. [Google Scholar] [CrossRef]
  20. Goharian, E.; Burian, S.; Bardsley, T.; Strong, C. Incorporating potential severity into vulnerability assessment of water supply systems under climate change conditions. J. Water Resour. Plan. Manag. 2016. [Google Scholar] [CrossRef]
  21. Moss, R.; Brenkert, A.; Malone, E. Vulnerability to Climate Change: A Quantitative Approach; US Department of Energy: Washington, DC, USA, 2002.
  22. Hwang, C.L.; Yoon, K. Multiple Attributes Decision Making Methods and Applications; Springer: Heidelberg, Germany, 1981. [Google Scholar]
  23. Linstone, H.A.; Turoff, M. The Delphi Method: Techniques and Application; Addison-Wesley Publishing Company Advanced Book Program: Boston, MA, USA, 1975. [Google Scholar]
  24. Shannon, C.E. A mathematical theory of communications. Bell Syst. Tech. J. 1948, 27, 379–423. [Google Scholar] [CrossRef]
  25. Adger, W.N. Vulnerability. Glob. Environ. Chang. 2006, 16, 268–281. [Google Scholar] [CrossRef]
  26. Hamouda, M.A.; Nour El-Din, M.M.; Moursy, F.I. Vulnerability Assessment of Water Resources Systems in the Eastern Nile Basin. Water Resour. Manag. 2009, 23, 2697–2725. [Google Scholar] [CrossRef]
  27. Seager, J. Perspectives and limitations of indicators in water management. Reg. Environ. Chang. 2001, 2, 85–92. [Google Scholar] [CrossRef]
  28. Kim, Y.; Chung, E.S. Fuzzy VIKOR approach for assessing the vulnerability of the water supply to climate change and variability in South Korea. Appl. Math. Model. 2013, 37, 9419–9430. [Google Scholar] [CrossRef]
  29. Wang, T.-C.; Lee, H.-D. Developing a fuzzy TOPSIS approach based on subjective weights and objective weights. Experts Syst. Appl. 2009, 36, 8980–8985. [Google Scholar] [CrossRef]
  30. Deng, H.; Yeh, C.H.; Willis, R.J. Inter-company comparison using modified TOPSIS with objective weights. Comput. Oper. Res. 2000, 27, 963–973. [Google Scholar] [CrossRef]
  31. Chu, T.C. Selecting plant location via a fuzzy TOPSIS approach. Int. J. Adv. Manuf. Technol. 2002, 20, 859–864. [Google Scholar] [CrossRef]
  32. Ahn, S.R.; Kim, S.J. Analysis of water balance by surface-groundwater interaction using the SWAT model for the Han River Basin, South Korea. Water 2017. under review. [Google Scholar]
  33. Nash, J.E.; Sutcliffe, J.V. River flow forecasting through conceptual models. Part I: A discussion of principles. J. Hydrol. 1970, 10, 282–290. [Google Scholar] [CrossRef]
  34. Moriasi, D.N.; Arnold, J.G.; van Liew, M.W.; Bingner, R.L.; Harmel, R.D.; Veith, T.L. Model evaluation guidelines for systematic quantification of accuracy in watershed simulations. Trans. ASABE 2007, 50, 885–900. [Google Scholar] [CrossRef]
Figure 1. Map of study area (Han River basin).
Sustainability 09 00029 g001
Figure 2. Procedure used in this study.
Sustainability 09 00029 g002
Figure 3. GIS data: (a) elevation; (b) stream network; (c) soil texture; (d) land cover.
Sustainability 09 00029 g003
Figure 4. Comparison of the observed and simulated daily dam inflows during the calibration (2005–2009) and validation (2010–2014 periods): (a) HSD; (b) SYD; (c) CJD; (d) PDD; (e) KCW; (f) YJW; (g) IPW [32].
Sustainability 09 00029 g004
Figure 5. Normalization of water quantity indicators.
Sustainability 09 00029 g005
Figure 6. Normalization of water quality indicators.
Sustainability 09 00029 g006
Figure 7. Comparison of subjective and objective weights: (a) water quantity and (b) water quality.
Sustainability 09 00029 g007
Figure 8. Comparison of vulnerability rank based on the weights: (a) water quantity and (b) water quality.
Sustainability 09 00029 g008
Figure 9. Comparison of sub-regions: (a) water quantity and (b) water quality.
Sustainability 09 00029 g009
Table 1. Descriptions of calibrated parameters in Soil and Water Assessment Tool (SWAT) [32].
ParameterDefinitionRangeAdjusted Value (Average)
DamsWeirs
Surface runoffCN2SCS curve number for moisture conditions35–98+12.5+7
CNCOEFPlant ET curve number coefficient0.5–222
SURLAGSurface runoff lag coefficient1–2444
OV_NManning’s “n” value for overland flow0.01–300.140.14
CH_N(1)Manning’s “n” value for tributary channels0.01–300.0140.014
EvapotranspirationESCOSoil evaporation compensation coefficient0–10.91250.95
Soil waterSOL_AWCAvailable water capacity0–10.1350.14
SOL_KSaturated hydraulic conductivity (mm/hr)0–200025.825.8
Ground waterGW_DELAYDelay time for aquifer recharge (days)0–5002931
GWQMNThreshold water level in a shallow aquifer for baseflow (mm)0–500013751000
ALPHA_BFBaseflow recession constant0–10.7250.048
REVAPMNThreshold water level in a shallow aquifer for “revap” (mm)0–1000750750
GW_REVAPGroundwater “revap” coefficient0.02–0.20.020.02
ReservoirRES_ESAReservoir surface area of the emergency spillway (km2)-48.254
RES_EVOLVolume of water needed to fill the reservoir storage Volume of the emergency spillway (106 m3)-1495.2513.667
RES_PSAReservoir surface area of the principal spillway (km2)-433
RES_PVOLReservoir storage volume of the principal spillway (106 m3)-1257.2511.33
RES_VOLInitial reservoir volume (106 m3)-674.759
RES_KHydraulic conductivity of the reservoir bottom (mm/hr)0–10.20.3
EVRSVLake evaporation coefficient0–10.5250.6
Table 2. Comparison of the calibration and validation results for dam inflow at calibration points [32].
PointNSER2
Cal.Val.Cal.Val.
HSD0.610.570.820.84
SYD0.780.780.900.89
CJD0.630.580.810.74
PDD0.830.760.920.88
KCW0.780.790.900.63
YJW0.770.760.910.62
IPW0.810.950.930.59
Cal.: Calibration period (HSD, SYD, CJD and PDD: 2005–2009; KCW, YJW and IPW: 2013); Val.: Validation period (HSD, SYD, CJD and PDD: 2010–2014; KCW, YJW and IPW: 2014).
Table 3. Descriptions of water quantity indicators.
CriteriaIndicatorDescriptionData SourcePeriod
ExposureClimateA1Effective precipitation (mm)Amount of precipitation that is actually added and stored in the soilSWAT simulated
Watershed environmentA2Cropland (%)Percentage of land on which crops are grownME2008
A3Impervious surfaces (%)Percentage of urbanized area, including impermeable areas
SensitivitySocietyA4Total population (persons)Total number of persons inhabiting an areaWAMIS2011
A5Population density (persons/km2)A measurement of the population per unit area
Water supplyA6Water leakage ratio (%)Percentage of the amount of water loss from the water supply systemME2013
A7Moderate water use (m3/m3)Ratio of water use (sum of residential, industrial, agricultural) to runoff (can be used continuously)WAMIS2013
SWAT simulated
A8Groundwater levels (m)Depth to the water table from the surfaceMOLIT2013
Water useA9Residential water use (106 m3)Total amount of water used in water/non-water supply areas and groundwater useWAMIS2011
A10Industrial water use (106 m3)Total amount of water used in manufacturing and industry
A11Agricultural water use (106 m3)Total amount of water used to grow fresh produce and sustain livestock
Adaptive capacityWater supplyA12Waterworks distribution rate (%)Ratio of the population receiving the waterworks supplyME2013
A13Water reuse (106 m3)Amount of water reuse of treated wastewater for beneficial purposes
EconomyA14Fiscal self-reliance ratio (%)Ratio of the local government’s revenue to its total revenue expenditureMOI2015
A15GRDP (108 won)Gross regional domestic productKOSIS2013
GovernanceA16Number of officials for water management (person/km2)Number of officials for water management (Waterworks and Sewerage)ME2013
Simulated: SWAT modeling result; ME: Ministry of Environment; WAMIS: Water Management Information System; MOLIT: Ministry of Land, Infrastructure and Transport; MOI: Ministry of the Interior; KOSIS: Korean Statistical Information Service.
Table 4. Descriptions of water quality indicators.
CriteriaIndicatorDescriptionData SourcePeriod
ExposureClimateB1Consecutive dry days (day)Maximum number of consecutive days with daily precipitation <1 mmKMA2010–2014
B2Heatwave days (day)Number of days with maximum temperature >33 °C
Pollution sourcesB3Nitrogen loading (kg/km2/day)Nitrogen pollutant loadKEI2009–2011
B4Phosphorus loading (kg/km2/day)Phosphorus pollutant load
B5Sediment loading (g/m2·yr)Amount of potential soil loss
B6BOD loading (kg/km2/day)Biochemical oxygen demand
SensitivityWatershed environmentB7Forest (%)Percentage of forest areaME2008
Water supplyB8Sewerage distribution rate (%)Percentage of the population receiving sewerage system servicesME2013
B9River water use (%)Ratio of the annual water demand to average annual runoffMOLIT2011
Simulated
Adaptive capacityWater supplyB10Waterworks distribution rate (%)Percentage of the population receiving the waterworks supplyME2013
EconomyB11Fiscal self-reliance ratio (%)Ratio of the local government’s revenue to its total revenue expenditureMOI2015
B12GRDP (108 won)Gross regional domestic productKOSIS2013
GovernanceB13Number of officials for water management (person/km2)Number of officials for water management (Waterworks and Sewerage)ME2013
KMA: Korea Meteorological Administration; KEI: Korea Environment Institute; ME: Ministry of Environment; WAMIS: Water Management Information System; MOLIT: Ministry of Land, Infrastructure and Transport; Simulated: SWAT modeling result; MOI: Ministry of the Interior; KOSIS: Korean Statistical Information Service
Table 5. Rank correlation analysis of weighting methods.
ClassificationR1R2R3R4
Water quantity0.890.590.300.81
Water quality0.430.560.79−0.01

