Article

Environmental Performance of Miscanthus, Switchgrass and Maize: Can C4 Perennials Increase the Sustainability of Biogas Production?

Department Biobased Products and Energy Crops, Institute of Crop Science, University of Hohenheim, Fruwirthstrasse 23, 70599 Stuttgart, Germany
*
Author to whom correspondence should be addressed.
Sustainability 2017, 9(1), 5; https://doi.org/10.3390/su9010005
Submission received: 31 October 2016 / Revised: 13 December 2016 / Accepted: 15 December 2016 / Published: 22 December 2016
(This article belongs to the Special Issue Biomass Energy Conversion)

Abstract

:
Biogas is considered a promising option for complementing the fluctuating energy supply from other renewable sources. Maize is currently the dominant biogas crop, but its environmental performance is questionable. Through its replacement with high-yielding and nutrient-efficient perennial C4 grasses, the environmental impact of biogas could be considerably improved. The objective of this paper is to assess and compare the environmental performance of the biogas production and utilization of perennial miscanthus and switchgrass and annual maize. An LCA was performed using data from field trials, assessing the impact in the five categories: climate change (CC), fossil fuel depletion (FFD), terrestrial acidification (TA), freshwater eutrophication (FE) and marine eutrophication (ME). A system expansion approach was adopted to include a fossil reference. All three crops showed significantly lower CC and FFD potentials than the fossil reference, but higher TA and FE potentials, with nitrogen fertilizer production and fertilizer-induced emissions identified as hot spots. Miscanthus performed best and changing the input substrate from maize to miscanthus led to average reductions of −66% CC; −74% FFD; −63% FE; −60% ME and −21% TA. These results show that perennial C4 grasses and miscanthus in particular have the potential to improve the sustainability of the biogas sector.

1. Introduction

Biogas is a renewable energy carrier produced by anaerobic digestion of biomass. Various kinds of biomass can be utilized for biogas production, such as sewage sludge, agricultural residues (e.g., manure), biogenic waste and energy crops [1]. Power production based on biogas is more reliable than other renewable energy sources, e.g., wind and solar, and can be used to cover power demand peaks or fluctuations in production due to unfavorable weather conditions. Biogas can be utilized directly in combined heat and power units (CHP) or can be upgraded to biomethane and transported to large gas power stations via the gas grid.
The Renewable Energy Act (EEG) and its amendments have led to a rapid increase in biogas exploration in Germany [1]. Here, approximately 8075 biogas plants with a total installed capacity of 4.1 GW were in operation in 2016 [2]. The latest amendments promote the restructuring of biogas plants to flexible operation, and approximately 31% of the installed capacity [2] have already been modernized. This allows power production to be adapted more to demand. Currently, 182 biogas plants upgrade biogas to biomethane and inject it into the gas grid [2]. These numbers show that, in Germany, there is a significant biogas infrastructure in place and the process of adapting it to the needs of a future renewable power supply has already begun. However, to allow an economically and environmentally viable operation, this infrastructure needs a reliable, affordable and sustainable supply of biomass. In 2014, substrate input (based on mass) was composed of 52% energy crops (of which 73% was maize) and 43% manure [2]. However, the proportion of biogas produced from energy crops is considerably higher than their proportion by mass, because they have a higher specific biogas and methane yield than other biogas substrates, e.g., manure. In Germany, about 1.4 million ha energy crops are grown for biogas production, of which 0.9 million ha are biogas maize [2]. This reveals the great importance of energy crops—and in particular energy maize—in Germany. The high economic viability of maize [3] for biogas production is given by its high methane yield, easy digestibility, and well-established, optimized crop production and harvest logistics, including storage as silage.
However, the strong reliance of the biogas sector on maize as substrate crop can lead to environmental problems and a low acceptance in public opinion. The environmental profile of maize cultivation is characterized by a high nitrogen fertilizer input, high risk of erosion and leaching, and negative impact on biodiversity [4,5,6]. In particular, the regional concentration in areas with high biogas plant densities can lead to environmental problems, such as surface and groundwater pollution through erosion and leaching, and losses in biodiversity and soil organic matter due to the high proportion of maize in crop rotations [7]. Other aspects are also criticized, such as the high concentration of maize in the landscape and the use of good agricultural land for growing energy instead of food crops. For these reasons, the sustainability of the biogas sector is often questioned not only by environmentalists but also by the general public.
The replacement of maize (Zea mays) by crops with a more benign environmental profile is seen as one route towards more sustainable biogas production. These crops, however, should have an equally high yield and biomass supply potential as maize. The high-yielding and nutrient-efficient perennial C4 grasses miscanthus and switchgrass are considered promising options.
The miscanthus genotype, Miscanthus x giganteus, was introduced into Europe in 1935 and is today still the only commercial genotype available on the market [8]. However, promising breeding efforts have begun in recent years and latest results show the suitability of novel genotypes for marginal lands and the potential contribution of miscanthus to greenhouse gas (GHG) mitigation [9]. Progress in upscaling miscanthus cultivation and crop production has also raised interest in the industrial sector [10]. Miscanthus’ beneficial environmental profile is mainly due to its perennial nature and because soil organic carbon tends to increase when arable land is converted to its cultivation [11]. It is a very resource- and land-use efficient crop with efficient nutrient-recycling mechanisms and high net energy yields per unit area [12,13]. For this reason, the global warming potential (GWP) and the resource depletion potential of miscanthus cultivation is low [14,15]. Miscanthus is suitable for biogas production and has a high methane yield potential per unit area [16,17,18]. For anaerobic digestion, the biomass is harvested before winter, which increases the yield and digestibility [18]. Whittaker et al. [19] proved storage of green miscanthus via ensilaging to be feasible with losses in a similar range as for maize. These losses were significantly reduced by the addition of silage additives [19]. Compared to the conventional harvest of dry biomass in early spring, a green harvest in late autumn prevents leaf fall over winter, which leads to a higher nutrient removal than at spring harvest [13,18]. However, the recycling of fermentation residues is assumed to at least partially compensate for this removal and contribute to the formation of soil organic carbon. Nevertheless, the effects of a green cut on the development of soil carbon and fertility needs to be further investigated and is for this reason not considered in this study.
The crop production and environmental profile of switchgrass (Panicum virgatum) is comparable to that of miscanthus, except establishment via seeds and not rhizomes. Switchgrass is native to the US and Canada, where it has been developed as a promising energy grass [20]. It is also suitable for biogas production as harvest of green biomass and even double-cutting is possible [21]. Although yields are generally lower than with Miscanthus x giganteus [22], switchgrass can perform equally well under abiotic stress, such as cold and drought [23]. Its major advantage over the miscanthus genotypes presently available (mainly propagated clonally via rhizomes) is its low-cost establishment via seeds. Currently, switchgrass is not commercially cultivated in Germany and miscanthus is grown on an estimated area of 4000 hectares, mainly for combustion purposes [9]. Extending the utilization to anaerobic digestion could contribute to the sustainability and crop diversity (important for biodiversity) of the biogas sector.
The objective of this paper is to assess and compare the environmental performance in biogas production of the perennial C4 grasses miscanthus and switchgrass and the annual C4 crop maize. This was done in a Life Cycle Assessment (LCA) according to ISO standards 14040 and 14044 [24,25], using data from a field trial and laboratory measurements. Wagner and Lewandowski [26] showed that, when analyzing the environmental performance of biobased value chains, it is crucial to consider more impact categories than just global warming potential (GWP). Therefore, the following impact categories were assessed to estimate the environmental performance of the crops and their subsequent utilization: climate change (CC)—which corresponds to the GWP, freshwater eutrophication (FE), marine eutrophication (ME), terrestrial acidification (TA) and fossil fuel depletion (FFD). The impact categories FE, ME and TA were chosen as eutrophication and acidification have been identified as important impact categories for agricultural systems. The category marine eutrophication represents the impact of nitrogen on biomass growth in aquatic ecosystems. Freshwater eutrophication represents the same impact, but caused by phosphorus [27,28].
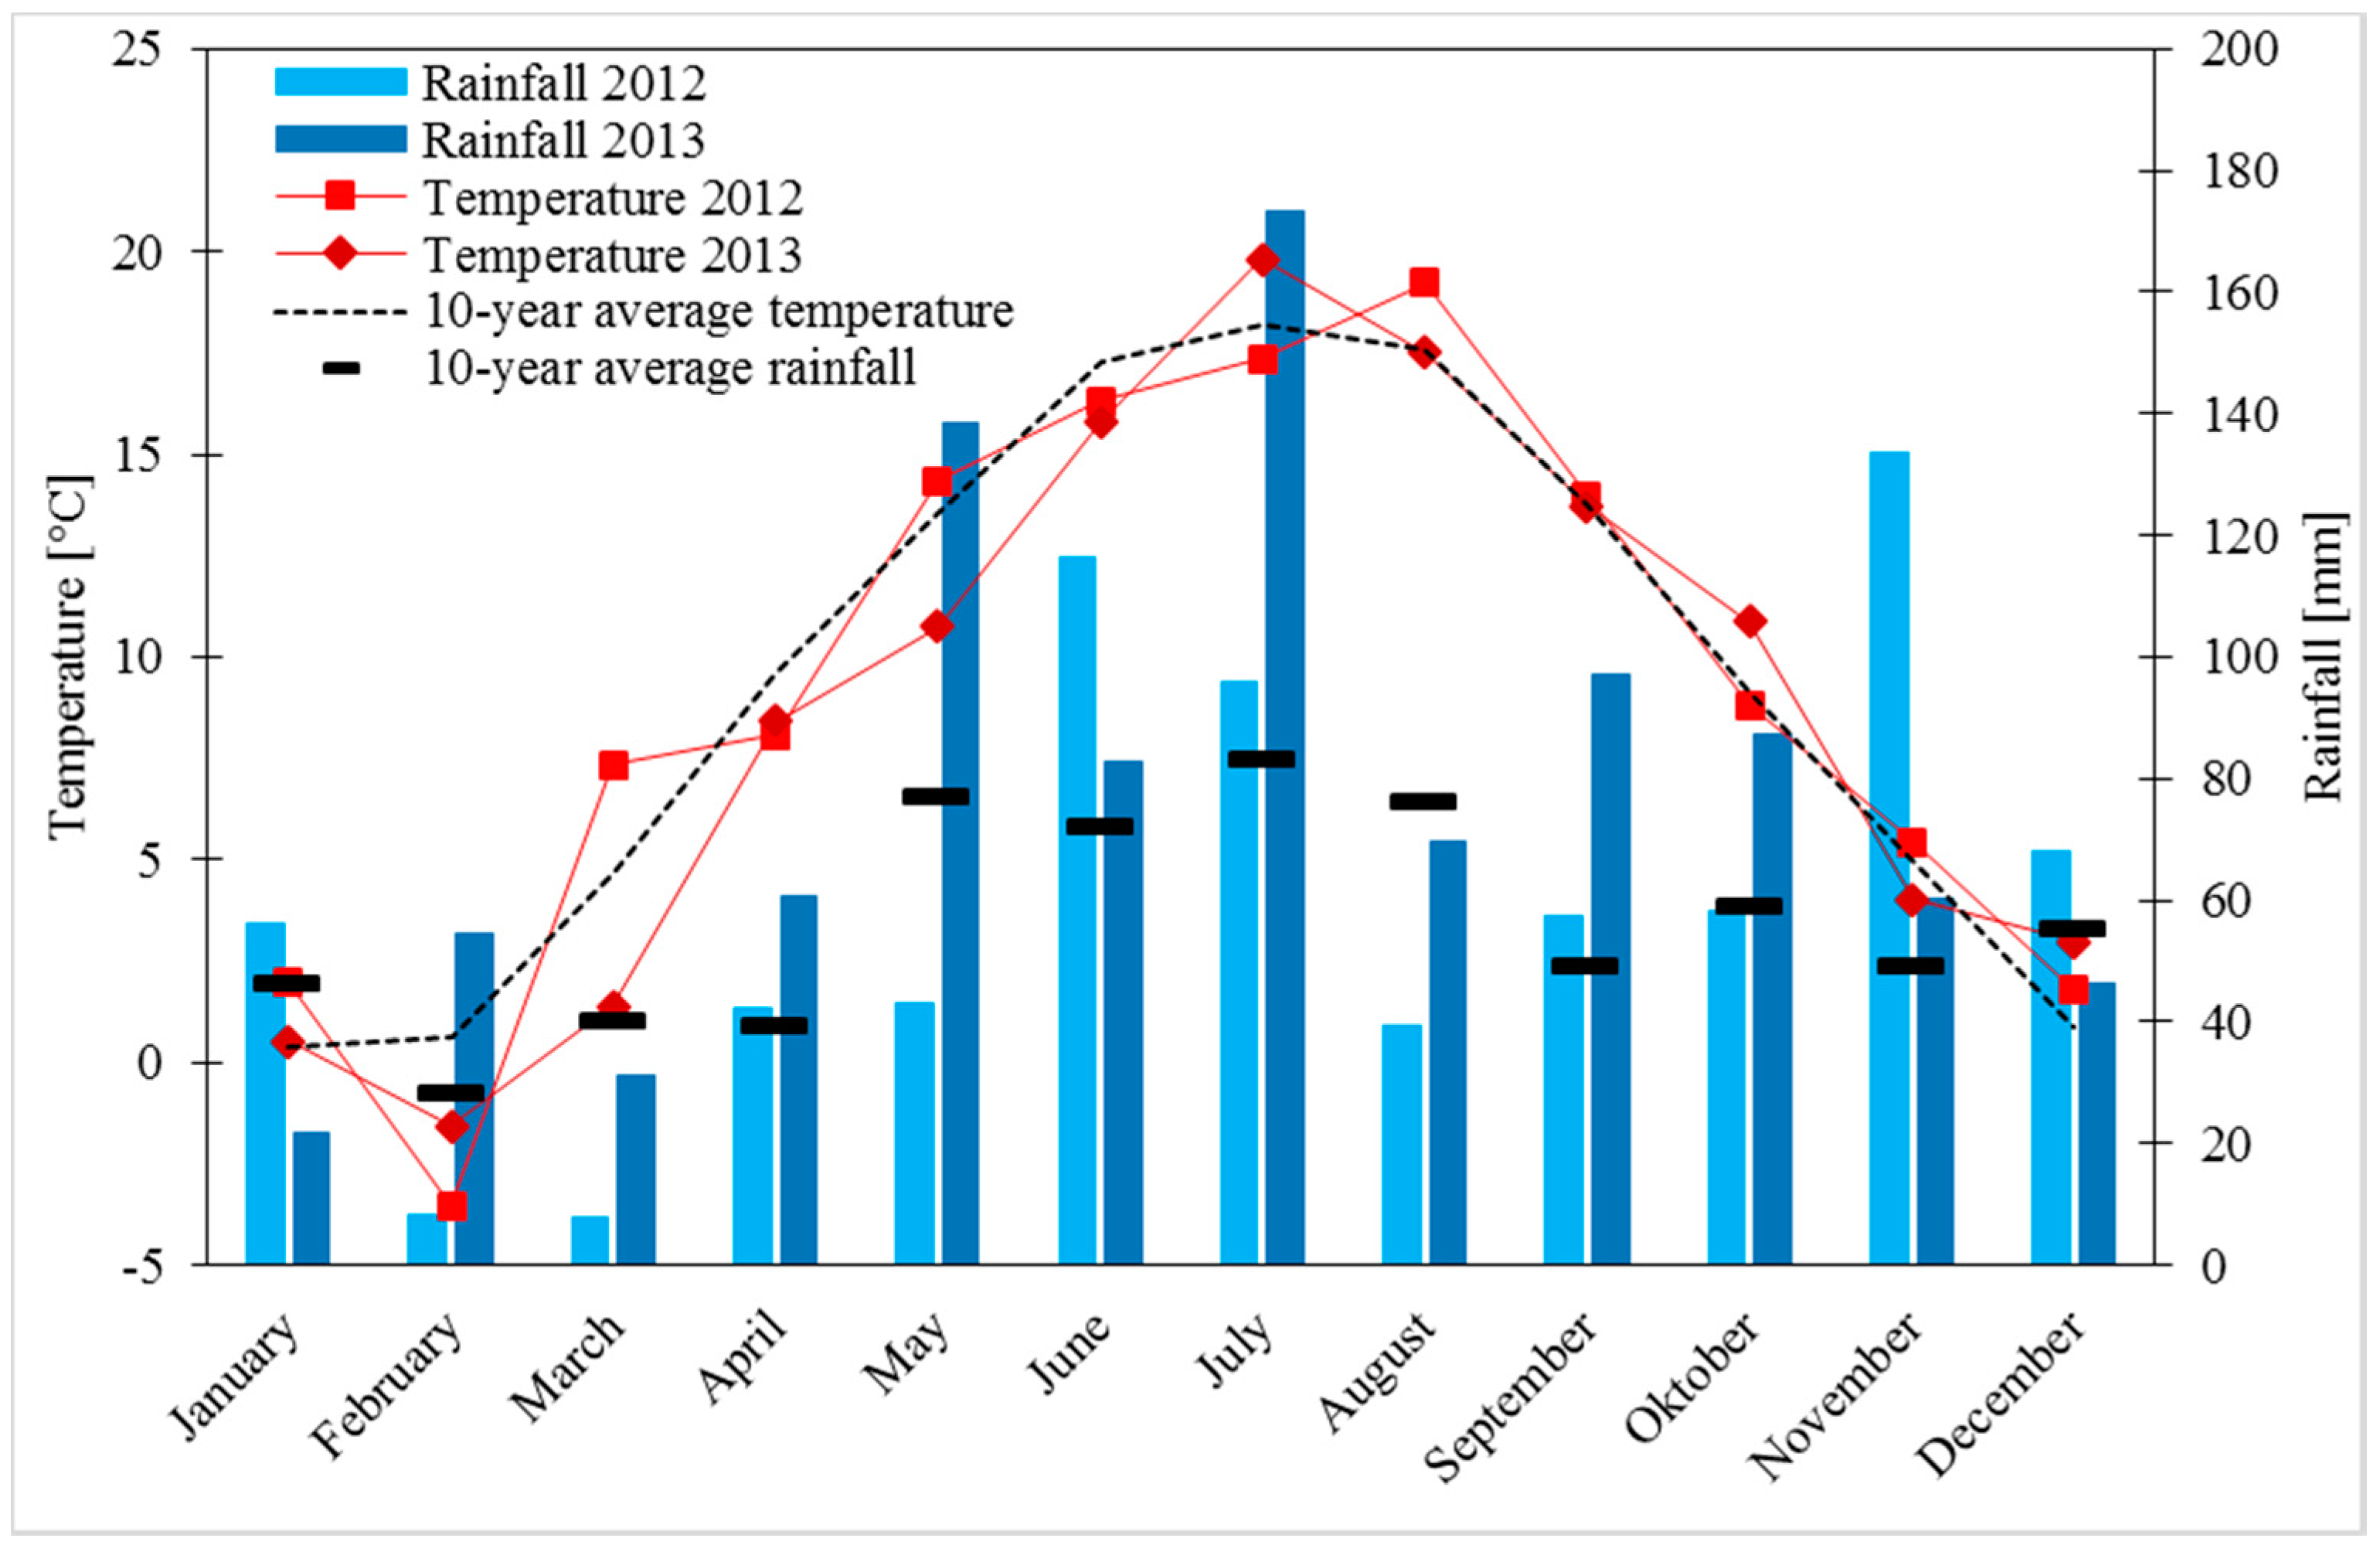
The data for the LCA were collected from a randomized split-block field trial, where miscanthus, switchgrass and maize were grown under ceteris paribus conditions. The field trial was started in 2002 and allows a comparison of annual and perennial crops. Samples and yield measurements for this LCA were taken in 2012 and 2013 and laboratory analyses were performed to estimate biogas and methane yield and biomass quality.

2. Material and Methods

2.1. Scope and Boundaries

The scope of the present study is an assessment of the environmental performance of the cultivation of three dedicated energy crops ((i) miscanthus (Miscanthus x giganteus); (ii) switchgrass (Panicum virgatum L.) “Kanlow”; and (iii) silage maize (Zea mays) “Mikado”) and their subsequent fermentation in a biogas plant. The biogas produced is utilized in a CHP unit (Combined Heat and Power) to produce electricity and heat. The cultivation as well as the utilization of the biomass takes place in Germany. One kilowatt hour of electricity (kWhel.) was chosen as the functional unit (FU). The environmental impacts of these biobased value chains were compared with the German electricity mix as a fossil reference. In order to do this, a system expansion approach was applied which enables the inclusion of fossil reference system hot spots.
The systems are described in Figure 1. On the right side the maize cultivation is shown, on the left side the cultivation of the perennial crops miscanthus and switchgrass. The system boundaries include the production of the mineral fertilizers and the herbicides used, the production of the propagation material (miscanthus rhizomes as well as switchgrass and maize seeds), and the agricultural management (soil preparation, planting, mulching, fertilizing, spraying of herbicides, harvesting, recultivation resp. stubble cultivation) over the whole cultivation period which is for maize 1 year, for switchgrass 15 years and for miscanthus 20 years. Miscanthus and switchgrass are mulched in the first year and harvested from the second year onwards. All crops are harvested with a self-propelled forage harvester. The biomass is then transported to the biomass plant where it is fermented to biogas which is combusted in a CHP unit to produce electricity and heat. The fermentation residues are rich in nutrients and are used as fertilizer.

2.2. Life Cycle Inventory

The data for the cultivation process used in this LCA were obtained from a multiannual field trial at Ihinger Hof. The Ihinger Hof is a research station of the University of Hohenheim and is located in southwest Germany (48.75°N and 8.92°E). The soil belongs to the soil class Haplic Luvisol. The long-term average annual air temperature and precipitation at the research station are 8.3 °C and 689 mm, respectively. The experimental design of the trial is described in Boehmel et al. [29].
Data on cultivation practices such as fertilizer and herbicide inputs were available for an 11-year period from 2002 to 2013. Miscanthus and switchgrass were established in spring 2002 by rhizome planting and sowing, respectively. Maize was sown on 27 April 2012 and 21 May 2013 at a density of 9.5 seeds m−2. Nitrogen was applied as calcium ammonium nitrate (CAN), K2O as potassium chloride and P2O5 as triplesuperphosphat (TSP). The use of herbicides during the miscanthus and switchgrass cultivation is described in Iqbal et al. [30]. For maize cultivation chemical weeding was performed using two conventional herbicides mixtures following good agricultural practice. The first application was a mixture of three herbicides (2.0 L·ha−1 Stomp Aqua, BASF SE, active ingredient 455 g·L−1 Pendimethalin; 1.0 L·ha−1 Spektrum, BASF SE, active ingredient 720 g L−1 Dimethenamid-P; and 1.0 L·ha−1 MaisTer power, Bayer, active ingredient 31.5 g·L−1 Foramsulfuron + 1.0 g·L−1 Iodosulfuron + 10.0 g·L−1 Thiencarbazone + 15.0 g·L−1 Cyprosulfamide). The second application was a mixture of two herbicides (1.7 L·ha−1 Laudis, Bayer, active ingredient 44 g·L−1 Tembotrione + 22 g·L1 Isoxadifen-ethyl; and 0.35 L·ha−1 Buctril, Bayer, active ingredient 225 g·L−1 Bromoxynil).
The principle data for the cultivation of miscanthus, switchgrass and silage maize used in this analysis are summarized in Table 1. The data are shown for the years 2012 and 2013. In the year 2013 the weather conditions were not ideal for silage maize cultivation in Germany which is an important reason for the significantly lower yield of silage maize in the year 2013 compared to 2012. After a serious frost period in February 2012, the weather conditions in 2012 where quite usual, spring was rather dry, but followed by plenty of rain in June (Figure 2). Weather conditions in 2013 were completely contrary and very challenging for agriculture. The spring and especially May was unusually cool and wet. Due to this challenging weather conditions, maize sowing was delayed to late May. In July, the temperatures were unusually high and the crops faced a serious drought followed by few days of rain from 24 to 29 July. In this period, 168.5 mm of rainfall occurred in 4 major events, which represents 97% of the rain of the complete month.
Maize was harvested at milk-ripe stage (end of September in 2012; late October in 2013) and miscanthus and switchgrass in late October in both years. The years 2012 and 2013 were selected to compare the environmental performance of perennial crops as an alternative to maize under different conditions for silage maize cultivation. The yield of maize, miscanthus and switchgrass is shown for the favorable year 2012 and non-favorable year 2013 in Table 1. However, the yield of the two perennial crops is the average yield over the whole cultivation period (20 years for miscanthus, and 15 for switchgrass) including the establishment phase based on the measured yield of the respective year. In the first year, miscanthus and switchgrass are mulched and not harvested. Full yields are only reached from the third year on. This calculation is exemplarily shown for the yield in 2012 for miscanthus in Equation (1) and for switchgrass in Equation (2) and was performed in the same way for the lower yields in 2013. The variable yield_year2 describes the yield in the second cultivation year, which, for both crops, is slightly lower than the mean yield achieved in the following years.
M e a n   y i e l d   m i s c a n t h u s   [ t   D M   h a 1 · y r 1 ] = y i e l d _ y e a r 2   +   yield _ y e a r _ 2012 × 18 20
M e a n   y i e l d   s w i t c h g r a s s   [ t   D M   h a 1 · y r 1 ] = y i e l d _   y e a r 2   +   yield _ y e a r _ 2012 × 13 15
The methane yield was measured as described in Kiesel and Lewandowski [18]. A biogas batch test was performed for 35 days at mesophilic conditions (39 °C) according to VDI guideline 4630. The approach of the biogas batch test was certified by the KTBL and VDLUFA interlaboratory comparison test 2014 and 2015. Each sample was assessed in four technical replicates.
The background data for the environmental impacts associated with the production of the input substrates (seeds, propagation material, herbicides and fertilizers) and the cultivation processes were taken from the GaBi database [31]. Direct N2O and NO emissions from the mineral fertilizers used were calculated according to Bouwman et al. [32]. The estimations of indirect N2O emissions from mineral fertilizers and N2O emissions from harvest residues were done in accordance to IPCC [33]. Nitrate leaching to groundwater was calculated according to the SQCB—NO3 model [34]. Ammonia emissions were calculated using emission factors from the Joint EMEP/CORINAIR Atmospheric Emission Inventory Guidebook [35]. Phosphate emissions were estimated according to van der Werf et al. [36].
In this study a transport distance of 100 km by truck for the input material such as herbicides or fertilizer and of 5 km by tractor for the biomass from the field to the biogas plant was assumed. This assumption is align with literature [37,38,39] and was done, since no data for the transport distance of the input substrates to the farmer and the biomass to the biogas plant were available. The emission stage for the truck used was assumed to be EUR5. The data for the transportation processes of the input material and the biomass were taken from the GaBi database [31].
After the harvest, the biomass of the different crops is ensiled. During the ensilage process dry matter losses of 12% were assumed [40]. The silage is subsequently fermented in a biogas plant. The methane hectare yield of the different crops is shown in Table 1. In the biogas plant methane losses of 1% were assumed [41]. The biogas is then combusted in a CHP with an electrical capacity of 500 kW to produce heat and power. The technical characteristics of the CHP used in this analysis are shown in Table 2. The inherent power consumption for miscanthus and switchgrass was assumed to be 12% and thus significantly higher than for maize. This is due to the more energy intensive pre-treatment of lignocellulosic biomass before the fermentation process. The emissions associated with the combustions of the biogas were taken from the ecoinvent database [42]. The electricity generated is fed into the grid. Twenty percent of the heat produced is used internally for the heating of the fermenter. In practice the remaining heat is partially used for heating nearby buildings thereby substituting heat produced by fossil sources. In this study, it was assumed that of the remaining heat 50% is used for this purpose.
The residues of the fermentation process are rich in nutrients. Table 3 shows the plant available nutrients, which can be recycled through the use of fermentation residues as fertilizers (related to the generation of the functional unit of 1 kWhel.). The nutrient content is the average of the measured values of year 2012 and 2013. The phosphorus and the potassium content of the biomass fermented remains fully in the fermentation residues. Only 70% of the nitrogen compounds in the fermentation residues are available for the plants. That is why the nitrogen content can therefore not be taken fully into account. The nitrogen (N) content was analyzed according to the DUMAS principle (method EN ISO 16634/1 and VDLUFA Method Book III, method 4.1.2) using a Vario Macro Cube (Elementar Analysensysteme GmbH, Hanau, Germany) element analyzer. The phosphor (P) and potassium (K) contents were analyzed according to DIN EN ISO 15510 and VDLUFA Method Book III, method 10.8.2 [43] using ICP-OES and a ETHOS.lab microwave (MLS GmbH, Leutkirch, Germany).

2.3. Choice of Impact Categories

In this LCA study the life cycle impact assessment method ReCiPe was used [44]. The following impact categories were considered: climate change (CC), which corresponds to global warming potential (GWP); terrestrial acidification (TA); freshwater eutrophication (FE); marine eutrophication (ME); and fossil fuel depletion (FFD). Characterization factors were taken from Goedkoop et al. [44]. These impact categories were chosen according to their relevance for perennial biomass production, which was analyzed in the study by Wagner and Lewandowski [26].

3. Results

For each impact category analyzed, data are shown for the two climatically different production years 2012 and 2013 (2012 favorable and 2013 non-favorable for silage maize cultivation) and for two scenarios, one with and one without heat utilization. These are presented both in figures and in tables, depicting the results with (figures) and without (tables) a system expansion approach. The results are presented per functional unit (FU), which is kWh electricity. In the supplementary material (S1–S5), the same results are presented per kg dry biomass.
The value in each impact category shows the net impact or benefit of the substitution of the fossil reference through a biobased alternative. In this study, the German electricity mix was substituted by power generated through the fermentation of dedicated energy crops and the subsequent combustion of the biogas in a CHP unit. A negative value in this case is thus a net benefit while a positive value is a negative impact on the environment.
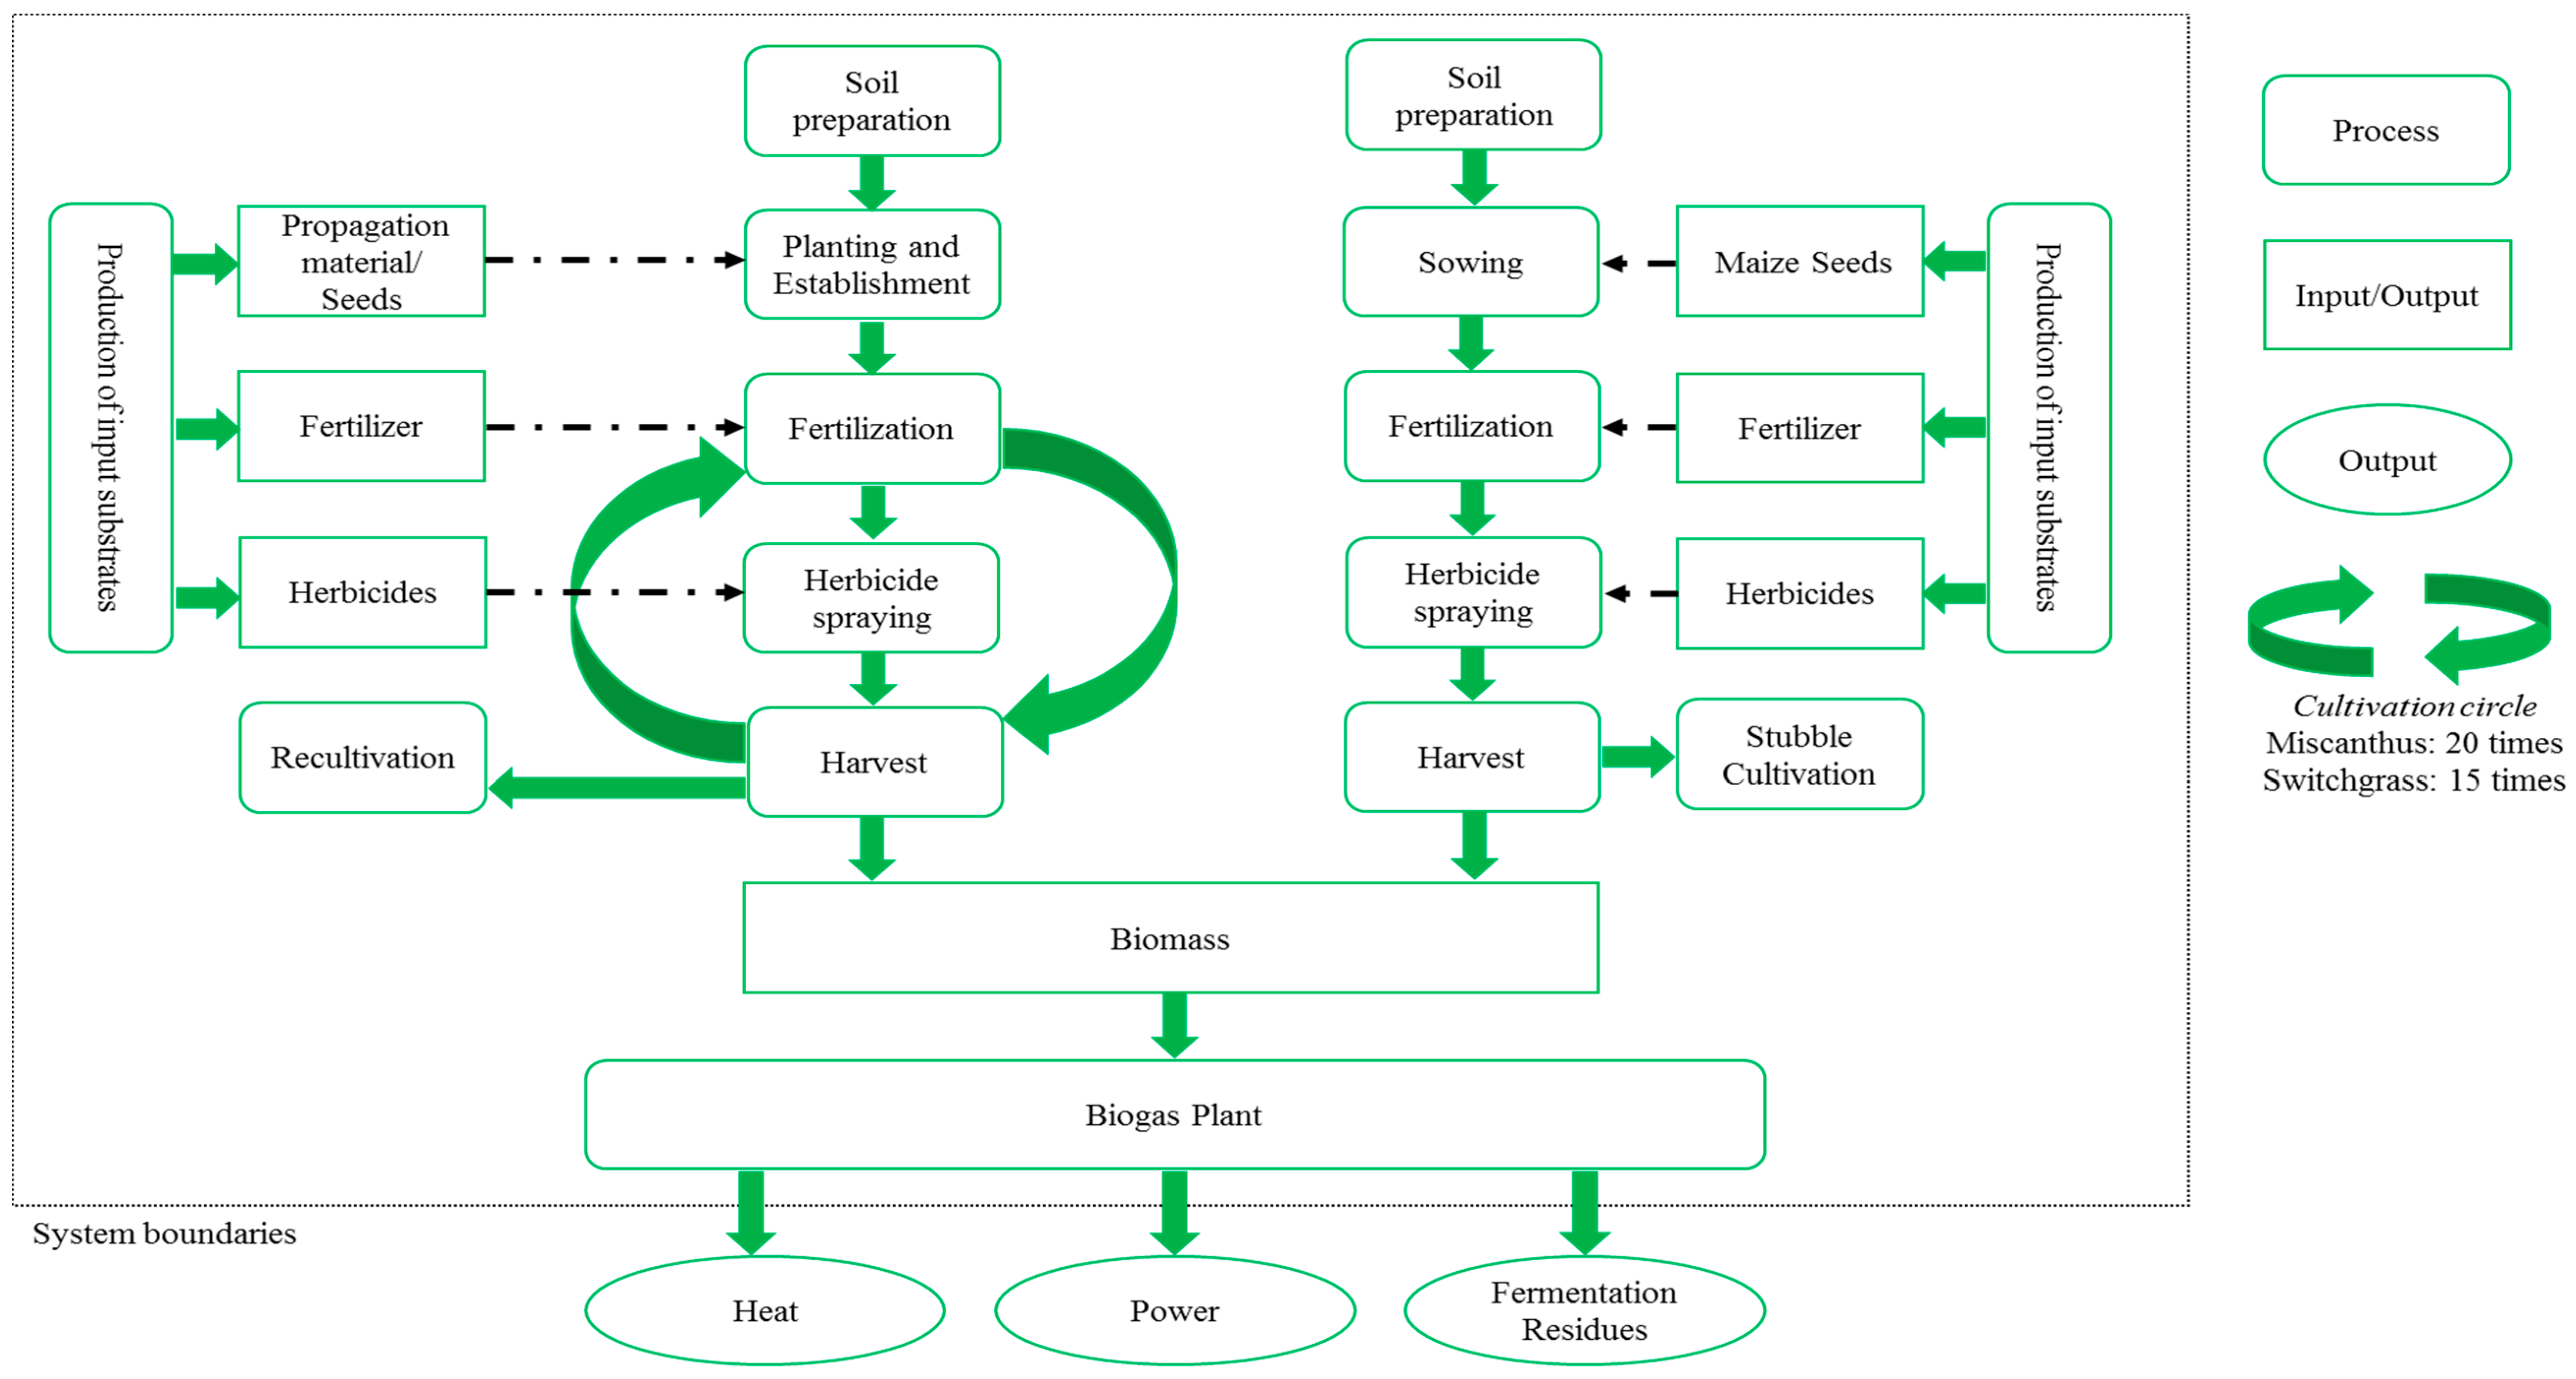
In contrast, the table shows the environmental impact of the generation of 1 kWhel. in each impact category without this substitution, separated into the main emission sources. In this context, the recycling of nutrients represents the emission savings associated with the reduction in fertilizer in other crops through the use of the fermentation residues. The agricultural management summarizes all operation steps from soil preparation, planting, mulching, fertilizing, and spraying of herbicides to recultivation. The fertilizer-induced emissions are emissions associated with the use of fertilizers, such as N2O emissions, which occur after the application of nitrogen fertilizer. Credits heat utilization are credits given for the substitution of heat produced via a fossil reference (in the present study natural gas) by heat generated via the combustion of biogas in the CHP unit. In the heat utilization scenario, 20% of the heat produced is used internally in the biogas plant. Of the remaining 80%, one half (40% of total heat produced) is used to heat nearby buildings, thus substituting heat from conventional sources.

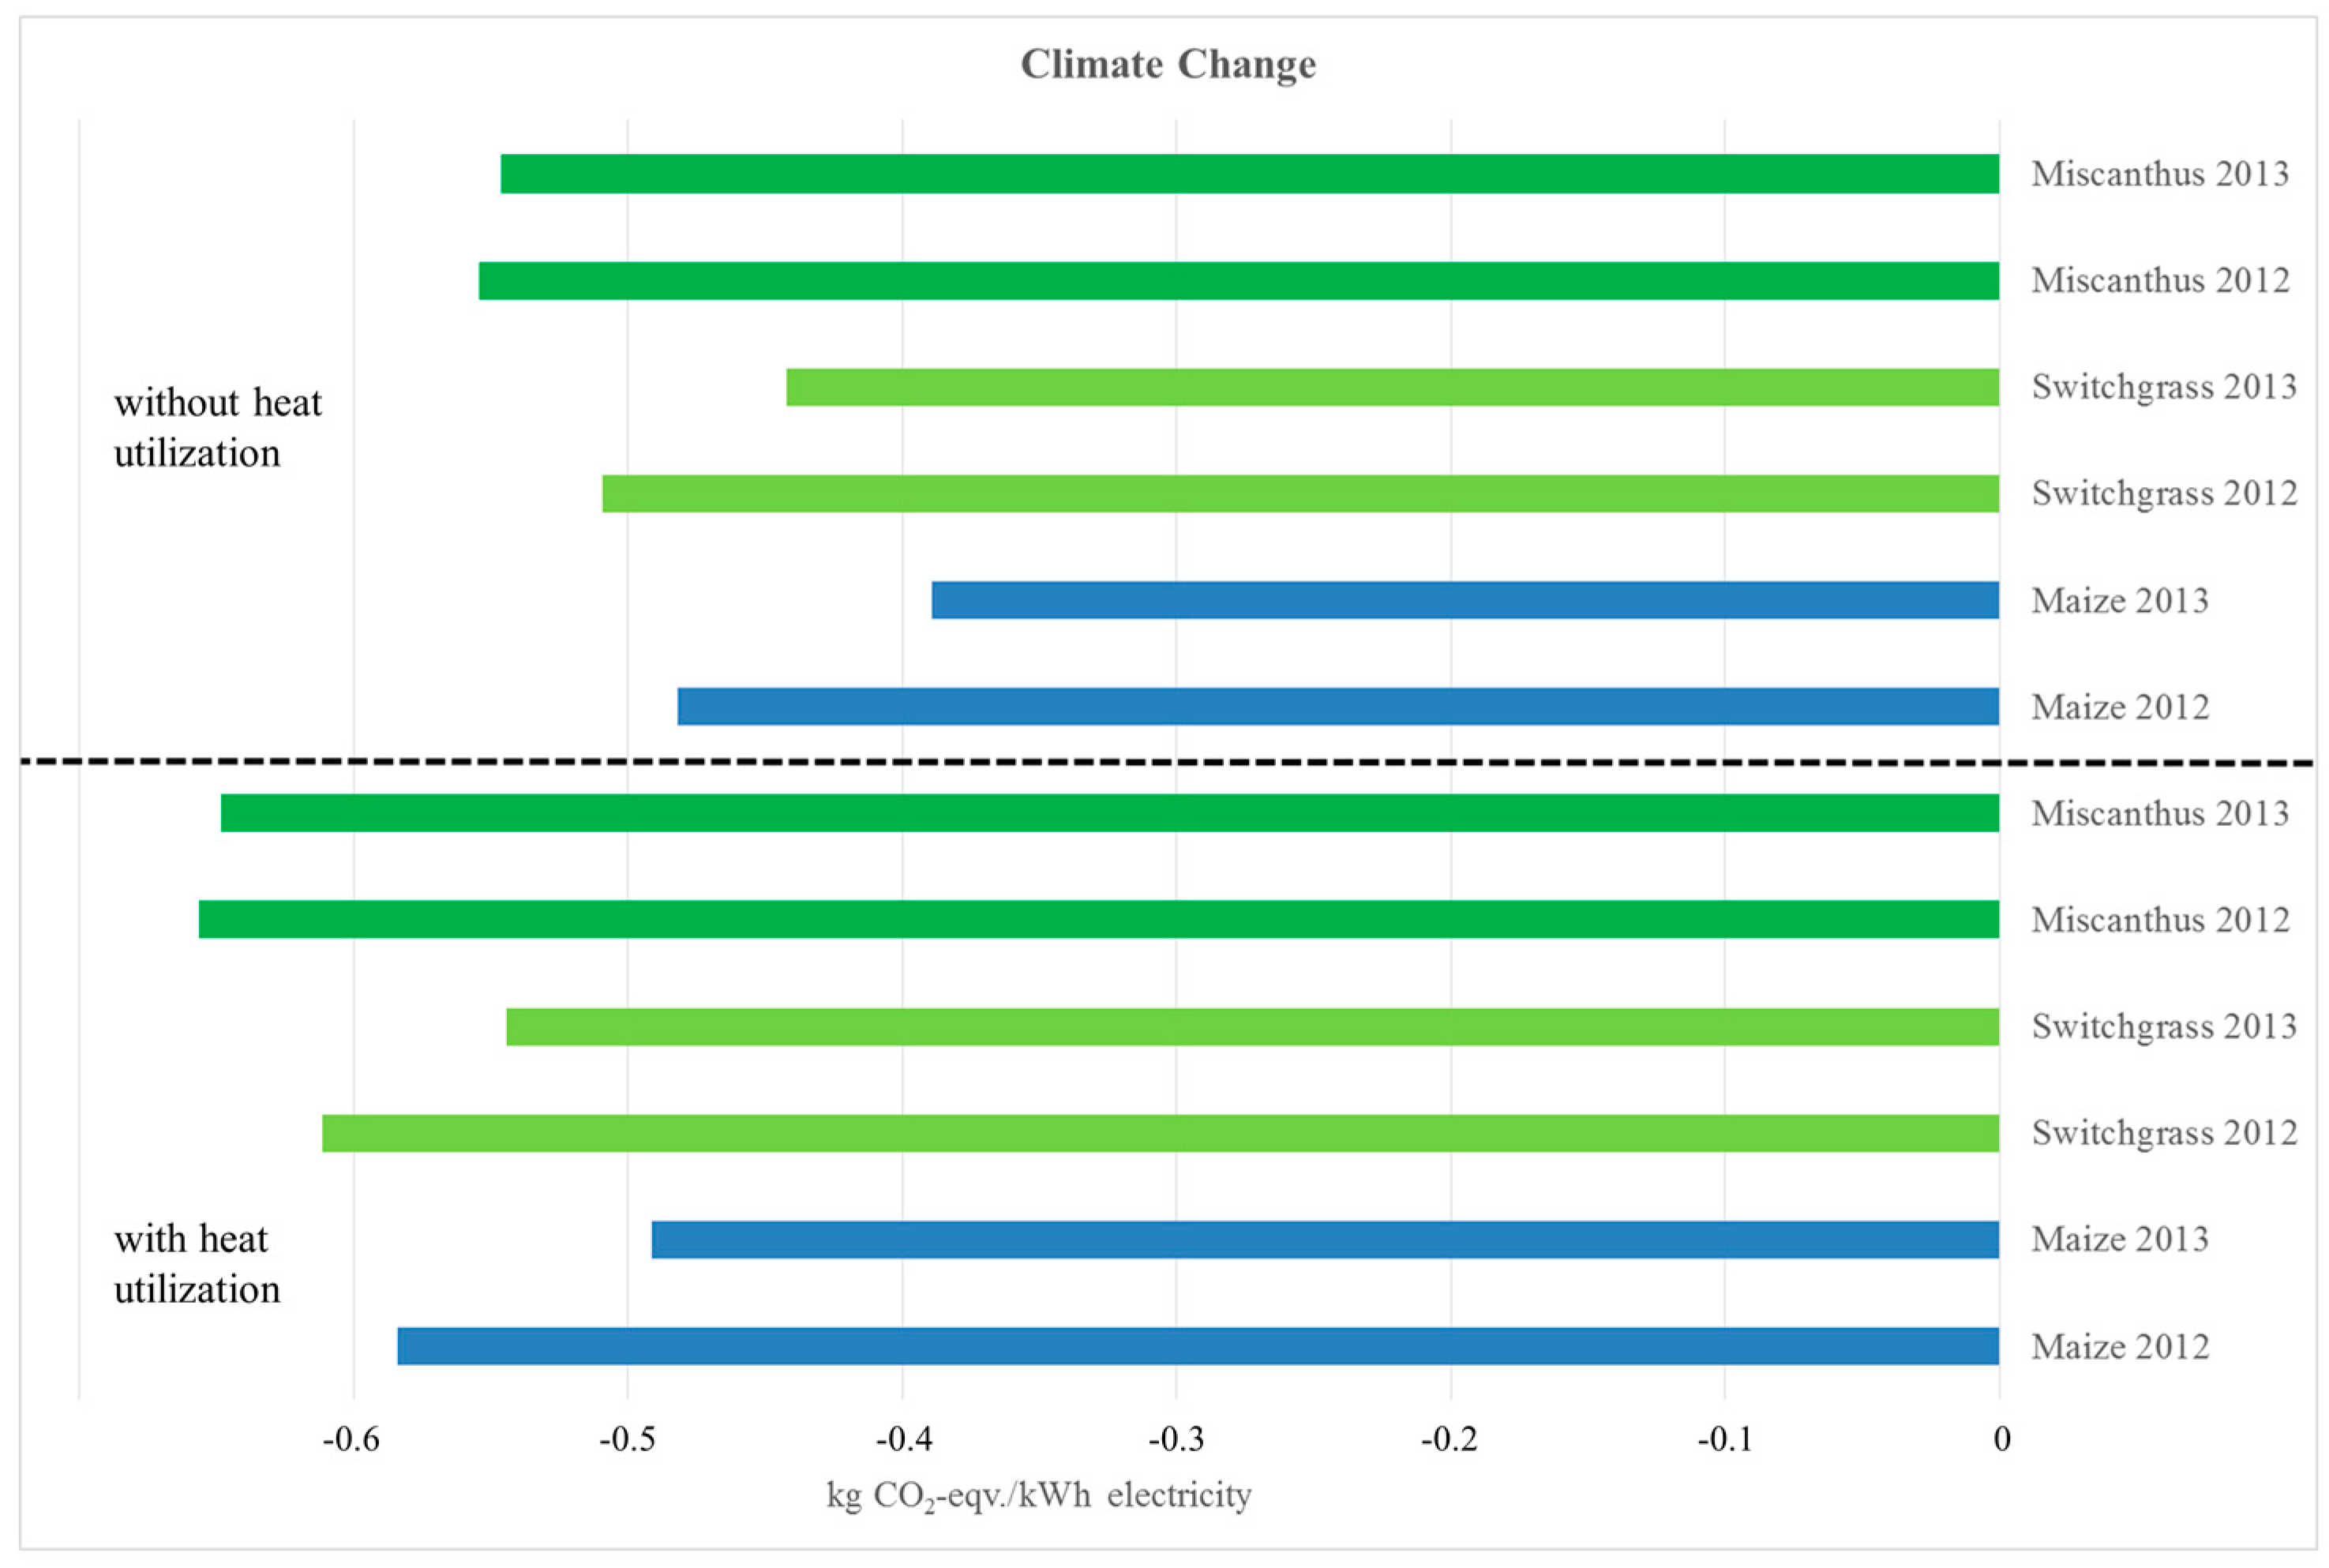
3.1. Climate Change and Fossil Fuel Depletion

The production and use of the analyzed C4 crops, both perennial and annual, leads to a net GHG emission reduction up to 0.66 kg·CO2-eqv. (kWhel.)−1 through the substitution of a fossil reference (
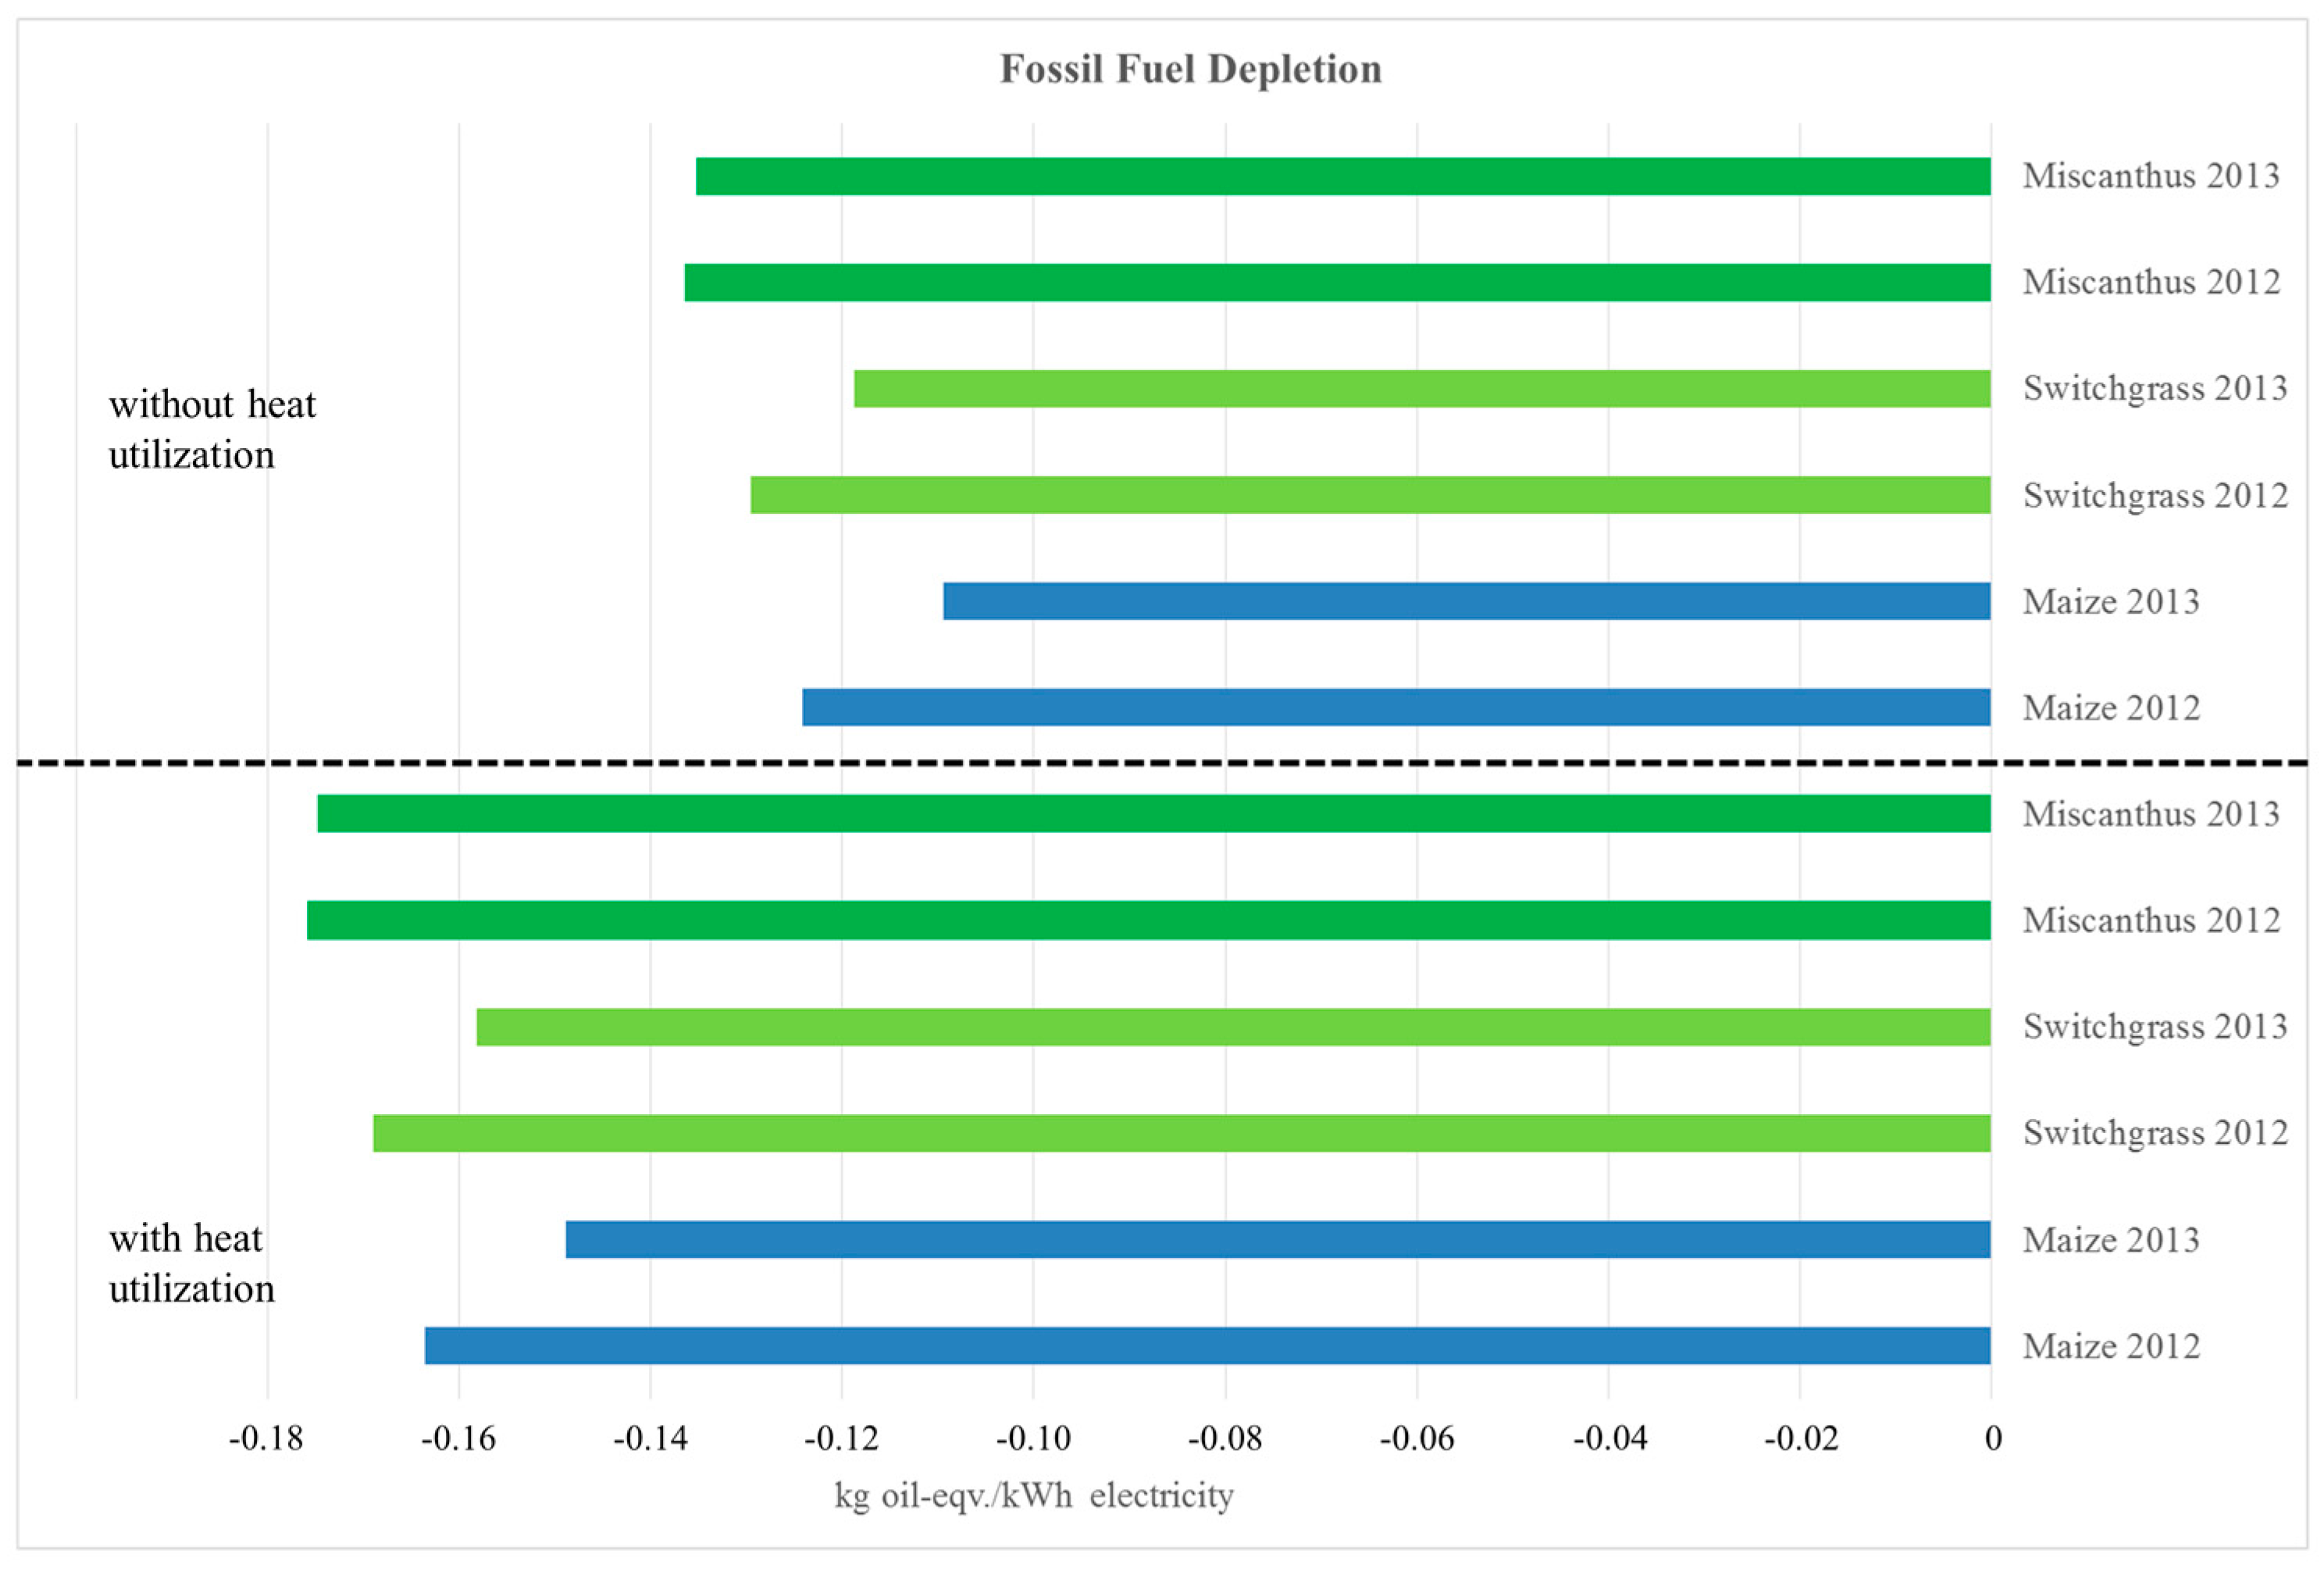
Figure 3). Furthermore, all scenarios show a net decrease of the fossil fuel depletion of up to 0.18 kg·oil-eqv. (kWhel.)−1 (Figure 4). As expected, the scenarios with heat utilization lead to both higher GHG emission and fossil fuel saving (Figure 3 and Figure 4). On average, miscanthus shows the highest GHG emission and fossil fuels saving potentials. Both perennial grasses perform better than maize (Figure 3 and Figure 4). The advantage of miscanthus over switchgrass is larger than the advantage of switchgrass over maize.
Table 4 shows the contribution of different processes to the GHG emissions and Table 5 the use of fossil fuels in these processes. The production of nitrogen fertilizer is responsible for the largest impact in both impact categories and for all crops. This is also the reason for the high credit—in terms of fossil energy savings—given for the recycling of nutrients from the fermentation residues (Table 5). Other processes with high impacts on GHG emissions and fossil energy consumption are harvest operation and biomass transport to the biogas plant (Table 4 and Table 5).

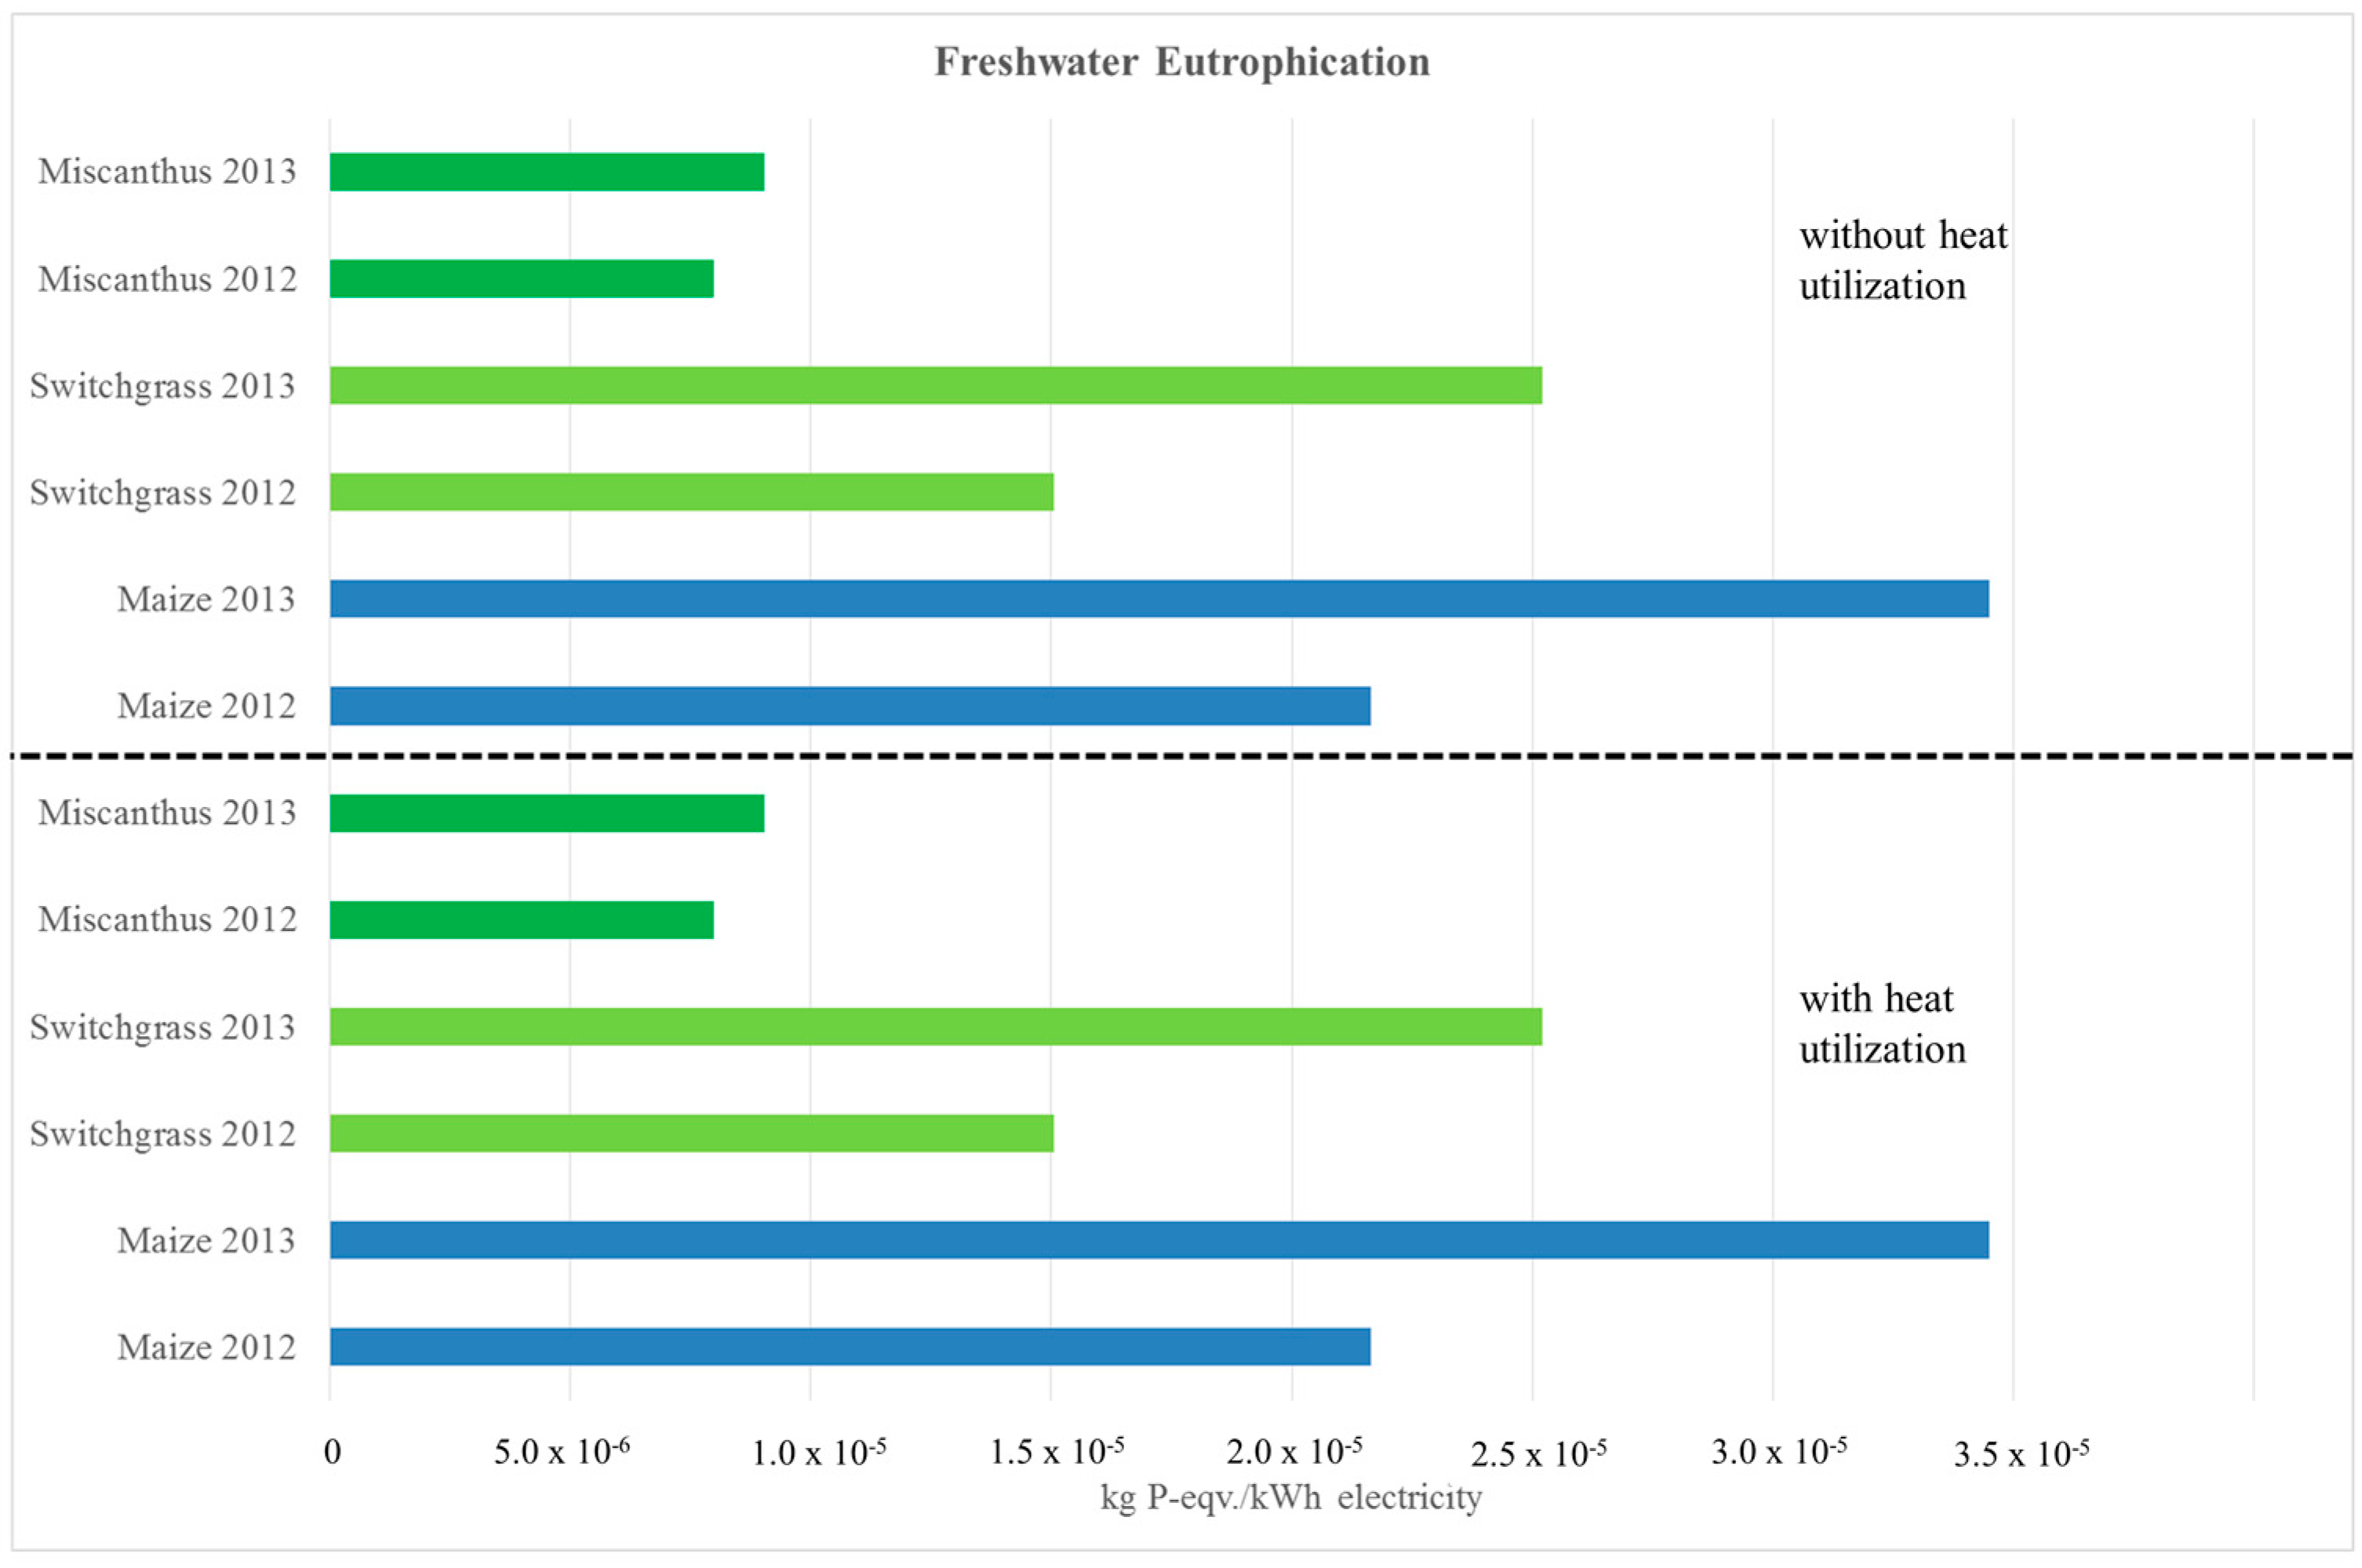
3.2. Freshwater Eutrophication and Marine Eutrophication

The substitution of the fossil reference lead to a net increase in freshwater eutrophication of up to 3.5 × 10⁻⁵ kg·P-eqv. (kWhel.)−1 in all scenarios (Figure 5). On average, the freshwater eutrophication potentials are lowest for miscanthus, followed by switchgrass and then maize (Figure 5).
The recycling of nutrients leads to a high credit, which has a positive impact on the freshwater eutrophication (Table 6). In all scenarios, fertilizer-induced emissions account for the largest share of freshwater eutrophication. These are phosphate emissions associated with the use of phosphorus fertilizer, which are highest in maize and lowest in miscanthus (Table 6). The second-largest share comes from nitrogen fertilizer production, followed by the production of phosphate fertilizers (Table 6).
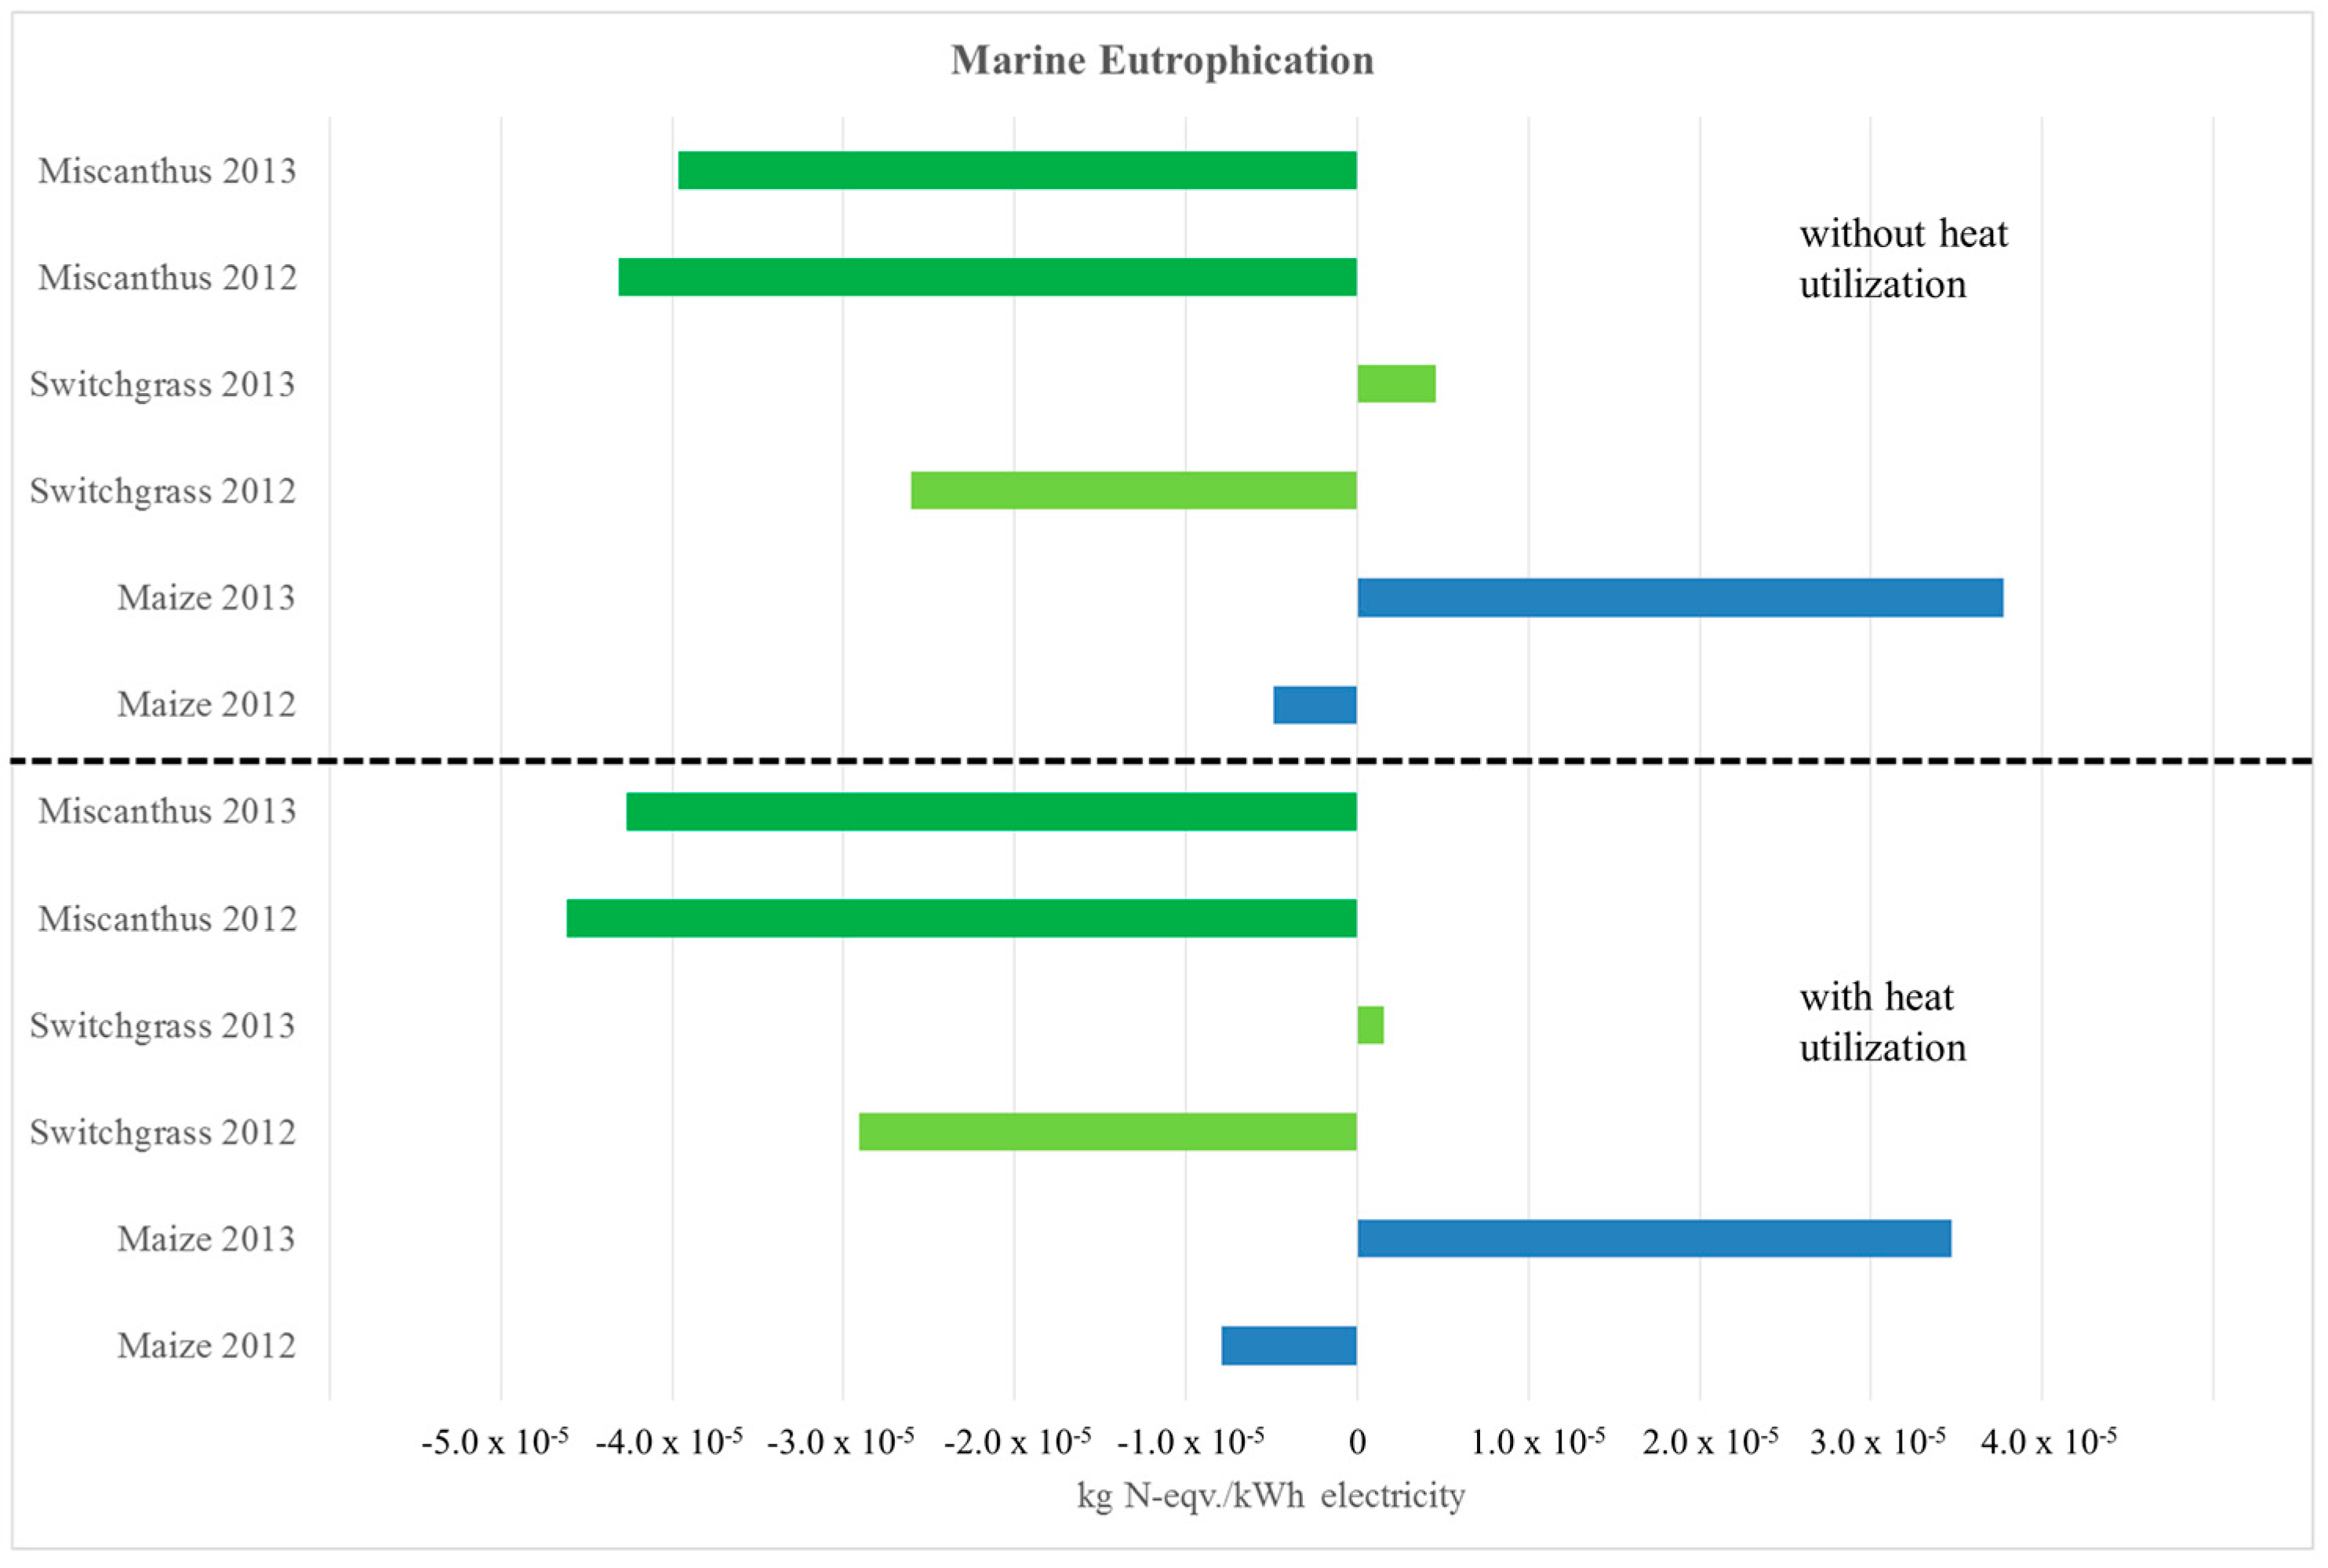
A net benefit in the impact category marine eutrophication was achieved for the utilization of switchgrass and maize only in the year 2012—where the yield was significantly higher than in 2013—and when the heat utilization was accounted for (Figure 6). Miscanthus was the only crop that led to a reduction of marine eutrophication in comparison to the fossil reference in all years and scenarios. The maximum reduction was—4.6 × 10⁻⁵ kg·N-eqv. (kWhel.)−1 (Figure 6).
The production of nitrogen fertilizer had the strongest impact on marine eutrophication for all crops, followed by fertilizer-induced emissions. Ammonia emissions and nitrate leaching due to the use of nitrogen fertilizer play a particularly important role here. Both impacts were highest for maize and lowest for miscanthus (Table 7). The recycling of nutrients results in a significant credit (Table 7).

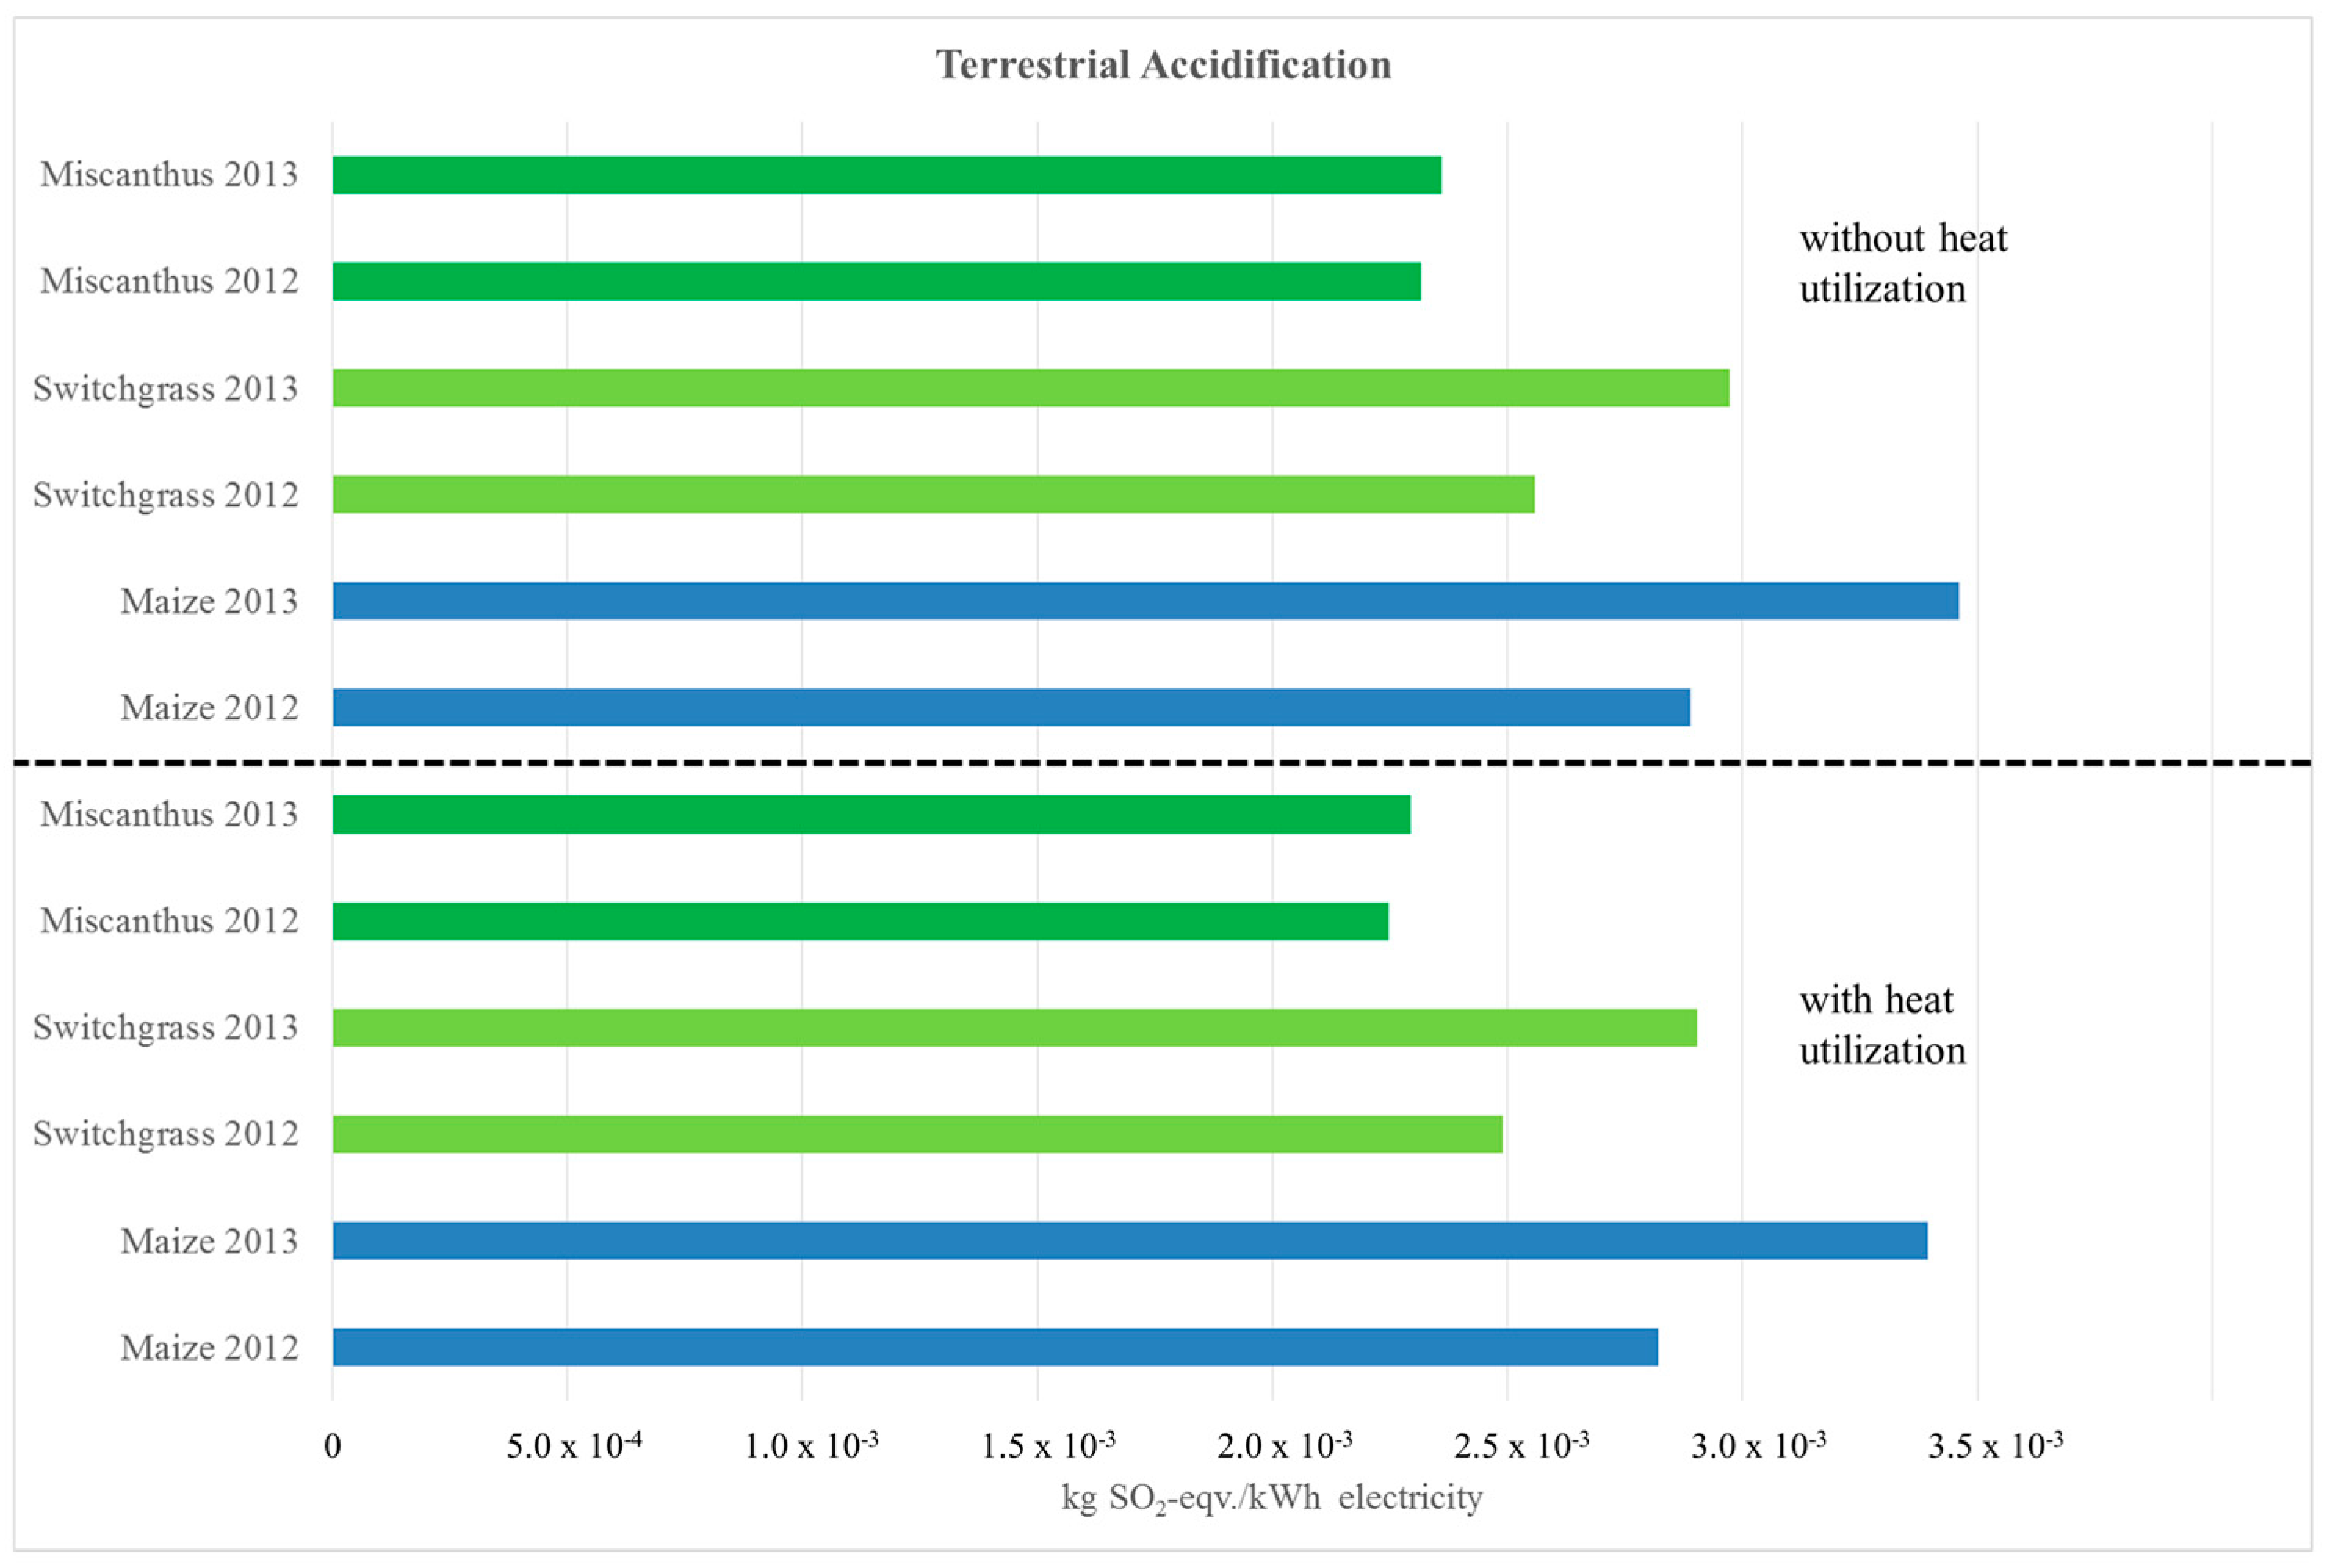
3.3. Terrestrial Acidification

All scenarios led to higher terrestrial acidification than the fossil references. Maize without heat utilization performed worst and led to emissions of 3.5 × 10⁻³ kg·SO2-eqv. (kWhel.)−1 (Figure 7). Miscanthus performed best with the lowest terrestrial acidification potential (Figure 7).
Fertilizer-induced emissions—especially ammonia—had the highest impact on terrestrial acidification for all crops and accounted on an average for around 20% of total emissions (Table 8). The second largest source of emissions responsible for terrestrial acidification was production of nitrogen fertilizer, followed by transport of the biomass (Table 8).

4. Discussion

Here the results of this study are considered in a broader context, also including other environmental aspects not modeled in the LCA. The discussion concludes with opportunities and challenges of the introduction of novel perennial C4 crops in the biogas sector.

4.1. Environmental Performance in Impact Categories Modelled in the LCA

The results of this study show that, as soon as more impact categories are assessed than climate change and fossil fuel depletion, the environmental performance of the bioenergy conversion route “biogas” is not so clear-cut. All three energy crops have a significantly better environmental profile than the fossil reference (German electricity mix) in the impact categories climate change (CC) and fossil fuel depletion (FFD). Similar findings have been reported in the literature [45,46]. However, all three energy crops showed significantly higher impacts than the fossil reference in the impact categories freshwater eutrophication (FE) and terrestrial acidification (TA). The results for marine eutrophication (ME) were more variable. Here, miscanthus (both years) and switchgrass (2012 only) had a significantly lower impact than the fossil reference, whereas maize had a significantly higher impact in 2013 due to the low yield. High biomass yields have been shown to be a crucial factor for favorable environmental performance [47]. Again, these results correspond to findings of other studies, which mainly also found a higher impact of energy-crop-derived biogas than the fossil reference in acidification and eutrophication potential [48,49,50].

4.1.1. Overall Impact of Process Steps in Impact Categories

The production of nitrogen fertilizer was identified as the most relevant process step in the impact categories FFD and CC and the second most relevant in ME. Fertilizer-induced emissions were identified as the most important flow in the categories FE and ME and second most important in CC and TA. Similar results have been reported in the literature and numerous studies have already described the strong impact of nitrogen fertilizer production and related direct and indirect emissions on FFD and CC (e.g., [39,46,50,51]). The present study also showed a strong impact of mineral nitrogen fertilizer application on eutrophication (FE and ME) and acidification potential of crop production. This seems logical, since nitrate is one of the major contributors to eutrophication and the nitrification process a major contributor to soil acidification [27].
In TA, direct CHP emissions were the most important flow. Rehl et al. [49] identified sulfur dioxide from the CHP as one of the most important contributors to the acidification potential. One possibility to reduce these emissions could be the upgrading of biogas to biomethane, because sulfur dioxide is almost completely removed during this process. In addition, new techniques for biomethane production (e.g., pressurized anaerobic digestion) could help reduce the carbon footprint of biomethane production in the near future, because the demand for energy-intensive compression is reduced in such approaches [52]. Lijó et al. [53] reported production of nitrogen fertilizer, fertilizer-induced emissions and emissions of agricultural management as important factors for the environmental performance of energy crops. In this study, emissions from agricultural management were found to be the third most relevant process in CC, FFD and ME for maize cultivation, but considerably less important for miscanthus and switchgrass.

4.1.2. Impact of the Process Steps for Each Crop

Emissions and fossil fuel depletion from production of nitrogen fertilizer and agricultural management and fertilizer-induced emissions were highest for maize in each of the considered impact categories. This is because maize production consumes more energy for soil cultivation and requires higher nitrogen fertilizer levels for high yields than the C4 perennial grasses. For maize, data from the treatment with the highest nitrogen fertilization (240 kg·N·ha−1) were used, which on long-term average yielded significantly higher than the medium fertilization rate (120 kg·N·ha−1). However, the high nitrogen fertilization is probably above the marginal revenue and a lower fertilization rate could reduce the environmental impact of maize. Nevertheless, the nitrogen demand of miscanthus and switchgrass are still lower than that of maize. In addition, for miscanthus and switchgrass, data from the treatment with the highest nitrogen fertilization rate (80 kg·N·ha-1) were used, in order to consider the higher nutrient removal by the green harvested biomass. Although green harvest increases the withdrawal of nitrogen compared to a spring harvest, the biomass of miscanthus and switchgrass contained approximately 60% less nitrogen than maize biomass (Table 3).
The annual cultivation of maize led also to significantly higher emissions and fossil fuel depletion for agricultural management in CC, ME and FFD. For this reasons, changing the crop production system from annual crops with a high nitrogen demand to perennial C4 crops with improved nutrient efficiency seems to be a very promising option for increasing the environmental sustainability of the biogas sector and the bioeconomy, as already described by Lewandowski [54]. Compared to maize, miscanthus and switchgrass showed in the scenarios without heat utilization 59%–73% and 25%–28% lower CC potential, 68%–79% and 28%–30% lower FFD potential, 57%–69% and 25%–28% lower FE potential, 53%–67% and 29% lower ME potential and 16%–26% and 9%–12% lower TA potential, respectively.
Considering all impact categories, miscanthus performed best amongst the three assessed crops. Especially in 2013, the yield and thereby the environmental performance of miscanthus was much more stable compared to maize and switchgrass. Both crops reacted more sensitively to the unfavorable weather conditions in 2013. This resulted in lower yields and is also reflected by the performance in the environmental impact categories. The higher stress tolerance and yield stability of miscanthus is therefore not only favorable for the farmer, but also from an environmental point of view.
The nutrient recycling via fermentation residues led to a significant credit for all crops, especially in the impact categories CC, FFD and ME. However, fermentation residue application on the perennial grasses miscanthus and switchgrass and resulting emissions need to be further investigated. Since the fermentation residues cannot be incorporated into the soil in such perennials, higher ammonia emissions could occur, which could lead to higher eutrophication and acidification potentials [48]. This needs to be further investigated to allow consideration of such an effect in future assessments of the environmental performance.

4.2. Other Environmental Aspects

In the section above, the environmental performance was analyzed in five impact categories and it was shown that the perennial grasses, especially miscanthus, performed better than the annual crop maize. However, the five considered impact categories are not sufficient for a holistic assessment of the environmental performance. Therefore, other aspects relevant to environmental performance are discussed in the following section.
Intensive soil cultivation in annual maize is accompanied by an increased risk of soil erosion, due to the slow youth development of the crop [6]. For annual maize, there is also a low to medium risk for soil compaction [55]. However, for green-harvested miscanthus and switchgrass the risk of soil compaction may be lower due to its perennial nature, but needs to be assessed to allow comparison. The combination of intensive soil cultivation and low amount of crop residues in silage maize has a negative impact on content of soil organic carbon. Both environmental aspects could be improved by changing substrate supply of biogas plants from maize to perennial C4 grasses, since miscanthus and switchgrass generally lead to an increase in soil organic carbon compared to annual cropping systems [11,56,57]. Under miscanthus, the largest proportion of the soil organic carbon is found in the topsoil, which can be explained by the high proportion of roots in the top 0.35 m [58]. The sequestration of carbon in the soil can increase the GHG mitigation potential significantly, especially if the cropping system is changed from annual to perennial [56,59]. In this study, the sequestration effect was not considered, because the effect of the green harvest on the root and rhizome development and on the soil carbon sequestration potential is not yet known. Therefore, the development of the soil organic carbon under green harvested miscanthus and switchgrass needs to be further investigated to determine the sequestration potential of this harvest regime.
Agricultural land occupation is another important environmental aspect, due to limited expansion potential for agricultural land and negative impacts from the transformation of natural land. In this paper, agricultural land occupation was not directly assessed, but the data in Table 1 show that maize required the smallest area (173 ha) of agricultural land in 2012 to supply the biogas plant with the required biomass. Changing the input substrate from maize to miscanthus or switchgrass increased the agricultural land demand in 2012 by 12% or 68%, respectively. Under unfavorable weather conditions in 2013, the agricultural land demand for miscanthus cropping was 20% lower and for switchgrass 73% higher than for maize cultivation. Agricultural land occupation for biogas production can lead to indirect land-use change (iLUC), which can significantly reduce the GHG mitigation potential and even lead to higher GWP than the fossil reference [14]. For this reason, the comparatively high agricultural land demand of switchgrass to deliver the required biomass substrate is a clear disadvantage compared to the other crops. In contrast, the area demand of miscanthus was only slightly higher and even lower when unfavorable weather conditions occurred for maize production. Again, the higher abiotic stress tolerance and yield stability of miscanthus can be seen as environmental advantage. However, both perennial C4 crops could be grown in future mainly on marginal or contaminated land [9,23]. This could reduce the pressure on agricultural land and expand the area available for biomass production.
Biodiversity is difficult to assess just by the crop itself, because it strongly depends on other factors, e.g., the distribution of fields in a landscape and structural elements such as hedges. However, modern agriculture is assumed to have a negative impact on the biodiversity by simplification of agricultural landscapes, e.g., large field sizes, and small amount of crop varieties which are grown in monoculture [4]. An increased number of crop species and a higher proportion of perennial cropping systems in modern agriculture is seen as one option to promote biodiversity [4]. For this reason, replacing biogas maize with miscanthus or switchgrass could positively affect the biodiversity by adding novel, perennial crops to the agricultural landscapes. However, it should be noted that the impact on soil biodiversity may be influenced by the choice of the perennial biomass crop [60]. Furthermore, both perennials can be characterized by their comparatively low-input crop management, after their successful establishment in year one. For miscanthus, a higher abundance of insects, spiders and earthworms than in arable land is reported, as well as additional niches for birds and, provided a spring harvest is performed, over winter cover for small mammals in intensive arable regions [11,61]. For switchgrass, similar positive effects can be expected, which leads to the assumption, that both could increase the biodiversity and structure-richness of agricultural landscapes. Again, the effect of the pre-winter harvest, which clearly removes the winter cover for small mammals and reduces the mulch layer, is not yet known and needs to be investigated. However, both crops also induce risks for biodiversity because they are not native to Europe and could potentially appear as invasive species. Miscanthus x giganteus has a very low invasiveness risk, because it does not produce fertile seeds and no escapes were observed over more than two decades of M. x giganteus production in Europe. Current miscanthus breeding efforts aim to produce fertile genotypes that can be propagated by seeds [10], but several mechanisms to avoid seed escape are incorporated, including preferring candidates which require a very long vegetation period for seed production to avoid viable seeds being produced in regions of biomass cultivation [9]. It is also necessary to mention that miscanthus as well as switchgrass seedlings have a very low competitiveness compared to weeds and a slow youth development. For this reason it is quite unlikely that they become invasive species in Europe. Nonetheless, the invasiveness potential of novel miscanthus genotypes and switchgrass needs to be investigated and monitored.
Finally, the socioeconomic aspects of landscape appearance need to be considered. Crops such as maize are often criticized in the public, due to their height and monotony. The same could appear for miscanthus, due to its height and density in well-established commercial fields. Smaller and nicely flowering miscanthus genotypes or switchgrass could be experienced more favorably and might influence the appearance of landscapes more positively. However, this could compromise the yield and lead to a trade-off between yield and public acceptance. Public acceptance could also be positively influenced by using smaller fields or strip cropping instead large monoculture fields.

4.3. Implementation—Chances and Challenges

In this study, it is shown that implementation of perennial C4 grasses for biogas production can have significant environmental benefits. From an environmental point of view, miscanthus in particular would be a desirable crop for biogas production. The main weak point of switchgrass is clearly its lower yield potential than miscanthus and related to that its higher area demand, fossil fuel consumption and emissions. For the farmer, the implementation of miscanthus and switchgrass as biogas crops is accompanied by opportunities and challenges, which are discussed in the following section but require further research.
This study is based on methane yields measured in a batch test using milled biomass. In order to transfer these values to a full-scale biogas plant, a pre-treatment of the biomass was considered for miscanthus and switchgrass, which leads to a higher electricity demand for plant operation. For this reason, the electricity demand for miscanthus and switchgrass was assumed to be almost twice as high as that for maize. Before implementation, the methane yield, the necessity of a pre-treatment and the energy consumption of such a pre-treatment should be verified under more realistic conditions. Ensiling of miscanthus biomass, and presumably also switchgrass, appears possible [19], but also needs to be demonstrated in practice.
The long-term performance of green-harvested miscanthus is one of the major uncertainties for its biogas utilization, because miscanthus reacts sensitively to very early mid-season harvest, but tolerates green harvest in late autumn [18]. However, it is not yet known if green-harvested miscanthus is productive for as long as a spring-harvested crop (more than 20 years) and if recycling of fermentation residues is sufficient to maintain its productivity. In addition, the farmer has to dedicate arable land to miscanthus for several years to achieve return on investment, due to the high establishment costs. However, current research focuses on reducing establishment costs by developing seed-based genotypes, which may allow direct sowing in future [10]. Further, most biogas plants are designed for a minimum of 20 years’ operation, which would fit in very well with the expected productive lifetime of miscanthus. Cost-effective miscanthus establishment offers the chance of significantly reducing biomass costs. As shown in this paper, the yield of miscanthus is not as sensitive as annual maize to unfavorable weather conditions, which may become more common in future due to climate change. One of the main reasons for the low maize yield was the very late sowing date and the early summer drought stress. In miscanthus, planting is only required once in 20–30 years and the established crop benefits from winter soil moisture. Therefore, miscanthus seems very suitable for risk mitigation of such weather conditions.
In contrast to miscanthus, switchgrass can be established cheaply via direct sowing of seeds. However, the establishment of switchgrass is difficult due to an often low germination rate, low competitiveness of seedlings and limited availability of herbicides. Current research focuses on the optimization of the establishment method and herbicide testing [62]. Nevertheless, early green harvest of switchgrass seems less problematic than in miscanthus and even a double cut is possible [21]. The shorter productive life of approximately 15 years, lower investment costs and the ability of direct sowing may increase farmers’ willingness to adopt this crop. However, the lower yield potential limits its implementation to very poor and shallow soils, where it is likely to perform better than miscanthus [23].
From an environmental point of view, miscanthus cultivation for biogas production is generally recommended if the biogas plant technology is suitable for the digestion of fibrous substrates or adequate pre-treatment options are available.

Supplementary Materials

The following are available online at www.mdpi.com/2071-1050/9/1/5/s1, Table S1: Climate change in kg CO2-eqv. per kg DM biomass, Table S2: Freshwater eutrophication in kg P-eqv. per kg DM biomass, Table S3: Fossil fuel depletion potential in kg oil-eqv. per kg DM biomass, Table S4: Marine eutrophication potential in kg N-eqv. per kg DM biomass, Table S5: Terrestrial acidification potential in kg SO2-eqv. per kg DM biomass.

Acknowledgments

This work was supported partly by a grant from the Ministry of Science, Research and the Arts of Baden-Württemberg (funding code: 7533-10-5-70) as part of the BBW ForWerts Graduate Program. The authors are grateful to Dagmar Mezger and Martin Zahner for their support in performing the laboratory analyses and to the staff of the research station Ihinger Hof, especially Thomas Truckses, for maintaining and managing the field trial. The authors would also like to thank to Nicole Gaudet for editing the manuscript.

Author Contributions

Andreas Kiesel collected the samples, performed the biogas batch test and analyzed the data as well as led the writing process and contributed mainly to the Introduction and the Discussion Sections. Moritz Wagner performed the LCA modeling and contributed mainly to writing Material and Methods and Results Sections. He also prepared the figures and tables. Iris Lewandowski added valuable contributions to each section and in manifold discussions.

Conflicts of Interest

The authors declare no conflict of interest. The funding sponsors had no role in the design of the study; in the collection, analyses, or interpretation of data; in the writing of the manuscript, and in the decision to publish the results.

References

  1. Weiland, P. Production and Energetic Use of Biogas from Energy Crops and Wastes in Germany. ABAB 2003, 109, 263–274. [Google Scholar] [CrossRef]
  2. FNR. Basisdaten Bioenergie Deutschland 2015: Festbrennstoffe, Biokraftstoffe, Biogas; FNR: Gülzow, Germany, 2015. [Google Scholar]
  3. Zürcher, A. Dauerkulturen als Alternativen zu Mais: Wildartenmischungen, Topinambur, Durchwachsene Silphie, Virginiamalve und Riesenweizengras. Workshop “Pflanzliche Rohstoffe zur Biogasgewinnung” at LTZ Augustenberg on 16 October 2014. Available online: http://www.ltz-bw.de/pb/Lde/Startseite/Service/Nachlese#anker2300415 (accessed on 20 December 2016).
  4. Altieri, M.A. The ecological role of biodiversity in agroecosystems. Agric. Ecosyst. Environ. 1999, 74, 19–31. [Google Scholar] [CrossRef]
  5. Svoboda, N.; Taube, F.; Wienforth, B.; Kluß, C.; Kage, H.; Herrmann, A. Nitrogen leaching losses after biogas residue application to maize. Soil Tillage Res. 2013, 130, 69–80. [Google Scholar] [CrossRef]
  6. Vogel, E.; Deumlich, D.; Kaupenjohann, M. Bioenergy maize and soil erosion—Risk assessment and erosion control concepts. Geoderma 2016, 261, 80–92. [Google Scholar] [CrossRef]
  7. Herrmann, A. Biogas Production from Maize: Current State, Challenges and Prospects. 2. Agronomic and Environmental Aspects. Bioenergy Res. 2013, 6, 372–387. [Google Scholar] [CrossRef]
  8. Clifton-Brown, J.; Schwarz, K.-U.; Hastings, A. History of the development of Miscanthus as a bioenergy crop: From small beginnings to potential realisation. Biol. Environ. Proc. R. Irish Acad. 2015, 115B, 1–13. [Google Scholar] [CrossRef]
  9. Lewandowski, I.; Clifton-Brown, J.; Trindade, L.; van der Linden, G.; Schwarz, K.; Müller-Sämann, K.; Anisimov, A.; Chen, C.-L.; Dolstra, O.; Donnison, I.S.; et al. Progress on optimizing miscanthus biomass production for the European bioeconomy: Results of the EU FP7 project OPTIMISC. Front. Plant Sci. 2016. [Google Scholar] [CrossRef] [PubMed]
  10. Clifton-Brown, J.; Hastings, A.; Mos, M.; McCalmont, J.P.; Ashman, C.; Awty-Carroll, D.; Cerazy, J.; Chiang, Y.-C.; Cosentino, S.; Cracroft-Eley, W.; et al. Progress in upscaling Miscanthus biomass production for the European bio- economy with seed based hybrids. GCB Bioenergy 2016. [Google Scholar] [CrossRef]
  11. McCalmont, J.P.; Hastings, A.; McNamara, N.P.; Richter, G.M.; Robson, P.; Donnison, I.S.; Clifton-Brown, J. Environmental costs and benefits of growing Miscanthus for bioenergy in the UK. GCB Bioenergy 2015. [Google Scholar] [CrossRef]
  12. Lewandowski, I.; Schmidt, U. Nitrogen, energy and land use efficiencies of miscanthus, reed canary grass and triticale as determined by the boundary line approach. Agric. Ecosyst. Environ. 2006, 112, 335–346. [Google Scholar] [CrossRef]
  13. Cadoux, S.; Riche, A.B.; Yates, N.E.; Machet, J.-M. Nutrient requirements of Miscanthus x giganteus: Conclusions from a review of published studies. Biomass Bioenergy 2012, 38, 14–22. [Google Scholar] [CrossRef]
  14. Styles, D.; Gibbons, J.; Williams, A.P.; Dauber, J.; Stichnothe, H.; Urban, B.; Chadwick, D.R.; Jones, D.L. Consequential life cycle assessment of biogas, biofuel and biomass energy options within an arable crop rotation. GCB Bioenergy 2015, 7, 1305–1320. [Google Scholar] [CrossRef]
  15. Felten, D.; Fröba, N.; Fries, J.; Emmerling, C. Energy balances and greenhouse gas-mitigation potentials of bioenergy cropping systems (Miscanthus, rapeseed, and maize) based on farming conditions in Western Germany. Renew. Energy 2013, 55, 160–174. [Google Scholar] [CrossRef]
  16. Mayer, F.; Gerin, P.A.; Noo, A.; Lemaigre, S.; Stilmant, D.; Schmit, T.; Leclech, N.; Ruelle, L.; Gennen, J.; von Francken-Welz, H.; et al. Assessment of energy crops alternative to maize for biogas production in the Greater Region. Bioresour. Technol. 2014, 166, 358–367. [Google Scholar] [CrossRef] [PubMed]
  17. Wahid, R.; Nielsen, S.F.; Hernandez, V.M.; Ward, A.J.; Gislum, R.; Jørgensen, U.; Møller, H.B. Methane production potential from Miscanthus sp: Effect of harvesting time, genotypes and plant fractions. Biosyst. Eng. 2015, 133, 71–80. [Google Scholar] [CrossRef]
  18. Kiesel, A.; Lewandowski, I. Miscanthus as biogas substrate—Cutting tolerance and potential for anaerobic digestion. GCB Bioenergy 2015. [Google Scholar] [CrossRef]
  19. Whittaker, C.; Hunt, J.; Misselbrook, T.; Shield, I. How well does Miscanthus ensile for use in an anaerobic digestion plant? Biomass Bioenergy 2016, 88, 24–34. [Google Scholar] [CrossRef]
  20. McLaughlin, S.B.; Adams Kszos, L. Development of switchgrass (Panicum virgatum) as a bioenergy feedstock in the United States. Biomass Bioenergy 2005, 28, 515–535. [Google Scholar] [CrossRef]
  21. Masse, D.; Gilbert, Y.; Savoie, P.; Belanger, G.; Parent, G.; Babineau, D. Methane yield from switchgrass harvested at different stages of development in Eastern Canada. Bioresour. Technol. 2010, 101, 9536–9541. [Google Scholar] [CrossRef] [PubMed]
  22. Heaton, E. A quantitative review comparing the yields of two candidate C4 perennial biomass crops in relation to nitrogen, temperature and water. Biomass Bioenergy 2004, 27, 21–30. [Google Scholar] [CrossRef]
  23. Lewandowski, I.; Scurlock, J.M.; Lindvall, E.; Christou, M. The development and current status of perennial rhizomatous grasses as energy crops in the US and Europe. Biomass Bioenergy 2003, 25, 335–361. [Google Scholar] [CrossRef]
  24. International Organization for Standardization (ISO). ISO 14040: Environmental Management—Life Cycle Assessment—Principles and Framework, 2nd ed.; ISO: Geneva, Switzerland, 2006. [Google Scholar]
  25. International Organization for Standardization (ISO). ISO 14044: Environmental Management—Life Cycle Assessment—Requirements and Guidelines; ISO: Geneva, Switzerland, 2006. [Google Scholar]
  26. Wagner, M.; Lewandowski, I. Relevance of environmental impact categories for perennial biomass production. GCB Bioenergy 2016. [Google Scholar] [CrossRef]
  27. Rice, K.C.; Herman, J.S. Acidification of Earth: An assessment across mechanisms and scales. Appl. Geochem. 2012, 27, 1–14. [Google Scholar] [CrossRef]
  28. EEA. Source Apportionment of Nitrogen and Phosphorus Inputs into the Aquatic Environment; EEA Report No. 7; European Environment Agency: Copenhagen, Denmark, 2005; p. 48. [Google Scholar]
  29. Boehmel, C.; Lewandowski, I.; Claupein, W. Comparing annual and perennial energy cropping systems with different management intensities. Agric. Syst. 2008, 96, 224–236. [Google Scholar] [CrossRef]
  30. Iqbal, Y.; Gauder, M.; Claupein, W.; Graeff-Hönninger, S.; Lewandowski, I. Yield and quality development comparison between miscanthus and switchgrass over a period of 10 years. Energy 2015, 89, 268–276. [Google Scholar] [CrossRef]
  31. GaBi Database. Service Pack; GaBi Software System; Thinkstep AG: Leinfelden-Echterdingen, Germany, 2016. [Google Scholar]
  32. Bouwman, A.F.; Boumans, L.J.M.; Batjes, N.H. Modeling global annual N2O and NO emissions from fertilized fields. Glob. Biogeochem. Cycles 2002, 16, 28-1–28-9. [Google Scholar] [CrossRef]
  33. Intergovernmental Panel on Climate Change (IPCC). Guidelines for National Greenhouse Gas Inventories; Prepared by the National Greenhouse Gas Inventories Programme; Eggleston, H.S., Buendia, L., Miwa, K., Ngara, T., Tanabe, K., Eds.; IGES: Hayama, Japan, 2006. [Google Scholar]
  34. Faist Emmenegger, M.; Reinhard, J.; Zah, R. Sustainability Quick Check for Biofuels—Intermediate Background Report; Agroscope Reckenholz-Tänikon Research Station ART: Dübendorf, Switzerland, 2009. [Google Scholar]
  35. EMEP/CORINAIR. Joint EMEP/CORINAIR Atmospheric Emission Inventory Guidebook, 3rd ed.; European Environment Agency: Copenhagen, Denmark, 2001. [Google Scholar]
  36. Van der Werf, H.M.; Petit, J.; Sanders, J. The environmental impacts of the production of concentrated feed: The case of pig feed in Bretagne. Agric. Syst. 2005, 83, 153–177. [Google Scholar] [CrossRef]
  37. Walla, C.; Schneeberger, W. The optimal size for biogas plants. Biomass Bioenergy 2008, 32, 551–557. [Google Scholar] [CrossRef]
  38. Bacenetti, J.; Fusi, A.; Negri, M.; Guidetti, R.; Fiala, M. Environmental assessment of two different crop systems in terms of biomethane potential production. Sci. Total Environ. 2014, 466–467, 1066–1077. [Google Scholar] [CrossRef] [PubMed]
  39. Gützloe, A.; Thumm, U.; Lewandowski, I. Influence of climate parameters and management of permanent grassland on biogas yield and GHG emission substitution potential. Biomass Bioenergy 2014, 64, 175–189. [Google Scholar] [CrossRef]
  40. Faustzahlen Biogas: 3. Ausgabe; Kuratorium für Technik und Bauwesen in der Landwirtschaft: Darmstadt, Germany, 2013.
  41. Bachmaier, J.; Effenberger, M.; Gronauer, A. Greenhouse gas balance and resource demand of biogas plants in agriculture. Eng. Life Sci. 2010, 10, 560–569. [Google Scholar] [CrossRef]
  42. Weidema, B.P.; Bauer, C.; Hischier, R. The Ecoinvent Database: Overview and Methodology. Data Quality Guideline for the Ecoinvent Database Version 3. 2013. Available online: http://www.ecoinvent.org/files/dataqualityguideline_ecoinvent_3_20130506.pdf (accessed on 20 December 2016).
  43. Naumann, C.; Bassler, R. Die Chemische Untersuchung von Futtermitteln; VDLUFA-Verl.: Darmstadt, Germany, 1976/2012. [Google Scholar]
  44. Goedkoop, M.; Heijungs, R.; Huijbregts, M.; De, S.A.; Struijs, J.; Van, Z.R. ReCiPe 2008. A life Cycle Impact Assessment Method Which Comprises Harmonised Category Indicators at the Midpoint and the Endpoint Level, First Edition Report I. Characterisation; VROM: Den Haag, The Netherlands, 2008. [Google Scholar]
  45. Gerin, P.A.; Vliegen, F.; Jossart, J.-M. Energy and CO2 balance of maize and grass as energy crops for anaerobic digestion. Bioresour. Technol. 2008, 99, 2620–2627. [Google Scholar] [CrossRef] [PubMed]
  46. Hijazi, O.; Munro, S.; Zerhusen, B.; Effenberger, M. Review of life cycle assessment for biogas production in Europe. Renew. Sustain. Energy Rev. 2016, 54, 1291–1300. [Google Scholar] [CrossRef]
  47. Meyer, F.; Wagner, M.; Lewandowski, I. Optimizing GHG emission and energy-saving performance of miscanthus-based value chains. Biomass Conv. Bioref. 2016. [Google Scholar] [CrossRef]
  48. Hartmann, J.K. Life-Cycle-Assessment of Industrial Scale Biogas Plants; eDiss: Göttingen, Germany, 2006. [Google Scholar]
  49. Rehl, T.; Lansche, J.; Müller, J. Life cycle assessment of energy generation from biogas—Attributional vs. consequential approach. Renew. Sustain. Energy Rev. 2012, 16, 3766–3775. [Google Scholar] [CrossRef]
  50. González-García, S.; Bacenetti, J.; Negri, M.; Fiala, M.; Arroja, L. Comparative environmental performance of three different annual energy crops for biogas production in Northern Italy. J. Clean. Prod. 2013, 43, 71–83. [Google Scholar] [CrossRef]
  51. Cherubini, F. GHG balances of bioenergy systems—Overview of key steps in the production chain and methodological concerns. Renew. Energy 2010, 35, 1565–1573. [Google Scholar] [CrossRef]
  52. Budzianowski, W.M.; Postawa, K. Renewable energy from biogas with reduced carbon dioxide footprint: Implications of applying different plant configurations and operating pressures. Renew. Sustain. Energy Rev. 2016. [Google Scholar] [CrossRef]
  53. Lijó, L.; González-García, S.; Bacenetti, J.; Fiala, M.; Feijoo, G.; Lema, J.M.; Moreira, M.T. Life Cycle Assessment of electricity production in Italy from anaerobic co-digestion of pig slurry and energy crops. Renew. Energy 2014, 68, 625–635. [Google Scholar] [CrossRef]
  54. Lewandowski, I. Securing a sustainable biomass supply in a growing bioeconomy. Glob. Food Secur. 2015, 6, 34–42. [Google Scholar] [CrossRef]
  55. Goetze, P.; Ruecknagel, J.; Jacobs, A.; Marlander, B.; Koch, H.-J.; Christen, O. Environmental impacts of different crop rotations in terms of soil compaction. J. Environ. Manag. 2016, 181, 54–63. [Google Scholar] [CrossRef] [PubMed]
  56. Zeri, M.; Anderson-Teixeira, K.; Hickman, G.; Masters, M.; De Lucia, E.; Bernacchi, C.J. Carbon exchange by establishing biofuel crops in Central Illinois. Agric. Ecosyst. Environ. 2011, 144, 319–329. [Google Scholar] [CrossRef]
  57. Gauder, M.; Billen, N.; Zikeli, S.; Laub, M.; Graeff-Hönninger, S.; Claupein, W. Soil carbon stocks in different bioenergy cropping systems including subsoil. Soil Tillage Res. 2016, 155, 308–317. [Google Scholar] [CrossRef]
  58. Gioacchini, P.; Cattaneo, F.; Barbanti, L.; Montecchio, D.; Ciavatta, C.; Marzadori, C. Carbon sequestration and distribution in soil aggregate fractions under Miscanthus and giant reed in the Mediterranean area. Soil Tillage Res. 2016, 163, 235–242. [Google Scholar] [CrossRef]
  59. Meyer-Aurich, A.; Lochmann, Y.; Klauss, H.; Prochnow, A. Comparative Advantage of Maize- and Grass-Silage Based Feedstock for Biogas Production with Respect to Greenhouse Gas Mitigation. Sustainability 2016, 8, 617. [Google Scholar] [CrossRef]
  60. Schrama, M.; Vandecasteele, B.; Carvalho, S.; Muylle, H.; van der Putten, W.H. Effects of first- and second-generation bioenergy crops on soil processes and legacy effects on a subsequent crop. GCB Bioenergy 2016, 8, 136–147. [Google Scholar] [CrossRef]
  61. Clapham, S.J.; Slater, F.M. The biodiversity of established biomass grass crops. Aspects of Appl. Biol. 2008, 325–330. [Google Scholar]
  62. Sadeghpour, A.; Hashemi, M.; DaCosta, M.; Gorlitsky, L.E.; Jahanzad, E.; Herbert, S.J. Switchgrass Establishment and Biomass Yield Response to Seeding Date and Herbicide Application. Agronomy J. 2015, 107, 142. [Google Scholar] [CrossRef]
Figure 1. System description and boundaries for miscanthus, switchgrass (left) and maize (right) biomass cultivation, the fermentation to biogas and the subsequent utilization in a CHP unit.
Sustainability 09 00005 g001
Figure 2. Temperature and rainfall in 2012 and 2013 at the field site on the research station “Ihinger Hof”. For comparison the 10-year average temperature and rainfall from 2003 to 2012 is shown.
Sustainability 09 00005 g002
Figure 3. Assessment of the net benefits in kg·CO2-eqv. of substituting 1 kWhel. of the German electricity mix by power generated via combustion of the biogas in a CHP.
Sustainability 09 00005 g003
Figure 4. Assessment of the net benefits in kg·oil-eqv. of substituting 1 kWhel. of the German electricity mix by power generated via combustion of the biogas in a CHP.
Sustainability 09 00005 g004
Figure 5. Assessment of the net impacts in kg·P-eqv. of substituting 1 kWhel. of the German electricity mix by power generated via combustion of the biogas in a CHP.
Sustainability 09 00005 g005
Figure 6. Assessment of the net benefits and impacts in kg·N-eqv. of substituting 1 kWhel. of the German electricity mix by power generated via combustion of the biogas in a CHP.
Sustainability 09 00005 g006
Figure 7. Assessment of the net benefits and impacts in kg·SO2-eqv. of substituting 1 kWhel. of the German electricity mix by power generated via combustion of the biogas in a CHP.
Sustainability 09 00005 g007
Table 1. Summary of the in- and outputs of the three energy crops.
Input/OutputUnitMaizeSwitchgrassMiscanthus
201220132012201320122013
NKg·yr−1·ha−124024080808080
K2OKg·yr−1·ha−1304204137137128128
P2O5Kg·yr−1·ha−110010037373232
HerbicidesKg·yr−1·ha−16.056.051.321.321.3751.375
Dry matter yieldKg·yr−1·ha−118915126161422783692276018929
Dry matter content%25.421.138.936.243.441.2
Methane yieldm3 CH4 yr−1·ha−1559436353328209550064542
Agricultural land required for biogas plantha·yr−1173266291461194213
Table 2. CHP unit—technical characteristics.
Technical CharacteristicsUnit
Full load hours7800h
Plant output electrical500kWhel.
Plant output total1219kWh
Electrical efficiency41% of plant total output
Thermal efficiency41% of plant total output
Inherent heat demand20% of total heat production
Inherent power consumption—perennial crops12% of total power production
Inherent power consumption—silage maize6.6% of total power production
Table 3. Nutrients in the biomass of the analyzed energy crops and plant available nutrients which can be recycled through the use of fermentation residues per FU.
NutrientMiscanthusSwitchgrassMaize
in % of Biomass (d.b.)in kg/FUin % of Biomass (d.b.)in kg/FUin % of Biomass (d.b.)in kg/FU
N0.470.00360.500.00351.290.0058
P0.090.00100.100.00100.180.0011
K1.110.01191.030.01051.290.0083
Table 4. Assessment of the climate change in kg·CO2-eqv. of 1 kWhel. generated via the production and fermentation of dedicated energy crops and combustion of the biogas in CHP.
Processes/FlowsMaize per FUSwitchgrass per FUMiscanthus per FUUnit
201220132012201320122013
Input substratesProduction of nitrogen fertilizer0.0770.11850.05040.08000.03350.0369kg·CO2-eqv.
Production of potassium fertilizer0.00480.00750.00430.00680.00270.0029kg·CO2-eqv.
Production of phosphate fertilizer0.00640.00990.00470.00740.00270.0030kg·CO2-eqv.
Recycling of nutrients−0.0415−0.0415−0.0279−0.0279−0.0288−0.0288kg·CO2-eqv.
Herbicides0.00280.00440.00120.00190.00080.0009kg·CO2-eqv.
Seeds/Rhizomes0.00020.00030.00010.00020.00030.0003kg·CO2-eqv.
AgriculturaloperationsAgricultural management0.00750.01150.0020.00320.00120.0013kg·CO2-eqv.
Harvest0.00380.00580.0070.01110.00450.0049kg·CO2-eqv.
Transport input substrates0.00120.00180.00080.00130.00060.0006kg·CO2-eqv.
Transport biomass0.00490.00610.00470.00470.00450.0044kg·CO2-eqv.
Ensilage0.00030.00040.00050.00090.00040.0004kg·CO2-eqv.
Fertilizer-induced emissions0.05490.09060.04720.07250.02810.0311kg·CO2-eqv.
CHPBiomass production system0.12230.21540.09500.16220.05040.0580kg·CO2-eqv.
CHP—Direct emissions000000kg·CO2-eqv.
Credits heat utilization−0.1021−0.1021−0.1021−0.1021−0.1021−0.1021kg·CO2-eqv.
TotalTotal with credits0.02020.1132−0.00710.0600−0.0518−0.0441kg·CO2-eqv.
Total without credits0.12230.21540.09500.16220.05040.0580kg·CO2-eqv.
Table 5. Assessment of the fossil fuel depletion in kg·oil-eqv. of 1 kWhel. generated via the production and fermentation of dedicated energy crops and combustion of the biogas in CHP.
Processes/FlowsMaize per FUSwitchgrass per FUMiscanthus per FUUnit
201220132012201320122013
Input substratesProduction of nitrogen fertilizer0.015980.024600.010460.016610.006950.00766kg·oil-eqv.
Production of potassium fertilizer0.002060.003170.001820.002890.001130.00125kg·oil-eqv.
Production of phosphate fertilizer0.003230.004970.002340.003720.001350.00148kg·oil-eqv.
Recycling of nutrients−0.01020−0.01020−0.00742−0.00742−0.00774−0.00774kg·oil-eqv.
Herbicides0.001280.001960.000540.000870.000380.00042kg·oil-eqv.
Seeds/Rhizomes0.000040.000050.000020.000030.000070.00008kg·oil-eqv.
AgriculturaloperationsAgricultural management0.002380.003670.000640.001010.000380.00042kg·oil-eqv.
Harvest0.001210.001870.002220.003530.001430.00157kg·oil-eqv.
Transport input substrates0.000370.000570.000270.000430.000190.00021kg·oil-eqv.
Transport biomass0.001570.001940.001510.001520.001440.00139kg·oil-eqv.
Ensilage0.000090.000140.000170.000280.000120.00013kg·oil-eqv.
Fertilizer-induced emissionsn.a.n.a.n.a.n.a.n.a.n.a.kg·oil-eqv.
CHPBiomass production system0.018010.032740.012580.023460.005690.00687kg·oil-eqv.
CHP—Direct emissionsn.a.n.a.n.a.n.a.n.a.n.a.kg·oil-eqv.
Credits heat utilization−0.03948−0.03948−0.03948−0.03948−0.03948−0.03948kg·oil-eqv.
TotalTotal with credits−0.02147−0.00674−0.02691−0.01602−0.03379−0.03262kg·oil-eqv.
Total without credits0.018010.032740.012580.023460.005690.00687kg·oil-eqv.
Table 6. Assessment of the freshwater eutrophication in kg·P-eqv. of 1 kWhel. generated via the production and fermentation of dedicated energy crops and combustion of the biogas in CHP.
Processes/FlowsMaize per FUSwitchgrass per FUMiscanthus per FUUnit
201220132012201320122013
Input substratesProduction of nitrogen fertilizer1.18 × 10−71.82 × 10−77.74 × 10−81.23 × 10−75.14 × 10−85.67 × 10⁻⁸kg·P-eqv.
Production of potassium fertilizer7.21 × 10−91.11 × 10−86.38 × 10−91.01 × 10−83.96 × 10−94.36 × 10⁻⁹kg·P-eqv.
Production of phosphate fertilizer7.56 × 10−81.16 × 10−75.49 × 10−88.72 × 10−83.16 × 10−83.48 × 10⁻⁸kg·P-eqv.
Recycling of nutrients−9.63 × 10⁻⁸−9.63 × 10⁻⁸−7.09 × 10⁻⁸−7.09 × 10⁻⁸−7.30 × 10⁻⁸−7.30 × 10⁻⁸kg·P-eqv.
Herbicides 1.47 × 10−82.26 × 10−86.28 × 10−99.97 × 10−94.36 × 10−94.80 × 10−9kg·P-eqv.
Seeds/Rhizomes1.34 × 10−72.07 × 10−72.88 × 10−84.58 × 10−82.76 × 10−73.04 × 10⁻⁷kg·P-eqv.
AgriculturaloperationsAgricultural management4.91 × 10−87.56 × 10−81.31 × 10−82.09 × 10−87.91 × 10−98.72 × 10⁻⁹kg·P-eqv.
Harvest2.50 × 10−83.85 × 10−84.58 × 10−87.28 × 10−82.94 × 10−83.24 × 10⁻⁸kg·P-eqv.
Transport input substrates7.63 × 10−91.17 × 10−85.55 × 10−98.82 × 10−93.87 × 10−94.27 × 10⁻⁹kg·P-eqv.
Transport biomass3.23 × 10−84.00 × 10−83.12 × 10−83.13 × 10−82.97 × 10−82.87 × 10⁻⁸kg·P-eqv.
Ensilage2.80 × 10−92.80 × 10−95.67 × 10−95.67 × 10−92.62 × 10−92.62 × 10⁻⁹kg·P-eqv.
Fertilizer-induced emissions2.34 × 10−53.60 × 10−51.70 × 10−52.70 × 10−59.78 × 10−61.08 × 10⁻⁵kg·P-eqv.
CHPBiomass production system2.38 × 10−53.67 × 10−51.72 × 10−52.74 × 10−51.01 × 10−51.12 × 10⁻⁵kg·P-eqv.
CHP—Direct emissions000000kg·P-eqv.
Credits heat utilization−4.46 × 10⁻⁹−4.46 × 10⁻⁹−4.46 × 10⁻⁹−4.46 × 10⁻⁹−4.46 × 10⁻⁹−4.46 × 10⁻⁹kg·P-eqv.
TotalTotal with credits2.38 × 10−53.66 × 10−51.72 × 10−52.73 × 10−51.01 × 10−51.12 × 10⁻⁵kg·P-eqv.
Total without credits2.38 × 10−53.67 × 10−51.72 × 10−52.74 × 10−51.01 × 10−51.12 × 10⁻⁵kg·P-eqv.
Table 7. Assessment of the marine eutrophication in kg·N-eqv. of 1 kWhel. generated via the production and fermentation of dedicated energy crops and combustion of the biogas in CHP.
Processes/FlowsMaize per FUSwitchgrass per FUMiscanthus per FUUnit
201220132012201320122013
Input substratesProduction of nitrogen fertilizer2.60 × 10−54.01 × 10−51.70 × 10−52.70 × 10−51.13 × 10−51.25 × 10⁻⁵kg·N-eqv.
Production of potassium fertilizer5.80 × 10−78.92 × 10−75.13 × 10−78.14 × 10−73.18 × 10−73.51 × 10⁻⁷kg·N-eqv.
Production of phosphate fertilizer1.22 × 10−61.87 × 10−68.83 × 10−71.40 × 10−65.08 × 10−75.60 × 10⁻⁷kg·N-eqv.
Recycling of nutrients−1.29 × 10⁻⁵−1.29 × 10⁻⁵−8.18 × 10⁻⁶−8.18 × 10⁻⁶−8.36 × 10⁻⁶−8.36 × 10⁻⁶kg·N-eqv.
Herbicides 3.75 × 10−75.76 × 10−71.60 × 10−72.54 × 10−71.11 × 10−71.22 × 10−7kg·N-eqv.
Seeds/Rhizomes1.89 × 10−62.91 × 10−61.06 × 10−61.69 × 10−61.64 × 10−61.80 × 10⁻⁶kg·N-eqv.
Agricultural operationsAgricultural management4.20 × 10−66.46 × 10−61.18 × 10−61.87 × 10−67.05 × 10−77.77 × 10⁻⁷kg·N-eqv.
Harvest2.10 × 10−63.23 × 10−63.85 × 10−66.11 × 10−62.47 × 10−62.72 × 10⁻⁶kg·N-eqv.
Transport input substrates2.97 × 10−74.56 × 10−72.16 × 10−73.43 × 10−71.50 × 10−71.66 × 10⁻⁷kg·N-eqv.
Transport biomass2.97 × 10−63.67 × 10−62.86 × 10−62.87 × 10−62.72 × 10−62.64 × 10⁻⁶kg·N-eqv.
Ensilage1.94 × 10−72.98 × 10−73.80 × 10−76.03 × 10−72.52 × 10−72.78 × 10⁻⁷kg·N-eqv.
Fertilizer-induced emissions4.09 × 10−56.29 × 10−52.67 × 10−54.25 × 10−51.78 × 10−51.96 × 10⁻⁵kg·N-eqv.
CHPBiomass production system6.78 × 10−51.10 × 10−44.67 × 10−57.73 × 10−52.96 × 10−53.31 × 10⁻⁵kg·N-eqv.
CHP-Direct emissions4.58 × 10−64.58 × 10−64.58 × 10−64.58 × 10−64.58 × 10−64.58 × 10⁻⁶kg·N-eqv.
Credits heat utilization−3.04 × 10⁻⁶−3.04 × 10⁻⁶−3.04 × 10⁻⁶−3.04 × 10⁻⁶−3.04 × 10⁻⁶−3.04 × 10⁻⁶kg·N-eqv.
TotalTotal with credits6.94 × 10−511.2 × 10−54.82 × 10−57.88 × 10−53.11 × 10−53.47 × 10⁻⁵kg·N-eqv.
Total without credits7.24 × 10−511.5 × 10−55.13 × 10−58.19 × 10−53.42 × 10−53.77 × 10⁻⁵kg·N-eqv.
Table 8. Assessment of the terrestrial acidification in kg·SO2-eqv. of 1 kWhel. generated via the production and fermentation of dedicated energy crops and combustion of the biogas in CHP.
Processes/FlowsMaize per FUSwitchgrass per FUMiscanthus per FUUnit
201220132012201320122013
Input substratesProduction of nitrogen fertilizer7.34 × 10−51.13 × 10−44.80 × 10−57.63 × 10−53.19 × 10−53.52 × 10⁻⁵kg·SO2-eqv.
Production of potassium fertilizer8.25 × 10−61.27 × 10−57.30 × 10−61.16 × 10−54.53 × 10−65.00 × 10⁻⁶kg·SO2-eqv.
Production of phosphate fertilizer4.73 × 10−57.28 × 10−53.43 × 10−55.45 × 10−51.97 × 10−52.18 × 10⁻⁵kg·SO2-eqv.
Recycling of nutrients−6.22 × 10⁻⁵−6.22 × 10⁻⁵−4.71 × 10⁻⁵−4.71 × 10⁻⁵−4.88 × 10⁻⁵−4.88 × 10⁻⁵kg·SO2-eqv.
Herbicides 6.35 × 10−69.77 × 10−62.71 × 10−64.31 × 10−61.88 × 10−62.08 × 10−6kg·SO2-eqv.
Seeds/Rhizomes2.19 × 10−63.36 × 10−68.04 × 10−71.28 × 10−61.98 × 10−62.18 × 10⁻⁶kg·SO2-eqv.
AgriculturaloperationsAgricultural management5.16 × 10−57.95 × 10−51.46 × 10−52.32 × 10−58.73 × 10−69.62 × 10⁻⁶kg·SO2-eqv.
Harvest2.58 × 10−53.97 × 10−54.72 × 10−57.50 × 10−53.03 × 10−53.34 × 10⁻⁵kg·SO2-eqv.
Transport input substrates8.90 × 10−71.37 × 10−66.47 × 10−71.03 × 10−64.51 × 10−74.97 × 10⁻⁷kg·SO2-eqv.
Transport biomass3.69 × 10−54.57 × 10−53.56 × 10−53.57 × 10−53.39 × 10−53.28 × 10⁻⁵kg·SO2-eqv.
Ensilage2.46 × 10−63.78 × 10−64.83 × 10−67.67 × 10−63.21 × 10−63.54 × 10⁻⁶kg·SO2-eqv.
Fertilizer-induced emissions8.29 × 10−41.28 × 10−35.42 × 10−48.61 × 10−43.61 × 10−43.97 × 10⁻⁴kg·SO2-eqv.
CHPBiomass production system1.02 × 10−31.60 × 10−36.91 × 10−41.10 × 10−34.48 × 10−44.95 × 10⁻⁴kg·SO2-eqv.
CHP - Direct emissions2.61 × 10−32.61 × 10−32.61 × 10−32.61 × 10−32.61 × 10−32.61 × 10⁻³kg SO2-eqv.
Credits heat utilization−6.82 × 10⁻⁵−6.82 × 10⁻⁵−6.82 × 10⁻⁵−6.82 × 10⁻⁵−6.82 × 10⁻⁵−6.82 × 10⁻⁵kg·SO2-eqv.
TotalTotal with credits3.57 × 10−34.14 × 10−33.24 × 10−33.65 × 10−32.99 × 10−33.04 × 10⁻³kg·SO2-eqv.
Total without credits3.64 × 10−34.21 × 10−33.31 × 10−33.72 × 10−33.06 × 10−33.11 × 10⁻³kg·SO2-eqv.

