1. Introduction
Climate change or global warming, a gradual increase in average global temperature, is now well documented and widely accepted by scientists. To reduce the atmospheric CO
2 level, the Environmental Protection Agency (EPA) has recommended using more renewable energy from solar, wind, and bioenergy sources [
1]. These renewable sources will play a role in providing energy services in a sustainable manner, in particular, in mitigating climate change [
2,
3]. Among renewable energy sources, bioenergy has the unique advantage of providing solid, liquid, and gaseous fuels that can be stored, transported, and utilized far from where they are produced [
4]. However, current bioenergy production is associated with environmental challenges such as increases in net greenhouse gas emissions from direct/indirect land use changes, increased fertilizer use and use of fossil fuel powered equipment for crop management (e.g., harvest and tillage) [
5,
6]. To solve some of challenges, cellulosic biofuel species have gained attention for biofuel production [
7]. Cellulosic biofuel crops can be produced on marginal lands not suitable for food crops and require relatively little fertilizer [
7,
8]. In addition, these biofuel crops can be pressed into dry pellets that can be used for heating and generation of electrical power [
9,
10].
Although cellulosic biofuel species have been considered a promising renewable energy source for decades, neither processing nor end-markets for cellulosic bioenergy feedstocks are fully developed. Uncertainty in regional adaptability and yield stability of biofuel plant species increases potential feedstock growers’ concerns. Moreover, limited available land area can be a challenge to growers trying to find feasible dedicated feedstocks with consistently high yields in different environmental conditions, including soil nutrient limitations. For the success of the bioenergy industry, including potential growers, information on bioenergy feedstock productivity and stability in different environments, with particular emphasis on marginal lands, is needed to assess feasible and reduce investment risks. Switchgrass (
Panicum vigratum L.) and
M. x giganteus (
Miscanthus x giganteus) are key potential cellulosic feedstocks for bioenergy production in the USA [
11,
12,
13]. Evaluating the adaptability and production of these bioenergy crops across various geographic regions as well as in different environmental conditions, such as limited soil nutrient availability in soil, will provide important information for the development of the bioenergy industry.
Switchgrass and
M. x giganteus are C
4 warm-season grasses capable of fast growth and steady high yield production in marginal locations not suited to food crop production [
14]. These grasses have different yield potentials in different environments. Switchgrass is characterized by a wide degree of genetic variation, which results in broad geographic adaptations [
15]. Switchgrass can be grouped into lowland and upland ecotypes, which are adapted to different edaphic conditions. Lowland ecotypes generally have high yields in the southern USA, whereas upland ecotypes generally have high yield potentials in the drier, colder Northern Great Plains [
16,
17].
M. x giganteus originated in East Asia and has been studied across Europe since 1983 [
18,
19]. Selected in the University of Illinois at Urbana-Champaign, USA in 1988 [
20],
M. x giganteus had promising initial data for biomass production in the USA [
12,
21]. Unlike switchgrass,
M. x giganteus has limited genetic diversity with few genotypes available in the USA [
22]. According to Glowacka et al. [
22] who compared genetic similarities among a broad sample of
M. x giganteus accessions from different locations, the accessions of
M. x giganteus are genetically identical. It will be interesting to follow the adaptation of new
M. x giganteus progeny such as “Freedom
TM” [
23,
24], “Amuri” [
24], and “Nagara” [
24,
25] (which were released after our field study was initiated) in future studies.
This could restrict its geographic adaptability as suggested by the broad range of dry matter yield observed in the US Midwest. For instance,
M. x giganteus can produce large amounts of biomass in central Illinois [
11,
20,
26,
27], while, in Kansas, it produces much lower biomass yield [
11,
28]. Biomass production of switchgrass and
M. x giganteus vary significantly with N availability [
12,
19,
29,
30,
31,
32,
33]. Both switchgrass and
M. x giganteus are perennial rhizomatous grasses that efficiently translocate and store nutrients during leaf senescence, enabling them to efficiently use soil nutrients [
11,
34]. Both grasses need less than one-third of the amount of N required for maximizing maize (
Zea mays L.) yield [
12,
26,
35]. In the upper Midwestern USA,
M. x giganteus is more productive and is likely to require less N than switchgrass [
24,
36]. Numerous studies have shown that switchgrass yields continuously increased with N addition between 0 and 160 kg N ha
−1 year
−1 [
12,
30,
32,
33], while
M. x giganteus yield increases were only shown with nitrogen fertilization of 50 to 70 kg N ha
−1 year
−1 [
19,
29,
31]. However, most of these studies on productivity of
M. x giganteus and switchgrass were in the Central or Northern Great Plains. A contrasting result was found in central Texas. Compared to a high-fertility, irrigated part of a field, an adjacent area with no irrigation or added fertility had a 54% drop in “Alamo” switchgrass yield and a 72% drop in
M. x giganteus yield [
37]. Yields for switchgrass were 1.96 Mg ha
−1 irrigated and 0.91 Mg ha
−1 dryland. The values for
M. x giganteus were 1.63 Mg ha
−1 irrigated and 0.45 Mg ha
−1 dryland. Thus the potential yield of
M. x giganteus and switchgrass, even under various N rates, in the Southern Great Plains appears to differ drastically from the Midwestern US.
The Southern Great Plains (SGP) of the U.S. encompasses large areas of rangeland, dryland farms, and some irrigated areas [
38], and will play an important role, as biofuel production is targeted for various “marginal” conditions. The SGP comprises an east-west precipitation gradient and north-south variations in soil type and topography. These differences lead to large variation in productivity of switchgrass and
M. x giganteus across the regions. In addition, the SGP has experienced repeated and severe droughts, especially during summer, which limit crop production [
39]. Therefore, the SGP is well-suited to quantify the productivity of these biofuel grasses in a broad range of environmental conditions.
In this study, two experiments were conducted. In the first experiment, yields of
M. x giganteus and four switchgrass ecotypes were collected over multiple years at six locations in SGP regions in Texas, Louisiana, Oklahoma, and Missouri. This study expands upon previous research [
40] which evaluated switchgrass productivity at multiple locations in the SGP by adding three additional years of yield data and a new site. The purpose of this study was to evaluate the most productive perennial plant variety in each location. This research is critical to identify the suitability of switchgrass ecotypes and
M. x giganteus for SGP region and to test regional adaptability and stability of these biofuel crops. A process based model, ALMANAC (Agricultural Land Management Alternative with Numerical Assessment Criteria) [
41,
42,
43], was used to simulate yields for different environmental effects including regional weather and soil characteristics. ALMANAC simulations of these perennial biofuel grasses will provide realistic predictions of biofuel production under various environmental conditions in the SGP region. The second experiment was designed to find the optimal amounts of N fertilizer to enhance switchgrass and
M. x gigenteus yields at a single location in the SGP region. The purpose of this study is to investigate the effects of organic and inorganic fertilizer on yields of the two crops grown in multiple years in the SGP. This research could improve crop establishment and crop management, which are critical factors for promoting higher biofuel biomass production in the SGP.
4. Discussion
In the first experiment, yields of two switchgrass ecotypes (upland and lowland) and
M. x giganteus were estimated for six sites distributed across the Southern Great Plains (SGP) with different climate characteristics and soil types. According to the results of measured yield patterns for all five entries, greater measured yields were observed in study sites that are closest to where they were originated. For example, “Alamo” had higher biomass yield in southern locations (Calhoun, Nacogdoches, and Temple), closest to its origin in Live Oak county, Texas. In contrast, the other three switchgrass ecotypes and
M. x giganteus showed the different yield patterns than “Alamo”. Their yields increased in northern locations that were close to their geographic origins. This result reveals that plants tend to show optimal growth performance near where they have been established and persisted. Similar results have been reported by Jefferson and McCaughey [
48] who reported that latitude of origin of a switchgrass ecotype was positively correlated to biomass production.
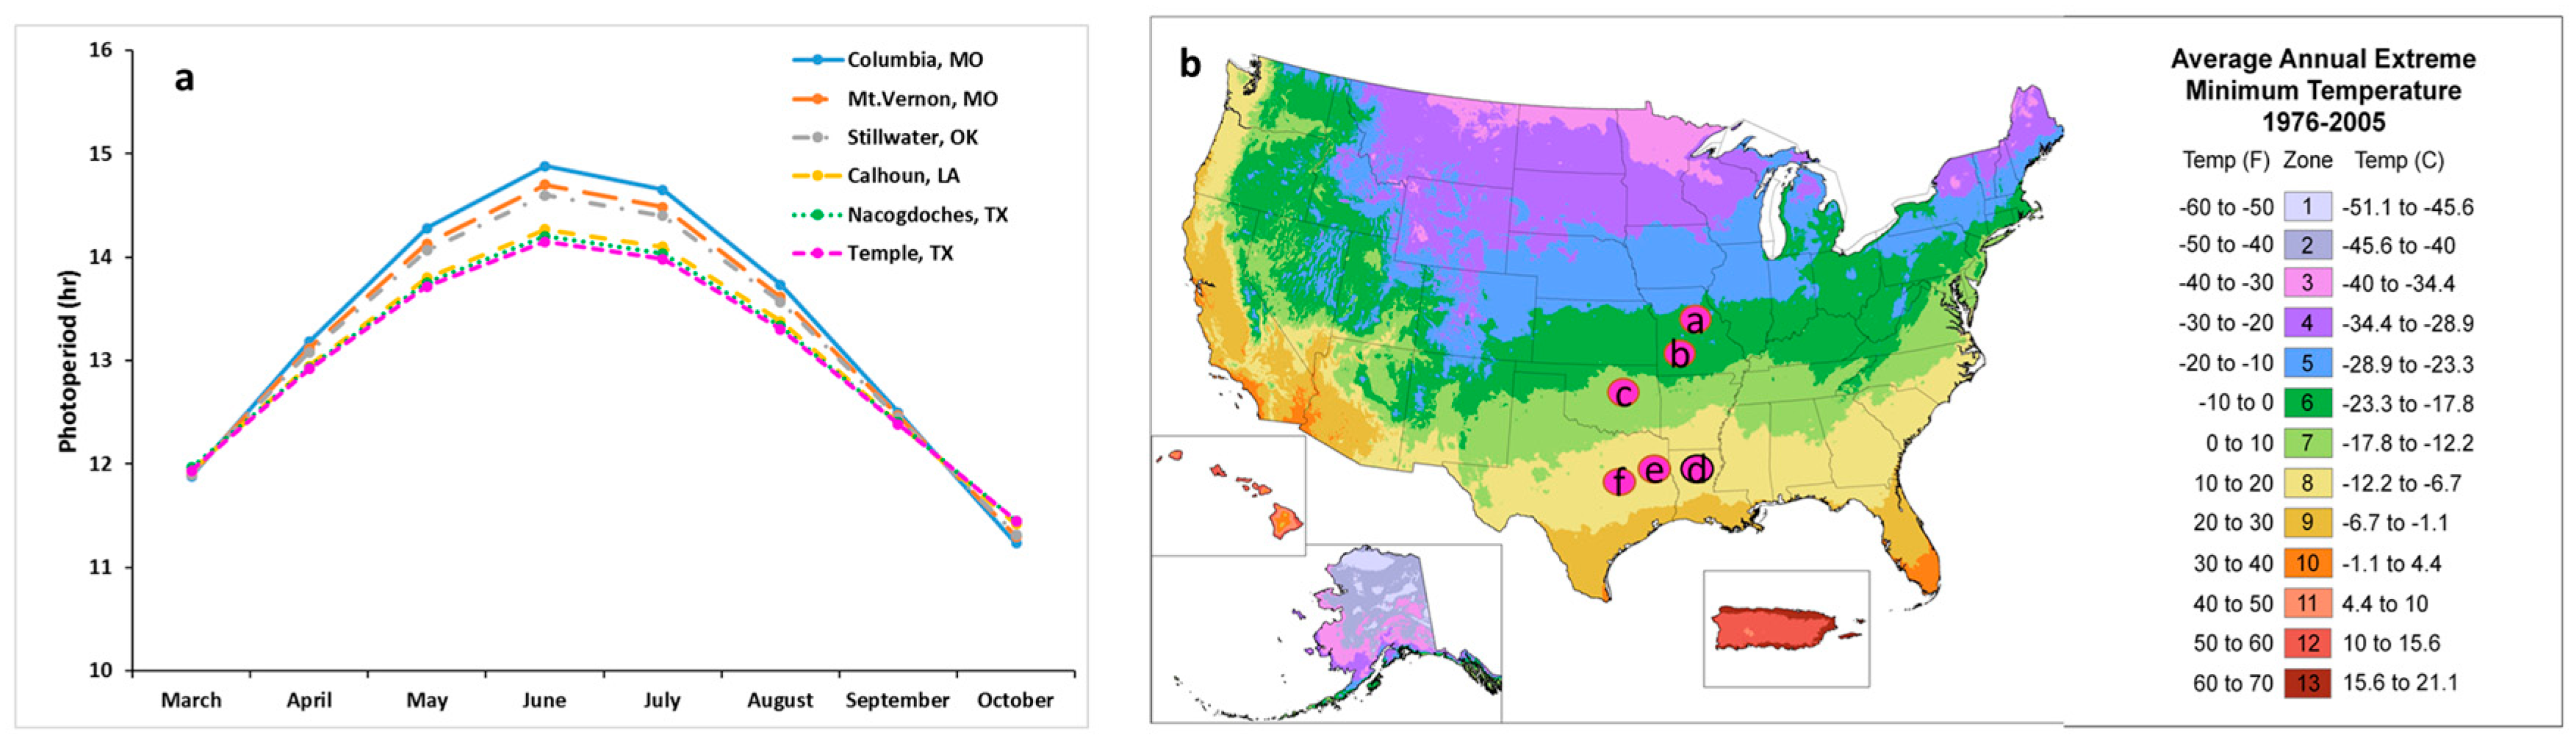
The optimal growth performance near their geographic origins may be reasonable because plants thrive in such environments due to factors including rainfall, temperature, and length of the photoperiod [
49,
50,
51]. Among the environmental factors, photoperiod (length of day) can significantly influence plant development, including plant dormancy, formation of storage organ, asexual reproduction, leaf development, stem elongation, germination, and flowering initiation [
50,
52]. Kiniry et al. [
40] reported significant correlation between photoperiod and yields for two switchgrass ecotypes and
M. x giganteus, but the values of correlation coefficients varied among entries. “Alamo” had a negative value of correlation coefficient between photoperiod and its yield, whereas yields of “Kanlow”, upland switchgrass ecotypes, and
M. x giganteus yields were positively correlated with photoperiod [
40]. The results of this study show that the yields of “Alamo” in lower latitudes were 25% greater than in higher latitudes, while “Kanlow”, upland switchgrass, and
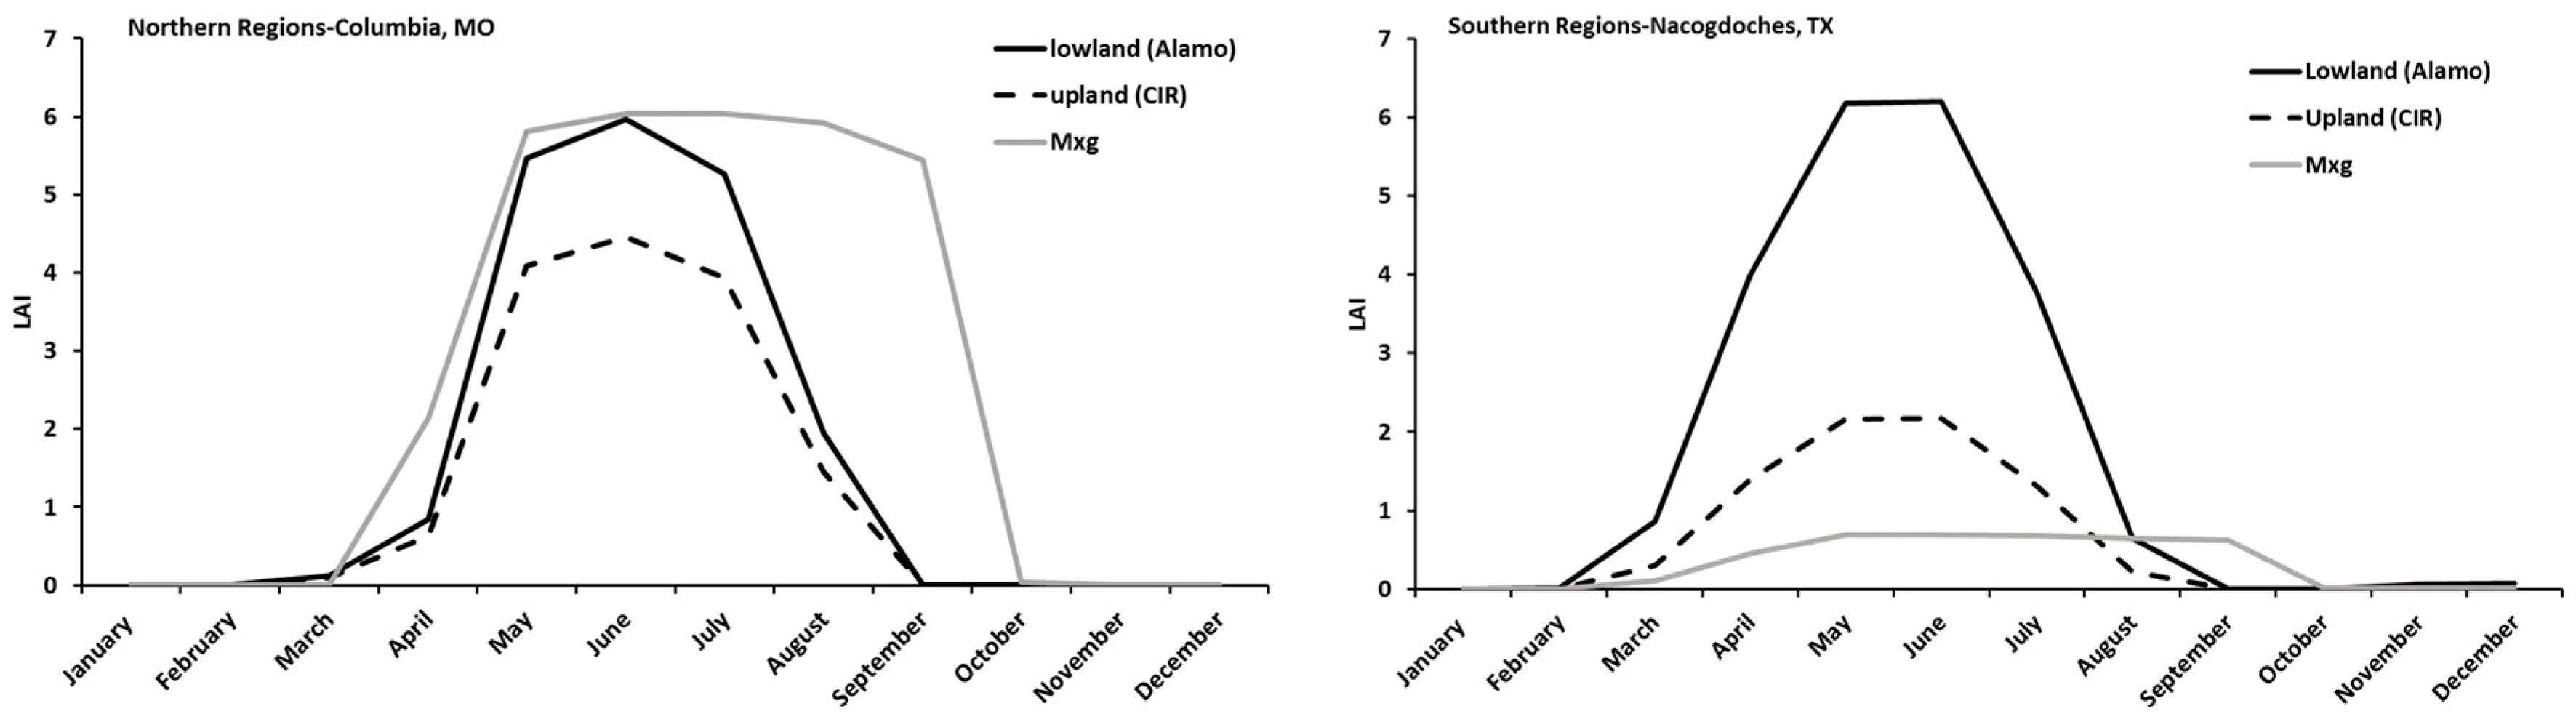
M. x giganteus had three-times greater biomass yield in higher latitude study locations. Moreover, leaf area development showed the same pattern as yield for all entries, except for “Alamo”, across all study locations. In the seasonal changes in simulated leaf area index, much higher maximum values of leaf area index were observed for upland switchgrass ecotypes and
M. x giganteus in higher latitudes. In contrast, “Alamo” had similar maximum leaf area index during the growing seasons in both northern and southern locations, but its growing period in southern locations was longer than in northern locations. The “Alamo” leaf area index increased rapidly in mid-February in southern locations, while the leaf area index increased rapidly in March in northern locations.
In addition to photoperiod, temperature also plays an important role in controlling plant development, both during the dormant period and during the growth phase [
50,
53]. In perennial plants, temperature is a critical factor for inducing and controlling dormancy in their rhizomes. This is a mechanism for rhizomatous perennial plants to survive adverse conditions by pulsing growth. Many plants require sufficient days with chilling temperatures during winter to completely release dormancy for the normal processes of plant growth, reproductive development and subsequent yield [
54,
55,
56]. In this study, the six locations belong to different cold hardiness zones which differ in their extreme minimum temperatures. The minimum temperature in lower latitude study locations was 11 °C higher than northern study locations. The higher winter temperatures in the southern region may not satisfy the chilling requirements for “Kanlow”, upland switchgrasses, and
M. x giganteus, which may result in prolonged dormancy leading to their lower yields in this region [
57,
58]. These results can be supported by Kiniry et al. [
40] who reported positive correlation between cold stress and yields for “Kanlow”, upland switchgrass ecotypes, and
M. x giganteus, indicating that colder winter temperature favored their growth and development.
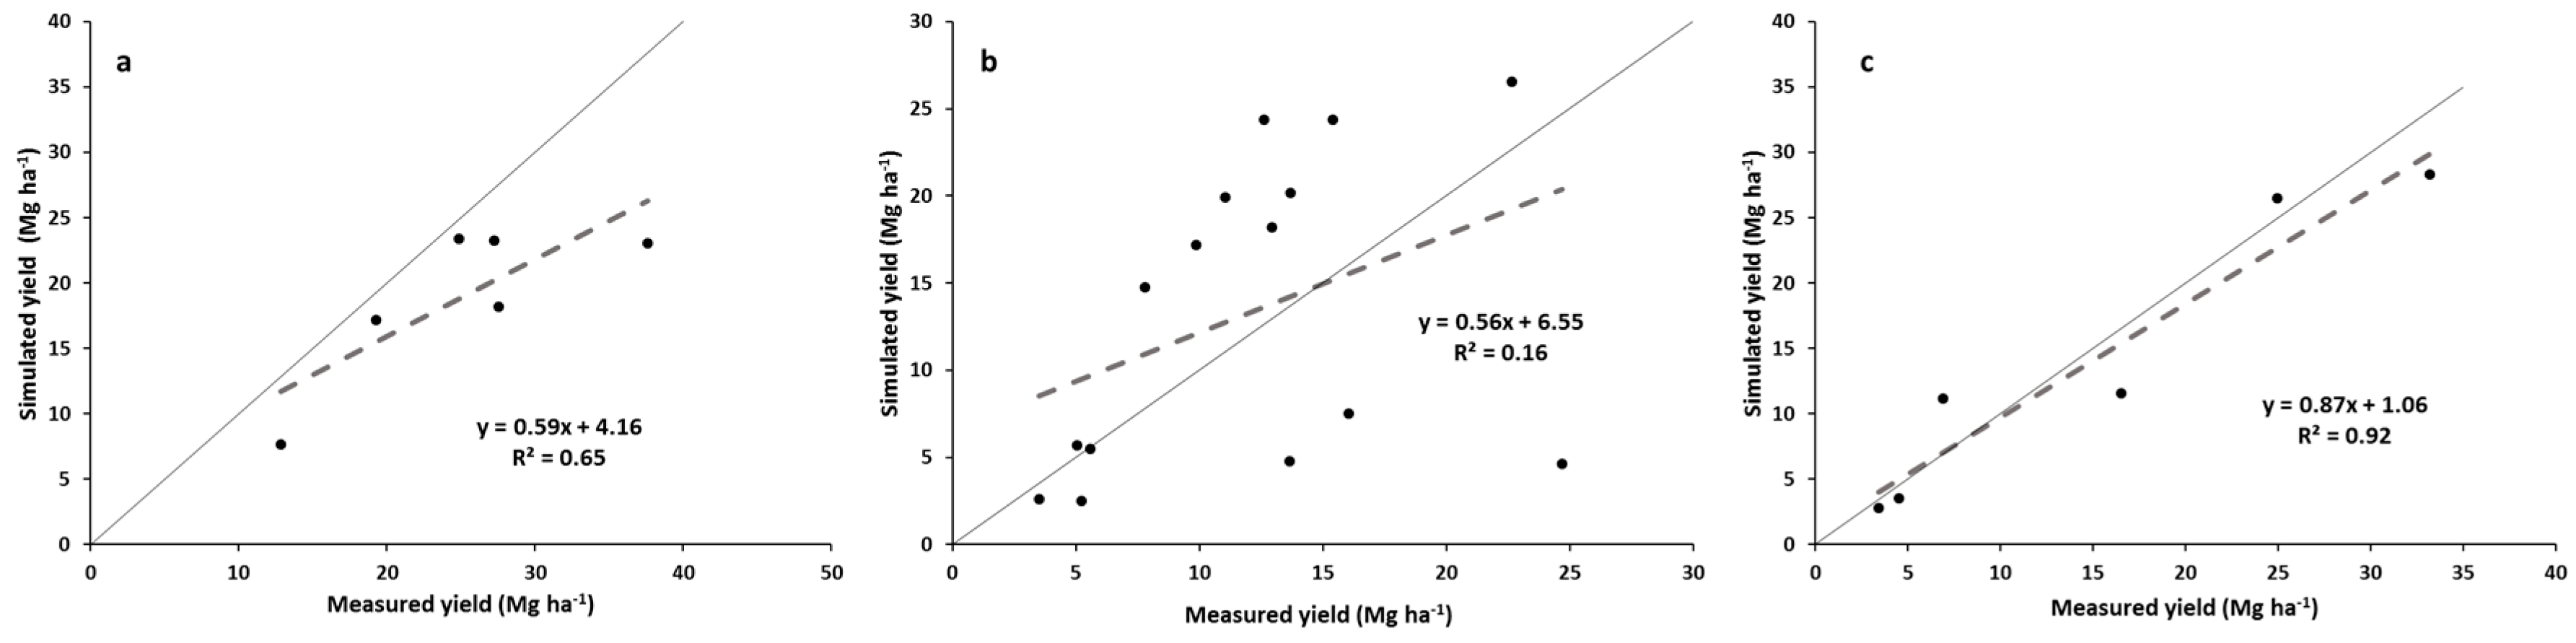
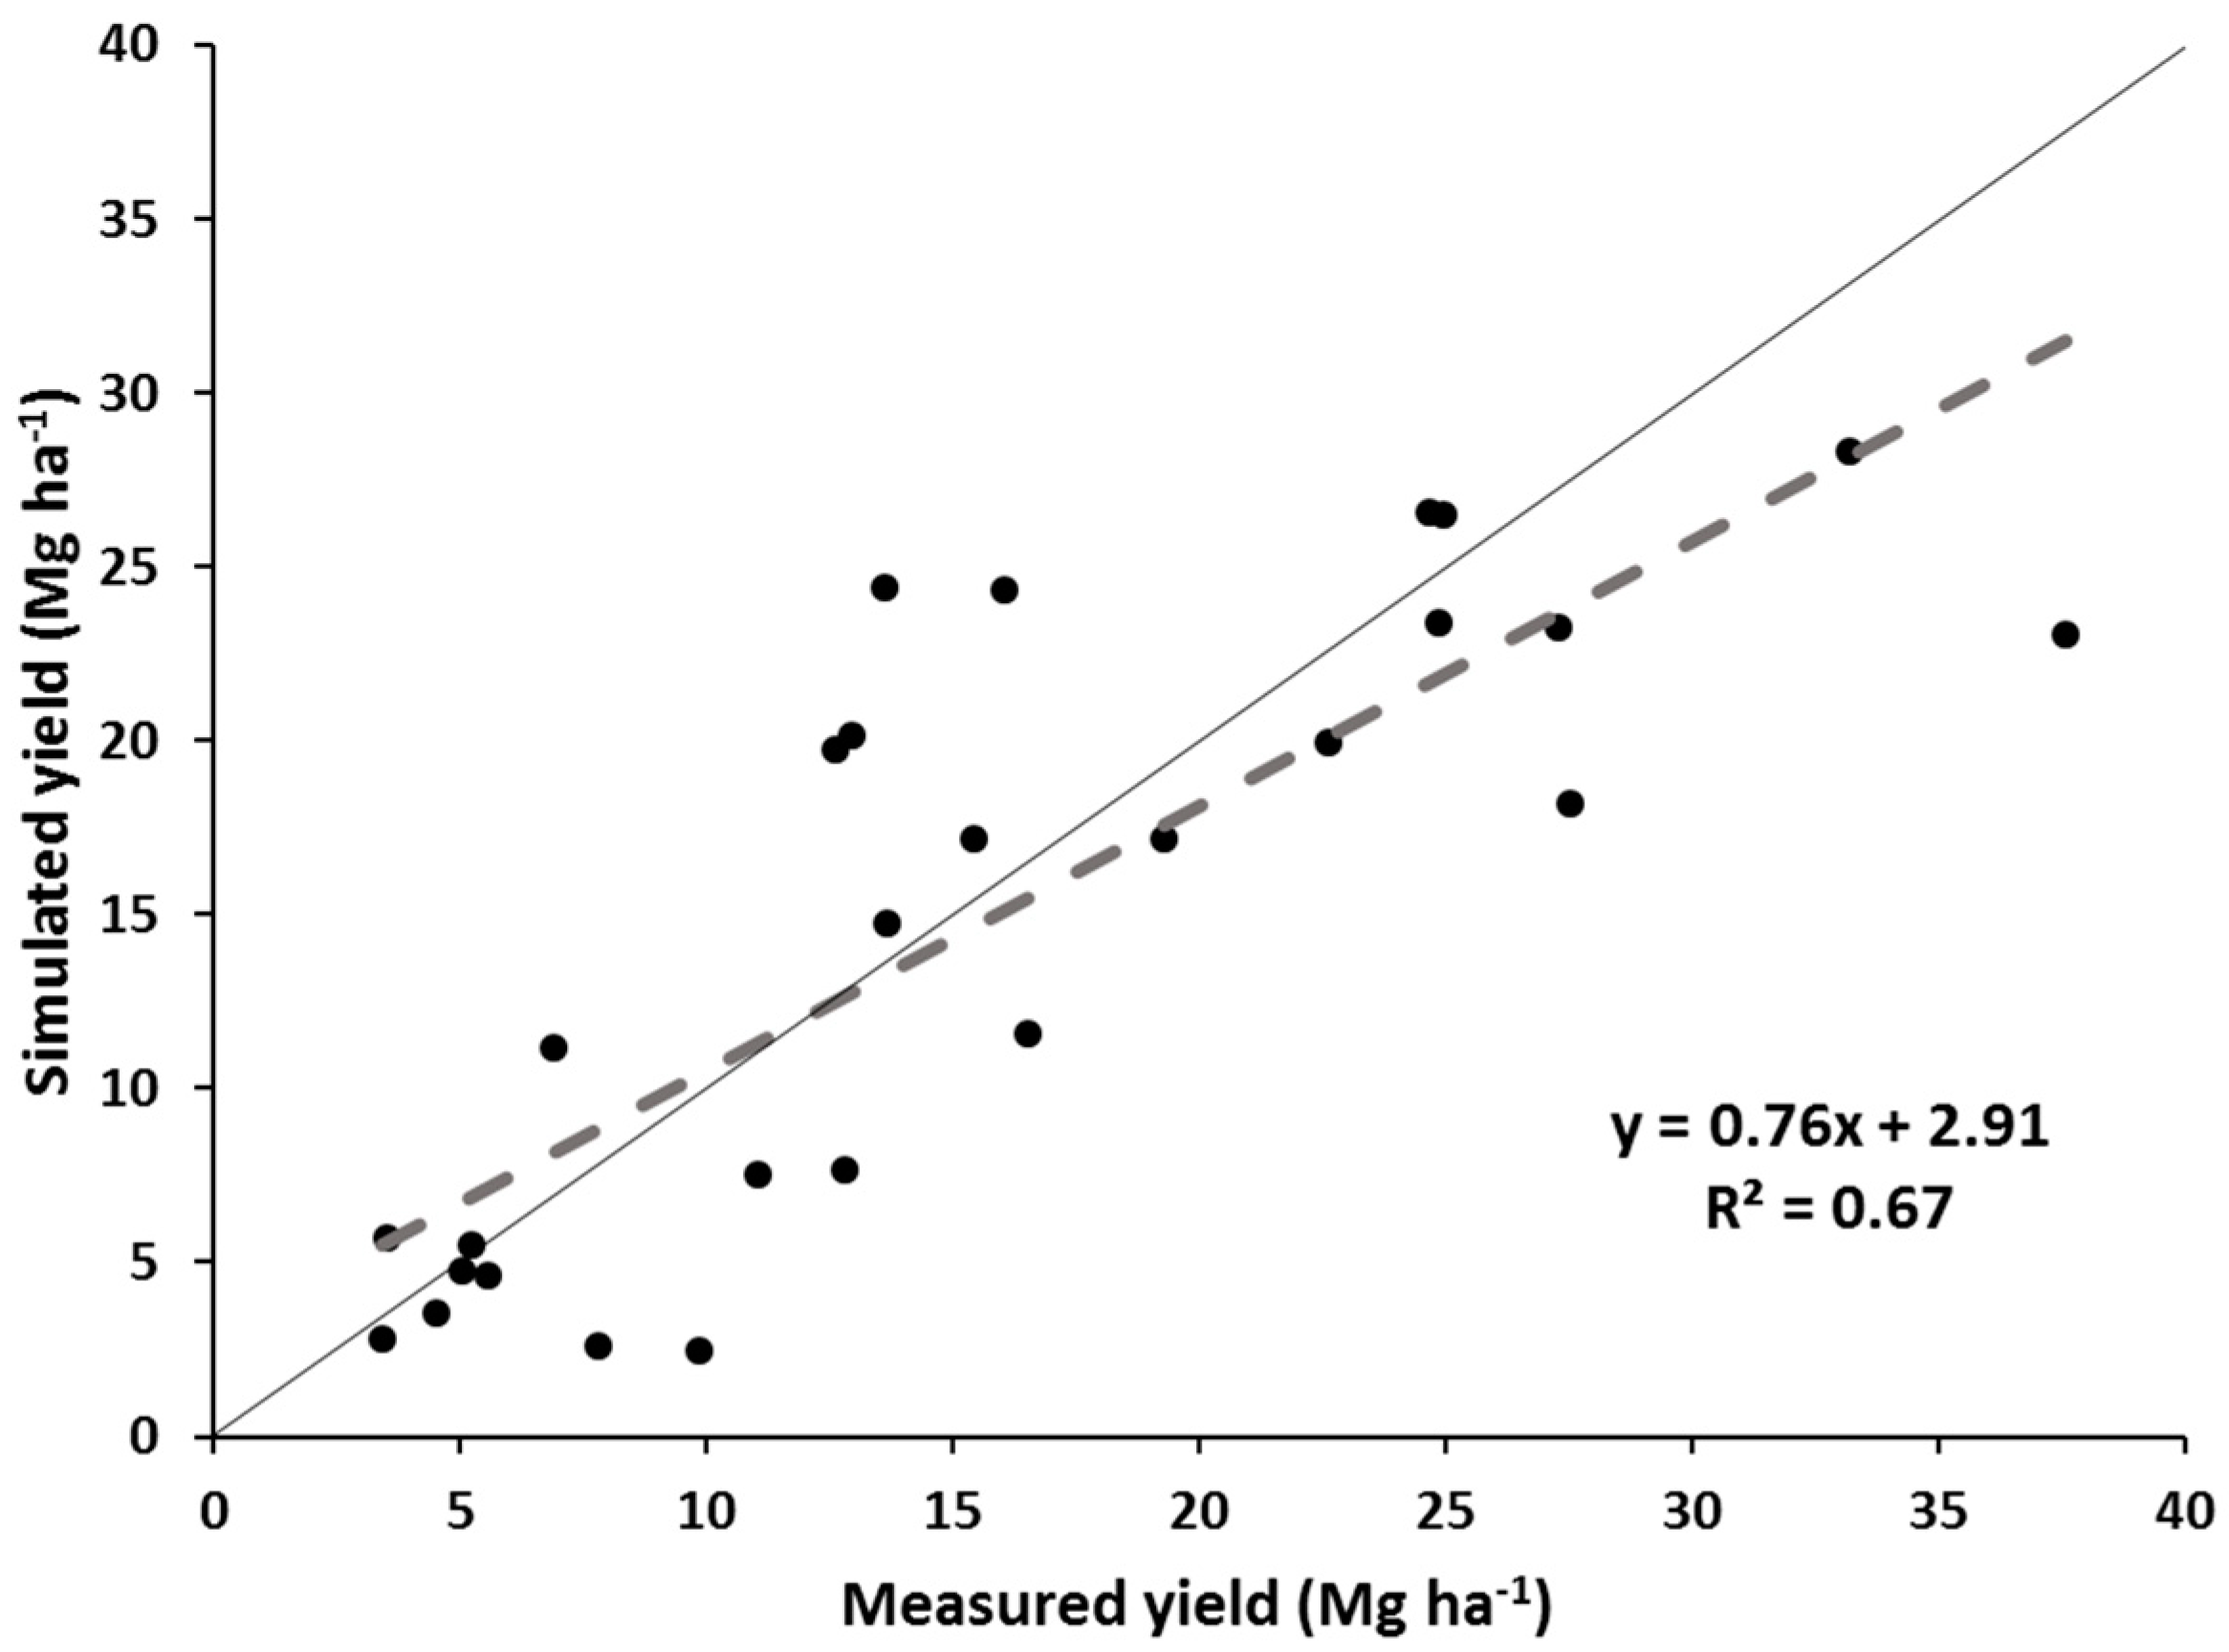
The simulated yields showed reasonable trends when compared with the measured yields for all switchgrass ecotypes and M. x giganteus pooled, but showed variable results when looking at the individual switchgrass ecotypes and M. x giganteus. The model appears quite reasonable for simulating “Alamo” switchgrass and M. x giganteus across this range of latitudes but may need some improvement before it can capture the yield variability of the other three switchgrass ecotypes. The model accounted for two-thirds of the variability in all the pooled data and showed a realistic regression line. “Alamo” simulated yields also accounted for nearly two thirds of the variability in measured yields, but tended to underpredict yields at the higher-yielding, more southern sites. For the other pooled three switchgrass ecotypes, the model had a regression line for simulated yields:measured yields that was reasonably close to the 1:1 line, but the model only accounted for 16% of the variability in measured yields. Thus the model did only a fair job in predicting these yields. Finally, for M. x giganteus, the model did an excellent job simulating yields across sites, with the regression line close to the 1:1 line and the correlation coefficient being greater than 0.90.
Based on the results of measured and simulated yields, unlike upland switchgrass ecotypes and
M. x giganteus, “Alamo” could consistently produce high yields across all study locations, which may reflect that “Alamo” growth was less affected by photoperiod and temperature changes. A similar result has been observed by Li et al. [
59], who reported that the southern ecotypes are usually less sensitive to the inductive signals than northern ecotypes. Based on these yield results, “Alamo” can be selected as the optimal biofuel species growing in both southern and northern location in the SGP, while upland switchgrass ecotypes and
M. x giganteus can be great bioenergy crop candidates only in northern locations of the SGP.
The nutrient concentration in harvested biomass is greater when biomass yield is lower, which may be due to the relatively high leaf to stem biomass ratio for smaller plants [
60,
61]. Mattos et al. [
60] reported that nutrient concentrations were higher in leaves compared to other plant parts (e.g., root and stem) because nutrients taken up by roots are primarily transported to the leaves, where most important biochemical reactions occur. The nutrient removal rates for N, P, and K followed the biomass trends. This is shown by nutrient removal rates by plants for N, P, and K that increased as biomass yield increased. Similar results have been observed in switchgrass [
60]. According to Kering et al. [
60], nutrients accumulate in plant tissue as they grow, so increased plant size may reflect increased nutrient removal in harvested biomass.
In Experiment 2, the effects of nitrogen fertilization on biomass yield of “Alamo” switchgrass and
M. x giganteus were investigated at a single location in the SGP. Most previous yield evaluations under various nitrogen fertilizer application rates for
M. x giganteus were conducted in Central and Northern USA or Europe, where
M. x giganteus is well-adapted [
19,
29,
31,
62]. It is still unclear about the effect of nitrogen fertilizer application rate on biomass yield of
M. x giganteus in southern locations in the USA, where, based on the results from our first experiment,
M. x giganteus is not well adapted. The second experiment, therefore, provides useful information about relationships between geographic adaptation and nitrogen response in
M. x giganteus.
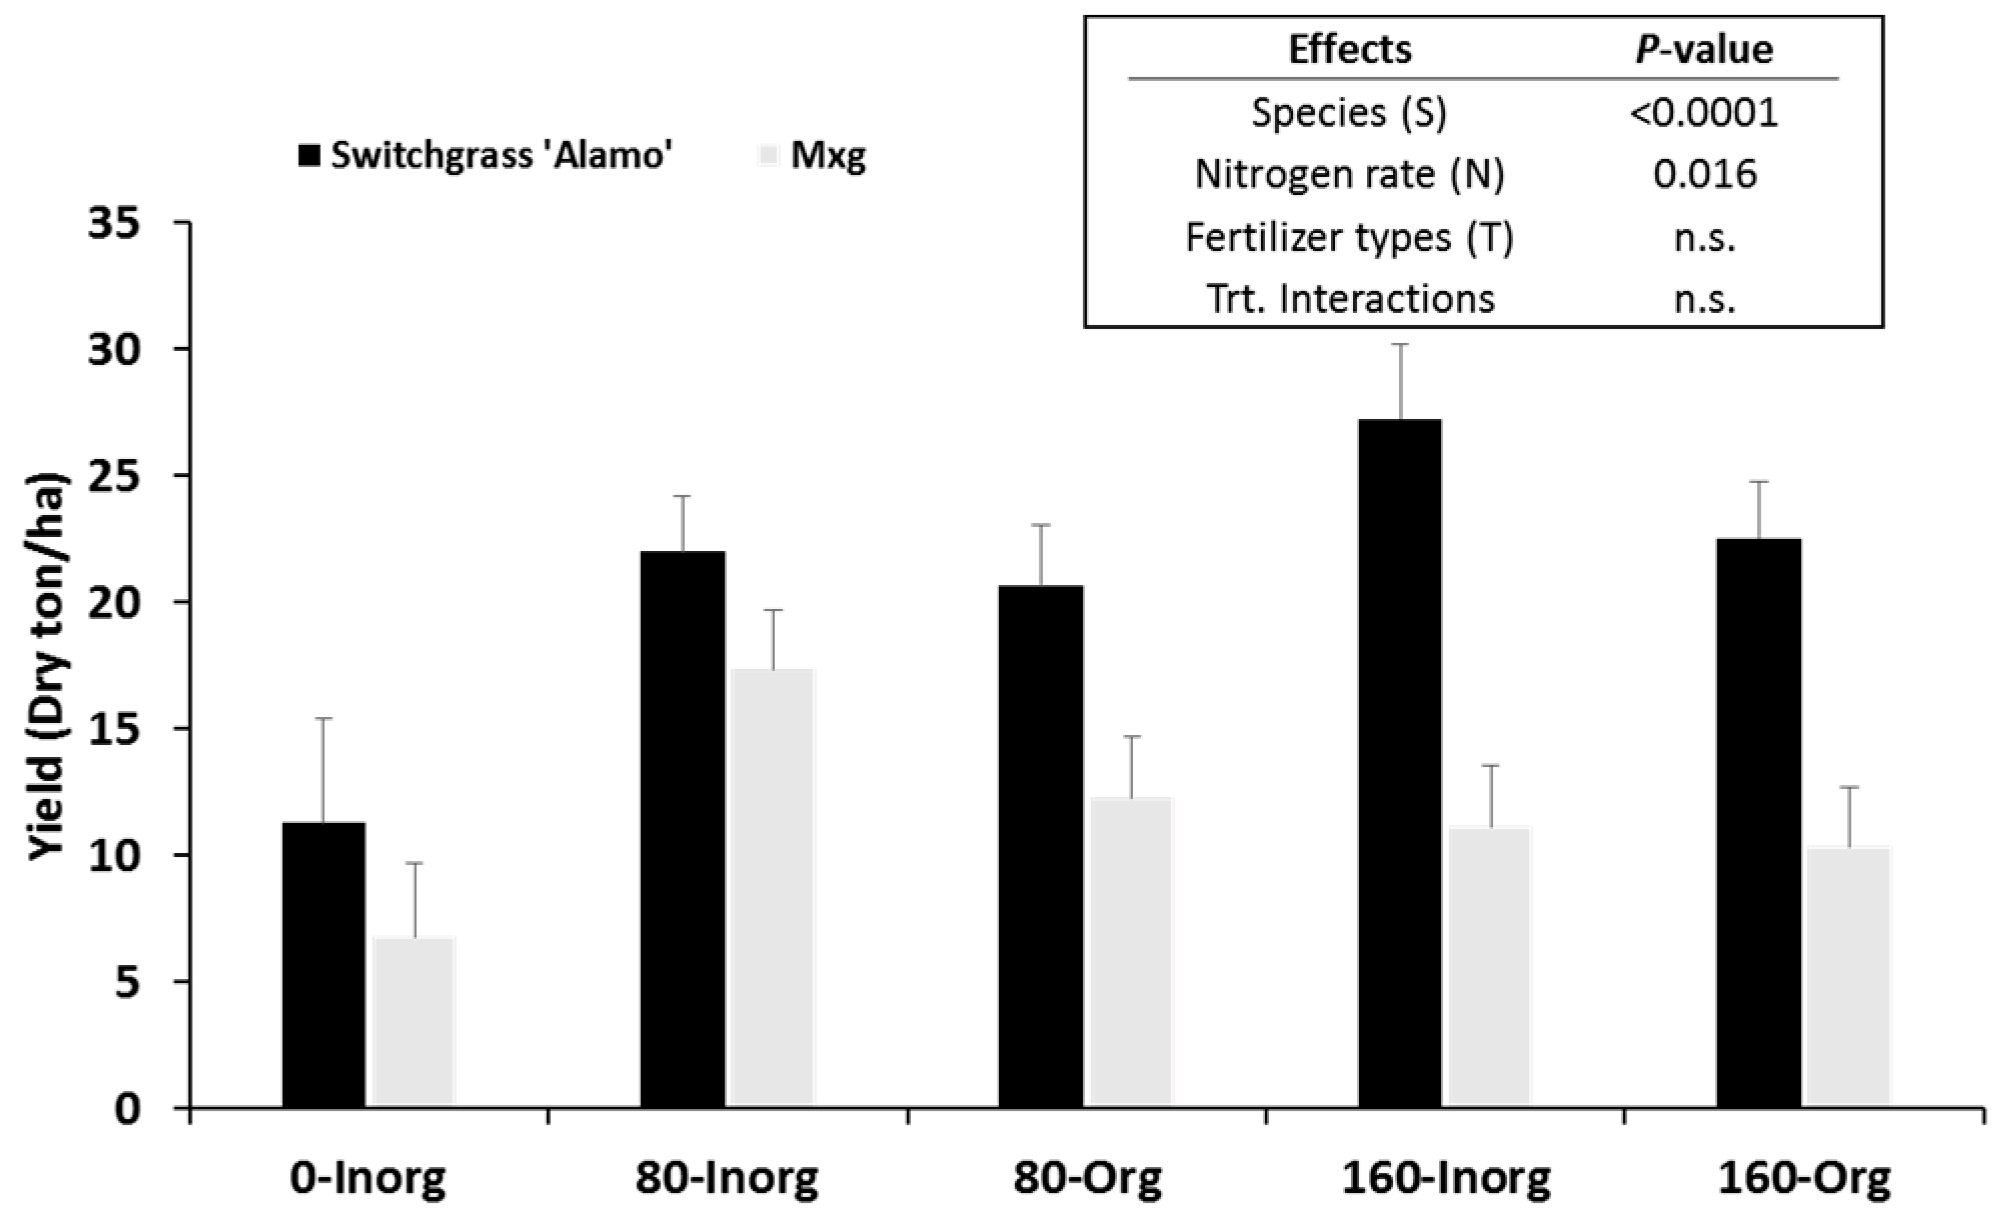
Switchgrass and
M. x giganteus significantly responded to nitrogen fertilizer application rates. As nitrogen fertilizer application rates increased, yields of switchgrass significantly increased. Unlike switchgrass,
M. x giganteus yields increased only from 0 to 80 kg N ha
−1 year
−1 application rates. Similar results have been reported in elsewhere [
60,
63,
64,
65]. In the southern US, switchgrass yield increased as nitrogen fertilizer application rates increased up to 224 kg N ha
−1 [
63], and “Alamo” switchgrass produced the maximum yield at 168 kg N ha
−1 [
64]. Although no significant effects on yield were observed for fertilizer types (organic and inorganic), compared with inorganic fertilizer, smaller yield differences between 80 and 160 kg N ha
−1 year
−1 of organic (poultry litter) fertilizer were observed in both switchgrass and
M. x giganteus. This may be because poultry litter is a slow-release fertilizer, which can delay nutrient uptake of the plant [
66]. In switchgrass, N removal difference between 80 and 160 kg N ha
−1 year
−1 was 49.2 N kg ha
−1 for inorganic fertilization, while only 3.27 kg N ha
−1 was removed by plants from the organic fertilizer. The removal difference between 80 and 160 kg N ha
−1 year
−1 for
M. x giganteus tended to show similar pattern with switchgrass, but the N removal amount was much lower. In
M. x giganteus 14.7 and 1.5 N kg ha
−1 were removed by plant for inorganic and organic fertilization, respectively. Although the nutrient removal increased from 80 and 160 kg N ha
−1 year
−1 of inorganic fertilizer,
M. x giganteus yields decreased. This may have been due to environmental limitations at the study site. This result is supported by other studies [
67,
68], where
M. x giganteus yields increased with increased nitrogen fertilizer in Illinois, but not across the eastern USA, where
M. x giganteus was not as well adapted as in Illinois. In addition, Vergeer et al. [
69] reported that plant yields are more influenced by regional adaptation (e.g., flowering time and growth rate), rather than nitrogen rate. This may be why
M. x giganteus yield was much less than switchgrass at 0 kg N ha
−1 year
−1.
The nutrient concentration and removal rates by plants varied by either nitrogen rates or species. The highest nutrient concentrations for switchgrass and
M. x giganteus harvested were observed at either 80 or 160 kg N ha
−1. The nutrient removal rates by harvested switchgrass followed the biomass trend, shown as the nutrient removal rates increased as nitrogen rate increased. Unlike switchgrass, the nutrient removal by harvested
M. x giganteus was not associated with its yield, but increased as nitrogen fertilizer application increased. This result indicates that
M. x giganteus applied with greater nitrogen application rate may increase biomass ratio of leaves over stem because higher nutrient concentrations are observed in leaves compared to other plant parts (e.g., root and stem) [
61].


