1. Introduction
Breaking up path dependencies and lock-in effects is especially important in declining industrialized regions, caught up by radical disconnections and decline (Grabher [
1]). In such cases culture could serve as one of the multiple remedies against the risks of regional lock-in effects (Heidenreich and Plaza [
2]; Plaza and Haarich [
3]) due to the fact that cultural goods can generate more symbolic associations and image connections than non-cultural consumption goods, since they are also socially constructed (Potts et al. [
4]), with their meanings subject to collective cognitive processes of people/citizens. In other words, in our postmodern globalized world, economic repositioning is as much about symbolic capital-driven innovations (e.g., reputation/aesthetic image) as investment and production.
The use of symbolic capital-driven innovations were seen as a priority in the efforts, in the case of Bilbao and the Basque Country, to overcome the challenges associated with an ageing, industrialized economy. In the 1970s, 1980s, and early 1990s, the Basque Country underwent an extremely severe crisis, the situation of a deep recession, marked by uncertain elements (unemployment, socio-political instability, terrorism, loss of a reference point in social values, etc.) that required urgent industrial restructuring. With the aim of turning around this negative scenario, a significant effort was made by the Basque government to construct a regional innovative infrastructure, which would foster the modernization of traditional industries and nurture new industrial and service activities (Cooke [
5]). These strategies were combined with territorial regeneration and involved a strong cultural component (Alvarez Sainz [
6]).
In this sense, although the Basque Country remains substantially industrial (23% of GDP), the Guggenheim Museum Bilbao (GMB) boosted global connectivity by placing this second-tier city on the internet map of international art-related tourism circuits (Plaza and Haarich [
3]). In other words, the growing service sector represented by the Guggenheim Museum Bilbao changed the global connectivity patterns for the city of Bilbao/Basque Country, making it well known worldwide. Thus, cultural goods can serve as “bridging engines” (symbolic connectors or boundary objects), which facilitate cooperation in spite of the heterogeneity of different points of reference and logic (Star and Griesemer [
7]). Moreover, they can help to insert institutions/cities or regions into global networks of specialized circuits. Cultural goods can change connectivity patterns and add value and reputation to reinforce the attractiveness of a region or a city, a critical issue for competitiveness as a whole.
Within this framework, this paper aims to contribute to the analytical study of “culture-led connectivity patterns change”. For this purpose we perform regression analysis with cultural networks (observational cross-sectional network data) from digital media for a specific cultural case study: the Basque Culinary Centre (BCC). The BCC is a higher education faculty of haute cuisine created in 2011 by the University of Mondragon along with a group of Michelin-starred chefs. It is necessary to highlight that haute cuisine is strongly embedded in the Basque Country with several Michelin-starred restaurants and numerous famous chefs.
We have chosen the Basque Culinary Centre because (1) it is intensive in cultural/symbolic capital; and (2) we can easily extract network data before and after the opening of the BCC in order to perform the intervention analysis. The research question is the following: Is there a structural change in the connectivity pattern before and after the opening of the BCC? This question is vital since it is the reconnection in press of the BCC to the influential Michelin-starred chefs that fuels the accumulation of press articles (media items) of the BCC (repositioning it); and it is this accumulation of press articles (media items) that impacts BCC sales. This is to say, the co-branding between the influential Michelin chefs and the BCC may have put the BCC on the press map.
The paper is structured as follows:
Section 2 explains why symbolic capital matters,
Section 3 presents haute cuisine as a cultural good,
Section 4 sets out the methodology used in the study,
Section 5 shows the main results, followed by a discussion in
Section 6.
2. Why Symbolic Capital Matters?
In economic sociology, “symbolic capital” (Bourdieu [
8]) can be referred to as the resources available to an individual on the basis of honor, prestige, or reputation, and functions as an authoritative embodiment of cultural value. Symbolic capital refers to popular held perceptions which are embodied and represented by a cultural-architectural facility.
Culture and, in particular, art, is representational (Schroeder [
9]) and provides added value to businesses and regional economies (McNicholas [
10]). Cultural goods are semiotic constructs that indicate a wide spectrum of meaning. To give an example, the Guggenheim Museum not only draws associations with high-culture art but also represents innovation and creativity. Art museums, and even individual works of art, can represent specific artistic styles and a broader sense of history, prestige and creativity (Caldwell [
11]). Brands and culture are “representational texts” (O’Reilly [
12]). Although the interpretation of these texts depends partly on how they have been created, their significance is also a function of how consumers receive and interact with them. Meaning is constantly reworked through social and cognitive processes (Plaza et al. [
13]; Potts et al. [
4]).
Due to their capacity to generate symbolic capital capable of contributing added value to the economic processes, intangible cognitive aspects such as taste and art have become important drivers of the post-industrial economies. Similarly, these aspects are capable of giving rise to new habits and consumer goods as well as promoting new technologies. (Plaza et al. [
13]).
For some time now the strength of these cognitive-cultural structures has become prevalent both in the economy and in society. Intangible assets, such as reputation, honour, and trust are recognised as representing symbolic capital which can be of great use in social positions (Bourdieu [
14]). The acquisition of such values aids the individual or the institution as they strive to obtain cultural value.
The position of these aptitudes can be seen as conduits in the process of the reconstruction of industrial economies to becoming cognitive-cultural economies (Scott [
15]). Their contribution to consumer activity is based on the desire of consumers for culturally significant and knowledge rich differentiation and quality, which are complementary to material goods. (Plaza et al. [
13]).
With regard to production, knowledge has become a fundamental factor in the post-industrial economies (Hospers [
16]), the development and growth of which is intrinsically linked to the aforementioned symbolic capital, which builds bonds and fosters the creation of new ideas through increased cooperation with global players. In this way, this greater symbolic proximity is capable of fostering other types of proximities, both cognitive and mental (Boschma [
17]), contributing to reconnecting institutions/cities/regions.
This art-driven (culture-led) reputation can serve to encourage the disposition of global actors to cooperate with a city’s protagonists, reducing transaction costs, diminishing uncertainty, and increasing its international attractiveness (Plaza and Haarich [
3]). The symbolic dimension of cultural goods must be reinterpreted within the context of meanings and mental associations of art and culture brands (Scott [
18]; Power and Jansson [
19]), and transaction costs (Coase [
20]). The process of image accumulation (accumulation of press articles, accumulation of semantic connections and mental associations) can serve to generate real symbolic capital, thereby benefitting the regional economy. Understanding what drives these cognitive connections in their cities/region plays a part in building an effective brand from a cultural asset.
It is for this reason that culture-led place re-imaging continues to play a role in the economic development of cities (Kotler and Gertner [
21]; Rantisi and Leslie [
22]). Thus, in network language terms, cultural goods can act as powerful connectivity engines, generating new connections, rewiring links, and repositioning industrial cities by changing their symbolic knowledge position within the global network. An improved position within these specialized networks can increase the potential of a city/region to successfully attract new assets (i.e., capital, firms, students, tourism, creative people, etc.).
Thus, the discourse about art or other cultural products is part of the production process itself, and haute cuisine is no different in this regard.
3. Haute Cuisine: A Cultural Good
The Guggenheim Museum is neither the only cultural engine nor was it the first cultural good in the Basque Country. On the contrary, this region already showed quite high levels of cultural production/consumption before the opening of the Guggenheim (Plaza, Tironi, and Haarich [
23]). By and large, one of the most famous cultural goods in the Basque Country is haute cuisine. We should bear in mind that this territory (together with Catalonia) contains one of the highest concentrations of Michelin-starred restaurants of Spain (Plaza [
24]; Franklin [
25]).
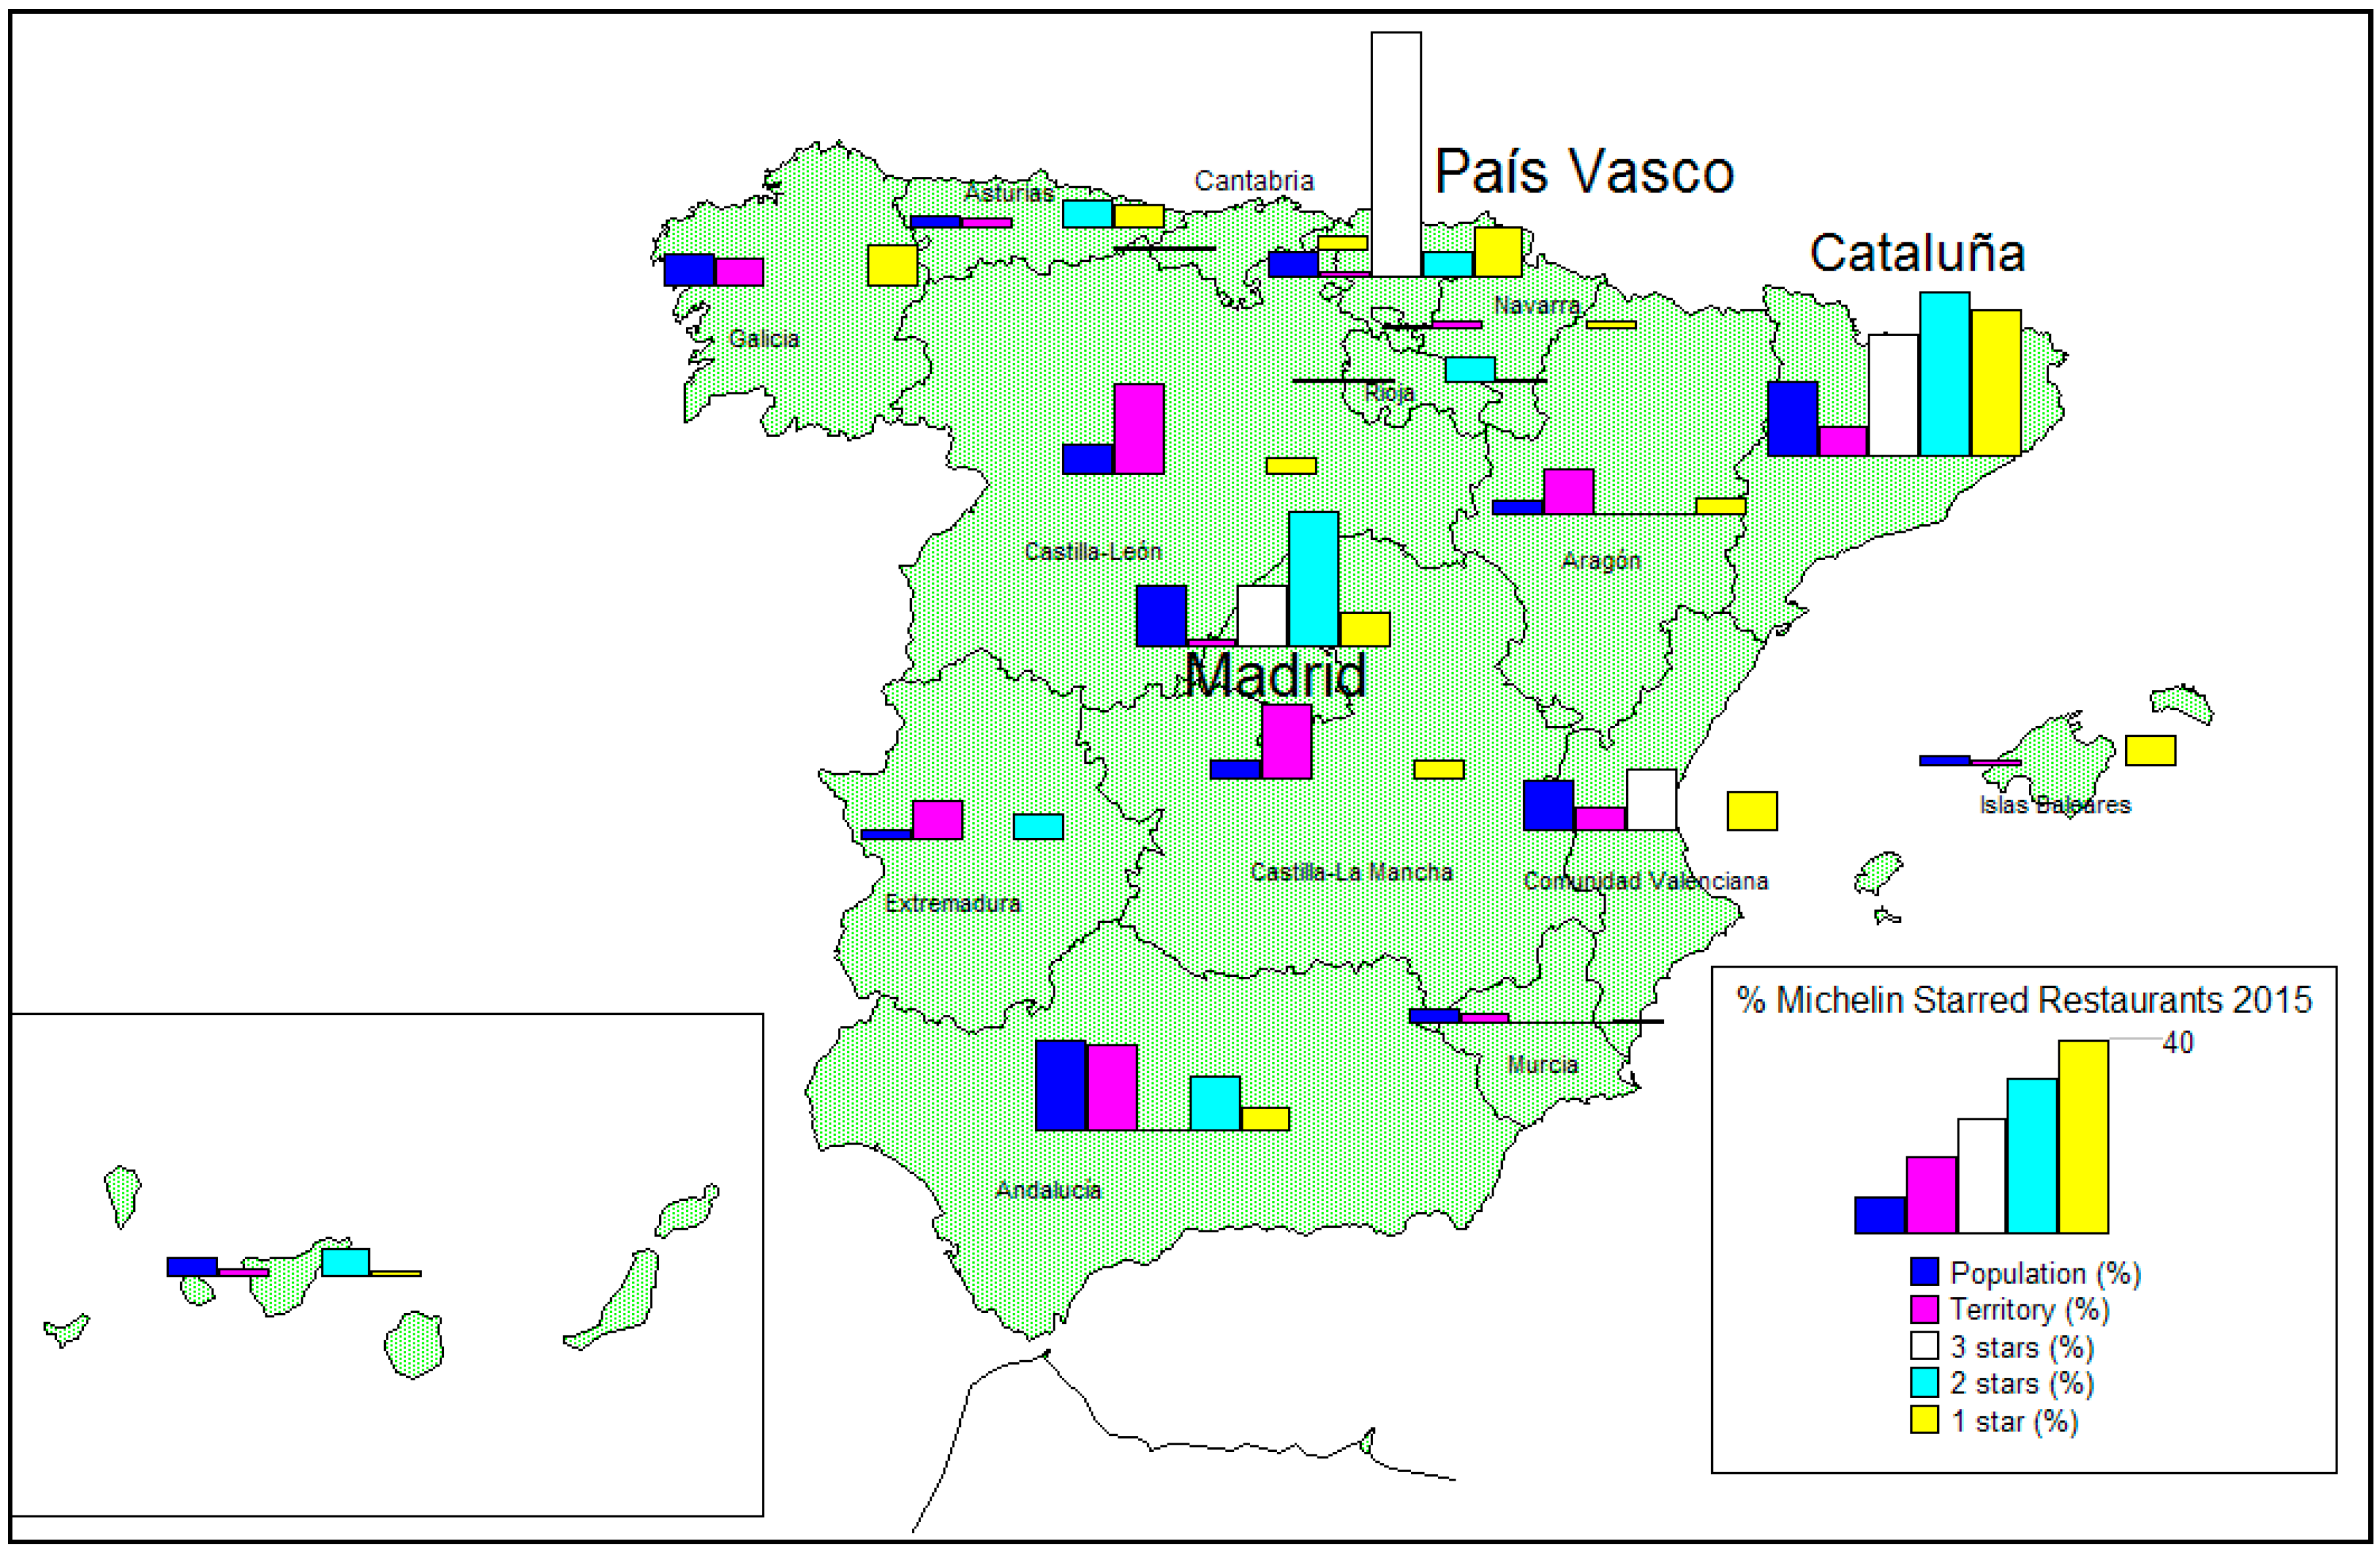
Figure 1 shows Basque haute cuisine is strongly embedded in the territory, anchored in both the entrepreneurial and gastronomic tradition, with intensive public support to networking in the fields of promotion and training (Plaza [
24]). With 5.3% of the Spanish population and 1.4% of the Spanish territory, the Basque Country concentrates 50% of the Spanish “three-starred Michelin restaurants”, 5.6% of the “two-starred” ones, and 10.6% of the “one-starred” ones (
Figure 1).
As stated by researchers from the Max-Planck-Institut für Gesellschaftsforschung (Cologne), (Beckert, Rössel, and Schenk [
27]) “the quality of wine/haute cuisine is determined in a social process that takes place in a field of cultural production. Actors with a high endowment of cultural capital assess wine/haute cuisine quality differently from consumers with low cultural capital. Consumers are willing to pay higher prices for wine/haute cuisine if the symbolic position of the wine/haute cuisine nurtures their symbolic knowledge”.
In this empirical study we experiment on network structural changes driven by Michelin-starred-chefs in connection to the Basque Culinary Centre. In brief, we want to test network pattern changes as a result of a new cultural infrastructure. In other words, we try to approximate (quantify) symbolic repositioning, a key issue for any city/region or institution.
This enhancing of the BCC reputation through its connection to Michelin-starred chefs can boost new student registrations. These potential students focus their selection criteria on a differentiation in reputation, a level of prestige that can drive new students’ applications.
Therefore, the way the BCC acquires this distinction is based on the inclusion of prestigious chefs, whose recognition is reflected through their Michelin stars, the ultimate excellence award for restaurants. That is, chefs with branding power.
However, just as distinction and singularity are shown to be fundamental for the competitiveness of a brand, the dissemination of the brand is equally important, with regard to market advantage, through the so-called “brand channels” (Plaza et al. [
13]), various inter-related entities which take an active part in image distribution. Clearly, the digital communication media represent the most important example of these functions.
The reproduction of these digital images is enhanced by considerable economies of scale (Shapiro and Varian [
28]). Although the production costs of a first image are high, the marginal cost of posterior multiplication of this image border on zero, by virtue of digital technologies (Shapiro and Varian [
28]). This facilitates the dissemination of information and provides a series of advantages with regard to online visibility, thereby diminishing uncertainty and transaction costs (Elsner, Heinrich, and Schwardt [
29]).
Therefore, the development of the digital economy enables the strengthening of the connection of the Basque Culinary Centre with its chefs as a benefit in terms of online visibility. Thus, a link to chefs with a high online visibility is acquired with almost no marginal costs. The value of these reproductions lies in the possibility of reaching a wider consumer base, using the consumer preferences and reaching a greater number of potential clients (Plaza et al. [
13]).
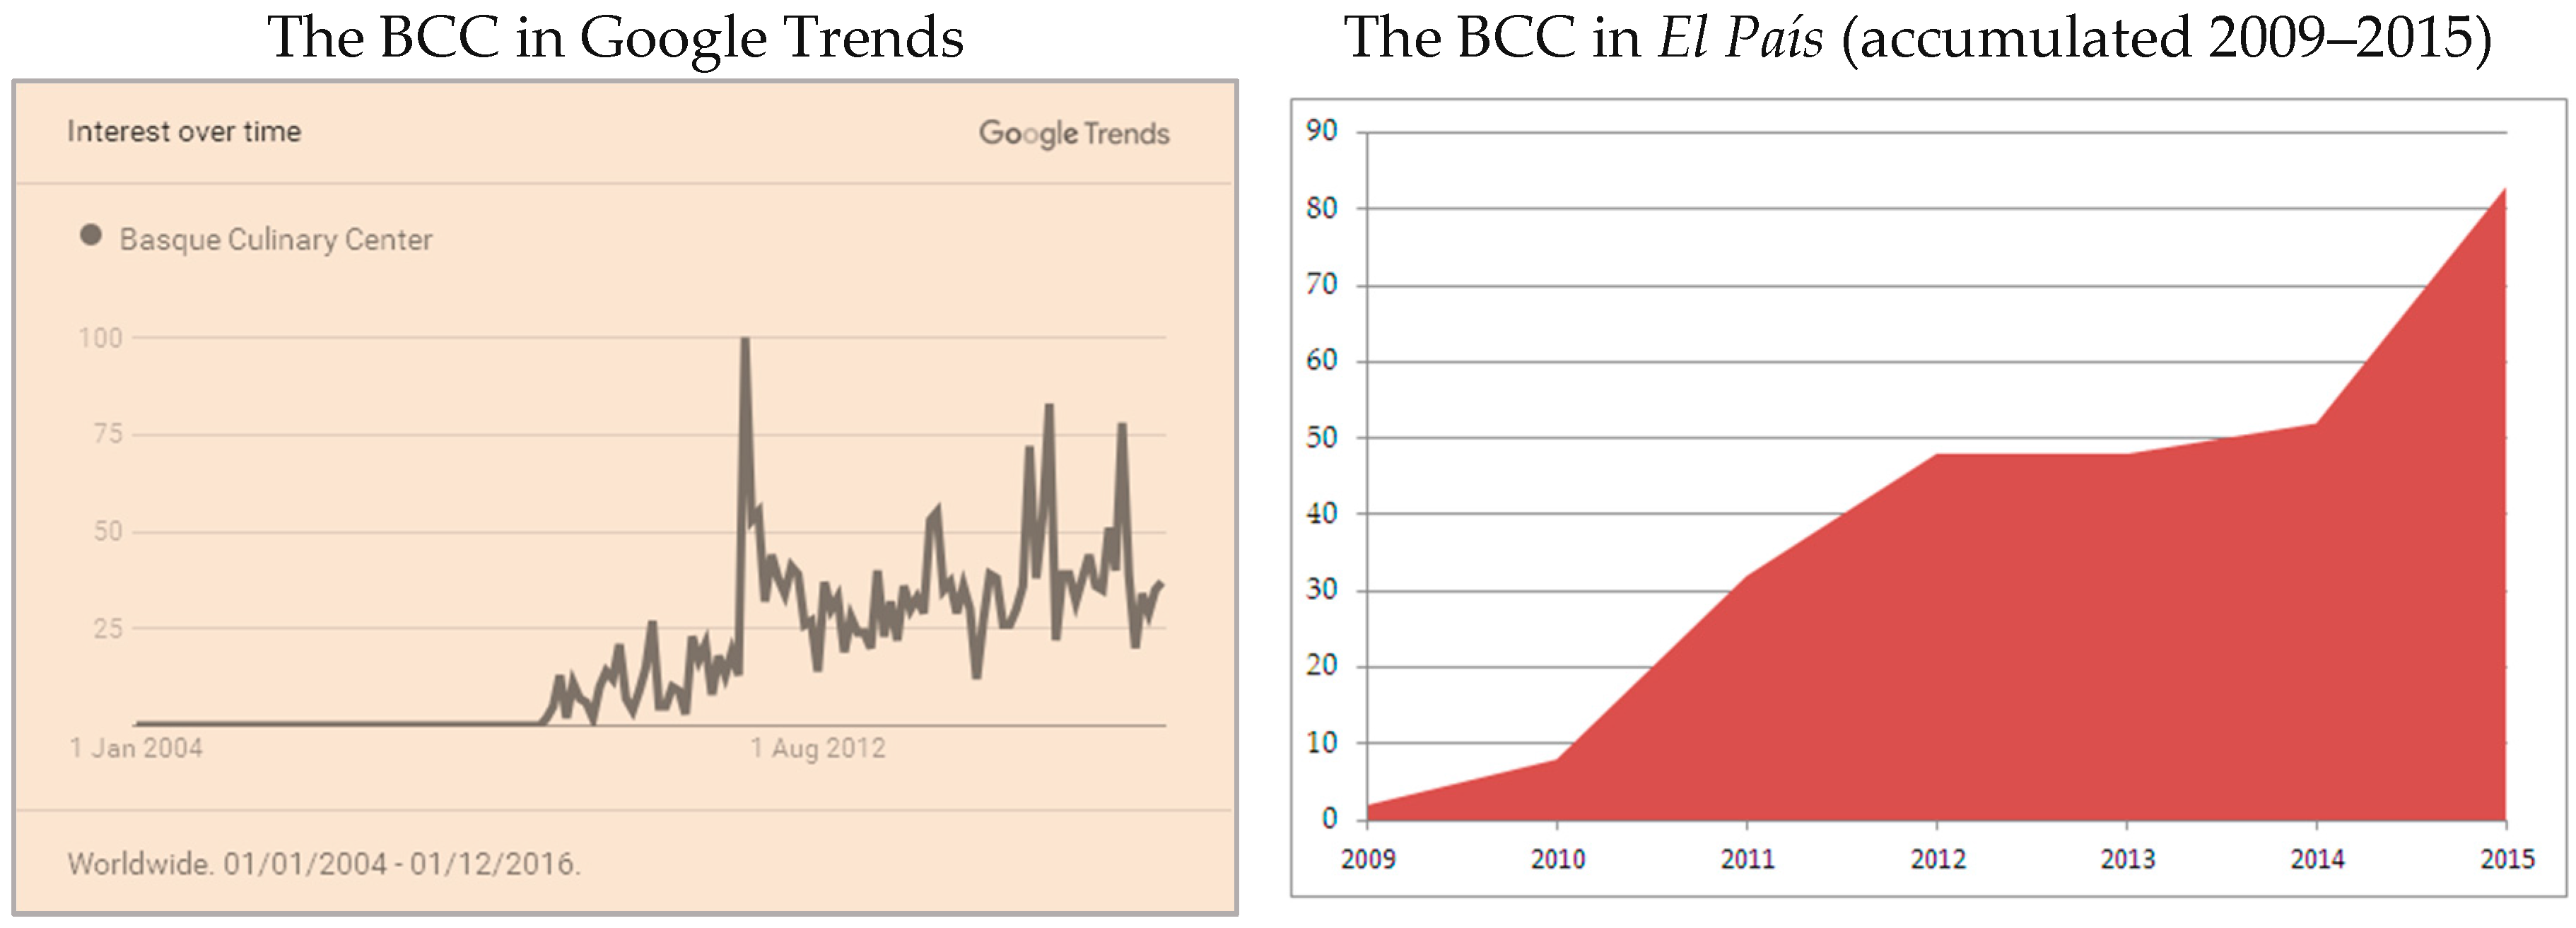
Figure 2 shows the BCC’s visibility in media: Google Trends and the Spanish newspaper El País.
To conclude, the Basque Culinary Centre (BCC) has been set up as an innovative educational training centre, and, as such, is an example of the transformation of industrial economies into economies focussed on cognitive and intangible aspects, a process which has been underpinned by changing consumer behaviour and digital media (a network phenomenon).
4. Methodology
The theory of networks helps us to understand the source of the brand power of a particular individual actor, as a consequence of the relations with the other actors who make up the network. The amount of brand power, which can be obtained within a network, depends on the density of the network itself. However, it should be borne in mind that the distribution of this branding power between the actors is defined by the relations existing between them. Thus, a group of actors (nodes) that take up a very central position within the co-citations network will exercise a much larger branding power with regard to the others.
The methodology of regressions with networks can be helpful for analysing the repositioning in press of an institution (the Basque Culinary Centre) as a result of its cobranding (co-citations) with some very famous Michelin-starred chefs who belong to the BCC’s Board and International Advisory Council. In other words, we want to test whether the connection of the BCC with these Michelin chefs can engine the BCC’s online connectivity, its position in media, and consequently fuel its brand power. This is a prototype that can contribute to the analytical understanding of culture-led repositioning of firms/cities/regions.
As far as the data is concerned, the connection between the actors (chefs) is represented though a symmetric matrix of dichotomous data. The co-citations between the chefs take the value 1 if there is a co-citation between them and 0 otherwise. This binary data facilitates testing pattern change.
Two different periods are studied, each lasting three years: one is previous to the setting up of the BCC in 2011 and the other afterwards. The first study period is between 2006 and 2008 (Matrix T1); the second from 2012 to 2014 (Matrix T2). Likewise, a difference matrix between the two periods is also obtained (Matrix T3). This T3 matrix reflects the changes which have taken place in the co-citation network before and after the opening of the BCC. This T3 matrix offers the possibility of testing if there has been a structural change, and therefore a repositioning of the BCC in the online press through the increased connections of the chefs. We call T3 matrix “change matrix” or “intervention matrix”.
The focus of analysis is the co-citations among the thirty-six chefs selected for the research: eighteen chefs belong to the Board and/or the International Advisory Council of the BCC and the other eighteen chefs are not involved with the BCC.
The actors or nodes which make up the network are listed below.
- (1)
GROUP 1. Actors belonging to the Advisory Council or the Board of the Basque Culinary Center: Juan María Arzak, Pedro Subijana, Martín Berasategui, Andoni Luis Aduriz, Karlos Arguiñano, Eneko Atxa, Hilario Arbelaitz, Ferrán Adriá, Rene Redzepi, Heston Blumenthal, Michel Bras, Alex Atala, Gastón Acurio, Yukio Hattori, Massimo Botura, Dan Barber, Joan Roca, and Enrique Olvera.
- (2)
GROUP 2. Actors not connected to the Basque Culinary Center foundation: Quique Dacosta, David Muñoz, Carme Ruscalleda, Jordi Cruz, Ramón Freixa, Diego Guerrero, Nacho Manzano, Raül Balam, Oscar Velasco, Gordon Ramsay, Alain Ducasse, Joël Robuchon, Paul Bocuse, Zhenxiang Dong, Joachim Wissler, Sven Elverfeld, Carlos Gaytán, and Mauro Colagreco.
To recap again, the hypothesis to be tested is whether the influential Michelin-starred chefs who belong to the BCC (either to the BCC’s Board or to the BCC’s International Advisory Council) could have contributed to the BCC’s co-branding in press. Differently put, the question is whether the influential Michelin-starred chefs who belong to the BCC could have put the BCC on the media map. In order to avoid spurious causation the following controls are introduced: (1) influential Michelin chefs who are not connected to the BCC (Group 2) have been introduced in order to avoid the study being influenced by the belonging to the BCC. Group 2 encompasses Michelin chefs who do not belong to the BCC; (2) both national and foreign chefs have been selected for both Groups 1 and 2, in order to avoid the study being influenced by the chefs’ geographical proximity to the BCC; and (3) a proper mix of “number of Michelin stars” has been designed for both Groups 1 and 2, in order to avoid the study being influenced by the number of Michelin stars. These are some controls for variables responsible for latent homophily or environmental confounding. Spurious causation can also arise as a result of random sampling to the extent Group 1 is only a subset of all chefs. However, this is not the case since there is no random sampling of a subset, but the extraction of all data of all the BCC Michelin chefs. That is, these co-citations represent the entire population dataset.
The database was put together from data gathered from the newspaper El País. El País is the leading newspaper in Spain in terms of readership, as stated by both the OJD and its Alexa ranking. In September 2014 the auditors announced that the printed edition also had the highest circulation figures. Spain was chosen for the framework of the research precisely because the majority of the BCC students come from Spain.
Co-citation data was extracted and the data matrices were drawn up, thereby revealing the co-citations between different actors, before and after the setting up of the BCC. The matrices are symmetric 36 × 36, in which the rows and columns include each of the actors who take part in the network.
Table 1 lists the characteristics of the actors in order to complete the information included in the analysis:
Once the data was obtained and the matrices drawn up, an analysis of the indicators was carried out from an individual point of view. The graphic representations corresponding to the two periods are performed and the analysis is carried out focussing on which chefs obtain a more central or more influential position.
In order to identify the central actors in the network, that is, those actors who are better related, who have the most influence in the branding network, or who have a greater degree of integration, indicators of degree-centrality, of closeness-centrality and of betweeness-centrality are employed in
Table 2 (Freeman [
30]).
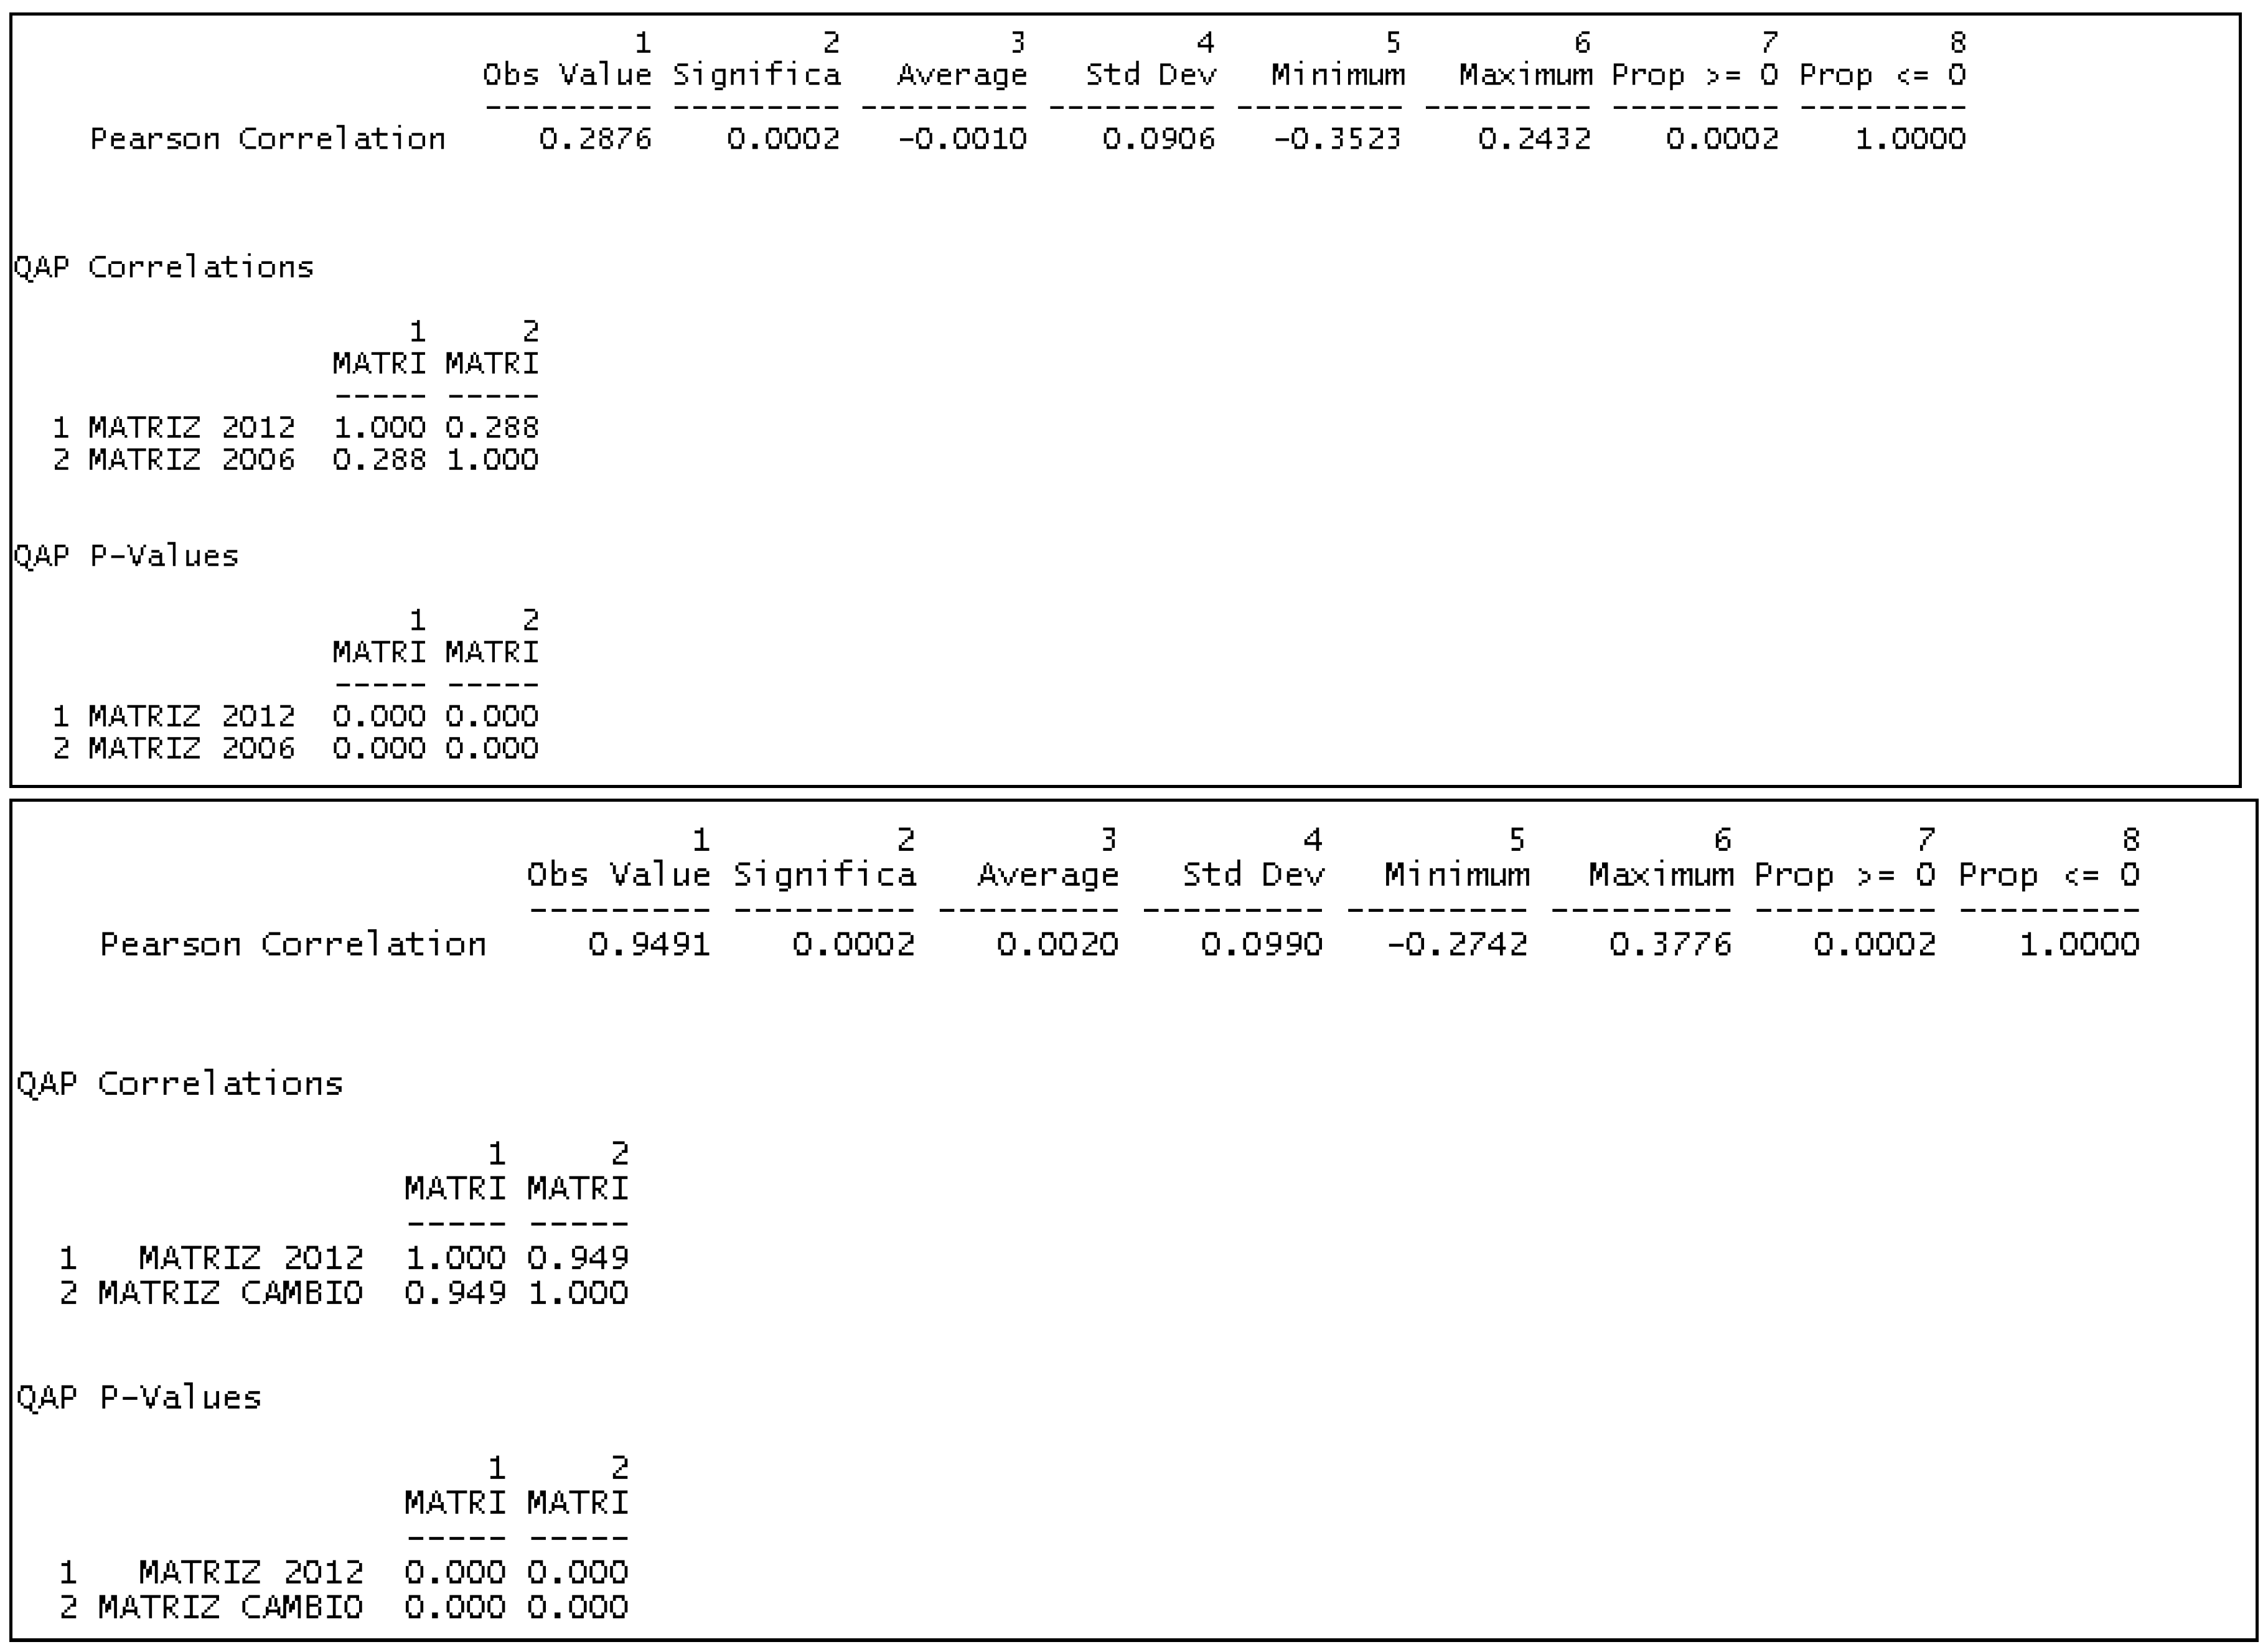
Following this, the coefficient of correlation (QAP) is calculated among T1 (matrix of co-citations before the opening of the BCC, 2006–2008), T2 (matrix of co-citations after the opening of the BCC, 2012–2014), and T3 (the change matrix, where T3 = T2 − T1), in order to check for topological similarity between the two periods (see
Figure 3). Then a multiple regression (MRQAP) is performed to test causality (see
Figure 4).
Quadratic assignment procedure (QAP) is a bootstrap approach designed to make inferences comparing different networks on the same set of nodes. Basically, the idea is to test whether a pair of matrices is correlated (Dekker, Krackhardt, and Snijders [
31]; Krachardt [
32]; Robins [
33]). Then, a new permutation procedure is proposed for QAP in order to extend it to network regression (multiple regression quadratic assignment procedure—MRQAP-). The software UCINET (Analytic Technologies: Harvard, MA, USA) has been used as a study tool for all of the aforementioned analysis processes.
5. Results
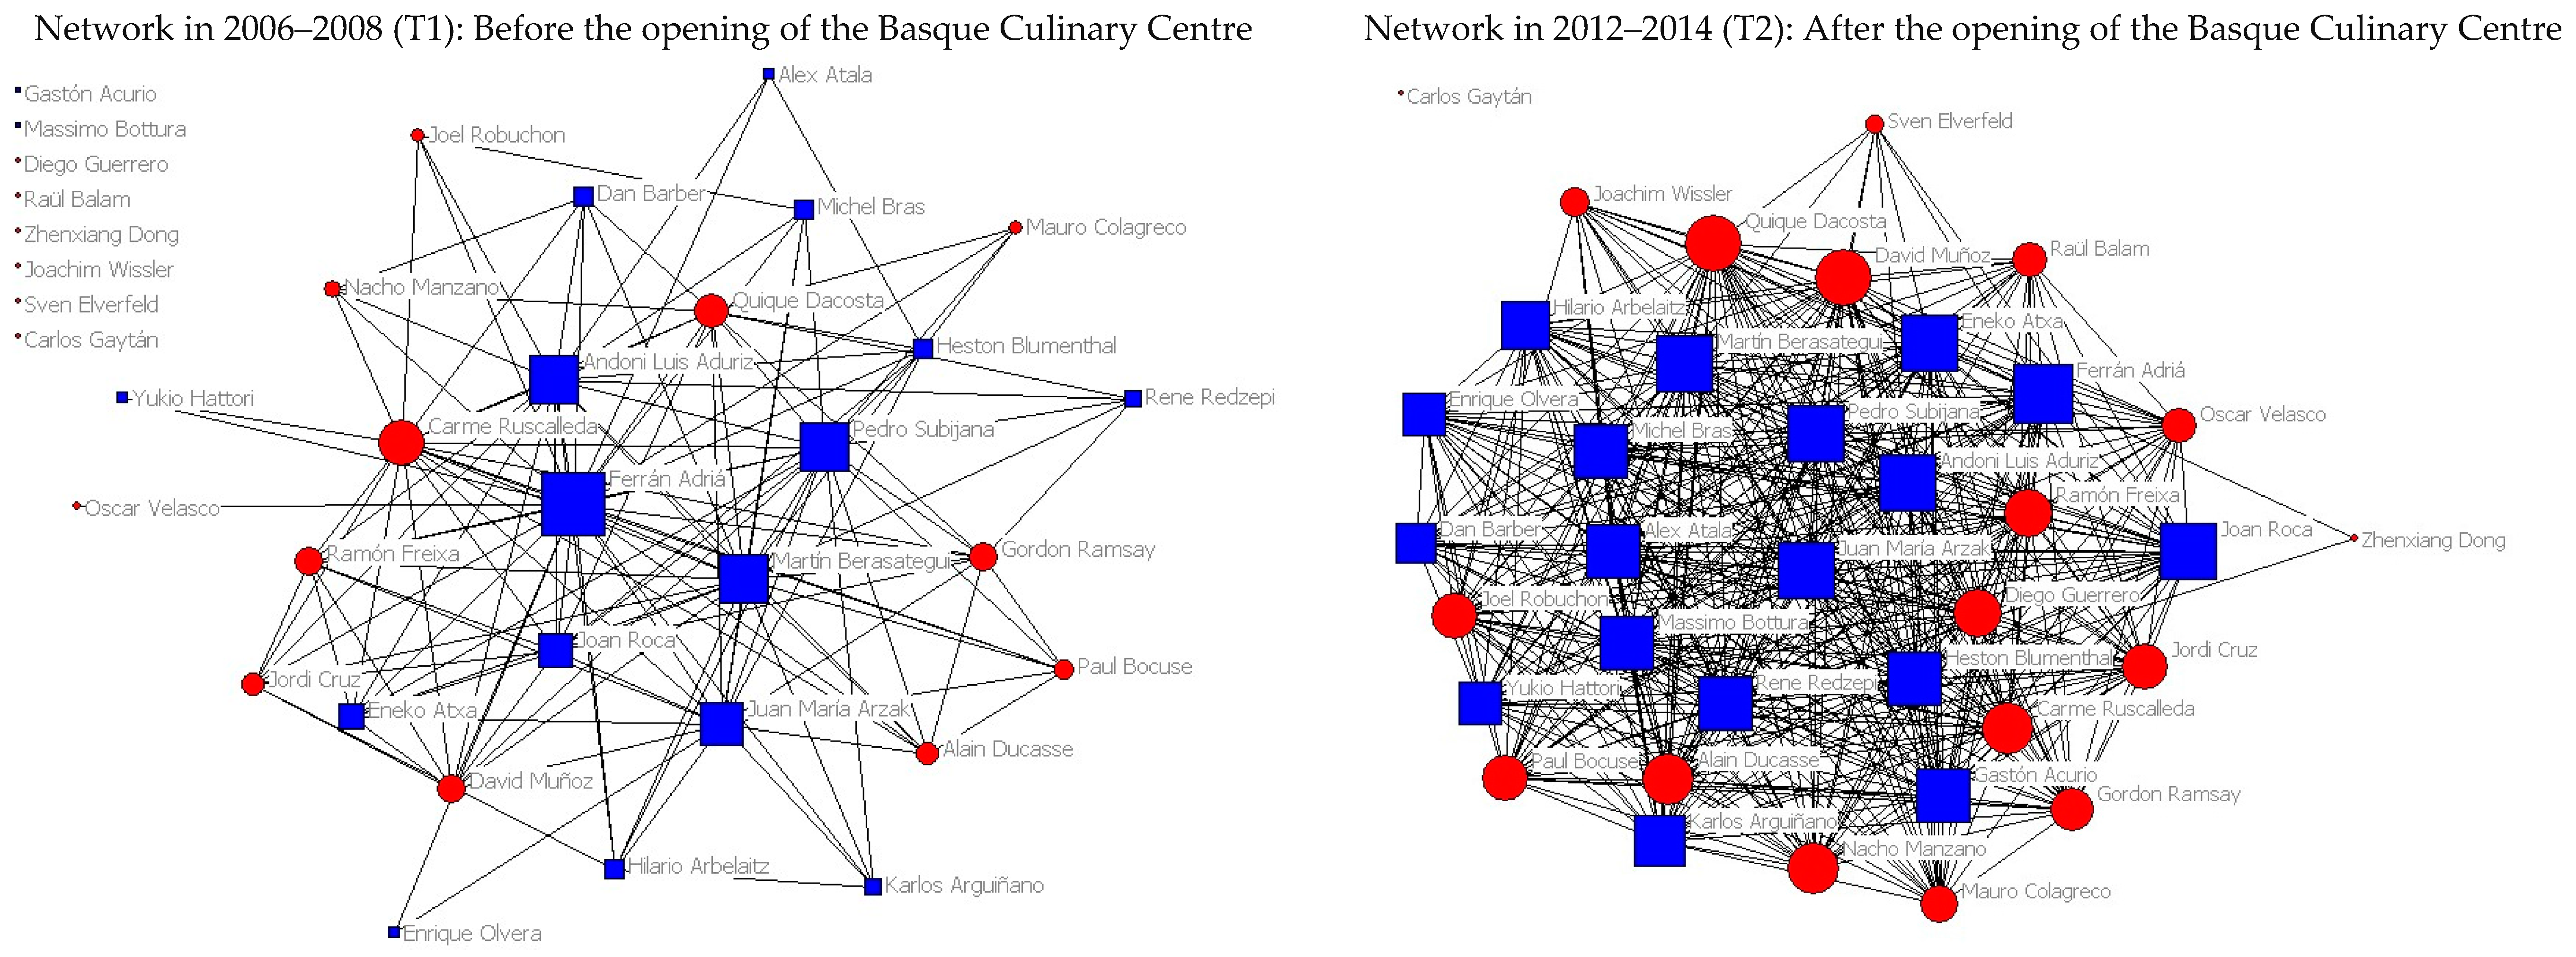
According to the networks in
Figure 5, the density for the period before the opening of the Basque Culinary Centre was 0.209. That is, the network is intra-connected at around 21%. For the period after the opening of the Basque Culinary Centre, the density is 0.739. That is, the network is intra-connected at around 74%. This means that there is a higher number of connections (co-citations) between nodes after the opening of the BCC, although this does not necessarily imply causality.
According to
Figure 5, the nodes that appear more in the centre, in this development from one period to another, are mainly those who belong to the BCC; in particular Massimo Bottura, Joan Roca, Juan Mari Arzak, Martin Berasategui, and René Redzepi are very interrelated.
Table 2 shows centrality indicators for every node, before and after the opening of the BCC. Ferran Adriá is the chef who is the closest to the rest, maintaining a connection in one or two steps with 50% of the network actors. Below, the other actors in the network also show similar levels of closeness, with between 40% and 50%. Among this numerous group, the ones that are closest to 50% are Pedro Subijana, Andoni Luis Aduriz, Martin Berasategui, Eneko Atxa, Joan Roca, Quique Dacosta, and David Muñoz. In other words, the chefs who belong to the BCC (Group 1) occupy central positions in the network after the opening of the BCC, except for two chefs: Quique Dacosta and David Muñoz, who belong to Group 2. This means that there are many more co-citations in El País among the chefs who belong to the BCC.
5.1. Coefficient of Correlation (QAP)
As can be seen in
Figure 3, the coefficient of correlation (QAP) between T1 (matrix of co-citations before the opening of the BCC 2006–2008) and the T3 matrix (the change matrix, T3 = T2 – T1) is 0.288, whereas the coefficient of correlation (QAP) between T2 (the matrix of co-citations after the opening of the BCC 2012–2014) and T3 is 0.949. Therefore, the topology of the T2 matrix is highly correlated with the T3 matrix. In other words, the topology of the network after the opening of the BCC (T2 matrix) is highly correlated with the change matrix T3, and the topological proximity of T3 with T1 is very small.
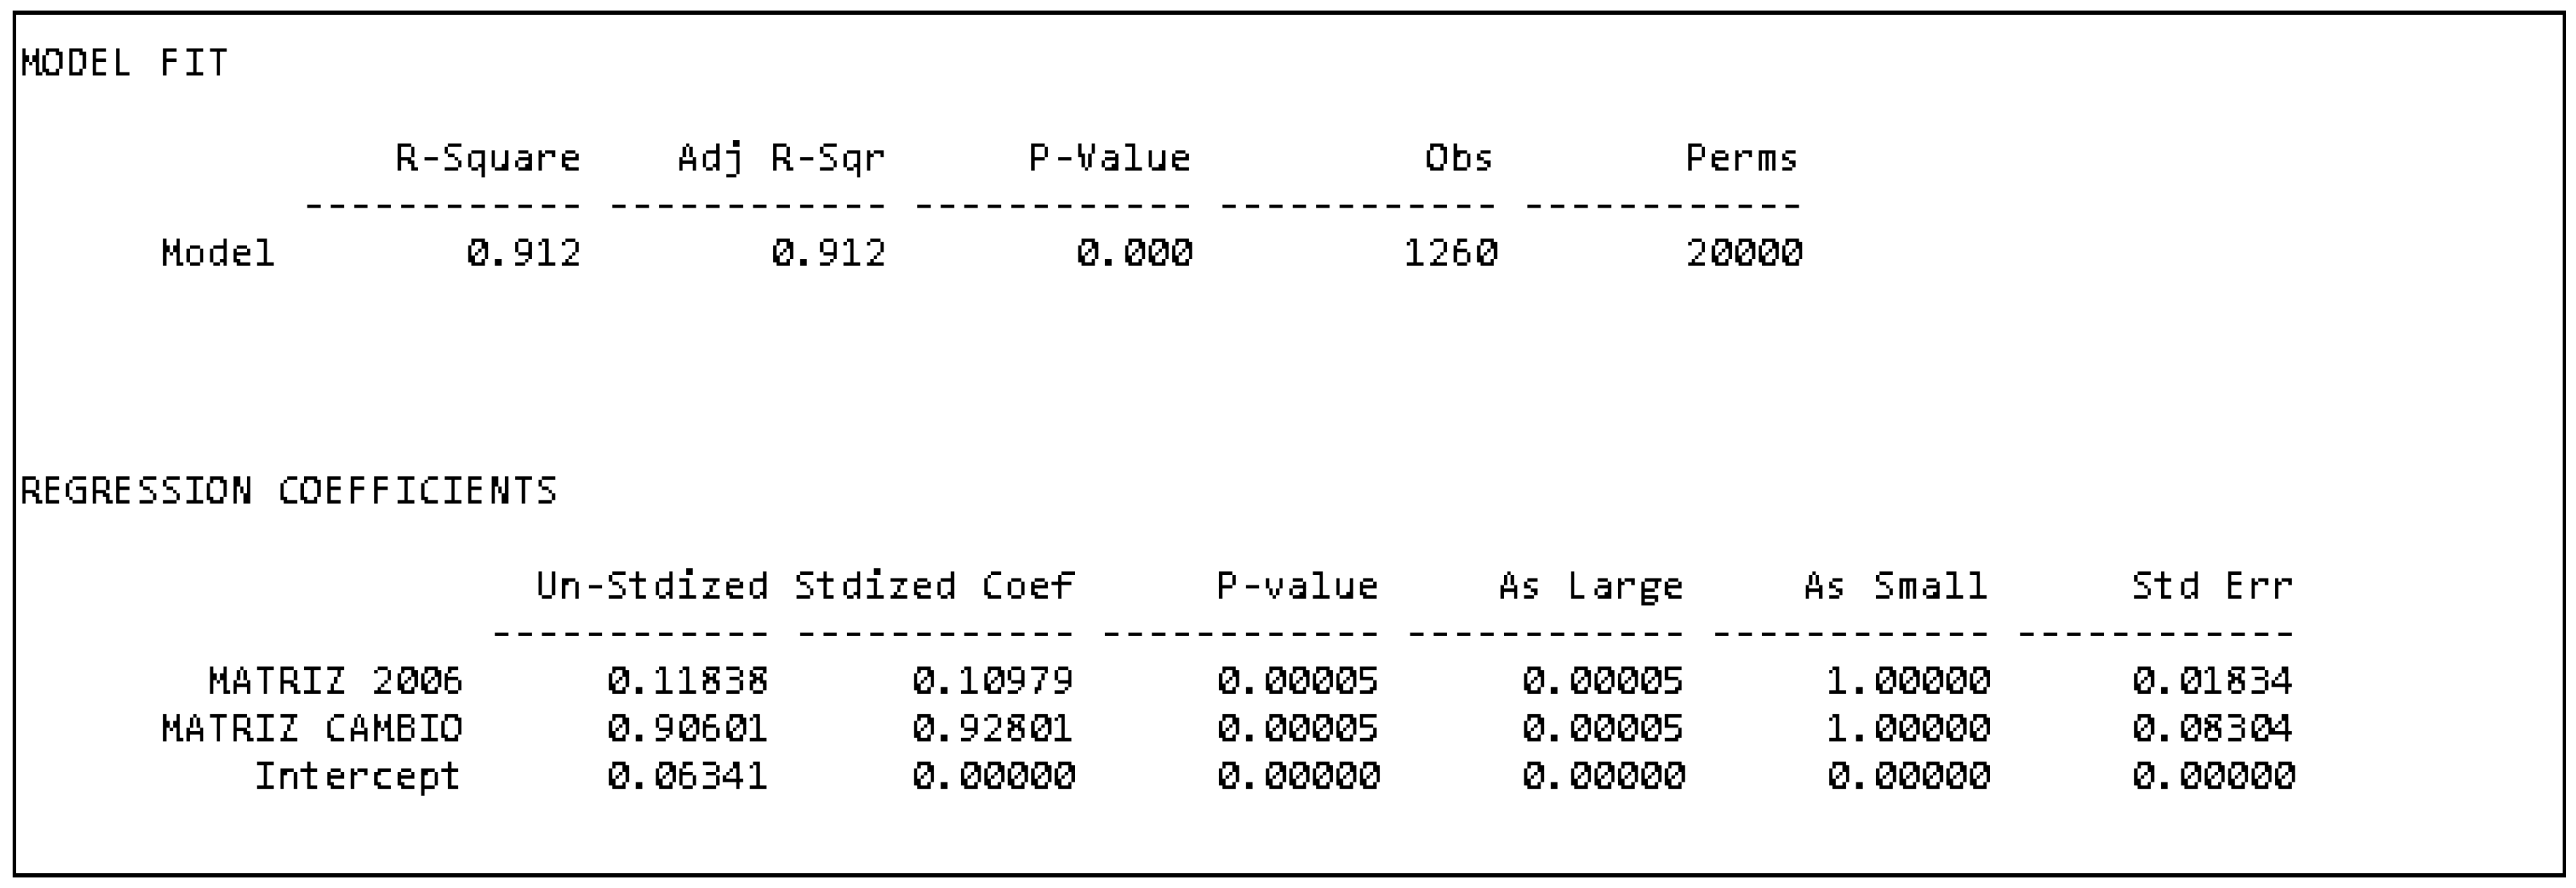
5.2. Regression with Network Multiple Regression Quadratic Assignment Procedure—MRQAP-
Intervention analysis or event/infrastructure study is used to assess the impact of the Basque Culinary Centre on the network topology. That is, it is important to prove causality based on two conditions: (1) whether the topology of the network after the impact is caused by the change matrix; and (2) whether the Michelin chefs belonging to the Advisory Council or Board of the BCC occupy central positions in the change matrix. The question then arises as to whether the change-matrix T3 has a high enough power to explain the topology of T2 (matrix of co-citations after the opening of the BCC 2012–2014).
To solve this question the following regression is performed: T2 (dependent variable, or matrix after the intervention/change) is regressed against T1 (matrix 2006–2008 or matrix before the intervention/change), T3 matrix (the change matrix, whereaT3 = T2 – T1) and the intercept.
Therefore, a model is proposed that is expressed in the following way:
In the expression the data matrix for 2012–2014 (T2 matrix) is designated as the dependent variable y, as a function of the regressors or explanatory variables x2 and x3, which represent the data matrices 2006–2008 (T1 matrix) and change matrix (T3 matrix). Parameters β1, β2, and β3 are fixed and unknown, and u represents the random disturbance.
Introducing regressors in the analysis, the analytical expression is represented in the following way:
Bearing in mind the elaboration of the database composed of n observations, the model may be expressed as a matrix in the following way. The expressions of the independent term
β1, take the value one for all of the observations.
By placing the systematic part of the disturbance on the right of the equation, the following population regression function is obtained:
The objective of the construction of the model lies in the estimation of the unknown parameters that show the effect of the alteration of the explanatory variables on the dependent variable. Therefore, it is possible to obtain the regression function, represented in the way expressed below, where
i represents each observation of the dataset:
In
Figure 4 the estimations of the regression can be seen.
The results are the following:
According to the results, the model is representative and all the variables are significant. The results indicate that the Matrix T2 (matrix for 2012–2014) is mainly explained by the topology of the T3 change matrix (with a coefficient of 0.906). Therefore, it has been proved that a structural change took place in the positioning of the BCC chefs in online media (
El Pais newspaper) after the opening of the Basque Culinary Centre.
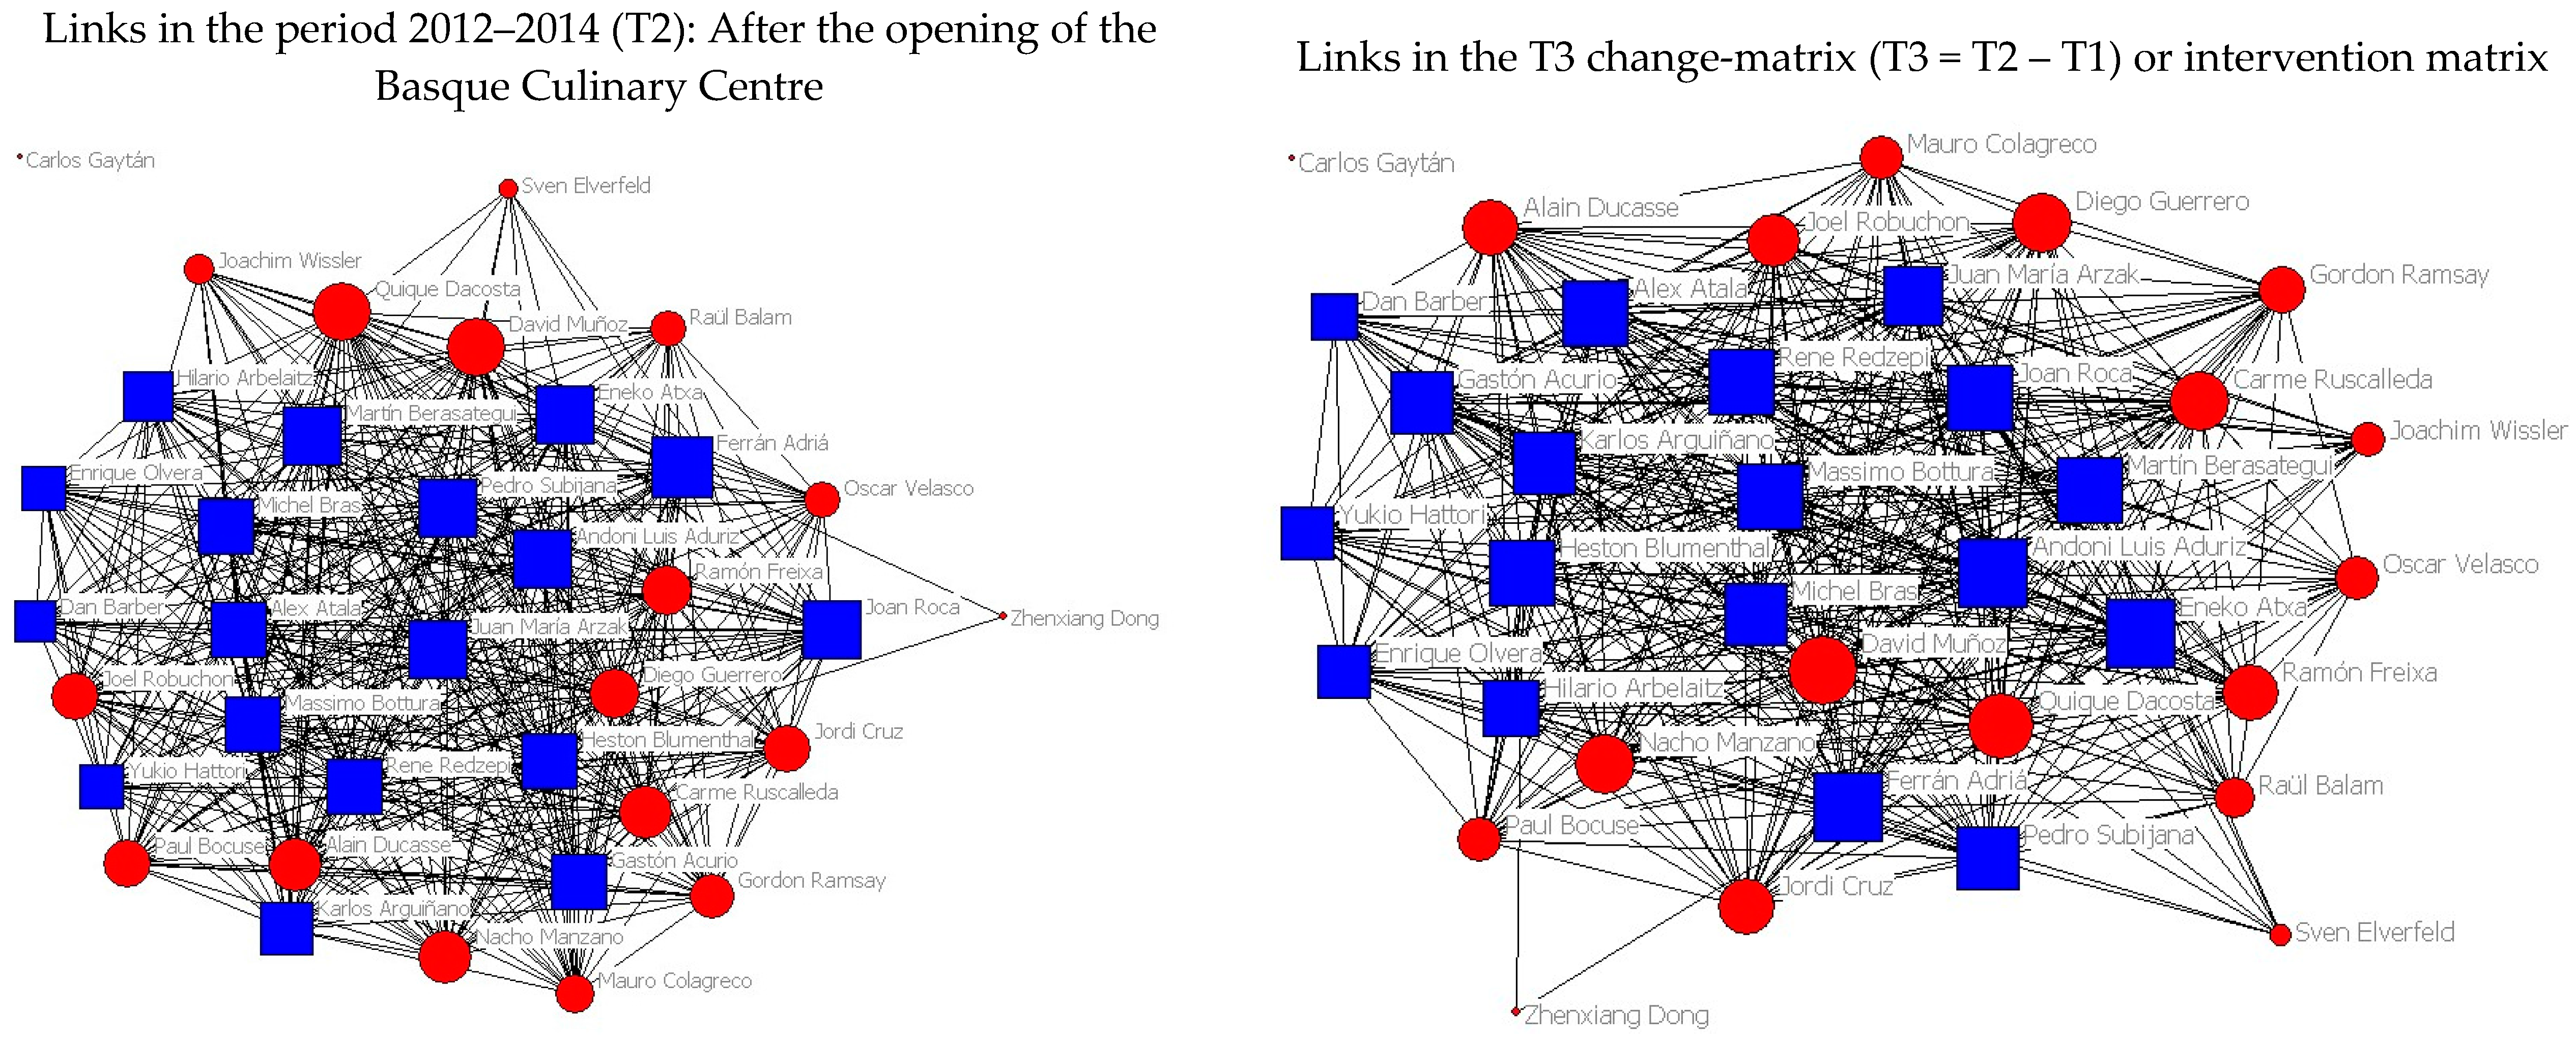
Figure 6 shows both matrixes. The composition of matrix 2012 is fundamentally related to the matrix that reflects the evolution between the period prior to and following the creation of Basque Culinary Centre (T3 change matrix).
As a result, we are drawing the following conclusions: (1) the chefs who belong to the BCC occupy central positions in the T3 change network; and (2) the T3 change network is the most relevant explanatory variable in the regression. This means that there are many more co-citations in El País among the chefs who belong to the BCC, and more articles around these chefs. The group of actors (nodes) that take up a very central position within the T3 co-citations network will exercise a much larger branding power with regard to the others.
In other words, the connection of the BCC with the Michelin Chefs through the Advisory Board may be fuelling an increasing number of articles on the BCC in online press, which had an impact on the BCC’s real economic return. The process of image accumulation (accumulation of press articles, accumulation of semantic connections and mental association) may have an impact on the BCC’s number of applicants (students), thereby generating real symbolic capital. Understanding what drives these cognitive connections plays a part in building an effective brand from a cultural asset.
6. Discussion
Cultural goods can change connectivity patterns in digital media, a critical issue in repositioning institutions/cities/regions (e.g., former or declining industrial cities) and for competitiveness as a whole. This paper aimed to contribute to the analytical understanding of “culture-led repositioning” through inference with networks. For this purpose we have performed regression analysis with cultural networks (observational cross-sectional network data) from digital media for a specific cultural case study: the Basque Culinary Center. This is a prototype, an approximation to the real causation model. This methodology can be helpful for analyzing the symbolic repositioning of institutions/cities/regions, as a result of a new cultural investment (e.g., the Guggenheim Museum in Bilbao, the Louvre-Lens in Lens, the Pompidou-Metz in Metz, or the recently inaugurated La Cité du Vin in Bordeaux).
Finally, considering this is a prototype study, it is necessary to carry out future studies with significant samples and different bootstrapping procedures although, currently, the double-partialing approach by Dekker, Krackhardt, and Snijders [
31] still seems to be the preferred method. Causal inference with cross-sectional observational social network data is useful for detecting structural change (e.g., changes in topology due to culture-driven connectivity-pattern change), but it might still be difficult to fully control for the variables responsible for environmental confounding, homophily, or social influence, that can give rise to some spurious associations if the adequate controls are not put in place.


