A Synthesis of Studies on Land Use and Land Cover Dynamics during 1930–2015 in Bangladesh


Abstract
:1. Introduction
2. Study Area and Source of Data
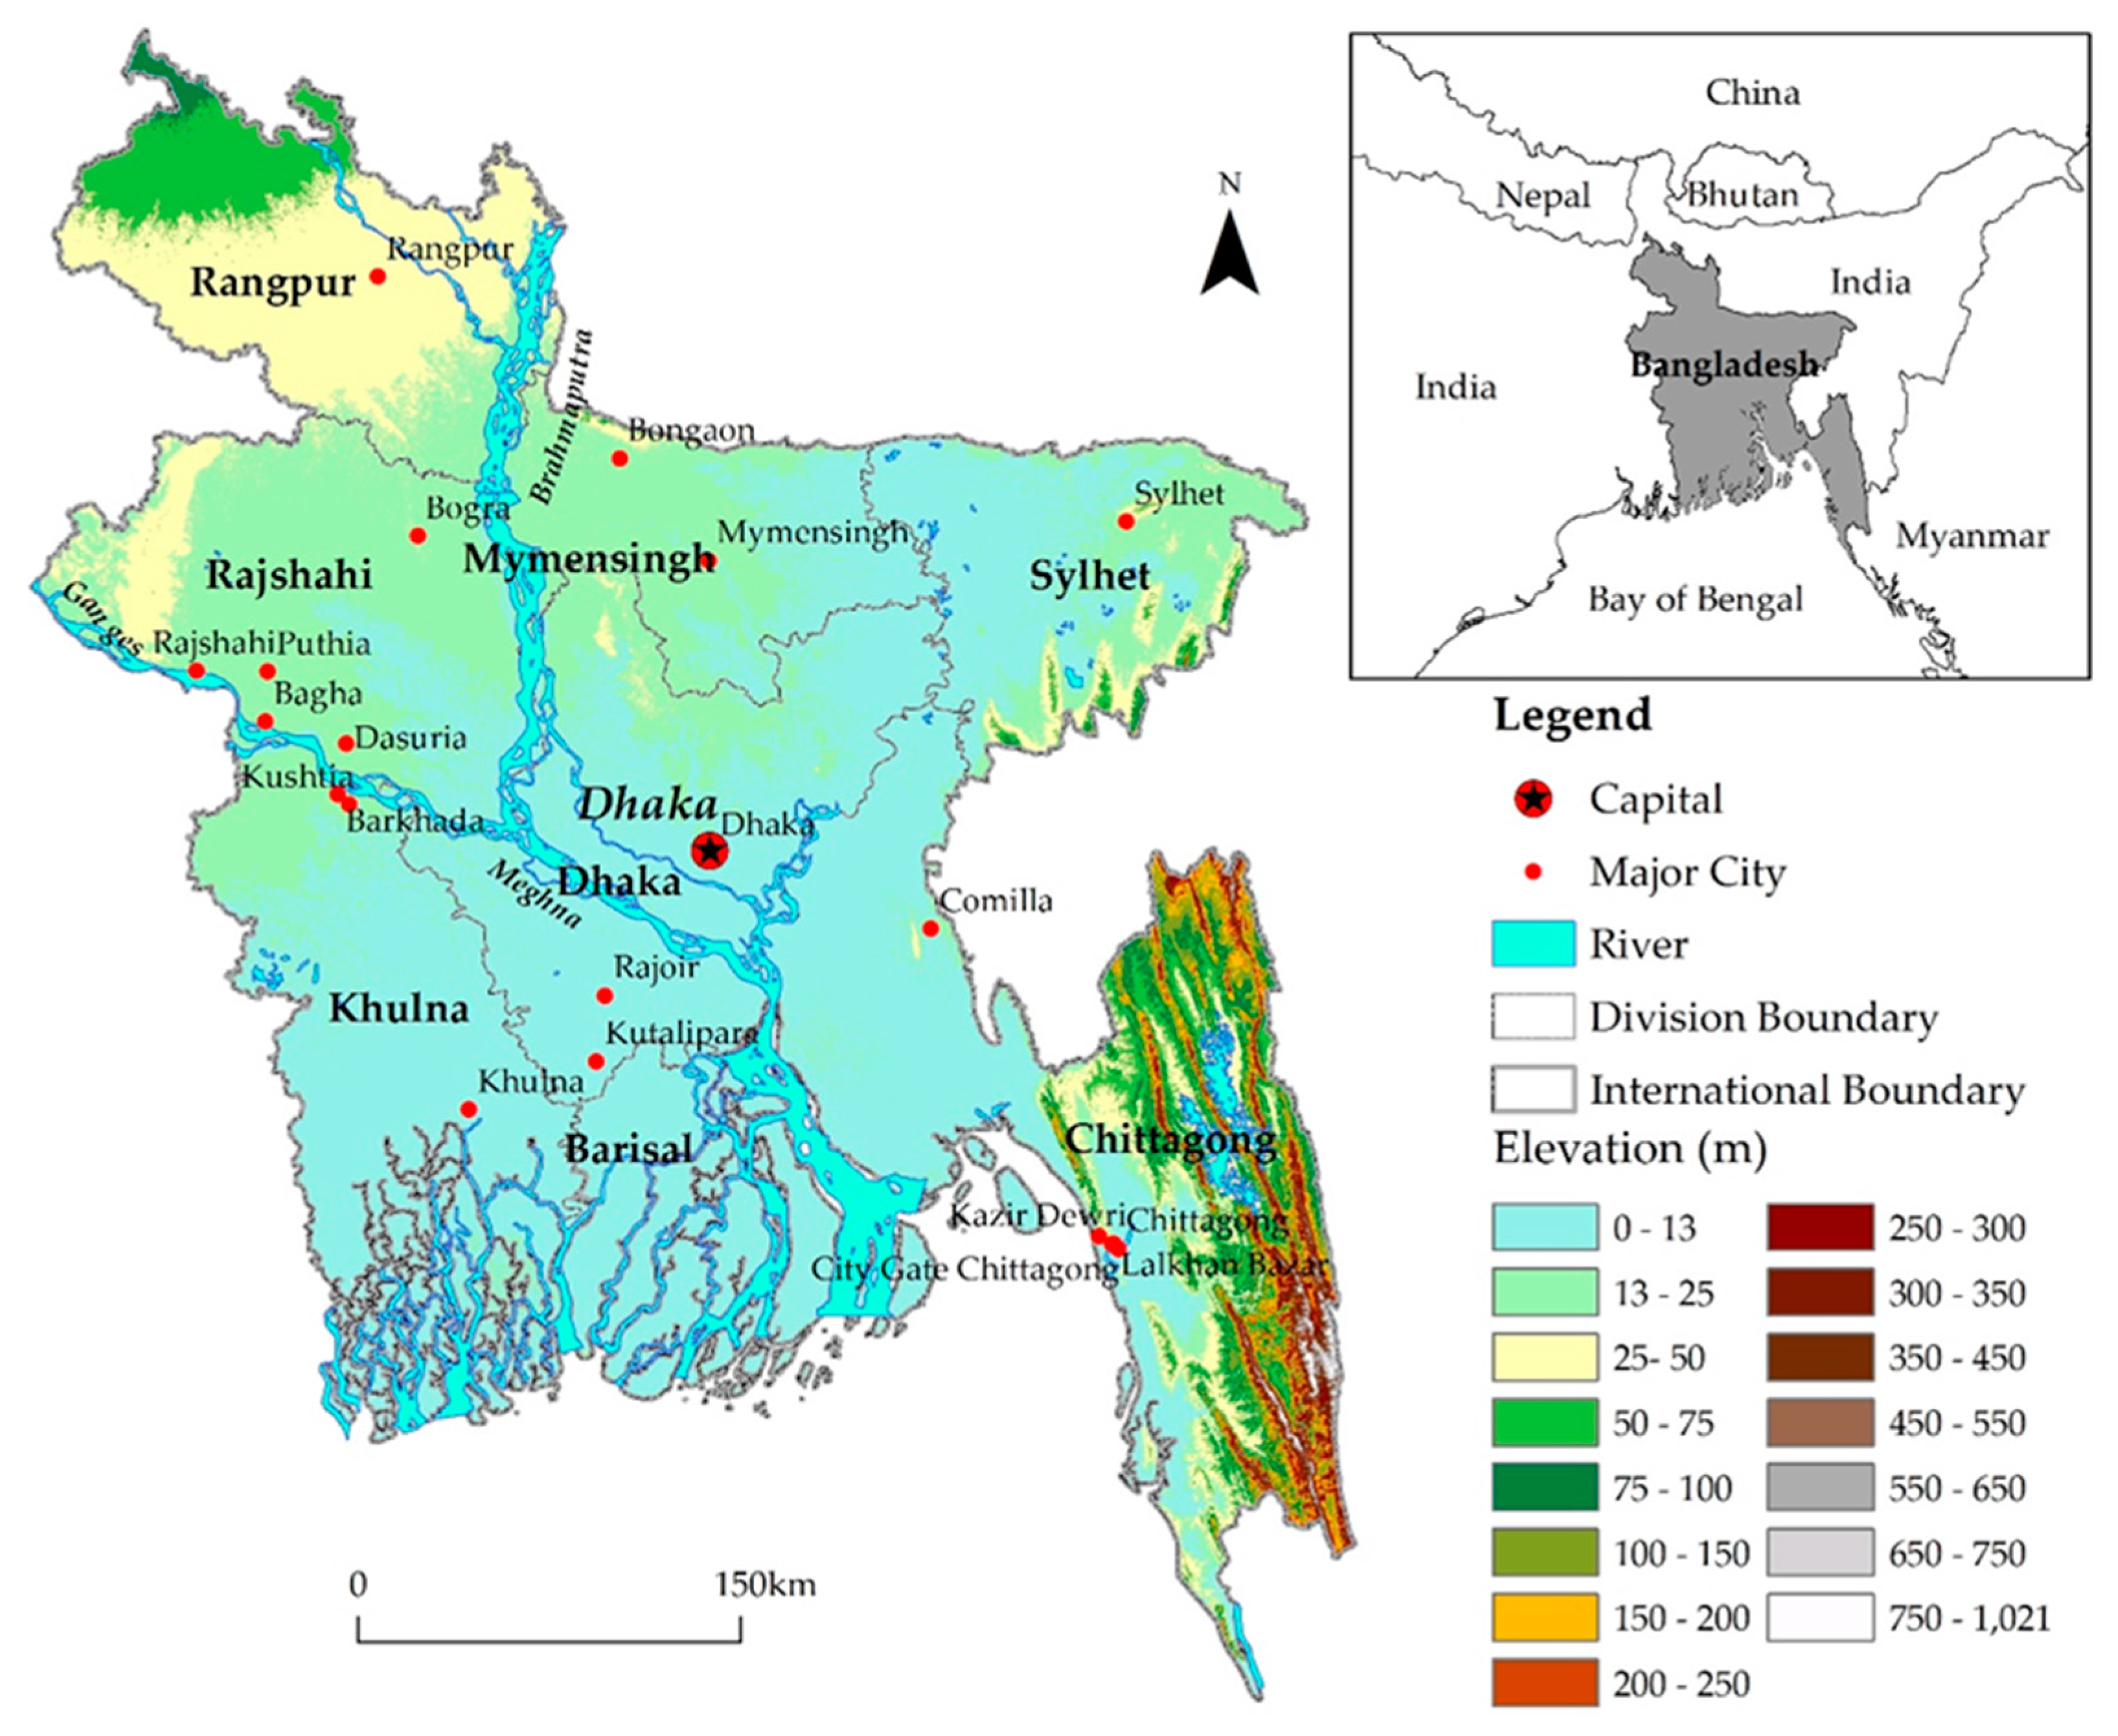
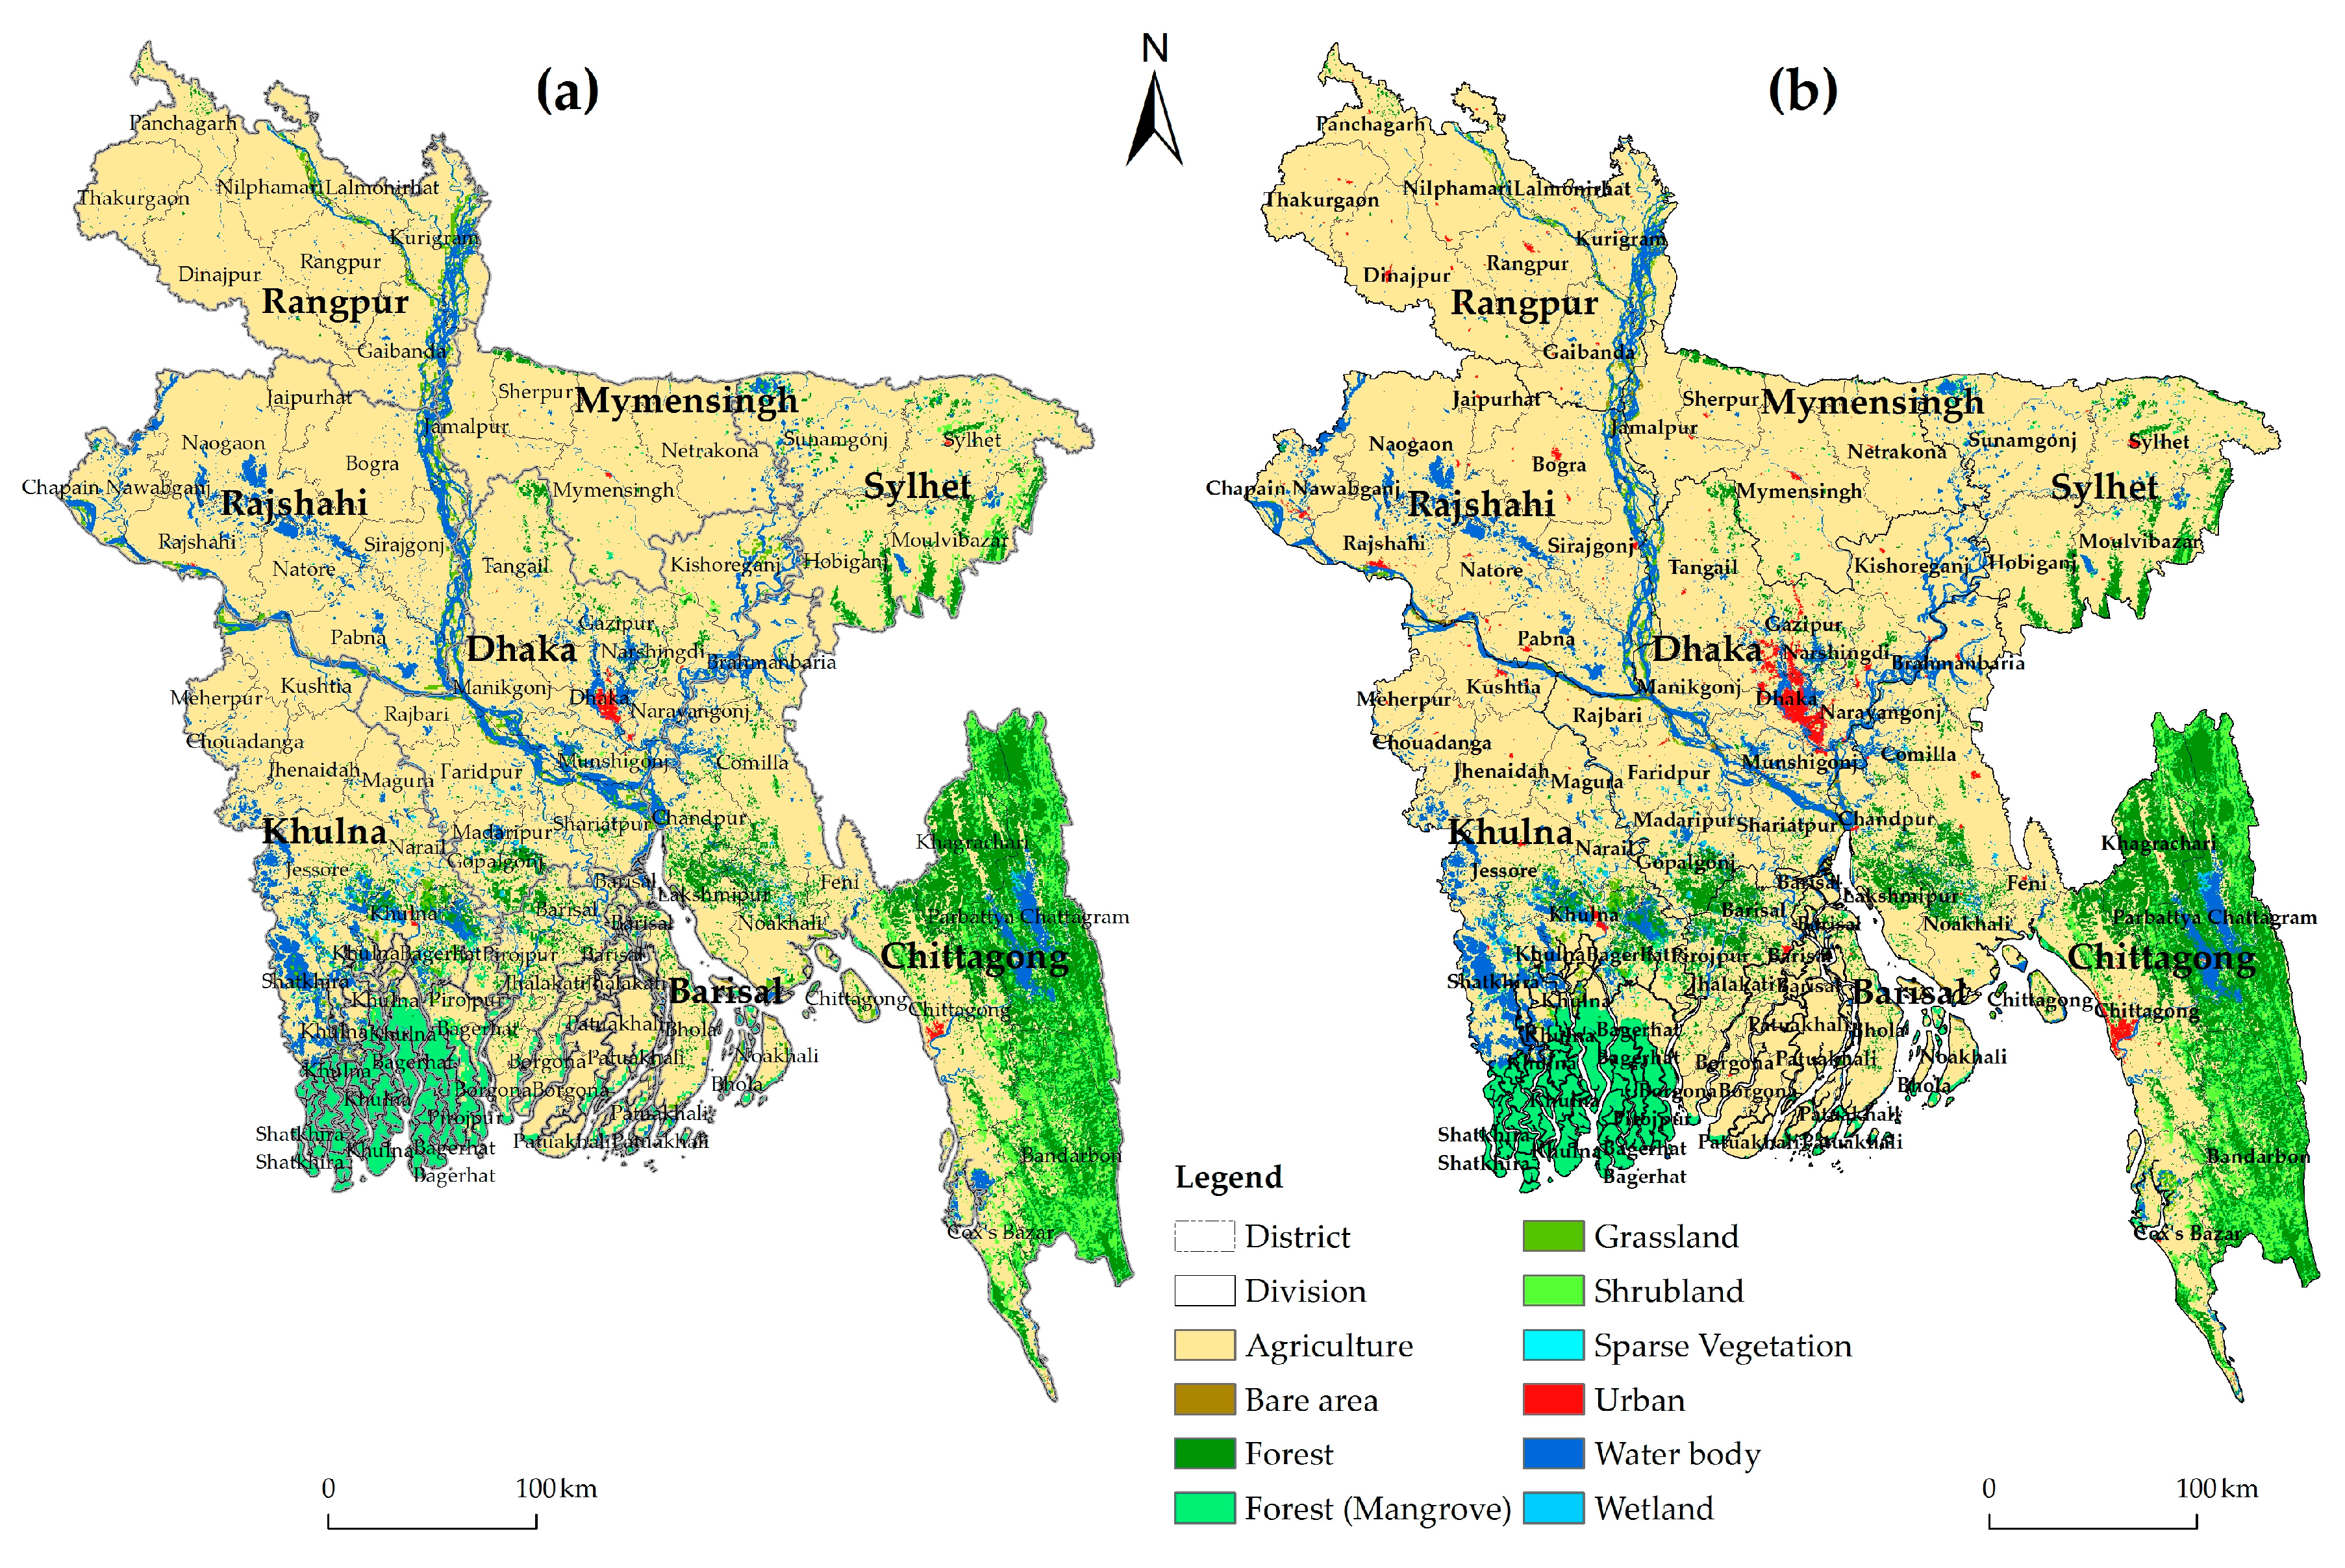
2.1. Study Area
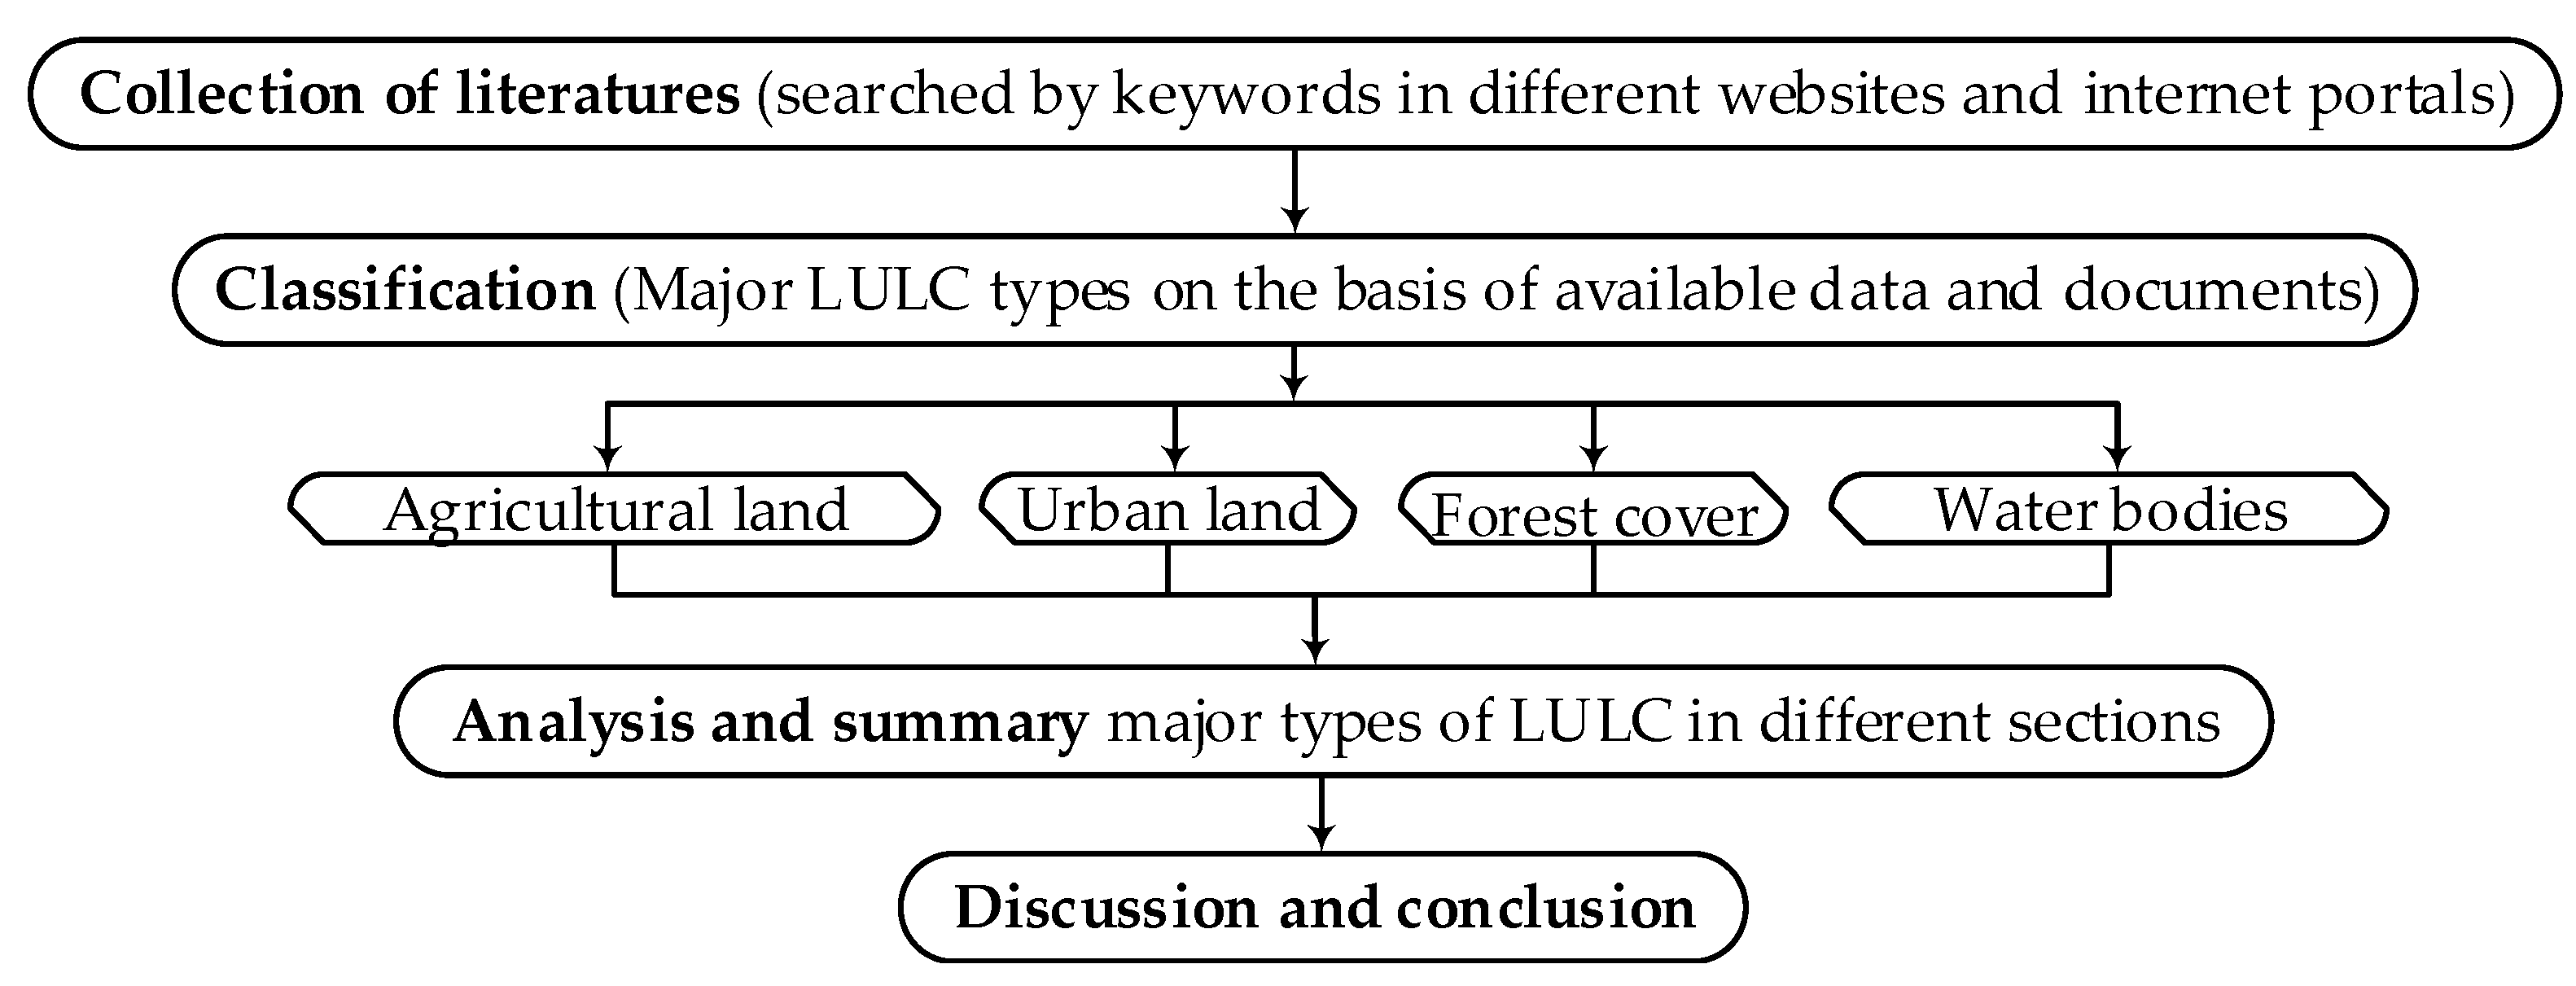
2.2. Source of Data
3. Composition, Distribution and Change of Major LULC Classes
3.1. Overall LUCC Scenario at the National Level
- ➢
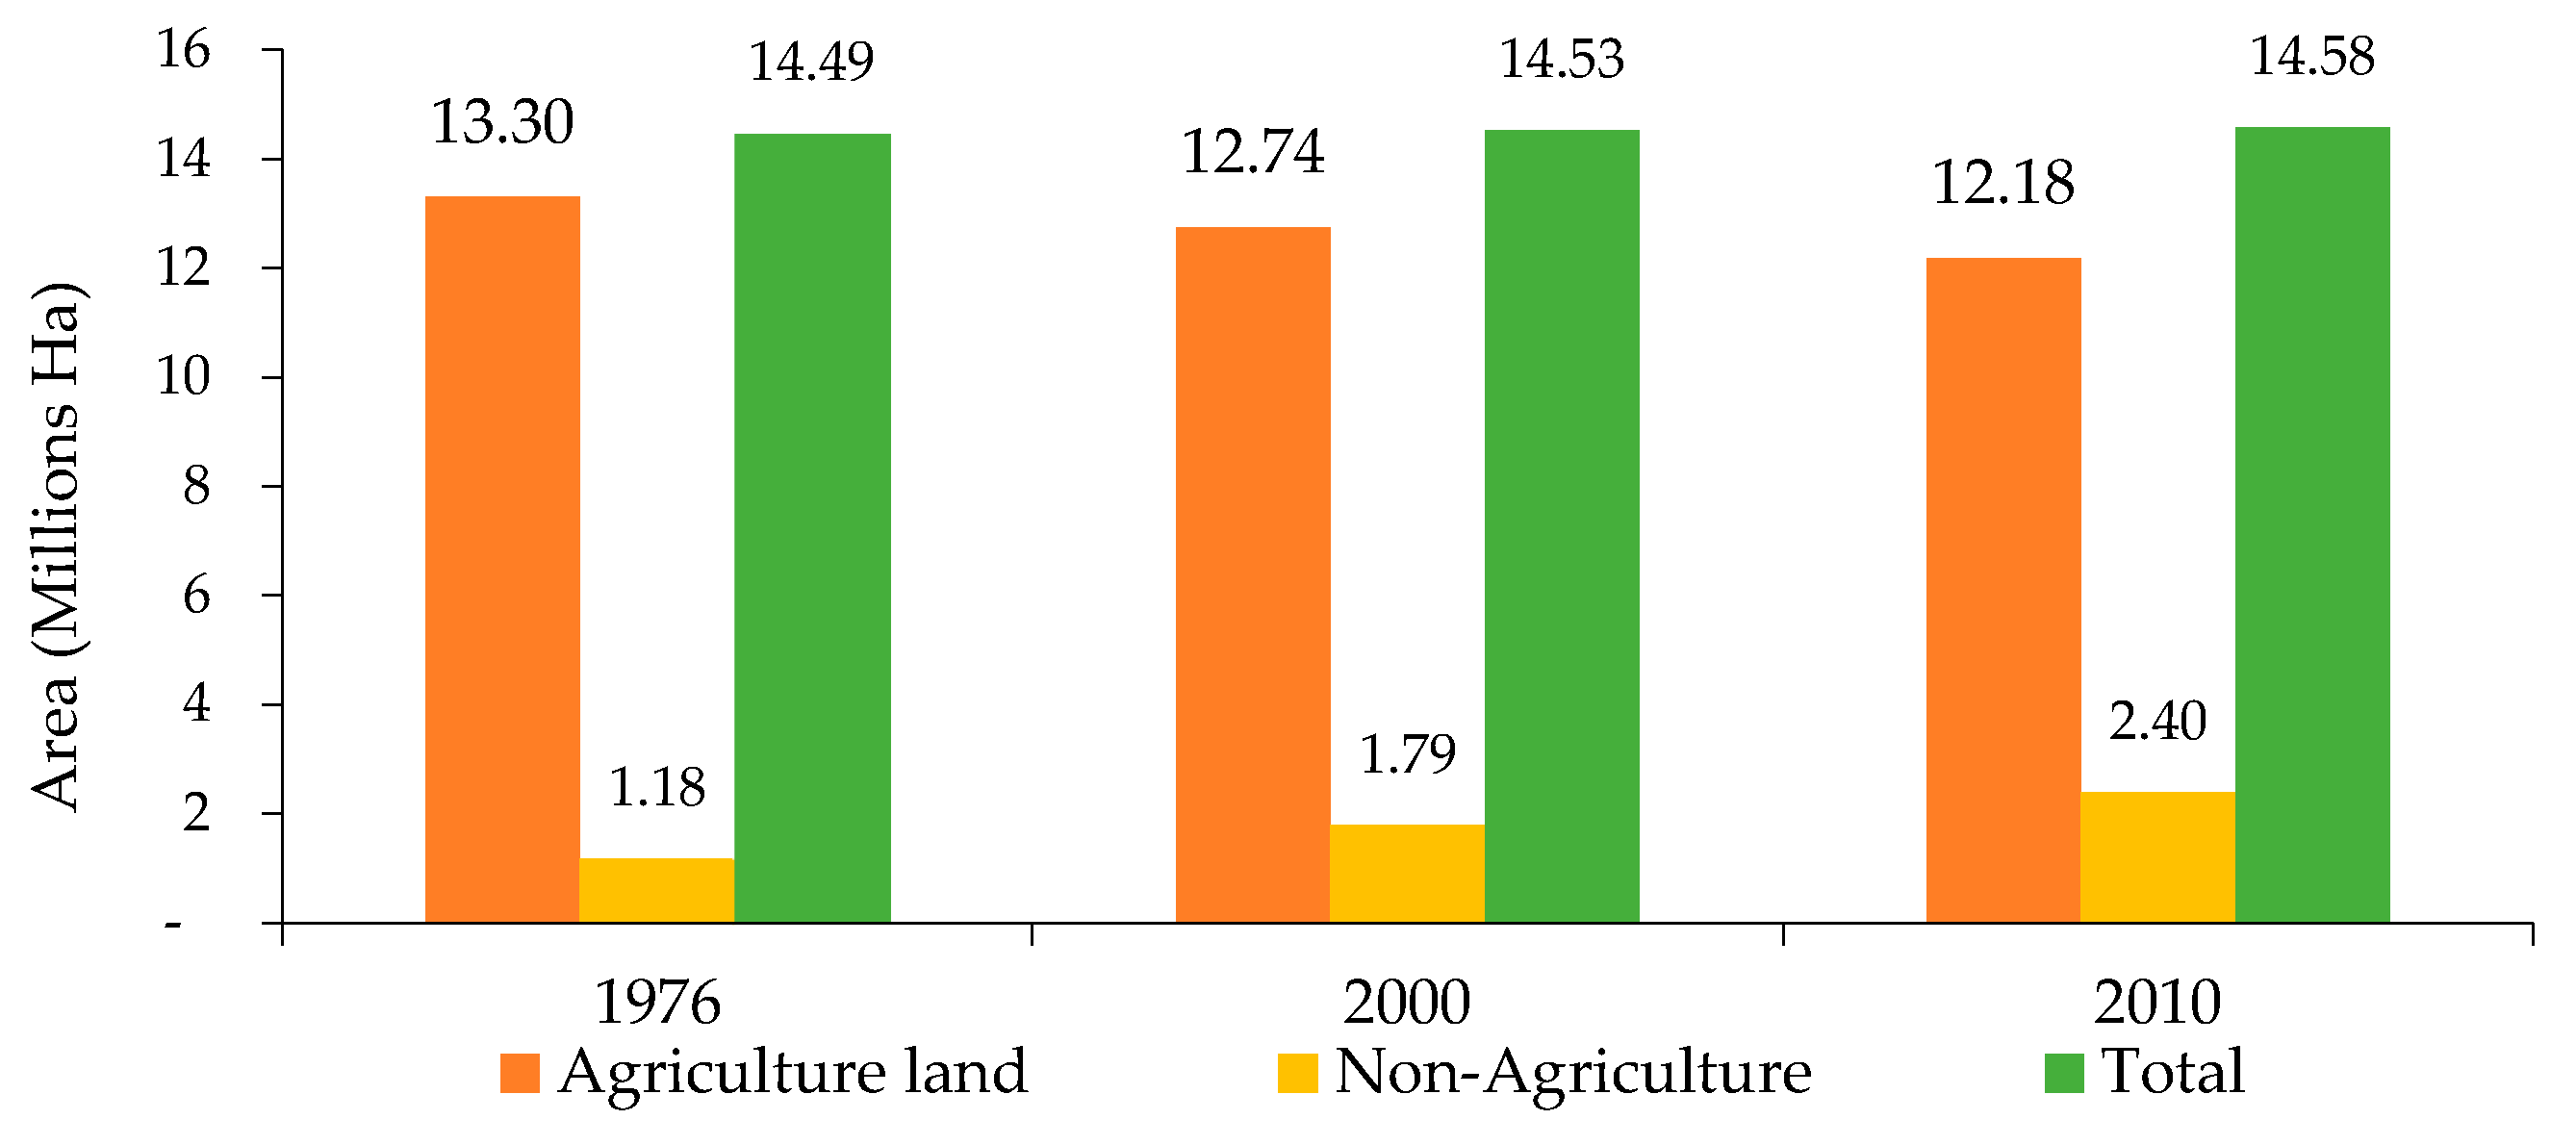
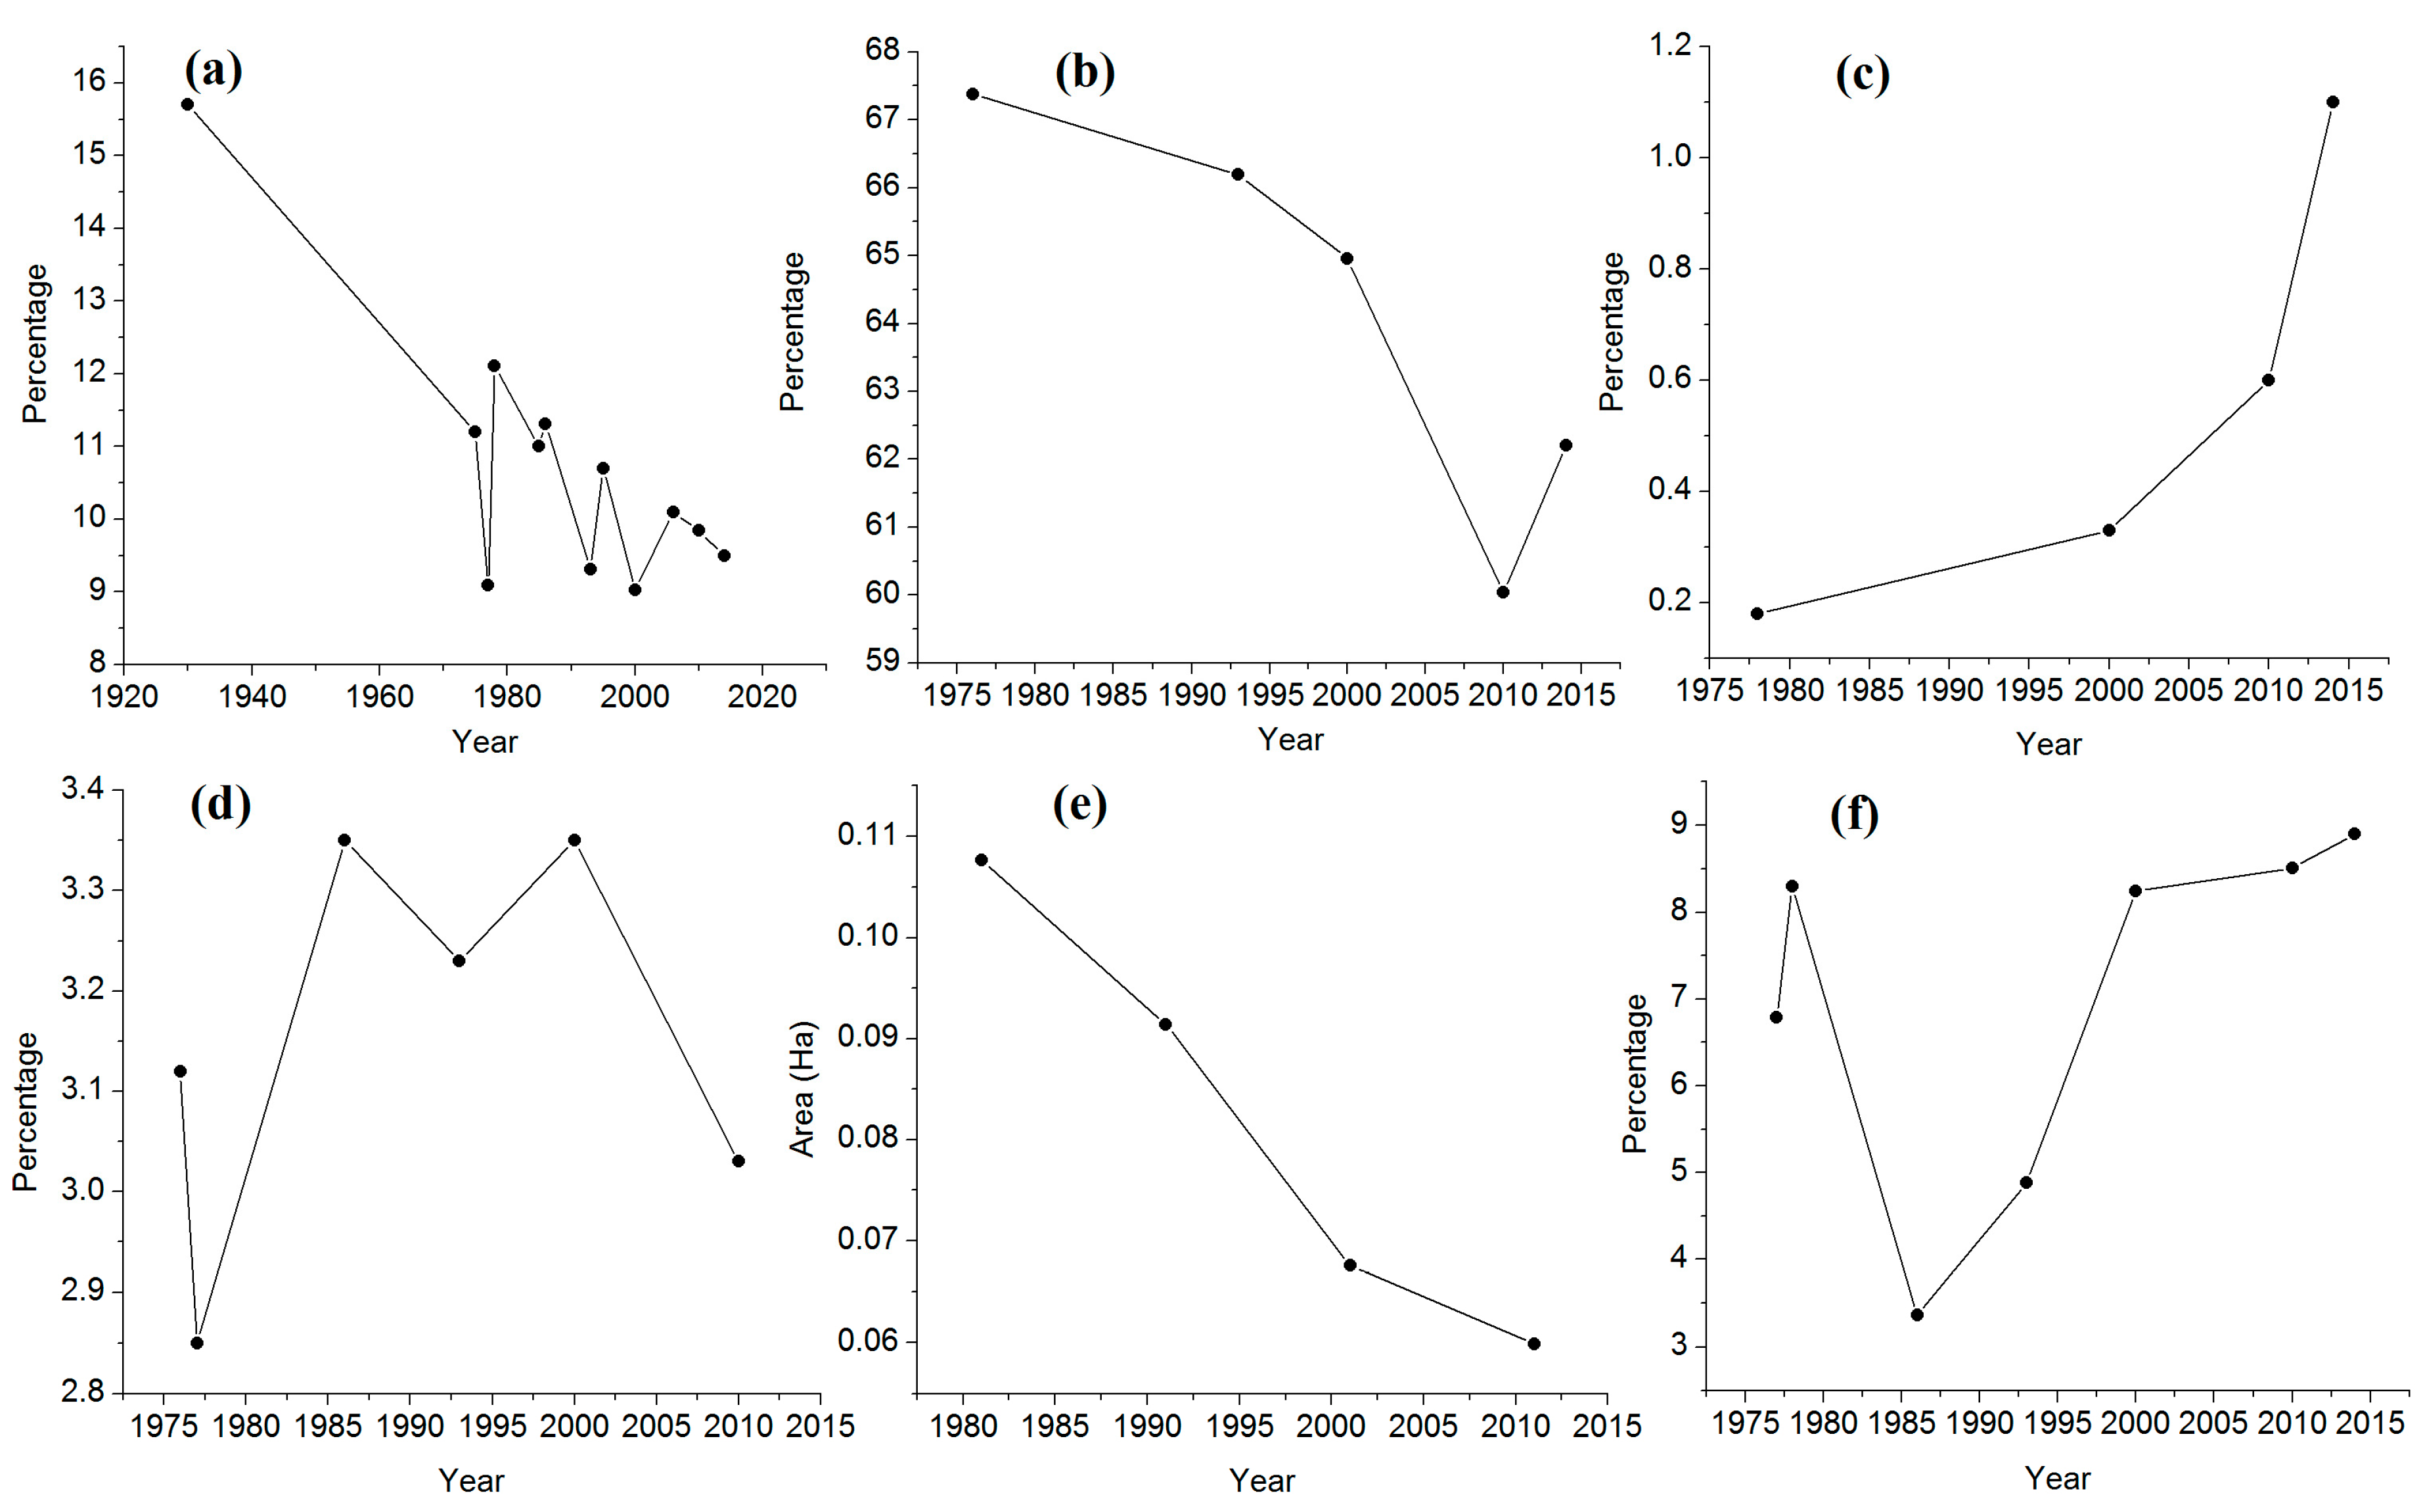
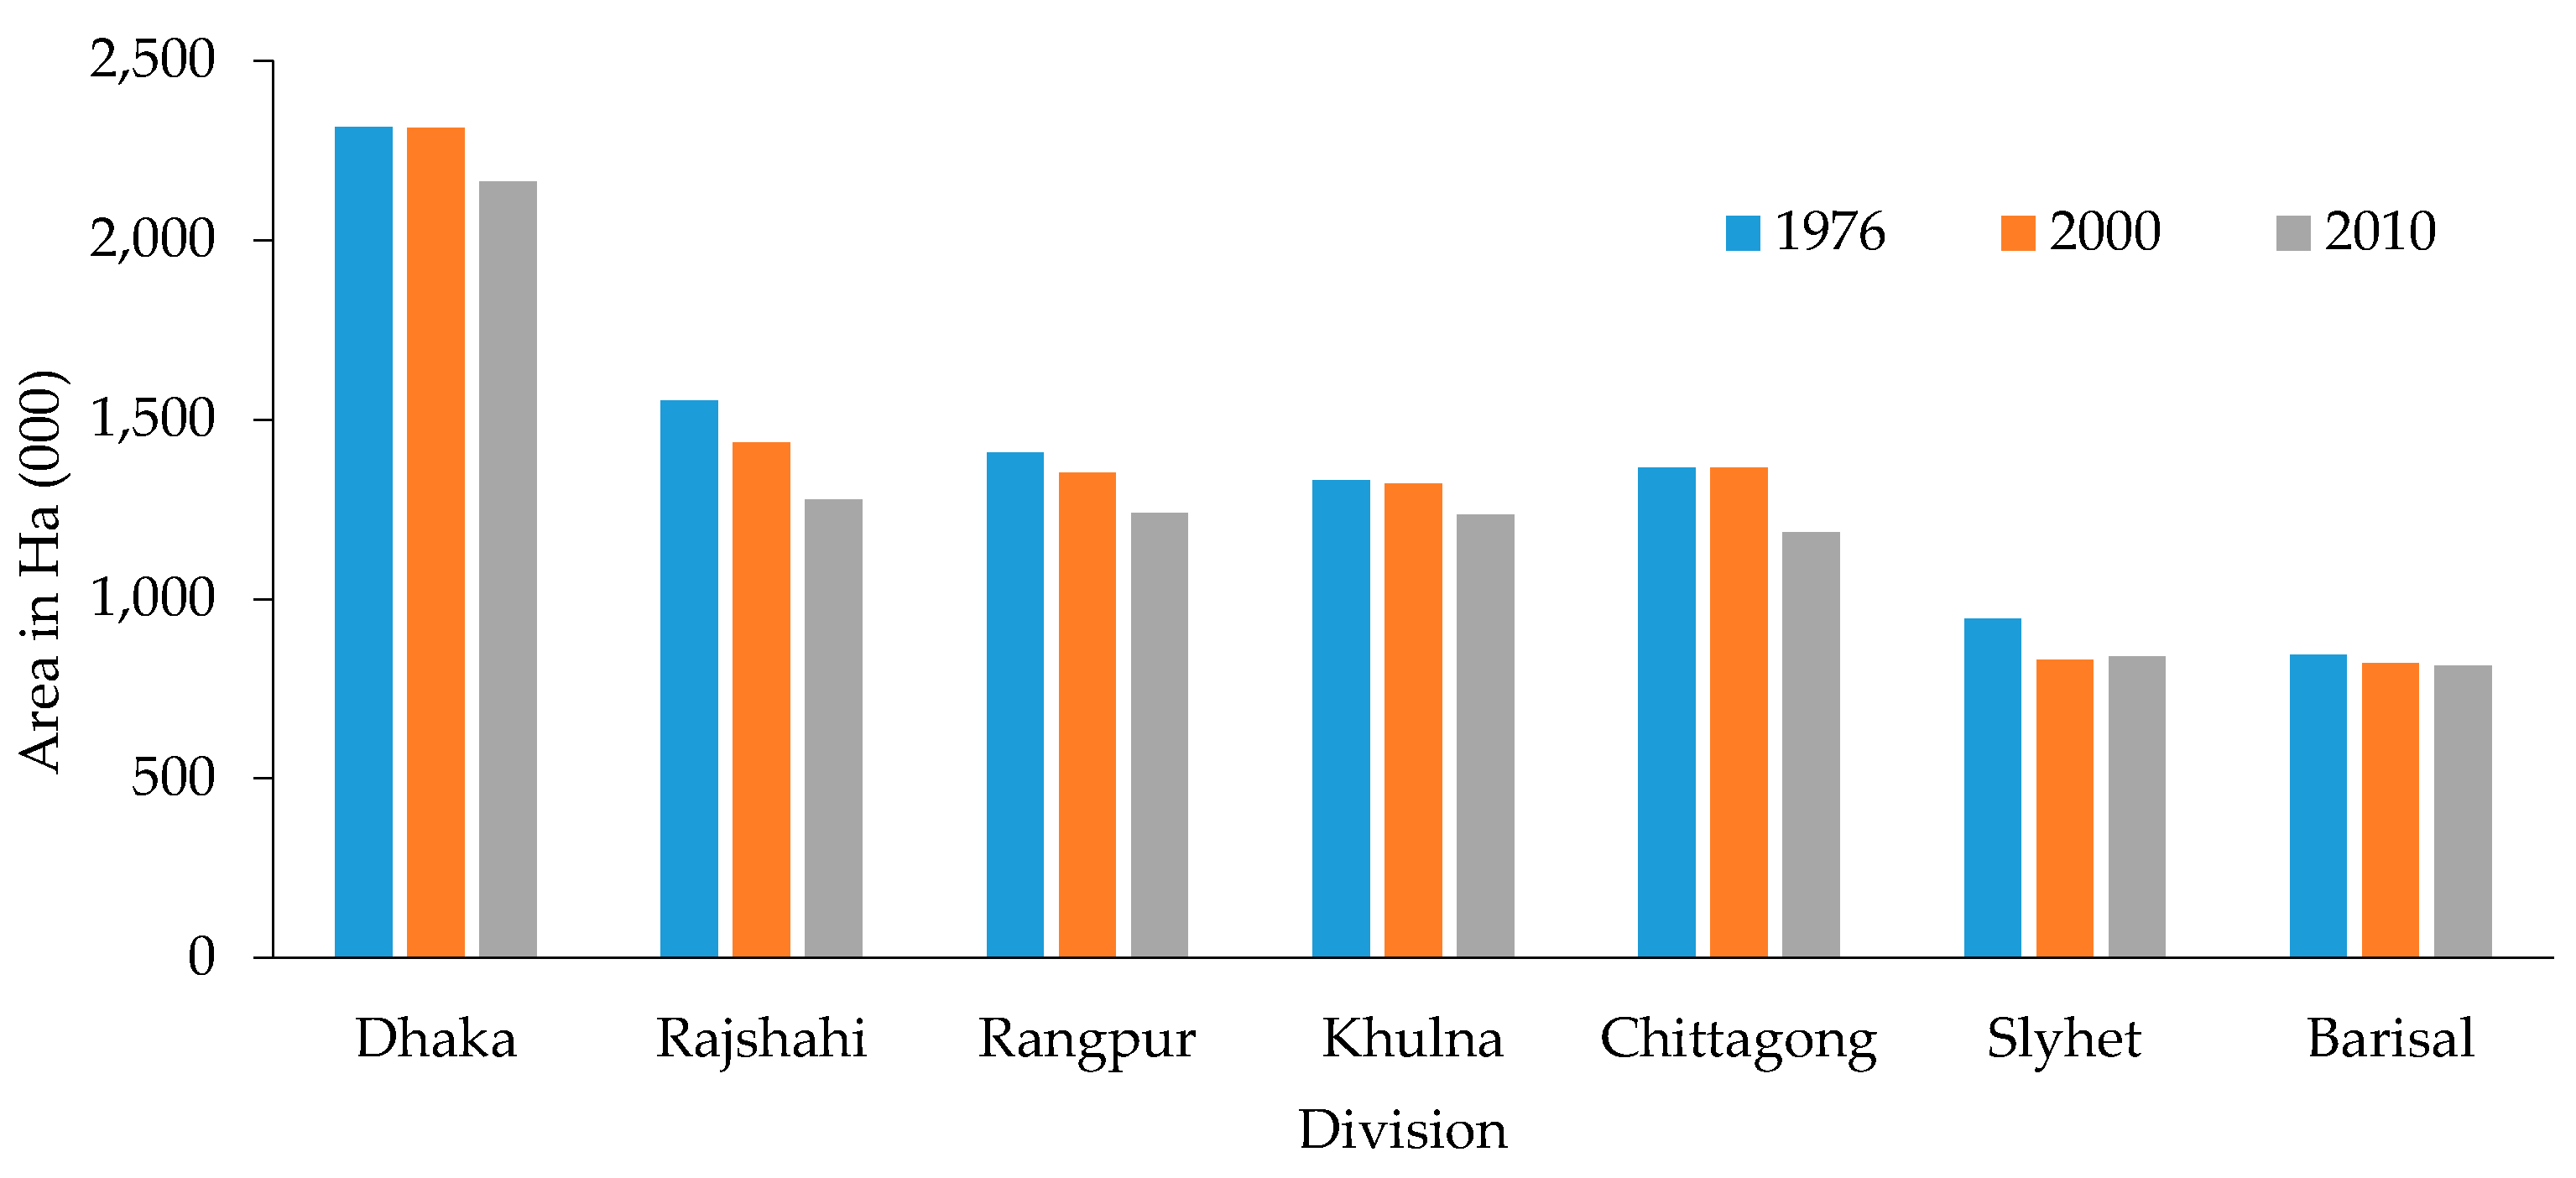
- Spatio-temporal studies revealed that in 1976, the total area of agriculture land was 67.38% of the country [10] but, due to high population growth and land demands, the agricultural land contraction rate was 0.13–1% per year during 1976–2010 [10,22]. In 2014, the agricultural land has revealed 62.2% [23] (Figure 4b).
- ➢
- ➢
- The pattern of the agricultural land contraction has resulted in farmers adopting intensive and diverse agricultural practices with high-yield crop varieties. The cropping intensity has increased by 4% between 1948 to 2006 [24]. Cropland areas expanded at a rate of 0.28% per annum for 1980–2000 [25].
- ➢
- Overall, the urban areas of the country increased significantly between 1976 and 2014 (Figure 4c). In 1976, the urban and industrial areas were listed as 26,799 ha, which increased to 47,495 ha in 2000, 87,616 ha in 2010 [10], and 1,644,300 ha in 2014 [23]. Among the various urban areas, the highest urban growth has found in Dhaka from 11 to 344% between 1960 to 2005 [26].
- ➢
- The historical study on forest cover has examined that the area has been in decreasing trend. In 1930, the total forest cover was 15.7% of the total area, but the area has observed by 9.5% in 2014. A net loss has found 6.2% (9054 km2) over the past 85 years [23].
3.2. LUCC at the Sub-National Level
3.2.1. Agricultural Land
3.2.2. Urban Land
3.2.3. Forest Cover
3.2.4. Water Bodies
4. Impact of LUCC and Comparison of the Historical Database
4.1. Impacts of LUCC Over the Country
4.1.1. Agricultural Land Contraction and Food Insecurity
4.1.2. The Effects of Population Growth and Urban Land Development
4.1.3. The Effects of Forest Cover and Water Bodies Changes
4.2. Comparison of Historical Database
5. Conclusions
Acknowledgments
Author Contributions
Conflicts of Interest
References
- Duhamel, C. Land use, Land cover, including their classification. Encylopedia Life Support Syst. 2012, 1–9. [Google Scholar]
- Ganasri, B.; Aedla, R.; Dwarakish, G. Different Approaches for Land Use Land Cover Change Detection: A Review. Res. Rev. J. Eng. Technol. 2013, 2, 44–48. [Google Scholar]
- Meyer, W.B.; Turner, B.I. Changes in Land Use and Land Cover: A Global Perspective; Cambridge University Press: Cambridge, UK, 1994; Volume 4. [Google Scholar]
- Paudel, B.; Zhang, Y.-L.; Li, S.-C.; Liu, L.-S.; Wu, X.; Khanal, N.R. Review of studies on land use and land cover change in Nepal. J. Mt. Sci. 2016, 13, 643–659. [Google Scholar] [CrossRef]
- Bringezu, S.; Schütz, H.; Pengue, W.; O’Brien, M.; Garcia, F.; Sims, R.; Howarth, R.W.; Kauppi, L.; Swilling, M.; Herrick, J. Assessing Global Land Use: Balancing Consumption with Sustainable Supply; United Nations Environment Programme: Nairobi, Kenya, 2014. [Google Scholar]
- Lambin, E.; Turner, B.; Geist, H.; Agbola, S.; Angelsen, A.; Bruce, J.; Coomes, O.; Dirzo, R.; Fischer, G.; Folke, C.; et al. The causes of land-use and land-cover change, moving beyond the myths. Glob. Environ. Chang. 2001, 11, 261–269. [Google Scholar] [CrossRef]
- Lepers, E.; Lambin, E.; Janetos, A.; DeFries, R.; Achard, F.; Ramankutty, N.; Scholes, R. A synthesis of information on rapid land-cover change for the period 1981–2000. BioScience 2005, 55, 115–124. [Google Scholar] [CrossRef]
- Lambin, E.; Geist, H.; Lepers, E. Dynamics of land-use and land-cover change in tropical regions. Annu. Rev. Environ. Resour. 2003, 28, 205–241. [Google Scholar] [CrossRef]
- Food and Agriculture Organization of the United Nations; European Commission Joint Research Centre. Global Forest Land-Use Change 1990–2005; Food and Agriculture Organization of the United Nations, European Commission Joint Research Centre: Rome, Italy, 2012. [Google Scholar]
- Hasan, M.; Hossain, M.; Bari, M.; Islam, M. Agricultural Land Availability in Bangladesh; SRDI, Ministry of Agriculture: Dhaka, Bangladesh, 2013; p. 42. ISBN 978-984-33-6141-7.
- Food and Agriculture Organization of the United Nations Regional Office for Asia and the Pacific. FAO Statistical Yearbook 2014; Asia and the Pacific Food and Agriculture; Food and Agriculture Organization of the United Nations Regional Office for Asia and the Pacific: Bangkok, Thailand, 2014. [Google Scholar]
- Population Reference Bureau. 2016 World Population Data Sheet with a Special Focus on Human Needs and Sustainable Resources; Population Reference Bureau: Washington, DC, USA, 2016. [Google Scholar]
- Hasan, S.S.; Deng, X.; Li, Z.; Chen, D. Projections of Future Land Use in Bangladesh under the Background of Baseline, Ecological Protection and Economic Development. Sustainability 2017, 9, 505. [Google Scholar] [CrossRef]
- D’amour, C.; Reitsma, F.; Baiocchi, G.; Barthel, S.; Güneralp, B.; Erb, K.-H.; Haberl, H.; Creutzig, F.; Seto, K.C. Future urban land expansion and implications for global croplands. Proc. Natl. Acad. Sci. USA 2016, 114, 8939–8944. [Google Scholar] [CrossRef] [PubMed]
- Islam, M. Vegetation changes of Sundarabans based on landsat image between 1975 and 2006. Landsc. Environ. 2014, 8, 1–9. [Google Scholar]
- Food and Agriculture Organization of the United Nations. FRA 2000; Forest Resources of Bangladesh, Country Report; Forest Department, Food and Agriculture Organization of the United Nations: Rome, Italy, 2000; p. 91. [Google Scholar]
- Giri, C.; Shrestha, S. Land cover mapping and monitoring from NOAA AVHRR data in Bangladesh. Int. J. Remote Sens. 1996, 17, 2749–2759. [Google Scholar] [CrossRef]
- Dewan, A.; Corner, R. Dhaka Megacity: Geospatial Perspectives on Urbanisation, Environment and Health; Springer: New York, NY, USA; London, UK, 2014. [Google Scholar]
- Bangladesh Bureau of Statistics. Yearbook of Agricultural Statistics-2015; Bangladesh Bureau of Statistics (BBS), Statistics and Informatics Division (SID): Dhaka, Bangladesh, 2016. [Google Scholar]
- Islam, G.M.; Islam, A.K.; Shopan, A.A.; Rahman, M.M.; Lazar, A.N.; Mukhopadhyay, A. Implications of agricultural land use change to ecosystem services in the Ganges delta. J. Environ. Manag. 2015, 161, 443–452. [Google Scholar] [CrossRef] [PubMed]
- Malek, M.; Hossain, M.; Saha, R.; Gatzweiler, F. Mapping Marginality Hotspots and Agricultural Potentials in Bangladesh; University of Bonn: Bonn, Germany, 2013; pp. 1–30. [Google Scholar]
- Quasem, M.A. Conversion of agricultural land to non-agricultural uses in Bangladesh: Extent and determinants. Bangladesh Dev. Stud. 2011, 34, 59–85. [Google Scholar]
- Reddy, C.S.; Pasha, S.V.; Jha, C.S.; Diwakar, P.G.; Dadhwal, V.K. Development of national database on long-term deforestation (1930–2014) in Bangladesh. Glob. Planet. Chang. 2016, 139, 173–182. [Google Scholar] [CrossRef]
- Rahman, S. Six decades of agricultural land use change in Bangladesh: Effects on crop diversity, productivity, food availability and the environment, 1948–2006. Singap. J. Trop. Geogr. 2010, 31, 254–269. [Google Scholar] [CrossRef]
- Jaim, W.; Begum, R. Changes In Land Use Pattern In Bangladesh Over The Last Two Decades. Bangladesh J. Agric. Econ. 2003, 26, 87–96. [Google Scholar]
- Dewan, A.; Yamaguchi, Y. Land use and land cover change in Greater Dhaka, Bangladesh: Using remote sensing to promote sustainable urbanization. Appl. Geogr. 2009, 29, 390–401. [Google Scholar] [CrossRef]
- Aziz, A.; Paul, A.R. Bangladesh Sundarbans: Present status of the environment and biota. Diversity 2015, 7, 242–269. [Google Scholar] [CrossRef]
- Alam, A.; Chowdhury, M.; Sobhan, I. Biodiversity of Tanguar Haor: A Ramsar Site of Bangladesh, Volume I: Wildlife; International Union for Conservation of Nature: Dhaka, Bangladesh, 2012; pp. 1–234. [Google Scholar]
- Khondoker, S.; Hossain, M.L.; Moni, K.A.H. Wetland management in Bangladesh: A study on Beel Bakar. Agric. For. Fish. 2014, 3, 320–328. [Google Scholar] [CrossRef]
- Majumder, T.; Mazumder, S.K.; Monwar, M.M.; Basak, L. Towards climate change resilient of Hail Haor, Sylhet: Reviewing the role of the co-management approach. IOSR J. Agric. Vet. Sci. 2013, 5, 59–66. [Google Scholar]
- Uddin, K.; Gurung, D. Land cover change in Bangladesh- a knowledge based classification approach. In Proceedings of the 10th International Symposium on High Mountain Remote Sensing Cartography ICIMOD, Kathmandu, Nepal, 8–11 September 2008; pp. 41–46. [Google Scholar]
- Turner, B.; Ali, A. Induced intensification: Agricultural change in Bangladesh with implications for Malthus and Boserup. Proc. Natl. Acad. Sci. USA 1996, 93, 14984–14991. [Google Scholar] [CrossRef] [PubMed]
- Uddin, M.; Anwar, M.; Rahman, M.; Mobin, M. An investigation on the pattern of land use change in Dhaka city using remote sensing and GIS application. J. Environ. Sci. Nat. Resour. 2014, 7, 105–109. [Google Scholar] [CrossRef]
- Ahmed, A.; Hussain, S.H. Changing Urban Landuse and Agricultural Land Transformation: A Case Study of Narayanganj City. ASA Univ. Rev. 2012, 6, 237–284. [Google Scholar]
- Akther, J.; Kader, M.A.; Rahman, M.; Shawkhatuzzaman, M. Changes of land use in Fulbaria and Trishal upazila of Mymensingh district of Bangladesh. J. Bangladesh Agric. Univ. 2014, 12, 13–18. [Google Scholar] [CrossRef]
- Mamun, A.A.; Mahmood, A.; Rahman, M. Identification and monitoring the change of land use pattern using remote sensing and GIS: A case study of Dhaka City. IOSR J. Mech. Civ. Eng. 2013, 6, 20–28. [Google Scholar] [CrossRef]
- Sayed, M.; Haruyama, S. Dynamics of Land Use/Cover Change in Manikganj District, Bangladesh: A Case Study of Manikganj Sadar Upazila. J. Geogr. Inf. Syst. 2015, 7, 579–587. [Google Scholar] [CrossRef]
- Sayed, M.; Haruyama, S. Urbanization Impact on Agricultural Land of Manikganj Pourashova, Bangladesh. Int. J. Sci. Basic Appl. Res. 2016, 28, 243–253. [Google Scholar]
- Islam, M.S.; Ahmed, R. Land use change prediction in Dhaka city using GIS aided Markov chain modeling. J. Life Earth Sci. 2011, 6, 81–89. [Google Scholar] [CrossRef]
- Islam, M. Causes and consequences of agricultural land losses of Rajshahi District, Bangladesh. J. Environ. Sci. Toxicol. Food Technol. 2013, 5, 58–65. [Google Scholar]
- Rahman, M.R.; Shi, Z.H.; Chongfa, C. Land use/land cover change analysis using geo-information technology: Two case studies in Bangladesh and China. Int. J. Geoinf. 2009, 5, 25–37. [Google Scholar]
- Hassan, M.; Mahmud-ul-islam, S. Urban area change analysis in the Rangapur Sadar upazila, Bangladesh using landsat imageries. Int. J. Sci. Res. 2015, 4, 469–474. [Google Scholar]
- Islam, W.; Sarker, S.C. Monitoring the Changing Pattern of Land Use in the Rangpur City Corporation Using Remote Sensing and GIS. J. Geogr. Inf. Syst. 2016, 8, 537–545. [Google Scholar] [CrossRef]
- Shrestha, F.; Uddin, K.; Maharjan, S.; Bajracharya, S. Application of remote sensing and GIS in environmental monitoring in the Hindu Kush Himalayan region. AIMS Environ. Sci. 2016, 3, 646–662. [Google Scholar] [CrossRef]
- Roy, S.; Farzana, K.; Papia, M.; Hasan, M. Monitoring and Prediction of Land Use/Land Cover Change using the Integration of Markov Chain Model and Cellular Automation in the Southeastern Tertiary Hilly Area of Bangladesh. Int. J. Sci. Basic Appl. Res. 2015, 24, 125–148. [Google Scholar]
- Rahman, M.; Jashimuddin, M.; Islam, K.; Nath, T.K. Land Use Change and Forest Fragmentation Analysis: A Geoinformatics Approach on Chunati Wildlife Sanctuary, Bangladesh. J. Civ. Eng. Environ. Sci. 2016, 2, 020–029. [Google Scholar]
- Islam, M.A.; Maitra, M.K.; Majlis, A.B.K.; Murshed, S.; Rahman, S. Spatial changes of land use/land cover of Moheshkhali island, Bangladesh: A fact finding approach by remote sensing analysis. Dhaka Univ. J. Earth Environ. Sci. 2011, 2, 43–54. [Google Scholar]
- Ali, A. Population pressure, environmental constraints and agricultural change in Bangladesh: Examples from three agroecosystems. Agric. Ecosyst. Environ. 1995, 55, 95–109. [Google Scholar] [CrossRef]
- Islam, M.; Ahmed, M.; Mamun, M.; Masunaga, S. Potential ecological risk of hazardous elements in different land-use urban soils of Bangladesh. Sci. Total Environ. 2015, 512–513, 94–102. [Google Scholar] [CrossRef] [PubMed]
- Khan, M.M.H.; Bryceson, I.; Kolivras, K.N.; Faruque, F.; Rahman, M.M.; Haque, U. Natural disasters and land-use/land-cover change in the southwest coastal areas of Bangladesh. Reg. Environ. Chang. 2015, 15, 241–250. [Google Scholar] [CrossRef]
- Hossain, M. Global warming induced sea level rise on soil, land and crop production loss in Bangladesh. In Proceedings 19th World Congress of Soil Science, Soil Solutions for a Changing World; Robert, G., Ed.; International Union of Soil Sciences: Crawley, UK, 2010; pp. 77–80. [Google Scholar]
- Rahman, M.; Begum, S. Land cover change analysis around the Sundarbans Mangrove Forest of Bangladesh using remote sensing and GIS application. J. Sci. Found. 2011, 9, 95–107. [Google Scholar] [CrossRef]
- Alam, M.S. Climate change and land use change in the Eastern Coastal Belt of Bangladesh, elucidated by analyzing rice production area in the past and future. J. Life Earth Sci. 2013, 8, 83–92. [Google Scholar] [CrossRef]
- Jerin, T.; Ishtiaque, A. Detailing rural land use of Coastal Bangladesh: A micro-level study. Geogr. Malays. J. Soc. Space 2014, 10, 1–17. [Google Scholar]
- Rahman, M.R.; Hossain, M.B. Changes in land use pattern at Chakaria Sundarbans mangrove forest in Bangladesh. Bangladesh Res. Publ. J. 2015, 11, 13–20. [Google Scholar]
- Shapla, T.; Park, J.; Hongo, C.; Kuze, H. Agricultural Land Cover Change in Gazipur, Bangladesh, in Relation to Local Economy Studied Using Landsat Images. Adv. Remote Sens. 2015, 4, 214–223. [Google Scholar] [CrossRef]
- Paul, A.; Nath, B.; Abbas, M.; Islam, H.; Mallick, B. Land use change monitoring of Hari-Teka river basin, Jessore, Bangladesh using remote sensing and GIS. Int. J. Adv. Remote Sens. GIS Geogr. 2014, 2, 1–8. [Google Scholar]
- Raihan, F.; Kaiser, N. Land use changing scenario at Kerniganj Thana of Dhaka District using remote sensing and GIS. J. Environ. 2012, 1, 105–110. [Google Scholar]
- Sharif, M.S.; Esa, A.J. Dynamics of land price and land use change: A case of Savar Municipality, Bangladesh. J. South Asian Stud. 2014, 2, 83–89. [Google Scholar]
- Dewan, A.; Yamaguchi, Y. Using remote sensing and GIS to detect and monitor land use and land cover change in Dhaka Metropolitan of Bangladesh during 1960–2005. Environ. Monit. Assess. 2009, 150, 237–249. [Google Scholar] [CrossRef] [PubMed]
- Ahmed, B.; Ahmed, R. Modeling urban land cover growth dynamics using multi-temporal satellite images: A case study of Dhaka, Bangladesh. ISPRS Int. J. Geo-Inf. 2012, 1, 3–31. [Google Scholar] [CrossRef]
- Pramanik, M.M.A.; Stathakis, D. Forecasting urban sprawl in Dhaka city of Bangladesh. Environ. Plan. B Plan. Des. 2016, 43, 756–771. [Google Scholar] [CrossRef]
- Yesmin, R.; Mohiuddin, A.S.M.; Uddin, M.J.; Shahid, M.A. Land use and land cover change detection at Mirzapur Union of Gazipur District of Bangladesh using remote sensing and GIS technology. In Proceedings of the 7th IGRSM International Remote Sensing & GIS Conference and Exhibition, Kuala Lumpur, Malaysia, 21–22 May 2014; pp. 1–9. [Google Scholar]
- Sarker, M.; Rahman, S.; Akhand, M.; Uddin, M.; Quadir, D. Land-use changes of Kaliakair upazila of Bangladesh using Remote Sensing and GIS Technologies. Indian J. Appl. Res. 2015, 5, 532–537. [Google Scholar]
- Haque, A.; Alam, J.; Shaha, N.; Raihan, F. Study on Land use Pattern Change and Its Causes. Int. J. Environ. Res. 2008, 2, 199–204. [Google Scholar]
- Hassan, M.M.; Nazem, M.N.I. Examination of land use/land cover changes, urban growth dynamics, and environmental sustainability in Chittagong city, Bangladesh. Environ. Dev. Sustain. 2016, 18, 697–716. [Google Scholar] [CrossRef]
- Hussain, M.; Alak, P.; AZMZ, I. Spatio-temporal analysis of land use and land cover changes in Chittagong city corporation, Bangladesh. Int. J. Adv. Remote Sens. GIS Geogr. 2016, 4, 56–72. [Google Scholar]
- Sarwar, M.I.; Billa, M.; Paul, A. Urban land use change analysis using RS and GIS in Sulakbahar ward in Chittagong city, Bangladesh. Int. J. Geomat. Geosci. 2016, 7, 1–10. [Google Scholar]
- Islam, M.; Chowdhury, S. Analysis of Changing Land Cover in Chittagong City Corporation Area (CCC) by Remote Sensing and GIS. Int. J. Innov. Appl. Stud. 2014, 8, 1193–1203. [Google Scholar]
- Islam, M.; Hassn, M. Losses of Agricultural Land due to Infrastructural Development: A Study on Rajshahi District. Int. J. Sci. Eng. Res. 2013, 4, 391–396. [Google Scholar]
- Islam, M. Study on impact of land fragmentation in agriculture-a case of Rajshahi district, Bangladesh. Int. J. Recent Res. Soc. Sci. Hum. 2014, 1, 54–61. [Google Scholar]
- Kumar, L.; Ghosh, M.K. Land cover change detection of Hatiya Island, Bangladesh, using remote sensing techniques. J. Appl. Remote Sens. 2012, 6, 063608. [Google Scholar] [CrossRef]
- Billah, M.; Rahman, G.A. Land cover mapping of Khulna city applying remote sensing technique. In Proceedings of the 12th International Conference on Geoinformatics (Sweden: Geospatial Information Research: Bridging the Pacific and Atlantic, University of Gävle), Gavle, Sweden, 7–9 June 2004; pp. 707–714. [Google Scholar]
- Chaudhuri, G.; Mishra, N.B. Spatio-temporal dynamics of land cover and land surface temperature in Ganges-Brahmaputra delta: A comparative analysis between India and Bangladesh. Appl. Geogr. 2016, 68, 68–83. [Google Scholar] [CrossRef]
- European Space Agency. Climate Change Initiative Land Cover (CCI-LC) Dataset 2.0 ed.; European Space Agency: Brussel, Belgium, 2017. [Google Scholar]
- Salam, M.A.; Noguchi, T.; Koike, M. The causes of forest cover loss in the hill forests in Bangladesh. GeoJournal 1999, 47, 539–549. [Google Scholar] [CrossRef]
- Redowan, M.; Akter, S.; Islam, N. Analysis of forest cover change at Khadimnagar National Park, Sylhet, Bangladesh, using Landsat TM and GIS data. J. For. Res. 2014, 25, 393–400. [Google Scholar] [CrossRef]
- Iftekhar, M.S.; Hoque, A.K.F. Causes of forest encroachment: An analysis of Bangladesh. GeoJournal 2005, 62, 95–106. [Google Scholar] [CrossRef]
- Griffiths, P.; Hostert, P.; Gruebner, O.; van der Linden, S. Mapping megacity growth with multi-sensor data. Remote Sens. Environ. 2010, 114, 426–439. [Google Scholar] [CrossRef]
- Rahman, S.; Hasan, S.M.R.; Islam, M.A.; Maitra, M.K. Temporal change detection of vegetation coverage of Dhaka using remote sensing. Int. J. Geomat. Geosci. 2011, 2, 481–490. [Google Scholar]
- Byomkesh, T.; Nakagoshi, N.; Dewan, A. Urbanization and green space dynamics in Greater Dhaka, Bangladesh. Landsc. Ecol. Eng. 2011, 8, 45–58. [Google Scholar] [CrossRef]
- Jaber, A.S.; Ghosh, A.K.; Mahmud, M.S. Using Time Series of Satellite Images to Detect Vegetation Cover Change in Dhaka City. J. Geogr. Inf. Syst. 2014, 6, 653–663. [Google Scholar] [CrossRef]
- Halim, M.A.; Shahid, A.; Chowdhury, M.S.H.; Nahar, M.N.; Sohel, M.S.I.; Nuruddin, M.J.; Koike, M. Evaluation of land-use pattern change in West Bhanugach Reserved Forest, Bangladesh, using remote sensing and GIS techniques. J. For. Res. 2008, 19, 193–198. [Google Scholar] [CrossRef]
- Salauddin, M.; Islam, A. Identification of land cover changes of the haor area of Bangladesh using Modis Images. In Proceedings of the 3rd International Conference on Water & Flood Management (ICWFM-2011); Institute of Water and Flood Management, BUET: Dhaka, Bangladesh, 2011. [Google Scholar]
- Islam, K.; Jashimuddin, M.; Nath, B.; Nath, T.K. Land use classification and change detection by using multi-temporal remotely sensed imagery: The case of Chunati wildlife sanctuary, Bangladesh. Egypt. J. Remote Sens. Space Sci. 2017, in press. [Google Scholar] [CrossRef]
- Uddin, M.; Miah, M.; Afrad, M.; Mehraj, H.; Mandal, M. Land use change and its impact on ecosystem services, livelihood in Tanguar Haor wetland of Bangladesh. Sci. Agric. 2015, 12, 78–88. [Google Scholar]
- Abdullah, H.M.; Mahboob, M.G.; Rahman, M.M.; Ahmed, T. Monitoring Natural Sal Forest Cover in Modhupur, Bangladesh using Temporal Landsat Imagery during 1972–2015. Int. J. Environ. 2015, 5, 1–7. [Google Scholar]
- Sarker, S.; Kuri, K.; Chowdhury, M.; Rahman, M. Mangrove: A livelihood option for the coastal community of Bangladesh. Bangladesh Res. Publ. J. 2010, 3, 1187–1192. [Google Scholar] [CrossRef]
- Uddin, M.S.; Shah, M.A.R.; Khanom, S.; Nesha, M.K. Climate change impacts on the Sundarbans mangrove ecosystem services and dependent livelihoods in Bangladesh. Asian J. Conserv. Biol. 2013, 2, 152–156. [Google Scholar]
- Uddin, S.; Hoque, A.; Abdullah, S. The changing landscape of mangroves in Bangladesh compared to four other countries in tropical regions. J. For. Res. 2014, 25, 605–611. [Google Scholar] [CrossRef]
- Rahman, M. Temporal Change detection of Vegetation Coverage in Patuakhali Coastal Area of bangladesh Using GIS & Remotely Sensed Data. Int. J. Geomat. Geosci. 2013, 4, 36–46. [Google Scholar]
- Halder, P.K. Impact of Coastal Flooding on Land use Pattern Considering Climate Change. In Proceedings of the Dimensions and Directions of Geospatial Industry, Hyderabad, India, 18–21 January 2011. [Google Scholar]
- Giri, C.; Pengra, B.; Zhu, Z.; Singh, A.; Tieszen, L. Monitoring mangrove forest dynamics of the Sundarbans in Bangladesh and India using multi-temporal satellite data from 1973 to 2000. Estuar. Coast. Shelf Sci. 2007, 73, 91–100. [Google Scholar] [CrossRef]
- Nath, B. Quantitative Assessment of Forest Cover Change of a Part of Bandarban Hill Tracts Using NDVI Techniques. J. Geosci. Geomat. 2014, 2, 21–27. [Google Scholar]
- Mahmud, M.S.; Masrur, A.; Ishtiaque, A.; Haider, F.; Habiba, U. Remote Sensing & GIS Based Spatio-Temporal Change Analysis of Wetland in Dhaka City, Bangladesh. J. Water Resour. Prot. 2011, 3, 781–787. [Google Scholar]
- Sultana, M.; Islam, G.; Islam, Z. Pre-and post-urban wetland area in Dhaka City, Bangladesh: A remote sensing and GIS analysis. J. Water Resour. Prot. 2009, 2009, 414–421. [Google Scholar] [CrossRef]
- Islam, M.; Shahabuddin, A.; Kamal, M.; Ahmed, R. Wetlands of Dhaka City: Its Past and Present Scenario. J. Life Earth Sci. 2012, 7, 83–90. [Google Scholar] [CrossRef]
- Amin, A.K.M.K.; Haque, M.; Alamgir, M. Analysis of the Wetland Degradation around the Vicinity of Dhaka City in Bangladesh. Asian J. Water Environ. Pollut. 2013, 10, 19–26. [Google Scholar]
- Hossain, M.W.; Feerdaus, J.; Saha, P.K.; Saifullah, A. Temporal and spatial changes of wetlands in selected areas of Dhaka city and its impact on surrounding environment. Int. J. Sci. Res. 2014, 3, 1043–1050. [Google Scholar]
- Shopan, A.A.; Islam, A.; Dey, N.C.; Bala, S.K. Estimation of the changes of wetlands in the northwest region of Bangladesh using Landsat images. In Proceedings of the 4th International Conference on Water & Flood Management (ICWFM-2013), Dhaka, Bangladesh, 8–10 January 2011; pp. 521–528. [Google Scholar]
- Asia-Pacific Network for Global Change Research. Holistic Assessment of Land-Use Change and Impacts on Ecosystem Services of Wetlands; ARCP2012–05CMY-Zhen; APN (Asia-Pacific Network for Global Change Research): Kobe, Japan, 2012. [Google Scholar]
- Roy, B.; Saha, P. Temporal Analysis of Land Use Pattern Changes in Chittagong District of Bangladesh using Google Earth and ArcGIS. In Proceedings of the Annual Int’l Conference on Chemical Processes, Ecology & Environmental Engineering (ICCPEE’16), Pattaya, Thailand, 28–29 April 2016. [Google Scholar]
- Islam, S.N. Deltaic floodplains development and wetland ecosystems management in the Ganges–Brahmaputra-Meghna Rivers Delta in Bangladesh. Sustain. Water Resour. Manag. 2016, 2, 237–256. [Google Scholar] [CrossRef]
- Food and Agriculture Organization of the United Nations FAO. Bangladesh Food Security Brief; World Food Programme, Vulnerability Analysis and Mapping Unit WFP: Dhaka, Bangladesh, 2005. [Google Scholar]
- Begum, M.; D’Haese, L. Supply and demand situations for major crops and food items in Bangladesh. J. Bangladesh Agric. Univ. 2010, 8, 91–102. [Google Scholar] [CrossRef]
- Dobermann, A.; Nelson, R.; Beever, D.; Bergvinson, D.; Crowley, E.; Denning, G.; Giller, K.; d’Arros Hughes, J.; Jahn, M.; Lynam, J. Solutions for Sustainable Agriculture and Food Systems; Technical Report for the Post-2015 Development Agenda; Sustainable Development Solutions Network (SDSN): New York, NY, USA, 2013; pp. 1–108. [Google Scholar]
- Magnani, R.; Oot, L.; Sethuraman, K.; Kabir, G.; Rahman, S. USAID Office of Food for Peace Food Security Country Framework for Bangladesh (FY 2015–2019); Food and Nutrition Technical Assistance III Project: Washington, DC, USA, 2015; pp. 1–69. [Google Scholar]
- Ali, A. Farmers’ knowledge of soils and the sustainability of agriculture in a saline water ecosystem in Southwestern Bangladesh. Geoderma 2003, 111, 333–353. [Google Scholar] [CrossRef]
- Ali, A. Technological change in agriculture and land degradation in Bangladesh: A case study. Land Degrad. Dev. 2004, 15, 283–298. [Google Scholar] [CrossRef]
- Ali, A. Rice to shrimp: Land use/land cover changes and soil degradation in Southwestern Bangladesh. Land Use Policy 2006, 23, 421–435. [Google Scholar] [CrossRef]
- Mondal, G. Effects of land use changes on livelihood pattern of small farmers. BRAC Univ. J. 2008, 2, 93–99. [Google Scholar]
- Food Planning and Monitoring Unit. National Food Policy Plan of Action (2008–2015); Food Planning and Monitoring Unit (FPMU), Ministry of Food and Disaster Management: Dhaka, Bangladesh, 2008; p. 103.
- Food and Agriculture Organization of the United Nations FAO. Bangladesh Food Security Brief; World Food Programme, Vulnerability Analysis and Mapping Unit WFP: Dhaka, Bangladesh, 2002. [Google Scholar]
- Kashem, M.; Faroque, M. A Country Scenarioes of Food Security and Governance in Bangladesh. J. Sci. Found. 2011, 9, 41–50. [Google Scholar] [CrossRef]
- IFAD. Investing in Rural People in Bangladesh; International Fund for Agricultural Development: Rome, Italy, 2015; pp. 1–4. [Google Scholar]
- Karim, Z.; Bakar, M.; Islam, M. Study of the Implementation Status and Effectiveness of New Agricultural Extension Policy for Technology Adoption; National Food Policy Capacity Strengthening Programme (NFPCSP): Dhaka, Bangladesh, 2009. [Google Scholar]
- Technical Assistance to NGO’s (TANGO); World Food Programme (WFP). Rural Bangladesh, Socio-Economic Profiles of WFP Operational Areas and Beneficiaries; United Nations World Food Programme: Dhaka, Bangladesh, 2006; pp. 1–190. [Google Scholar]
- Bhuyan, S.; Islam, S. Present Status of Socio-economic Conditions of the Fishing Community of the Meghna River Adjacent to Narsingdi District, Bangladesh. J. Fish. Livest. Product. 2016, 04, 1–5. [Google Scholar]
- Rimal, B.; Zhang, L.; Keshtkar, H.; Wang, N.; Lin, Y. Monitoring and Modeling of Spatiotemporal Urban Expansion and Land-Use/Land-Cover Change Using Integrated Markov Chain Cellular Automata Model. ISPRS Int. J. Geo-Inf. 2017, 6, 288. [Google Scholar] [CrossRef]
- Bangladesh Bureau of Statisties. Population and Housing Census-2011; Bangladesh Bureau of Statisties (BBS), Ministry of Planning, Statistics and Informatics Division (SID): Dhaka, Bangladesh, 2014; pp. 1–640.
- Food and Agriculture Organization of the United Nations FAO. Global Forest Resources Assessemnt 2010 Country Reports, Bangladesh; Forestry Department, Food and Agriculture Organization of the United Nations: Rome, Italy, 2010. [Google Scholar]
- Ali, M.; Islam, M.; Siddiqee, R.; Islam, M. Global Forest Resources Assessment 2015, Country Report, Bangladesh; Global Forest Resources Assessment 2015 (FRA 2015): Rome, Italy, 2014; p. 107. [Google Scholar]
- Ahmed, A.M.M.M.; Roy, K. Utilization and Conservation of Water Resources in Bangladesh. J. Dev. Sustain. Agric. 2007, 2, 35–44. [Google Scholar]
- Bangladesh Bureau of Statistics BBS. Statistical Pocketbook Bangladesh, 2015; Bangladesh Bureau of Statistics, Statistics and Information (SID): Dhaka, Bangladesh, 2016.
- Anderson, J.; Hardy, E.; Roach, J.; Witmer, R. A Land Use and Land Cover Classification System for Use with Remote Sensor Data; US Government Printing Office: Washington, DC, USA, 1976; pp. 1–28.
- Mohajan, H. Food, Agriculture and Economic Situation of Bangladesh. In Proceedings of the 2nd International Conference on Global Sustainable Development (2nd ICGSD-2013), Karachi, Sindh, Pakistan, 5–6 October 2013. [Google Scholar]
- Hossain, M. Improving Land Administration and Management in Bangladesh; General Economics Division of the Planning Commision, Bangladesh Institute of Development studies (BIDS): Dhaka, Bangladesh, 2015; pp. 1–41. [Google Scholar]


| Research Theme | Data Sources | Temporal Coverage | Methodology | Source |
|---|---|---|---|---|
| Agricultural land use | Field survey | 1950–1986 | Time series analysis | [32] |
| Land cover mapping | NOAA/AVHRR | 1985/86–1992/93 | ERDAS & Arc-Info | [17] |
| Land use change | BBS | 1980–2000 | Quantitative analysis | [25] |
| Land cover change | Landsat images | 1977–2001 | Knowledge-based classification | [31] |
| Agricultural land use | Agricultural statistics | 1948–2006 | Time series analysis | [24] |
| Agricultural land conservation | Field survey | 2001–2008 | Quantitative analysis | [22] |
| Agricultural land use | Landsat images | 1976–2010 | Hybrid interpretation | [10] |
| Mapping of agricultural potential | BBS, BARC | 2013 | Suitability index | [21] |
| Deforestation | Topographic maps, Landsat, IRS 1A LISS-I, IRS P6 AWiFs | 1930–2014 | Time series analysis, Gi* statistic | [23] |
© 2017 by the authors. Licensee MDPI, Basel, Switzerland. This article is an open access article distributed under the terms and conditions of the Creative Commons Attribution (CC BY) license (http://creativecommons.org/licenses/by/4.0/).
Share and Cite
Rai, R.; Zhang, Y.; Paudel, B.; Li, S.; Khanal, N.R. A Synthesis of Studies on Land Use and Land Cover Dynamics during 1930–2015 in Bangladesh. Sustainability 2017, 9, 1866. https://doi.org/10.3390/su9101866
Rai R, Zhang Y, Paudel B, Li S, Khanal NR. A Synthesis of Studies on Land Use and Land Cover Dynamics during 1930–2015 in Bangladesh. Sustainability. 2017; 9(10):1866. https://doi.org/10.3390/su9101866
Chicago/Turabian StyleRai, Raju, Yili Zhang, Basanta Paudel, Shicheng Li, and Narendra Raj Khanal. 2017. "A Synthesis of Studies on Land Use and Land Cover Dynamics during 1930–2015 in Bangladesh" Sustainability 9, no. 10: 1866. https://doi.org/10.3390/su9101866