Article

Inter-Comparison and Evaluation of Remote Sensing Precipitation Products over China from 2005 to 2013

1
State Key Laboratory of Remote Sensing Science, Jointly Sponsored by Institute of Remote Sensing and Digital Earth of Chinese Academy of Sciences and Beijing Normal University, Beijing 100101, China
2
College of Environmental and Resource Science, Chengdu University of Information Technology, Chengdu 610225, China
3
Environmental Meteorological and 3S Application Technology Laboratory, Chongqing Institute of Meteorological Sciences, Chongqing 401147, China
4
University of Chinese Academy of Sciences, Beijing 100049, China
5
Beijing Huayun Shinetek Science and Technology Co., Ltd., Beijing 100081, China
*
Author to whom correspondence should be addressed.
Remote Sens. 2018, 10(2), 168; https://doi.org/10.3390/rs10020168
Submission received: 7 December 2017 / Revised: 11 January 2018 / Accepted: 19 January 2018 / Published: 25 January 2018

Abstract

:
Precipitation is a key aspect of the climate system. In this paper, the dependability of five satellite precipitation products (TRMM [Tropical Rainfall Measuring Mission] 3BV42, PERSIANN [Precipitation Estimation from Remotely Sensed Information using Artificial Neural Networks] CDR, GSMaP [Global Satellite Mapping of Precipitation] RENALYSIS, CMORPH [Climate Prediction Center’s morphing technique] BLD and CMORPH_RAW) were compared with in situ measurements over China for the period of 2005 to 2013. To completely evaluate these precipitation products, the annual, seasonal and monthly precipitation averages were calculated. Overall, the Huaihe River and Qinlin mountains are shown to have heavy precipitation to the southeast and lighter precipitation to the northwest. The comparison results indicate that Gauge correction (CMORPH_BLD) improves the quality of the original satellite products (CMORPH_RAW), resulting in the higher correlation coefficient (CC), the low relative bias (BIAS) and root mean square error (RMSE). Over China, the GSMaP_RENALYSIS outperforms other products and shows the highest CC (0.91) and lowest RMSE (0.85 mm/day) and all products except for PERSIANN_CDR exhibit underestimation. GSMaP_RENALYSIS gives the highest of probability of detection (81%), critical success index (63%) and lowest false alarm ratio (36%) while TRMM3BV42 gives the highest of frequency bias index (1.00). Over Tibetan Plateau, CMORPH_RAW demonstrates the poorest performance with the biggest BIAS (4.2 mm/month) and lowest CC (0.22) in December 2013. GSMaP_RENALYSIS displays quite consistent with in situ measurements in summer. However, GSMaP_RENALYSIS and CMORPH_RAW underestimate precipitation over South China. CMORPH_BLD and TRMM3BV42 show consistent with high CC (>0.8) but relatively large RMSE in summer.

1. Introduction

Precipitation is one of important factors in the global water cycle and plays a key role in the global energy system. Accurate precipitation data is helpful for short-term and long-term weather forecasts, which allow proactive measures to prevent natural hazards, such as floods, landslide and debris flow, using rainfall models. Measurements of precipitation can be made using rain gauge stations, ground radar, or remote sensing technology. Rain gauge stations are traditional point measurements and have higher accuracy but it is difficult to obtain such precipitation measurements over oceanic and high-altitude areas where only sparse rain gauge stations are available. Ground radar is considered to more accurate for retrieving regional rainfall estimates but ground radar is aimed at monitoring extreme events over limited time spans [1]. Additionally, ground radar is limited over relatively complex terrains, where radar signals maybe be affect by beam blockages and vertical reflectivity profiles [2]. The development of satellite remote sensing has provided several advantages, including its broad spatial coverage, automatic data acquisition and long-term continuity but the signals themselves are affected by the atmospheric and the surface, which will lead to retrieval uncertainties [3]. However, remote sensing is an important method for retrieving high spatial and temporal resolution rainfall measurements over complex terrains and mountainous areas, where both rain gauge stations and ground radar are very limited or unavailable. The satellite retrieval methodologies fall primarily into three categories, which there are the visible and infrared (VIS/IR) methods, microwave (MW) methods and multi-sensor methods.
The VIS precipitation retrieval method mainly utilizes the empirical relationship between cloud brightness and rainfall because precipitation is considered to occur under highly bright clouds, which can be associated with cloud types, cloud areas and cloud growth rates [4,5,6]. IR imagery is associated with cloud top temperatures and cloud growth rates can be obtained via the thermal emissions during both night and day; generally, heavier rainfall tends to be associated with larger, taller clouds with colder cloud tops [5]. Many researchers have developed different methods to retrieve precipitation based on VIR/IR data from geosynchronous earth orbit (GEO) and low-earth orbit (LEO) satellites, including the 3-hourly and monthly mean rainfalls [6,7,8,9,10]. MW sensors can detect rain clouds directly and can provide information about the atmospheric constituents and hydro-meteorological profiles, which are more directly related to the ground precipitation rate [11,12]. Many previous works have developed a number of MW methods to retrieve precipitation [13,14,15]. However, precipitation is not always associated with clouds and the VIS/IR methods cannot detect information below clouds [16]. Meanwhile, MW instruments are restricted to polar-orbiting platforms, meaning that they obtain only a small amount of data and have the disadvantages of low spatial and temporal resolutions [17]. The idea of combining VIS/IR and MW observations to retrieve precipitation from multiple satellite sensors was proposed to compensate for the weaknesses of the two methods [18]. Many products were developed by blending the MW and IR data, such as CMORPH (Climate Prediction Center’s morphing technique), PERSIANN (Precipitation Estimation from Remotely Sensed Information using Artificial Neural Networks), TRMM (Tropical Rainfall Measuring Mission), GSMaP (Global Satellite Mapping of Precipitation). These precipitation products can help climate and hydrological research. Many researchers have compared different satellite precipitation products with in situ measurements over different areas and have proved that satellite estimates showed non-negligible biases. For example, Hirpa et al. evaluated the accuracies of three products (CMORPH, PERSIANN and TRMM3BV42) and found that both CMORPH and TRMM underestimated precipitation over higher elevations [19]. Guo Hao et al. evaluated four products (TRMM, CMORPH, PERSIANN, GSMaP) using in situ measurements over Central Asia from 2004 to 2006 and most of the products overestimated the precipitation [20]. Awange et al. used a “three-cornered-hat” method to assess six precipitation products and indicated that the RG-merged products had higher accuracies than the satellite-only products [21]. It is necessary to discuss the performances of satellite precipitation products with the aim of determining whether a certain product is appropriate for a specific region. However, there are few researches among multi-satellite precipitation products evaluation based on long time series over China.
In this study, considering the study region and the availability of period for all satellite precipitation products, we will mainly assess the strengths and weaknesses of a few widely used rainfall products (CMORPH_CDR, CMORPH_RAW, TRMM3BV42, GSMaP_gauge_renalysis and PERSIANN_CDR) over China from 2005 to 2013. The spatial distributions, temporal variations and rainfall intensities were analyzed and compared with in situ measurements. Precipitation has a particular spatiotemporal distribution over China and thus, we discuss the precipitation over the Tibetan Plateau and South China in 2013. This paper aims to lead the reader to select more accurate satellite precipitation products over China and this research can help to improve the corresponding precipitation retrieval algorithms. This paper is structured as follows: the first part is an introduction. The rainfall products will be present in Section 2. Section 3 expounds on an integrated analytical approach and debates the performances of the space-time variations and errors of different datasets. Finally, the comparative result will be discussed.

2. Satellite and Rain Gauge Precipitation Datasets

2.1. Satellite-Based Precipitation Products
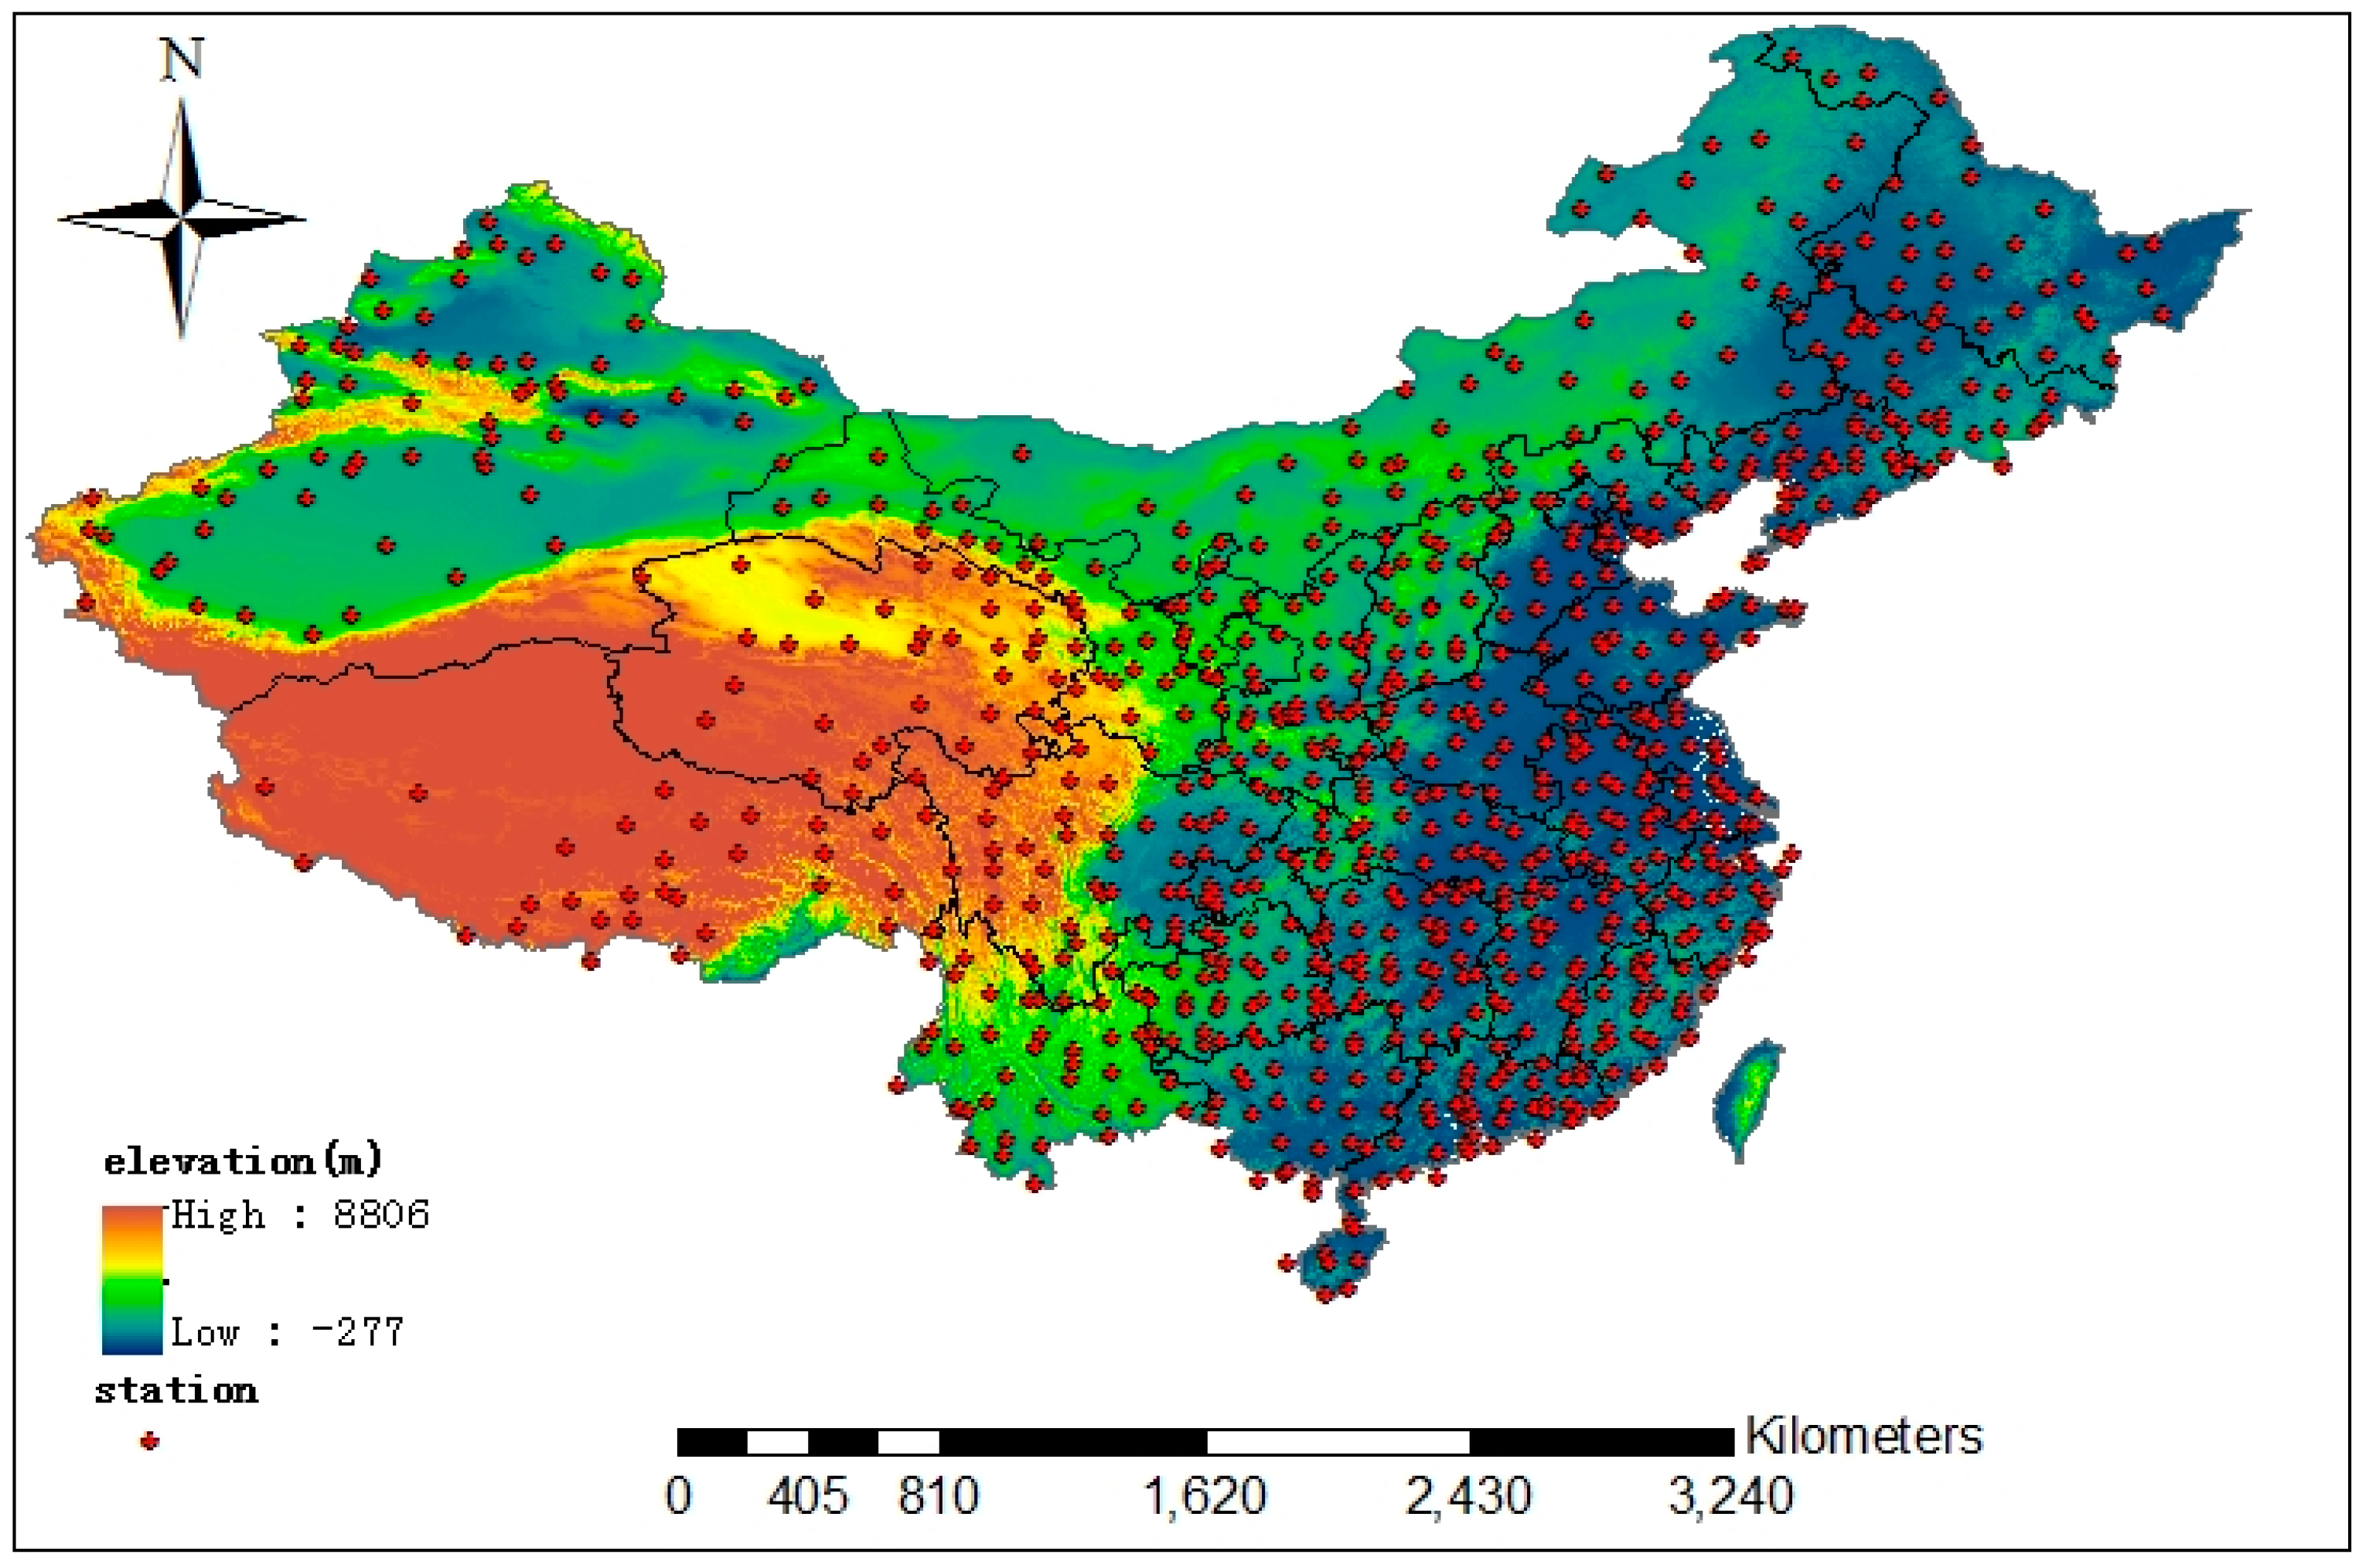
The TRMM satellite was launched in 1997 and was first used to measure precipitation. The National Aeronautics and Space Administration (NASA) Goddard Space Flight Center (GSFC) developed the Multisatellite Precipitation analysis (TMPA) algorithm. The TMPA algorithm combined multiple pass microwave (PMW) datasets, including the Microwave Imager (TMI), Special Sensor Microwave Imager (SSM/I), Advanced Microwave Scanning Radiometer-Earth Observing System (AMSR-E), Advanced Microwave sounding Unit-B (AMSU-B) and IR data being obtained by the international constellation of GEOs satellites [22]. The algorithm first calibrated the PMW data, which were used to create infrared precipitation data. Then, both datasets were combined and the rain gauge data were incorporated. TRMM has different spatial and temporal resolutions to satisfy the demands of its users. The real-time and post-real-time versions have the same spatial resolutions of 0.25° but the data in the post-real-time version is not corrected by the rain gauge data and has a relatively narrow coverage area. The TRMM products have three different temporal resolutions, including three hourly, daily and monthly. This study obtained a TRMM3BV42 with a daily/0.25° resolution, which was gauge-corrected by the Global Precipitation Climatology Center (GPCC) and the Climate Assessment and Monitoring System (CAMS).
CMORPH is produced based on PMW and IR measurements from the National Oceanic and Atmospheric Administration (NOAA)/Climate Prediction Center (CPC) and has a relatively high spatiotemporal resolution [11,23]. IR images (including Meteosat-5/7, Geostationary Meteorological Satellite-5 [GMS-5] and Geostationary Operational Environmental Satellite [GOES-8/10]) are obtained every 30 min at large zenith angles [23] and PMW (including TMI, SSM/I and AMSU-B) can be used to retrieve rain rate relations to the IR images. Joyce et al. exploited IR data to deduce motion fields and spread the PMW rain domains across space and time via a time-weighting interpolation algorithm [11]. There are three different spatial and temporal resolution CMORPH products: 8 km-30 min, 0.25°-3 hourly and 0.25°-daily. These products can be freely downloaded from NOAA for all dates since 2002. This paper employed two types of CMORPH data (CMORPH_RAW and CMORPH_BLD) to analyze the precipitation characteristics from 2005 to 2013 with a spatiotemporal resolution of 0.25°/h. CMORPH_BLD indicates that the satellite data have been calibrated by CPC unified daily gauge analysis methods over land [24].
PERSIANN is a pure satellite precipitation product, which is produced based on an artificial neural network (ANN) model by the Center for Hydrometeorology and Remote Sensing (CHRS) of the University of California [25,26]. The PERSIANN algorithm combines IR images of the Geostationary Environmental satellite and TMI on TRMM. The algorithm mainly depends on the statistical relationship between IR and the precipitation rate and the retrieved precipitation displays considerable uncertainty [26]. Therefore, when PMW data are available, studies adopt a training technique to revise the PERSIANN products with the PMW data. PERSIANN products have three different temporal resolutions (3 h, 6 h and daily) and a spatial resolution of 0.25° and the all products can be freely downloaded for dates since 2000. This paper employed the PERSIANN_CDR products with a spatiotemporal resolution of 0.25°/daily; these are calibrated by the Global Precipitation Climatology Project (GPCP) monthly gauge analysis [27].
GSMaP is a multi-satellite precipitation data source developed by the Japan Science and Technology Agency (JST) and Japan Aerospace Exploration Agency (JAXA) in November 2002 [28,29]. The algorithms adopt a Kalman filtering technique to estimate the hourly global precipitation, wherein the highest spatiotemporal resolution of GSMaP is 30 min/0.0365° over the equator and 0.1°-daily other area, as well as merged PMW (including TMI, AMSR-E and SSM/I) data and IR images from GEO satellite [28]. GSMaP is researched to achieve three mainly goals: first, the project uses the current PMW data to produce high spatiotemporal resolution global precipitation maps. Second, the algorithm of the physical model of the precipitation and rainfall rate can constantly be improved. Third, evaluating the accuracy of the precipitation products can aid the Global Precipitation Measurement (GPM) projection, which launched in 2014. The GSMaP team has achieved different standard products according to diverse algorithms, including the GSMaP_NRT, GSMaP_MVK, GSMaP_Gauge and GSMaP_RENALYSIS. The study selected the GSMaP_RENALYSIS merged with the CPC global rain gauge data to analyze the precipitation over China after considering the features of the study period [30]. Information concerning all the products is listed in Table 1.

2.2. Gauge Stations

This study adopted 830 rain gauge stations from the China Meteorological Data Sharing Service System (http://data.cma.cn/) and nine years of daily data were obtained from 2005 to 2013 to assess the distribution of precipitation over a long time. Meanwhile, we used data from 2280 rain gauge stations in 2013 to completely analyze the accuracies of the satellite precipitation products over the Tibetan Plateau and South China areas. Rain gauge stations are sparsely distributed across the Tibetan Plateau because of its extreme terrain and climatic conditions and some rain gauge stations are closed in the winter to protect their instruments, so some data is unavailable. There are more stations over the Yangtze River, South China and North China, which are used to accurately analyze the distributions of the rainfall. The western Northwest region also has relatively few stations. The elevation data of the study area were obtained from Shuttle Radar Topographic Mission (SRTM on http://srtm.csi.cgiar.org/), of which the spatial resolution is about 90 m. The rain gauge station distributions and the topography of China are shown Figure 1.

3. Statistical Evaluation Methods

In this study, five products are compared with the data from rain gauge stations, which are often viewed as true values. We will discuss the characteristics of the precipitation on the yearly, seasonally, monthly and daily time scales. We use statistical analysis methods, including the linear correlation coefficient (CC), relative bias (BIAS), root mean square error (RMSE), the frequency bias index (FBI), probability of detection (POD), false alarm ratio (FAR) and critical success index (CSI) to compare the differences from pixel to point [31,32]. There is a high correlation between the satellite products and in situ measurements if the CC is greater than 0.7 [33]. The result is considered underestimation (overestimation) of the precipitation when the BIAS is less than (more than) zero [34]. POD and FAR express the ratios of the rainfall events, which are accurately measured and provide error warnings. The CSI denotes the overall ratio of the rainfall events that are accurately estimated by the satellite. The best comparison result occurs when the FBI, POD and CSI are equal to one and when FAR equals zero [35]. All indices are defined as follows.
CC = cov ( S G ) σ s σ v = i = 1 N ( G i G ¯ ) ( S i S ¯ ) i = 1 N ( G i G ¯ ) 2 i = 1 N ( S i S ¯ ) 2
BIAS = i = 1 N ( S i G i ) i = 1 N G i
RMSE = 1 N i = 1 N ( S i G i ) 2
FBI = H + F H + M
POD = H H + M
FAR = F H + F
CSI = H H + M + F
where S represents the satellite-retrieved precipitation and G represents the in situ-measured precipitation. S ¯ and G ¯ indicate the mean satellite precipitation and in situ-measured precipitation, respectively. N is the number of rainfall pairs between the gauge and satellite data. σ s and σ v are the standard deviations of the satellite and gauge. H, F and M denote the amounts of hits, false alarms and misses, which are calculated as described in Table 2 [32]. The threshold was set 0.1 mm/day considering the minimum of the situ measurements.

4. Results and Discussion

4.1. Evaluation on the Regional Scale

4.1.1. Nine-Year Daily Mean Precipitation

China has special topographic and geomorphological features and its precipitation shows different distributions. Overall, all satellite-based products and in situ measurements have the same trends, wherein the precipitation distribution decreases from the southeast coast to the northwest inland. Figure 2 shows the nine-year daily mean precipitation of 2005 to 2013. The southeast has a higher mean daily precipitation than that in other areas, which some areas are as high as to 12 mm/day. The northwest has a typical semi-arid and arid climate with little precipitation, which most of areas are less than 2 mm/day. The phenomenon is mainly determined by climate and topography. CMORPH_BLD, CMORPH_RAW and TRMM3BV42 have clearly underestimated precipitation compared with the in-situ measurements in the south. This can be explained that there is more shallow and warm rains in the south, while the microwave-based algorithms can more easily obtain data for heavy rainfall events than weak rainfall events [36,37]. PERSIANN-CDR show a remarkable overestimation of precipitation in most areas, such as southern Tibet and regions of South China (such as Guangzhou and Fujian), wherein PERSIANN mainly adopts the IR brightness temperature data from geostationary satellites to estimate rainfall rates. MW is used only to adjust the model parameters, which differs from other satellite retrieval algorithms [25,27]. CMORPH_BLD, CMORPH_RAW, TRMM3BV42 and PERSIANN underestimated in north China, in where the precipitation mainly occurs in July and August. The precipitation is characterized by strong rainfall but short duration, so it is possible that sensors missed precipitation during the period. GSMaP_RENALYSIS is most consistent with the in-situ measurements but also overestimated values in some regions in the south (such as the south of Sichuan, Guangdong, Jiangxi) and northeast of China. All satellite products showed overestimations over the south of Tibet, in where are no-rain gauge stations (Figure 1). The precipitation was obtained by interpolation technique based on surrounding stations located semi-humid region. The south of Tibet belongs to humid region and has heavy precipitation. Therefore, the precipitation by interpolation is less than satellite retrieval. However, all satellite products underestimated precipitation over the most of arid region, the passive microwave retrieval of precipitation might be hampered by the snow and ice surface [38,39]. The satellite bias-corrected product (CMORPH_BLD) is more consistent with the in-situ measurements than the original satellite product (CMORPH_RAW) according to the precipitation distribution. Therefore, the bias-correction using the in-situ measurements greatly improved the product accuracy.
The density-colored scatter plots are shown in Figure 3, which provides a quantitative comparison among the satellite products and in situ measurements for the nine-year mean daily precipitation values over China (including 830 stations). The bias-corrected products, except for that of PERSIANN_CDR, have greater R and lower RMSE than CMORPH_RAW. The R of CMORPH_BLD is 0.8 higher than CMORPH_RAW (0.73) and the slope of CMORPH_BLD and CMORPH_RAW are 0.58 and 0.32, respectively. The result suggest that the bias-corrected products have improved the accuracy greatly (Figure 3a,b). TRMM3BV42 and CMORPH_BLD have similar distributions of density scatter and the differences of R and RMSE are small (Figure 3b,c). The PERSIANN_CDR has a high R (0.78) but also yields high RMSE (2.93 mm/day) and the discrete degree of point is larger than other products, which PERSIANN uses only IR data to estimate rainfall rate (Figure 3d). The highest R and lowest RMSE of GSMaP_RENALYSIS are 0.91 and 0.85 mm/day and these points are uniform distributed, because GSMaP_RENALYSIS has inherited CMORPH’s morphing algorithm and employs a new Kalman filter approach to assimilate IR-derived rain rates, which it can help to reduce the total errors (Figure 3e) [11,39,40].
To analyze the continuous variations, the CC, RMSE and BIAS are calculated for each year from 2005 to 2013, as is shown Table 3. GSMaP_RENALYSIS has the highest CC (more than 0.8) and the lowest RMSE and BIAS (about ±0.1 mm/day). GSMaP_RENALYSIS underestimated the precipitation in both 2005 and 2006 according to its BIAS, which is less than zero but it slightly overestimated the precipitation during 2007 to 2013. The PERSIANN_CDR overestimated the precipitation in each year and CMORPH_BLD, CMORPH_RAW and TRMM3BV42 underestimated the precipitation, which is similar to the nine-year daily mean precipitation. Note that all products have greater CC in 2007 than in 2008 but the RMSE are also higher, which is attributed to the occurrence of the decadal maximum of precipitation, such that the national mean precipitation was approximately 654.8 mm. In 2012, the CC of CMORPH_RAW and CMORPH_BLD were 0.37 and 0.76, respectively, which shows that the gauge correction greatly improved the precipitation estimation accuracies. Overall, GSMaP_RENALYSIS’s performance is comparable to other satellite-based products over China.

4.1.2. Seasonal Daily Mean Precipitation

Figure 4 shows the distribution of the seasonal daily mean precipitation values interpolated from the rain gauge stations and the multiple satellite-based precipitation products over China. The CC, BIAS and RMSE statistical values are plotted in Figure 5.
As shown in the seasonal precipitation distribution interpolated from the rain gauge stations (GAUGE_STATION), the summer and spring experience more precipitation (the maximum amounts are 15 mm/day and 10 mm/day, respectively) because both are part of the “rainy” season in China influenced by the southwest monsoon and southeast monsoon. The winter and autumn experienced less precipitation (with maxima of 5 mm/day and 8 mm/day, respectively). This phenomenon is related to the passage of rain over China. It should be noted that there have more precipitation in summer and spring than in autumn and winter because the rainfall events begin in southern China from February to May every year. The precipitation then moves north with the heat of the seasons. Rainfall begins to fall rapidly when the cold air comes from the north at the end of August or the beginning of September. There is greater rainfall in the summer than in the autumn over the south because the period of the “plum rains” season occurs from April to June in China. The northwest experiences little precipitation in all four seasons as it belongs to the arid and semi-arid region of China, in where is far from the sea and is blocked by mountains.
Generally, the distributions of the satellite precipitation products are similar to that of the rain gauge stations, except for CMORPH_RAW, which is not bias corrected. The GSMaP_RENALYSIS are the most similar to the rain gauge data (CC more than 0.8 and BIAS less than ±0.1 mm/day, respectively). All satellite products underestimated the precipitation in the winter over some regions, such as northeast of Neimeng and northwest of Tibet. This might be attributed to the following reasons: The little precipitation in this area is mainly produced from the Atlantic Ocean through the western wind belt and it is difficult to capture low-level precipitation by PMW sensor. Meanwhile, it might be caused the more snow and ice cover on the ground in winter. All products overestimated the precipitation in the summer over the south of Tibet, in where have heavy precipitation. The phenomenon might be related to the sparsely and unevenly rain gauges. The interpolation technique is used to spread nonzero precipitation into zero and lead to obtain less precipitation. CMORPH_RAW is poorly consistent with all other products and with the in-situ measurements over all four seasons. CMORPH_RAW and CMORPH_BLD show some abnormal zero precipitation over Tibetan Plateau in winter. It is possible that the ice and snow surface tend to influence PWM-based accurate retrieval over land [37]. PERSIANN_CDR exhibited serious overestimations of precipitation over southern China. This result may be attributed to the lack of training of the ANN parameters over China because PERSIANN_CDR is only adequately trained over the United States [41]. We calculated the quality analysis of the satellite products and in situ measurements, as shown in Figure 5. All products provide the highest CC and lowest RMSE (greater than 0.8 and less than 1 mm/day, respectively) in the winter but the highest BIAS also occurs in the winter. This might be related to the following reasons: the rainfall events are less than other seasons due to climate and the rainfall intensity is usually small in winter. Next, the ice and snow surface might to influence satellite retrievals over land and the gauge stations might measure abnormal data over the high-latitude areas and high-altitude areas, which the data were considered abnormal data during dealing. This should be partially responsible for the high CC, BIAS and low RMSE in winter. There are more strong convective precipitation events well detected by microwave-base algorithms during the summer [36,37]. However, the satellite might miss some precipitation events because the duration of precipitation is short, which may cause some errors. All products show the lowest BIAS (less than 0.5 mm/day) and highest RMSE (about 2 mm/day) in summer, meanwhile the CC (more than 0.7) is relative high.

4.1.3. Monthly Daily Mean Precipitation

Statistical information (e.g., CC, BIAS and RMSE) is computed to study the monthly daily mean precipitation from 2005 to 2013, as shown in Figure 6. Some previous works have suggested that the biases and errors could be magnified over regions with no gauge stations [42]. Therefore, this study calculated only the monthly mean daily data to guarantee more than one gauge station per pixel.
The CC, RMSE and BIAS of the products exhibit similar fluctuates, except for those of CMORPH_RAW, as shown in Figure 6. The higher CC generally occurs in May and December, while lower CC occur in September and October. Overall, CMORPH_BLD and GSMaP_RENALYSIS have higher CC than the other products but the CC of GSMaP_RENALYSIS is also occasionally low, such as in February 2008. When CMORPH_BLD and TRMM3BV42 are greater than 0.7, the GSMaP_RENALYSIS CC is approximately 0.4. The trends of the RMSE distributions for several satellite-based precipitation time series are the same, showing a w-style trend. The maximum is in July and both January and December are low because there is a higher daily mean rainfall the in summer and a lower daily mean rainfall in the winter. The BIAS trends have the following characteristics: GSMaP_RENALYSIS and CMORPH_BLD BIAS present stable and relative low values (±0.5 mm/day). CMORPH_RAW and TRMM_3BV42 have the same regular biases, while PERSIANN_CDR presents a large fluctuating trend and positive deviation with a high CC in the winter (December, January and February). This can be put down to the inaccurate input of the IR data in the winter, which can bring about inferior data from the IR-based PERSIANN retrieval method.

4.2. Probability Distribution and Contingency Statistics

To determine the universal characteristics of precipitation, it is important to evaluate the precipitation frequencies of different intensities as well as their means and spatiotemporal variation distributions [37]. Different precipitation intensities may lead to different natural disasters, such as floods and mudslides [41,43]. Therefore, the PDF (probability distribution function), which offers more information about the frequencies of different intensities of precipitation events, is used to analysis more detailed rainfall characteristics.
In this paragraph, the satellite precipitation products are compared with in situ measurements for detecting the precipitation events and intensities over China during the nine years from 2005 to 2013. The PDF is the proportion of the number of times that rainfall events from each bin occurs divided by the total number of rainfall events. To considering the rainfall intensity (R), this study has divided rainfall into eight bins [20]: (1) no rain (R = 0), (2) 0 < R ≤ 0.5 mm/day, (3) 0.5 mm/day < R ≤ 1 mm/day, (4) 1 mm/day < R ≤ 2 mm/day, (5) 2 mm/day < R ≤5 mm/day, (6) 5 mm/day < R ≤ 10 mm/day, (7) 10 mm/day< R ≤ 20 mm/day and (8) R > 20 mm/day. The pixels nearest the gauge stations were selected to calculate the rainfall intensities. Approximately 60% of the values computed using the rain gauge stations show no-rain events, as shown in Figure 7 and Figure 8. CMORPH_RAW, CMORPH_BLD and TRMM3BV42 can be inclined to detect more no-rain events than the gauge stations (around 79%, 65.4% and 64.3%, respectively), which suggests that satellite measurements may miss some rain events. CMORPH_RAW detected more no-rain events than CMORPH_BLD, which showed that the bias-corrected satellite data tend to record more rainfall events. GSMaP_RENALYSIS and CMORPH_BLD record more light rainfall events (0 < R ≤ 0.5 mm/day, around 8.5% and 8.8%, respectively) than the other datasets. CMORPH_BLD, GSMaP_RENALYSIS and PERSIANN_CDR can record more rainfall events than the other products when the rainfall intensities are between 0.5 mm/day and 5 mm/day, where they may have an R value as high as 2 < R ≤ 5 mm/day (around 7.7%, 9.3% and 8.1%, respectively). These results can be explained follows: (1) the satellites can easily detect strong, convective rainfall events but are inclined to miss shallow and warm rains; (2) the bias-corrected methods can boost the amplitudes of the detected events to compensate for the missed events [37]. This study analyzed FBI, POD, CSI and FAR to evaluate the qualities of the errors between the satellite products and the gauge station data. The results of the statistical analyses are shown in Table 4. CMORPH_RAW FBI is better than CMORPH_BLD, such that the POD and CSI are low and FAR is high. TRMM3BV42 FBI is the closest to the gauge data of all the products but the POD and CSI are lower and the FAR is higher than for GSMaP_RENALYSIS. Therefore, GSMaP_RENALYSIS can more accurately detect rain events than the other products.

4.3. Typical Regional Analysis

In this study, we collected data from 2280 rain gauge stations to analyze the precipitation in 2013 over the Tibetan Plateau and South China. The total precipitation was mapped in all four seasons and the CC, RMSE and BIAS were calculated in every month, which are shown in Figure 9, Figure 10, Figure 11 and Figure 12. Tibetan Plateau is a typical of rainfall distribution including humid regions, semi-humid regions and semi-arid regions, which the distribution is influenced by atmospheric circulation and topography. Rain gauge stations are sparsely distributed over the Tibetan Plateau and the elevation ranges from 86 m to 8755 m and there are exceedingly few gauge stations built in areas with high elevation (Figure 9a). Figure 9b shows the spatial distribution of the total precipitation in four seasons. The total precipitation is relatively low and the spatial distribution trend of precipitation is decreasing from southeast to northwest. The satellite precipitation distribution is similar to the gauge stations but some regions show considerable differences. All products exhibited overestimation in the winter over the western regions, which the result related to the no-gauge stations and interpolated technique. All products overestimated the precipitation in the summer, excepting CMORPH_BLD. CMORPH_RAW overestimated the precipitation and its RMSE and BIAS showed large fluctuating patterns, demonstrating that uncorrected satellite products perform poorly over semi-arid and arid areas. CMORPH_RAW and CMORPH_BLD show some abnormal zero precipitation over Tibetan Plateau. It is possible that the ice and snow surface tend to influence PWM-based accurate retrieval over land [37]. The RMSE of GSMaP_RENALYSIS showed large differences in four seasons and GSMaP_RENALYSIS produces underestimation in the spring and overestimation in the summer and autumn.
To evaluate the performances of the satellite-based precipitation measurements, we calculated the CC, RMSE and BIAS values for each month, as shown in Figure 10. The CC of all the products are high from April to October (more than 0.6) and are relatively low in those months when the climate is dry. This result can be explained by the following reasons: (1) compared with weak precipitation, satellite sensors are more able to obtain heavy rainfall events; (2) Over the higher elevation mountainous area of eastern China, it is difficult to obtain accurate precipitation values via remote sensing methods due to the snow and ice on the surface in the winter; (3) Because of the complicated land surface characteristics and their effects on the upward microwave radiation, impacting SSM/I, AMSR-E and AMSU-B, it is difficult for the satellites to resolve rainfall over areas with low rainfall amounts [44]. PERSIANN_CDR has the worst CC among the satellite products and its RMSE and BIAS values show the largest errors, which can be explained by the poor input IR data over Tibetan Plateau. Overall, GSMaP_RENALYSIS has the best performance of all the products over the Tibetan Plateau and PERSIANN_CDR has the worst performance, both seasonally and monthly.
There are more rain gauge stations and precipitation events in southern China than over the Tibetan Plateau, so we researched the regions including Fujian, Guangdong, Jiangxi, Hunan and Guangxi. The area of study and the elevation data are shown in Figure 11. The seasonal precipitation events detected by the satellites are similar to the in-situ measurements and the max annual precipitation is approximately 1500 mm in the spring and summer over Guangdong as well as over the south of Guangxi. This might be related to the period of precipitation: the study area is mainly affected by the southeast monsoon from the Pacific Ocean and the southwest monsoon from the India Ocean, which the period of precipitation is from May to September. The north of Hunan and Guangdong had more precipitation events than the other regions in all seasons except winter. Jiangxi and Fujian had more precipitation in the winter. This regional precipitation is mainly affected by the cold and warm air in the south. Note that little precipitation was measured over Hunan because of the effects of summer winds leading the precipitation northward in the summer. The CC, RMSE and BIAS values were calculated for each month and were compared with in situ measurements, as shown in Figure 12. The CC of all products are low in January, October and December and the RMSEs are high in the summer. The BIAS is near zero, except in CMORPH_RAW. CMORPH_RAW shows poor CC values, with a low near zero occurring in January. CMORPH_BLD and TRMM3BV42 show highly consistent precipitation distributions and both have higher CC than the other products. However, the CC of CMORPH_BDL is higher than that of TRMM3BV42 in January and November and its BIAS is lower. According to the precipitation distribution and the calculated statistical correlations, the CMORPH_BDL product is consistent with the in-situ measurements.

5. Conclusions

This paper mainly discusses the CMORPH_BLD, CMORPH_RAW, TRMM3BV42, PERSIANN_CDR and GSMaP_RENALYSIS precipitation products and their spatiotemporal precipitation distributions based on daily, monthly, seasonal and annual values. We compared the satellite products with data from rain gauge stations using statistical tools, such as their CC, BIAS and RMSE, for the period of 2005 to 2013. The five satellite rainfall products based on four different methods were analyzed via a quantitative study of their error features and the following points were concluded:
(1)
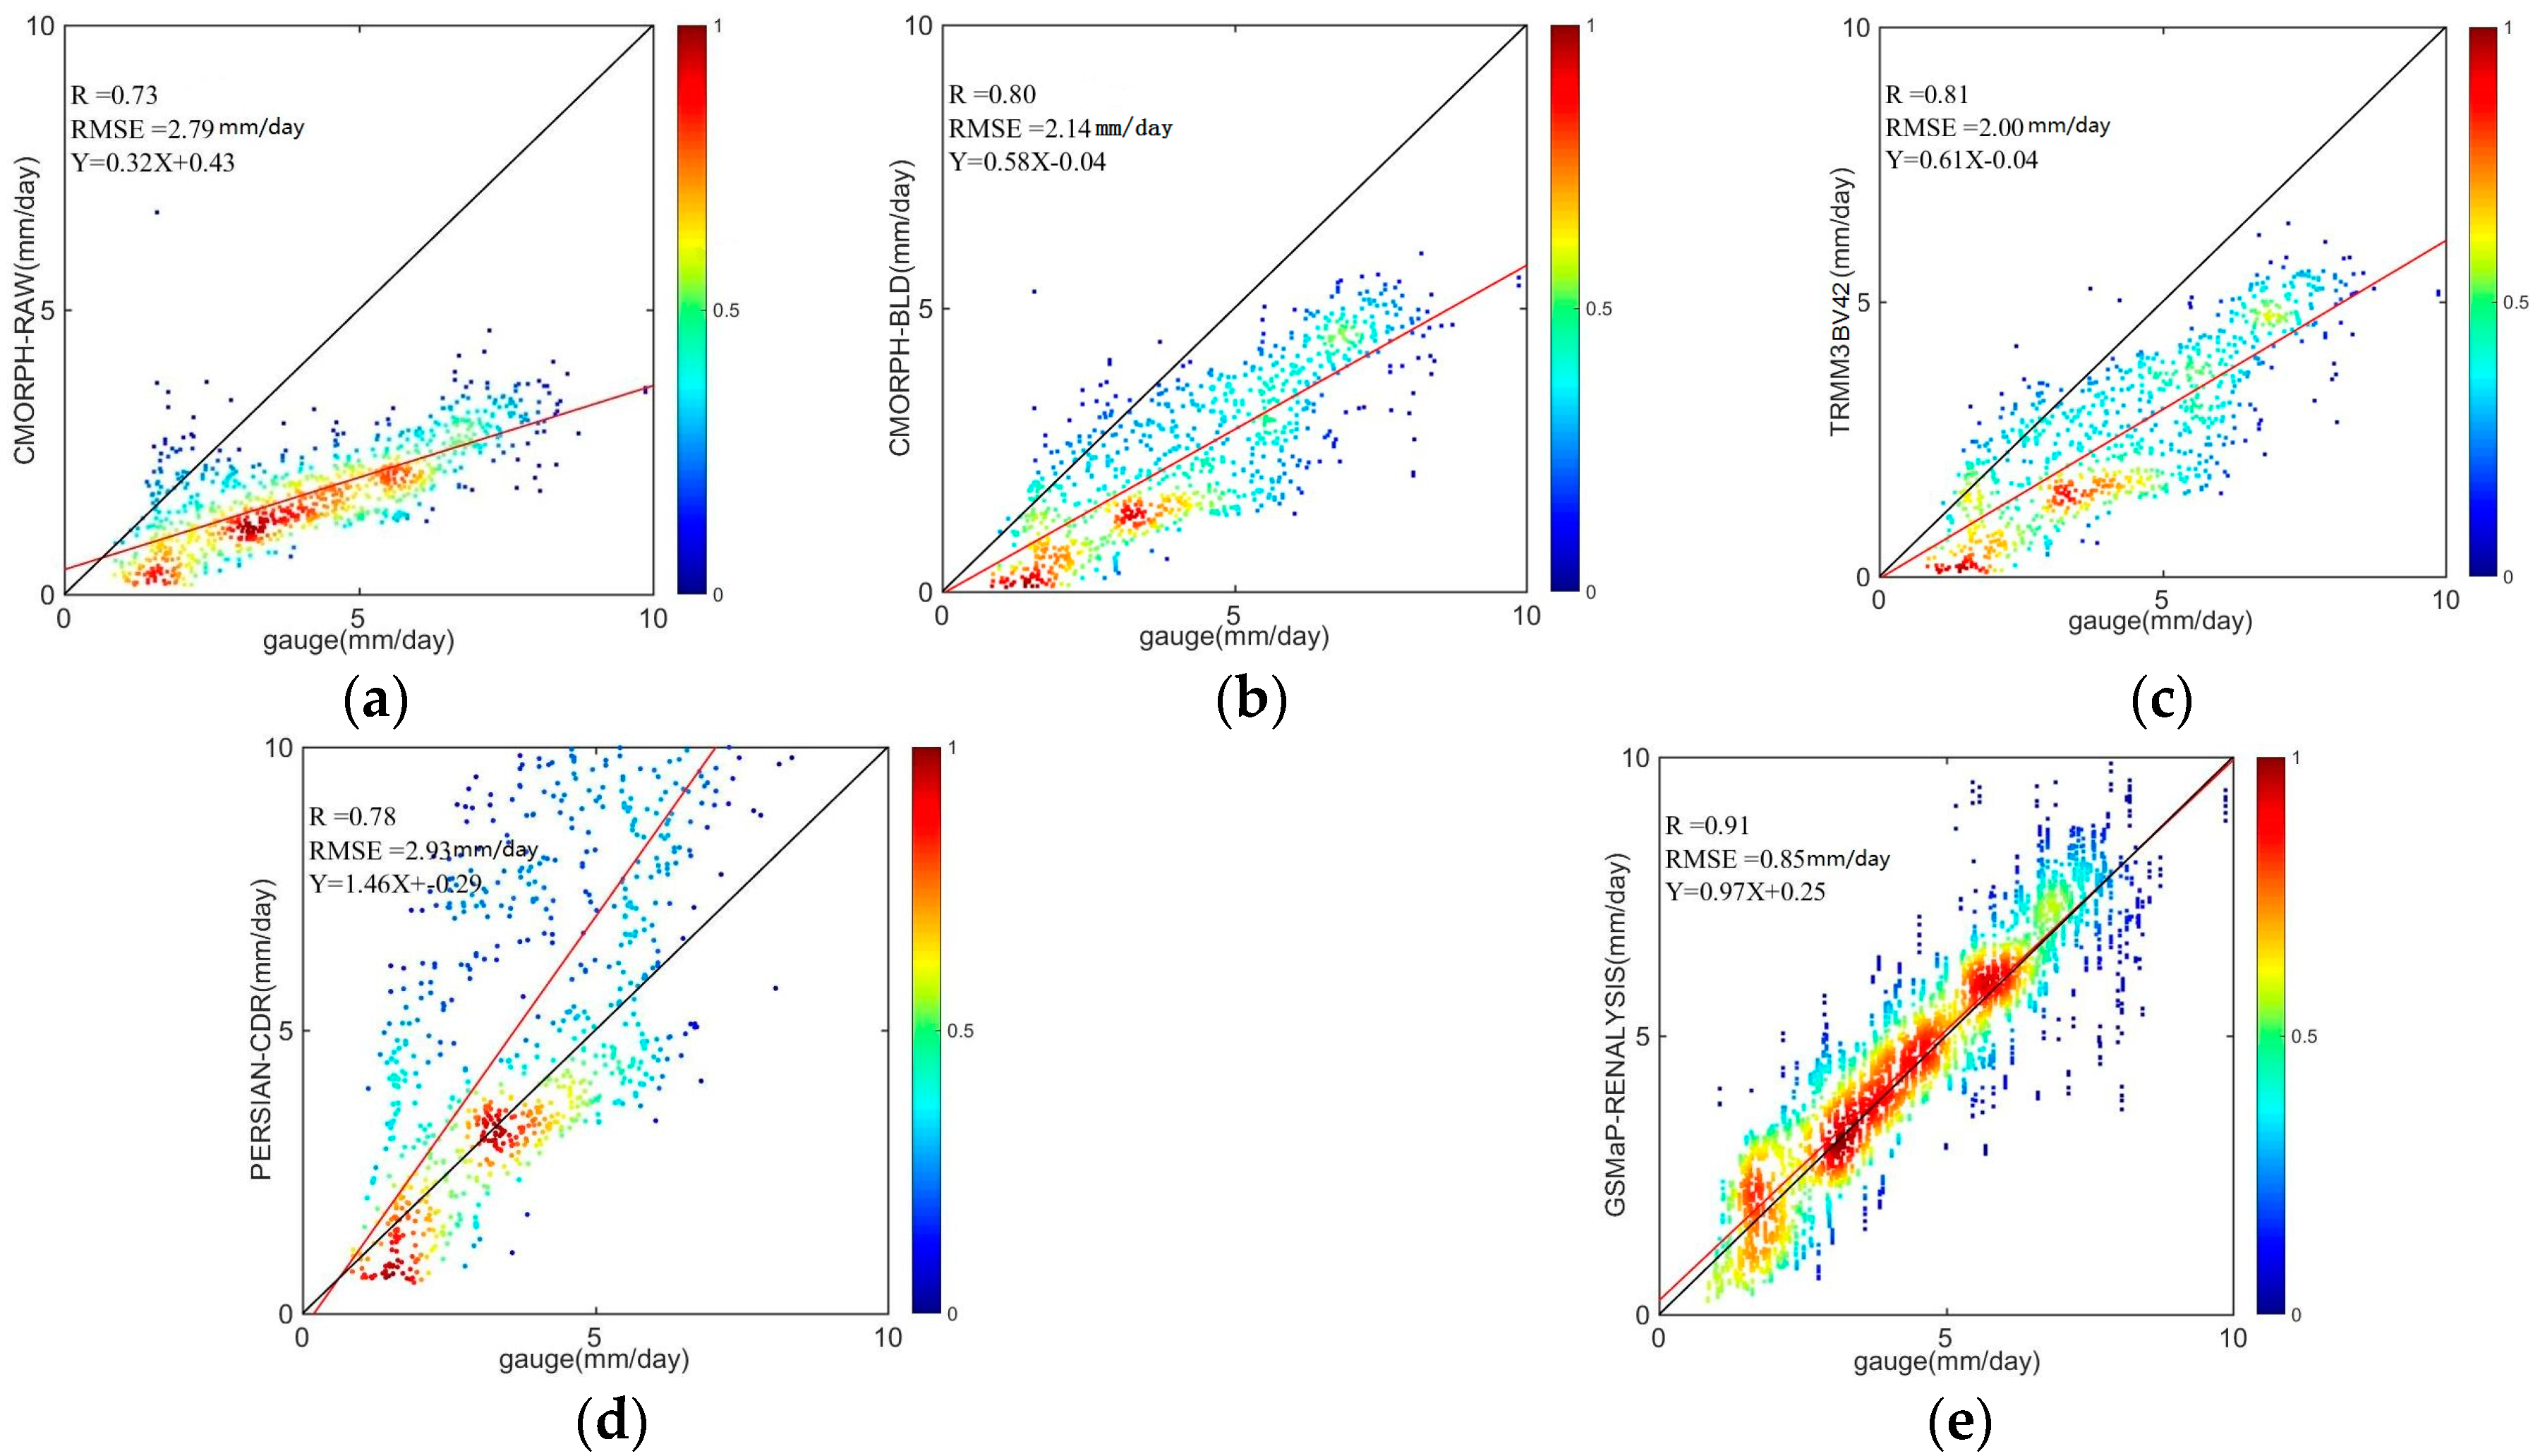
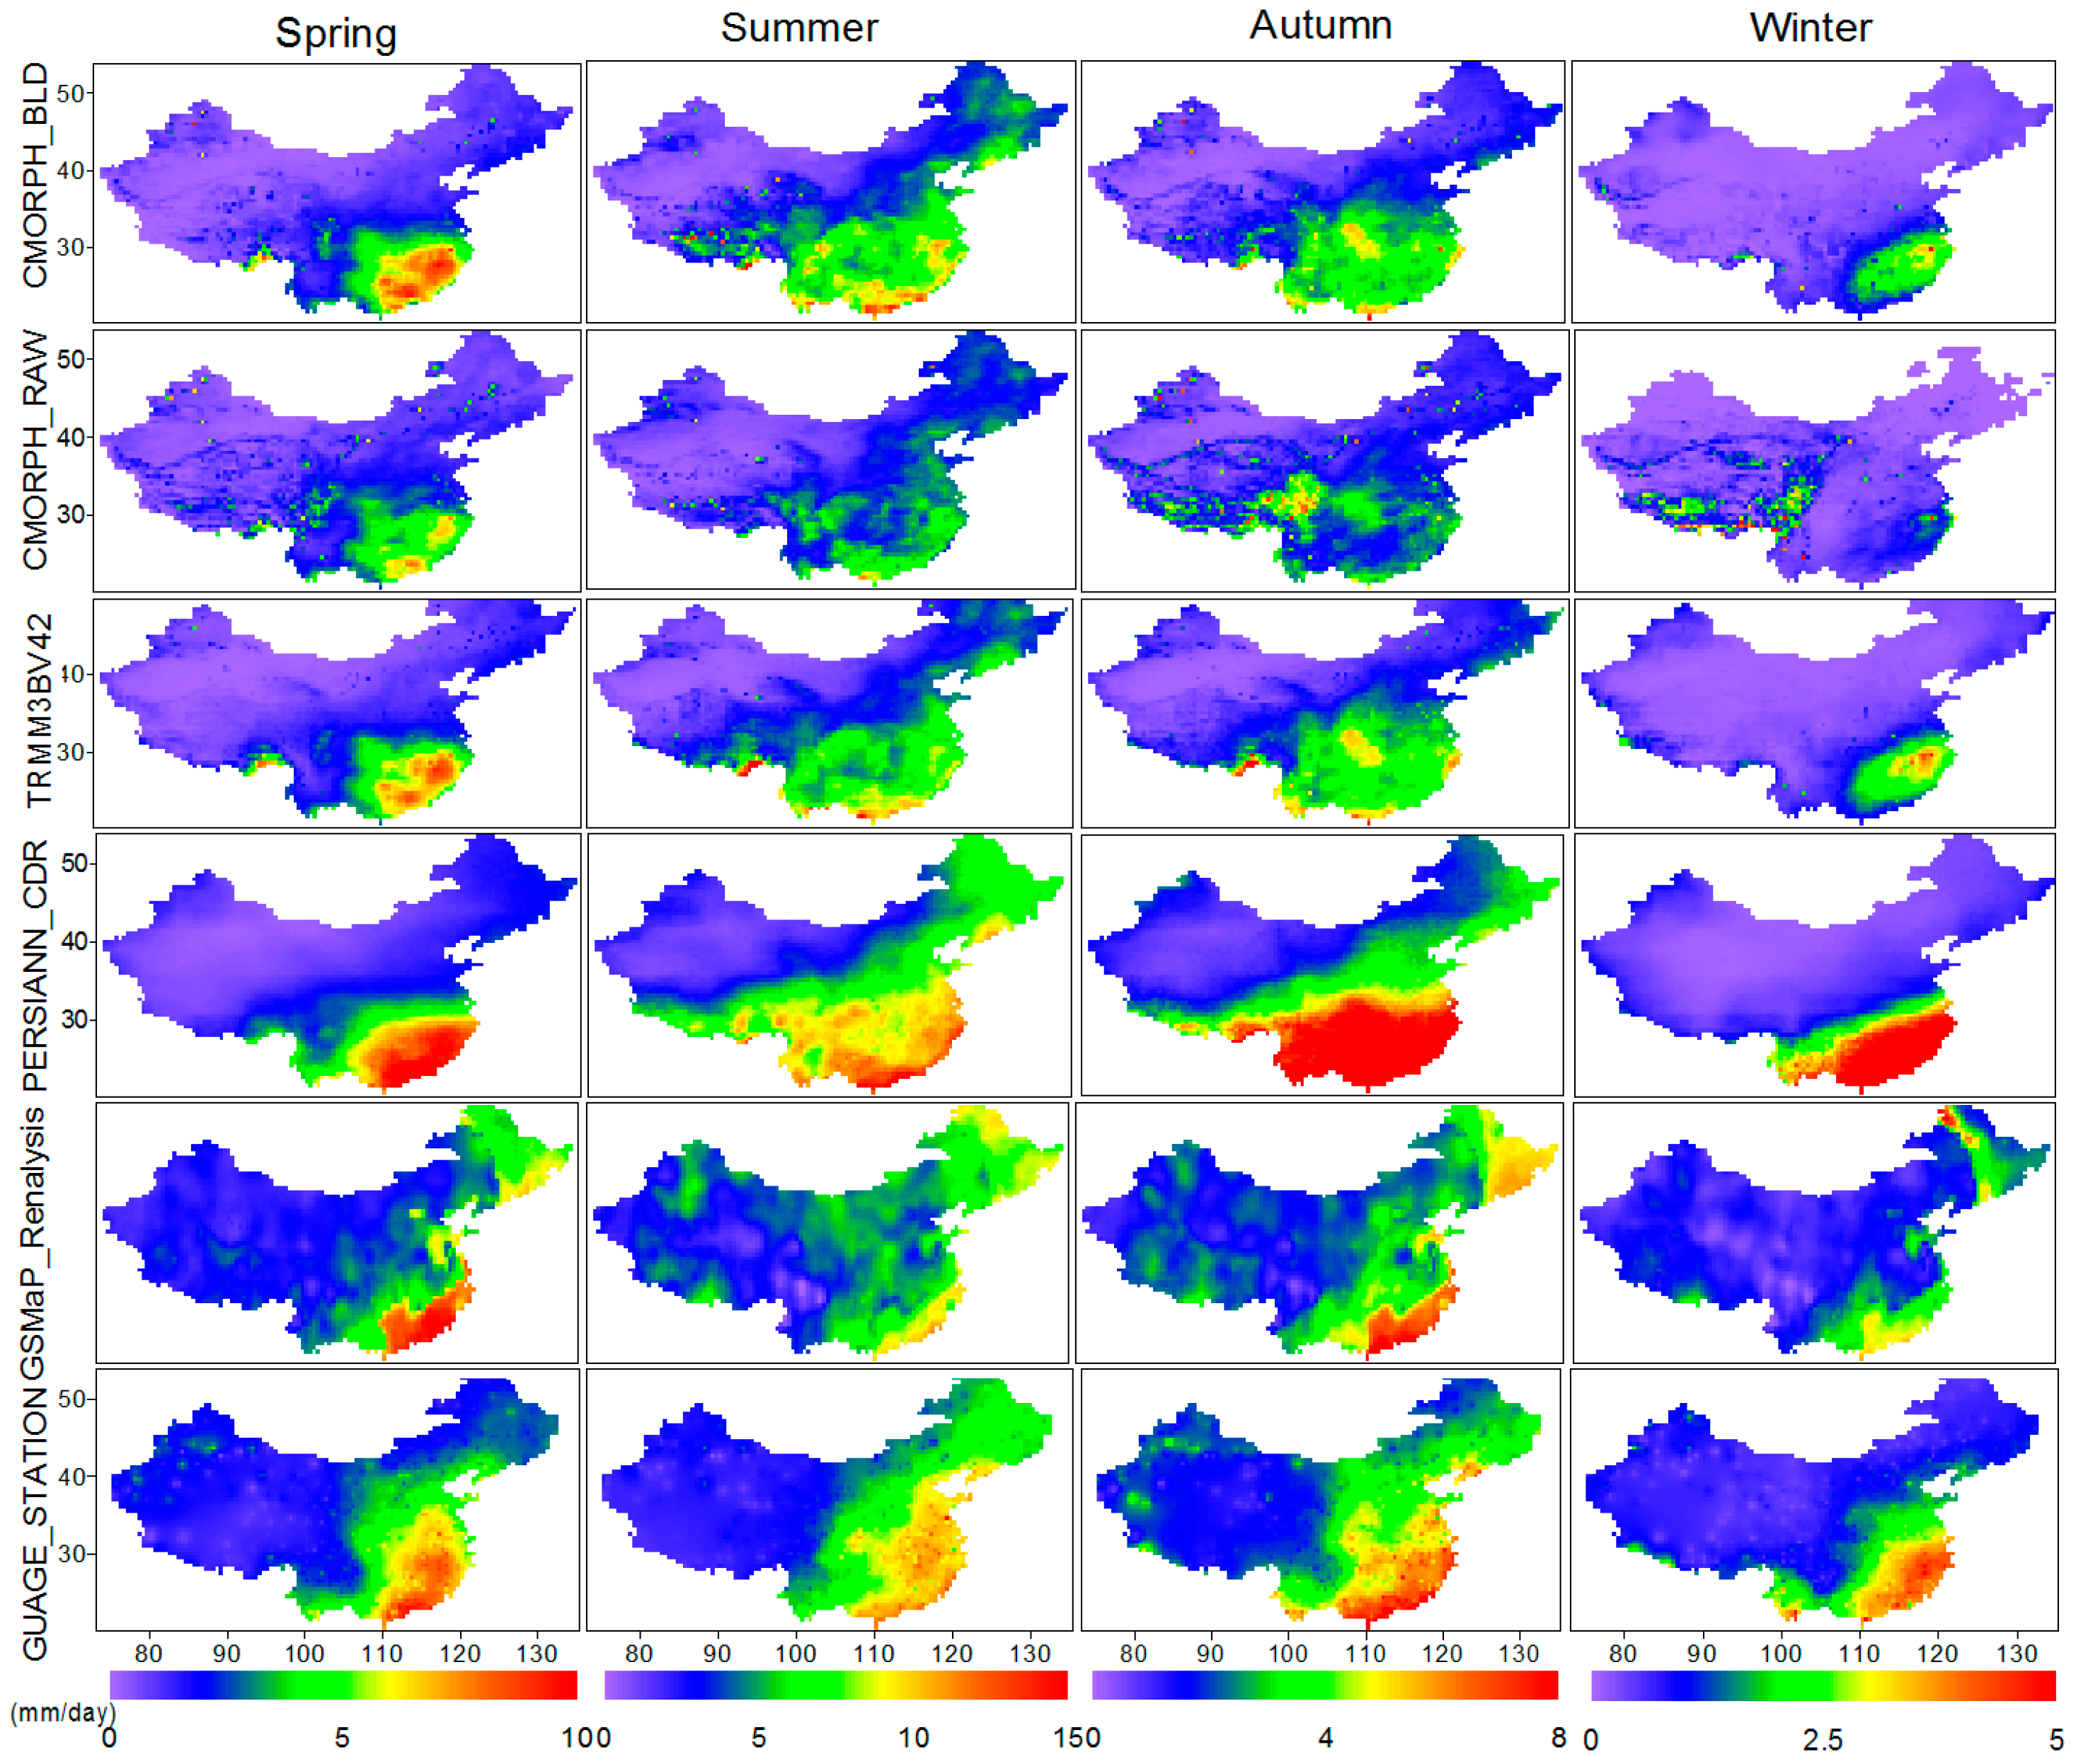
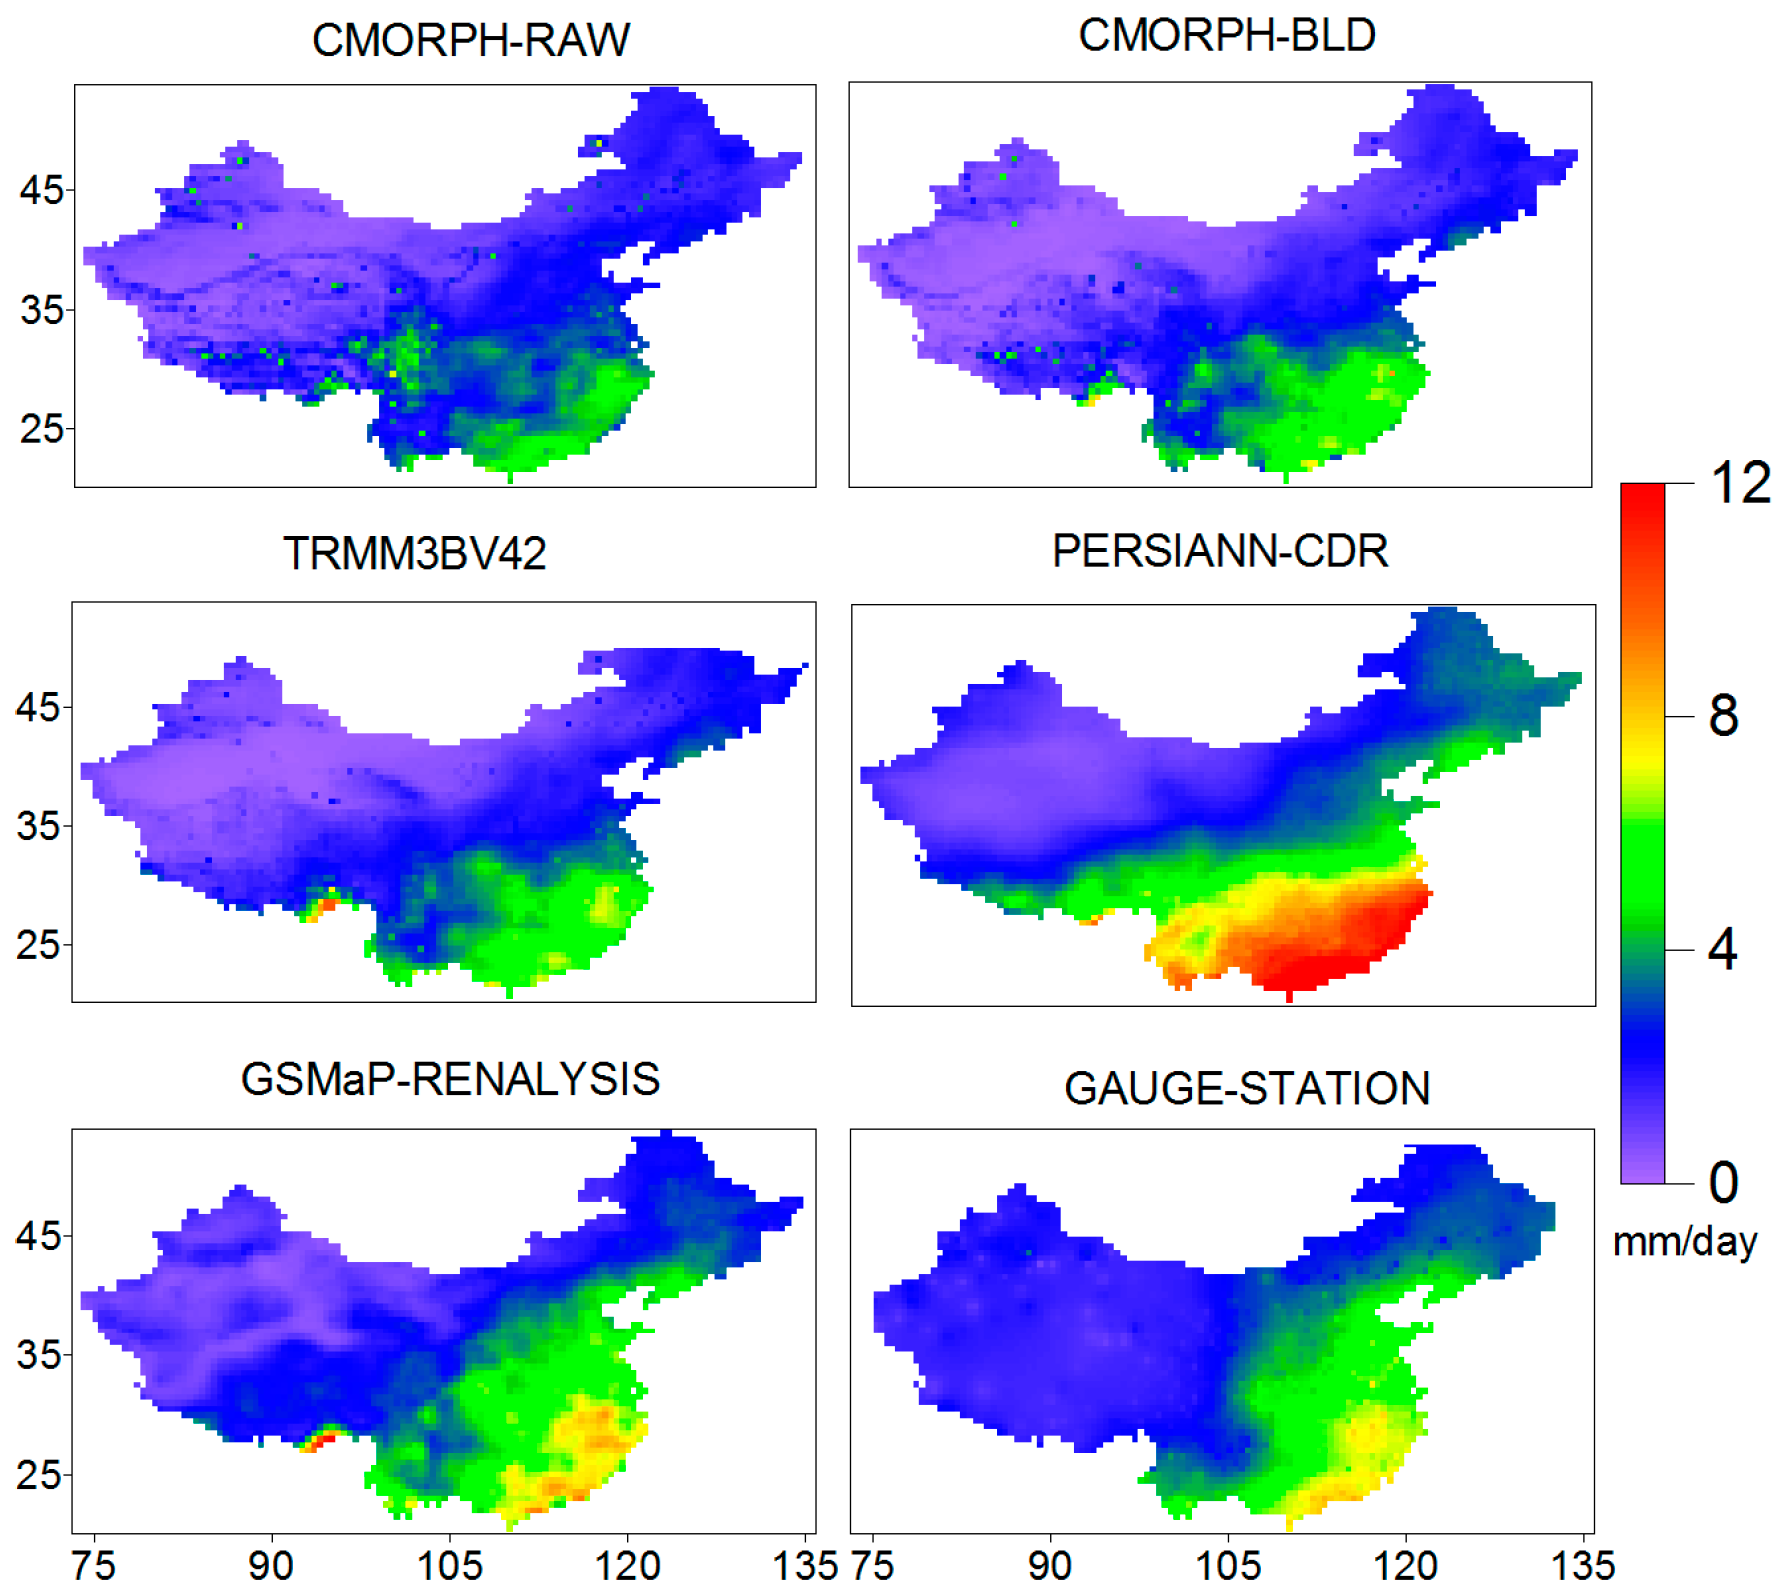
According to the nine-year daily mean precipitation over China (Figure 2 and Figure 3), the characteristics of precipitation is clearly gradually increasing in the south and decreasing in the northern regions of the Qinling Mountain and Huaihe River. There is more than 10 mm/day in the south and less than 5 mm/day in the northwest. Among the five satellite products, GSMaP_RENALYSIS suggests the best performance with the highest of R (0.91) and the lowest RMSE (0.85 mm/day). CMORPH_RAW demonstrates the poorest capability with the lowest of R (0.73) and higher RMSE (2.79 mm/day). For the CC, RMSE and BIAS each annual daily mean precipitation from 2005 to 2013 (Table 3), GSMaP_RENALYSIS gives the highest CC (>0.8) and smallest RMSE (~1.2 mm/day) and the low BIAS (±0.1) in every year. GSMaP_RENALYSIS underestimates precipitation from 2005 to 2006 but it overestimates precipitation from 2007 to 2013. CMORPH_BLD, CMORPH_RAW and TRMM3BV42 exhibit underestimation precipitation but PERSIANN_CDR shows overestimation precipitation.
(2)
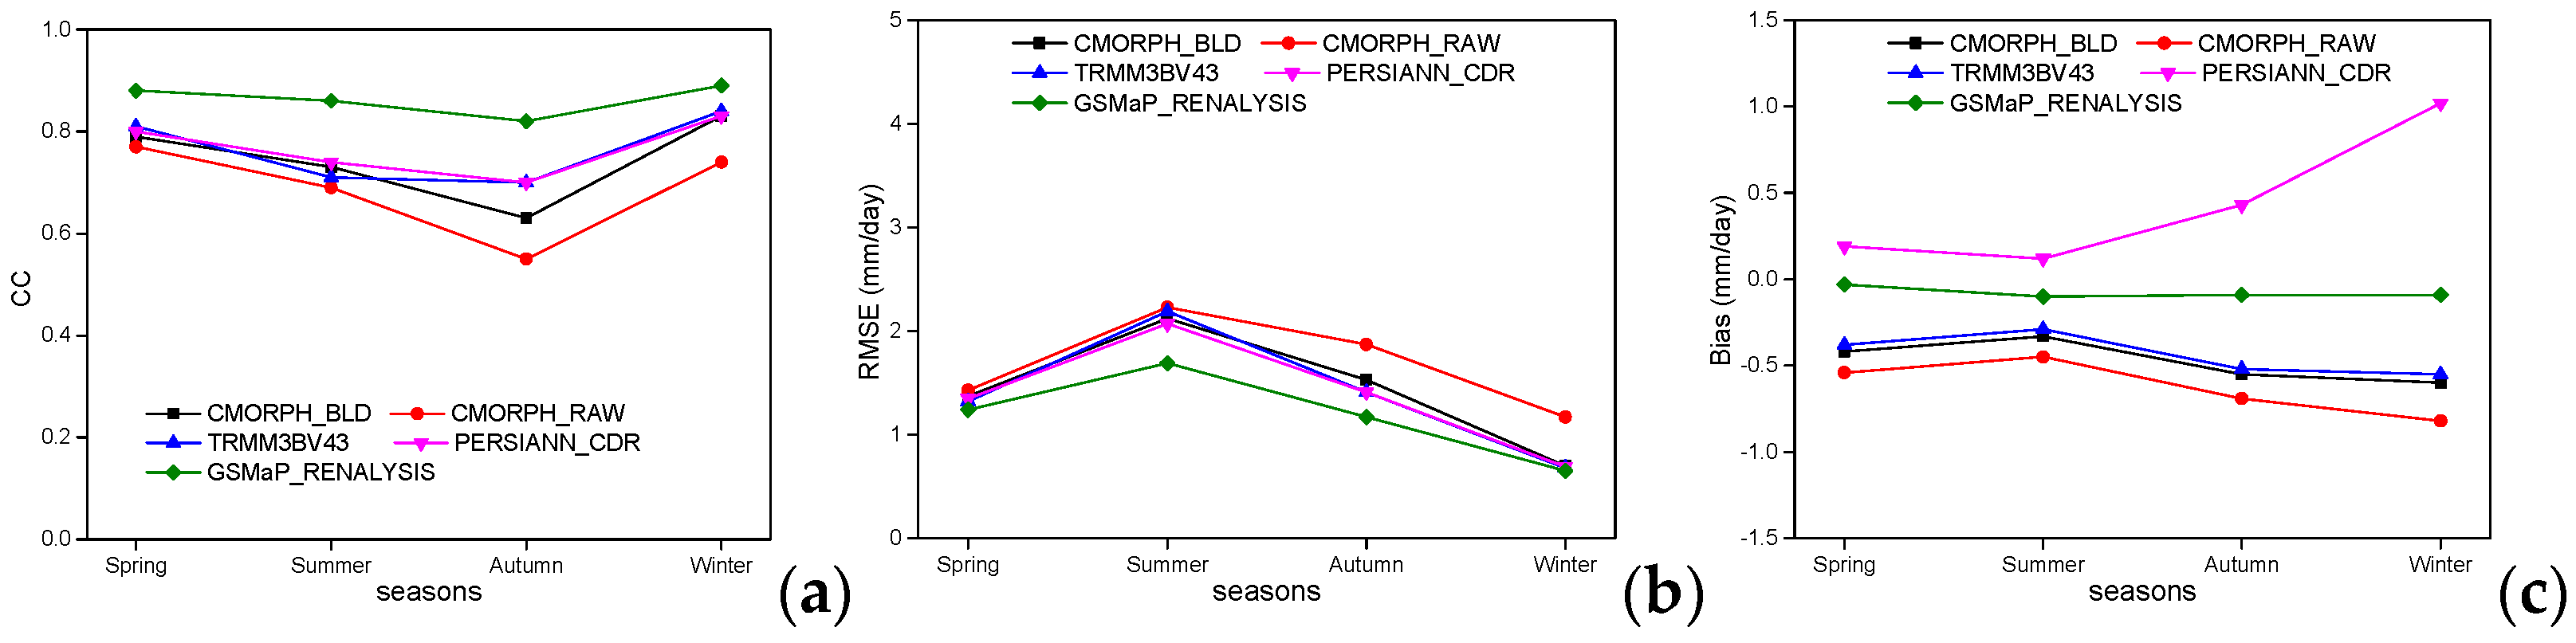
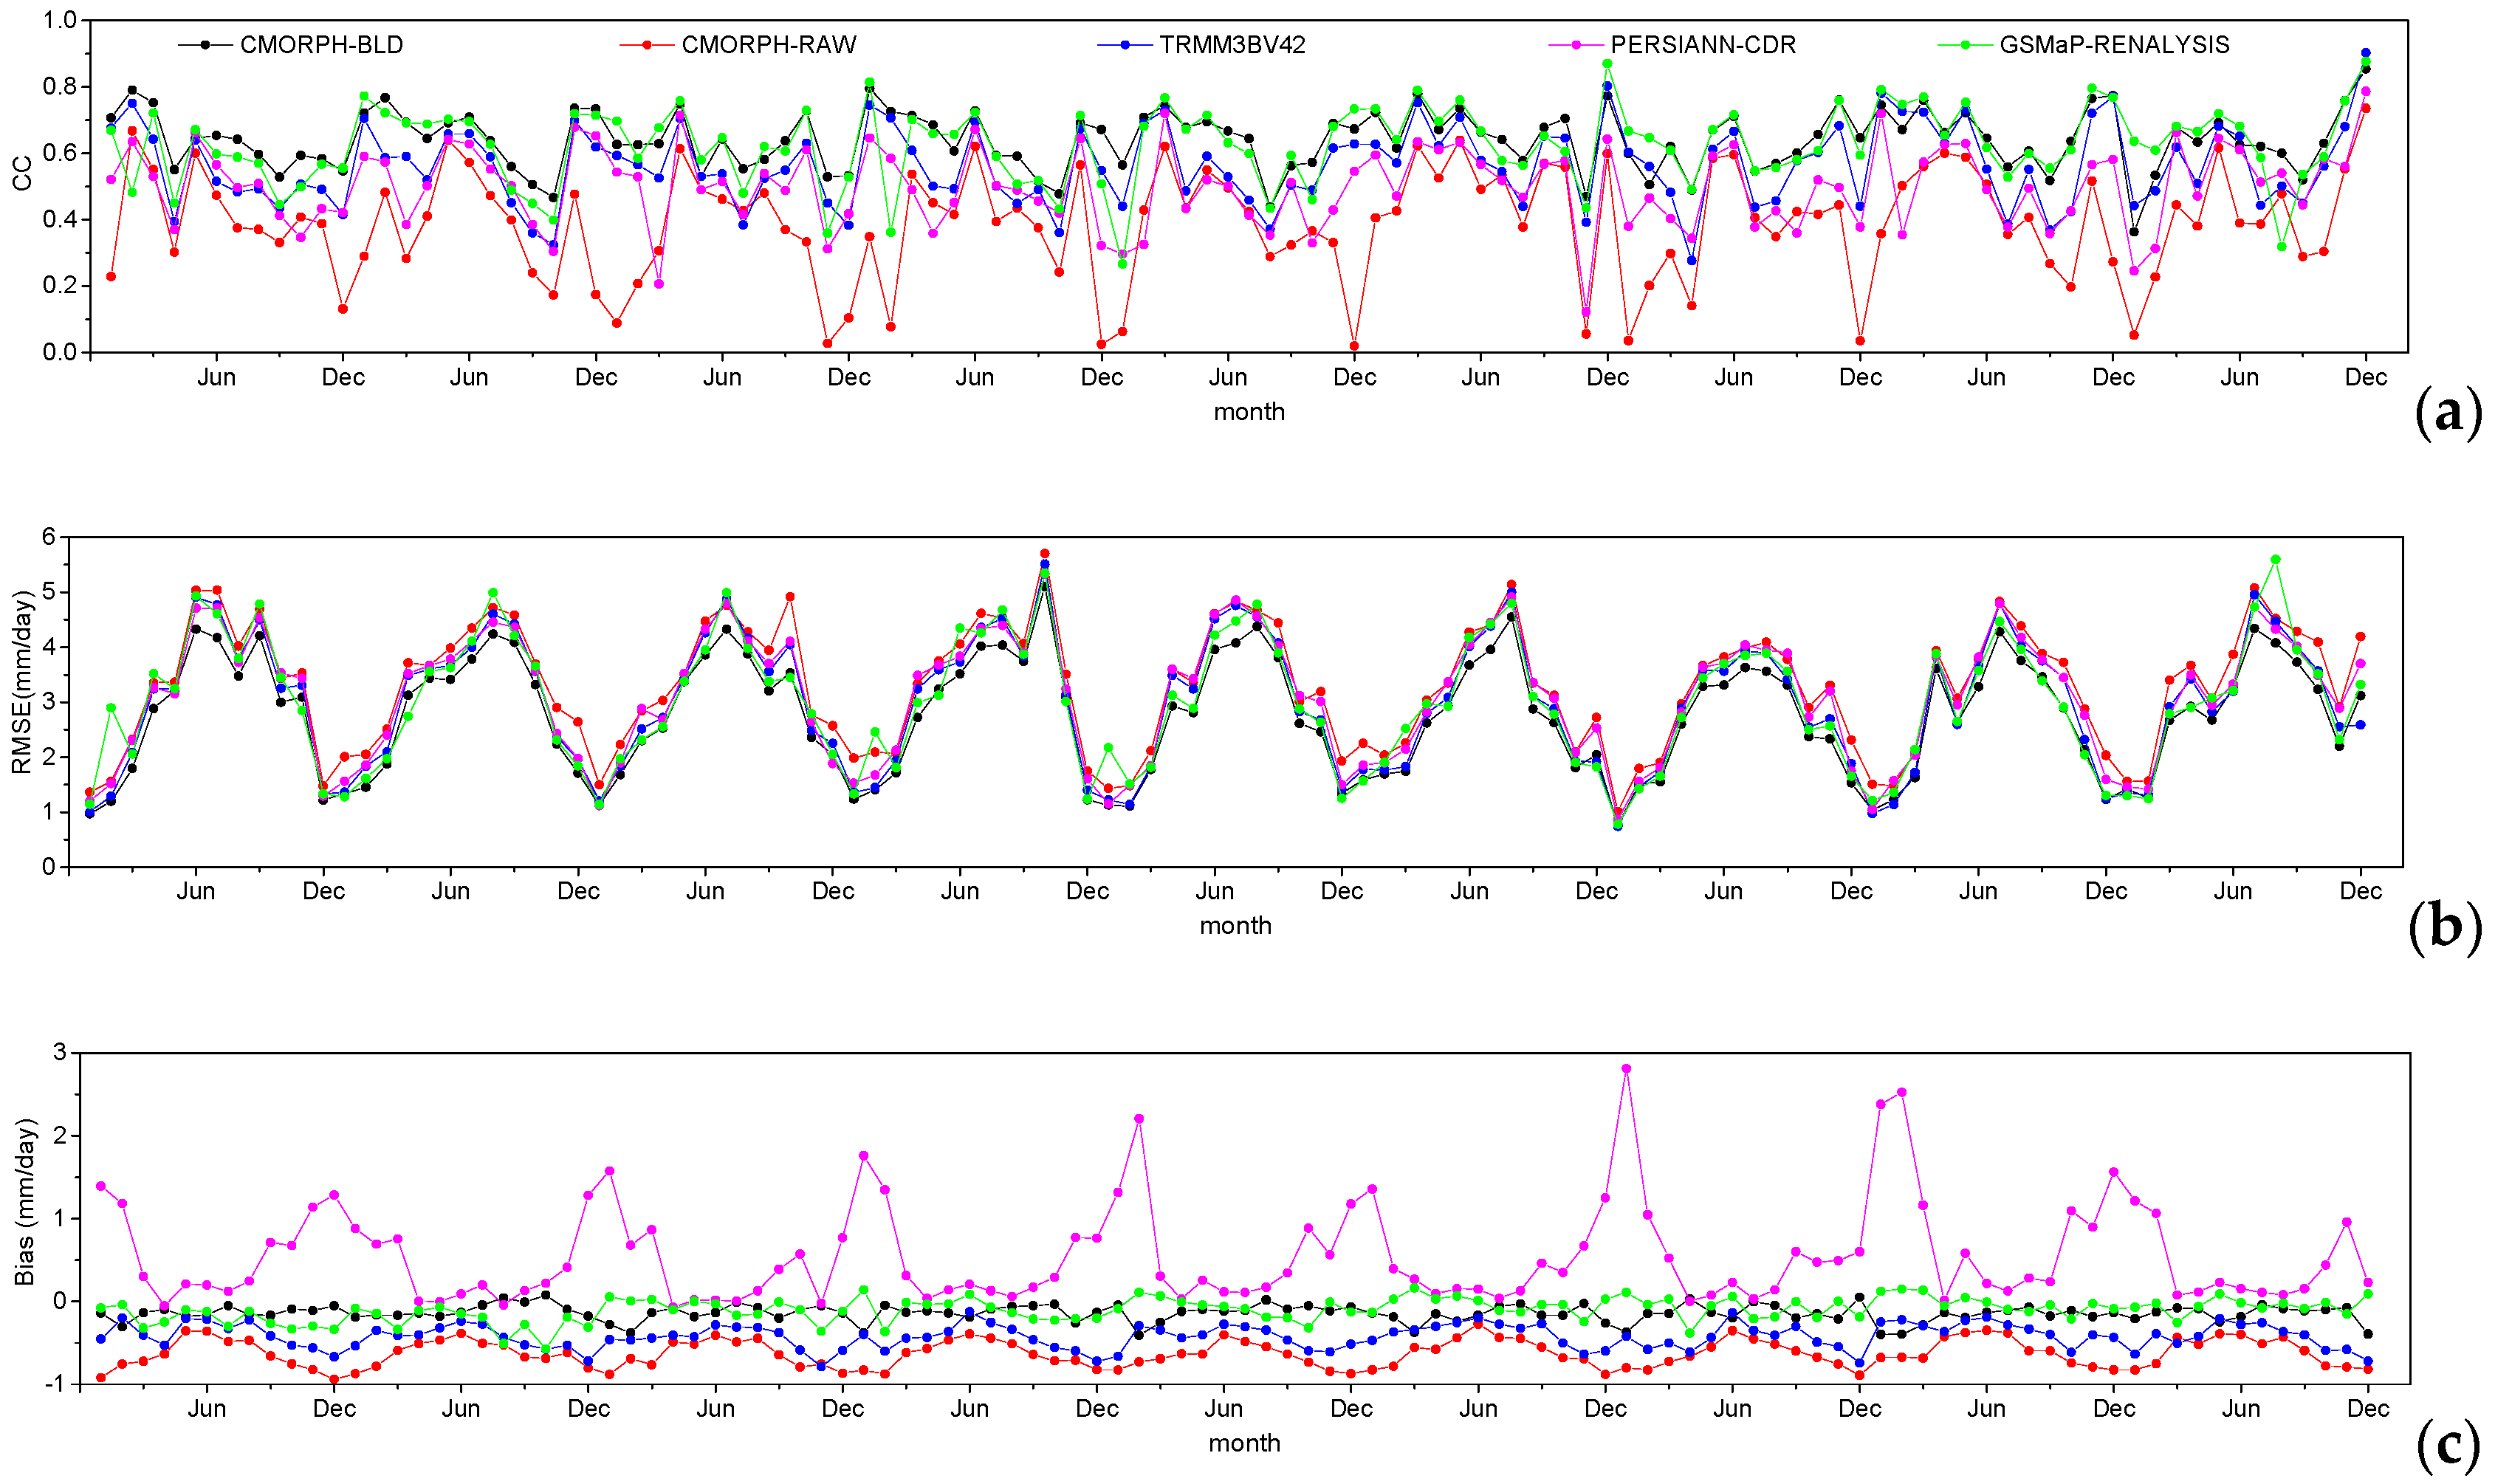
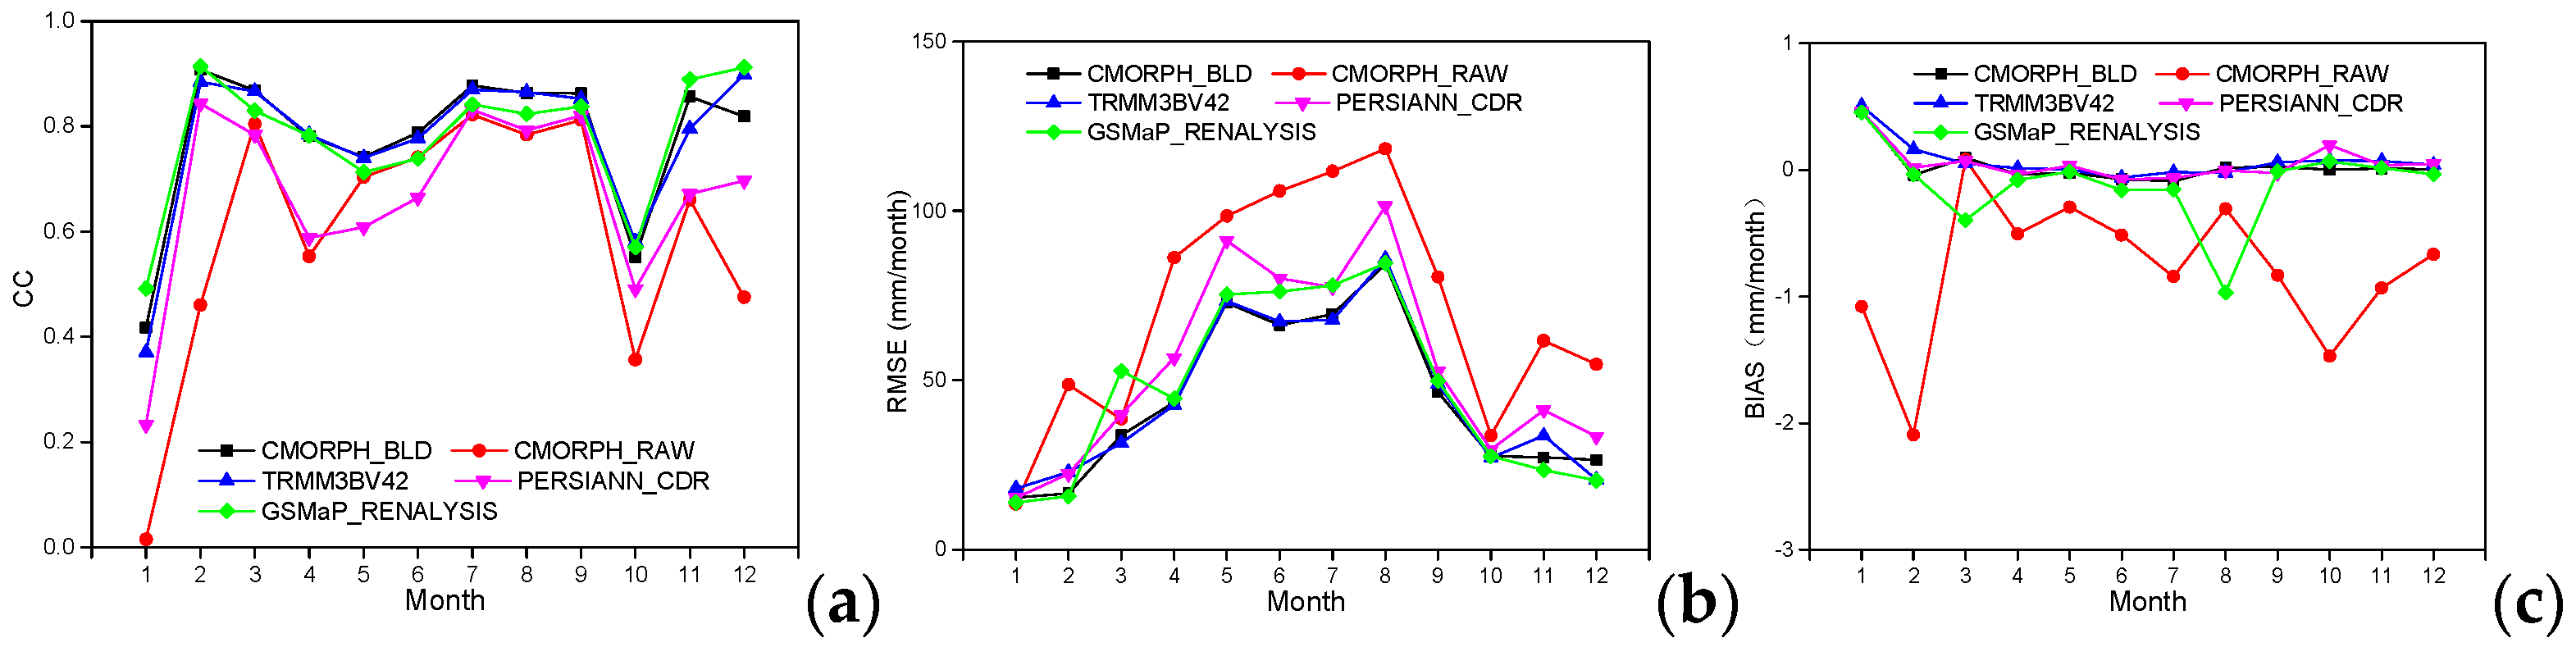
For the seasonal daily mean precipitation, the maximum precipitation is more than 15 mm/day in summer and about 5 mm/day in winter. Five satellite products show the best capability with the highest CC (~0.8) and the smallest RMSE (~1 mm/day) but relatively the biggest BIAS in winter. In summer, all products give the smallest BIAS but the biggest RMSE (~2 mm/day) and high CC. GSMaP_RENALYSIS remains CC more than 0.8 and BIAS less than 0.2, as well as low RMSE (<2 mm/day). For the monthly daily mean precipitation, CMORPH_RAW gives the lowest CC (<0.2) in December and January and PERSIANN_CDR exhibits the biggest BIAS in January.
(3)
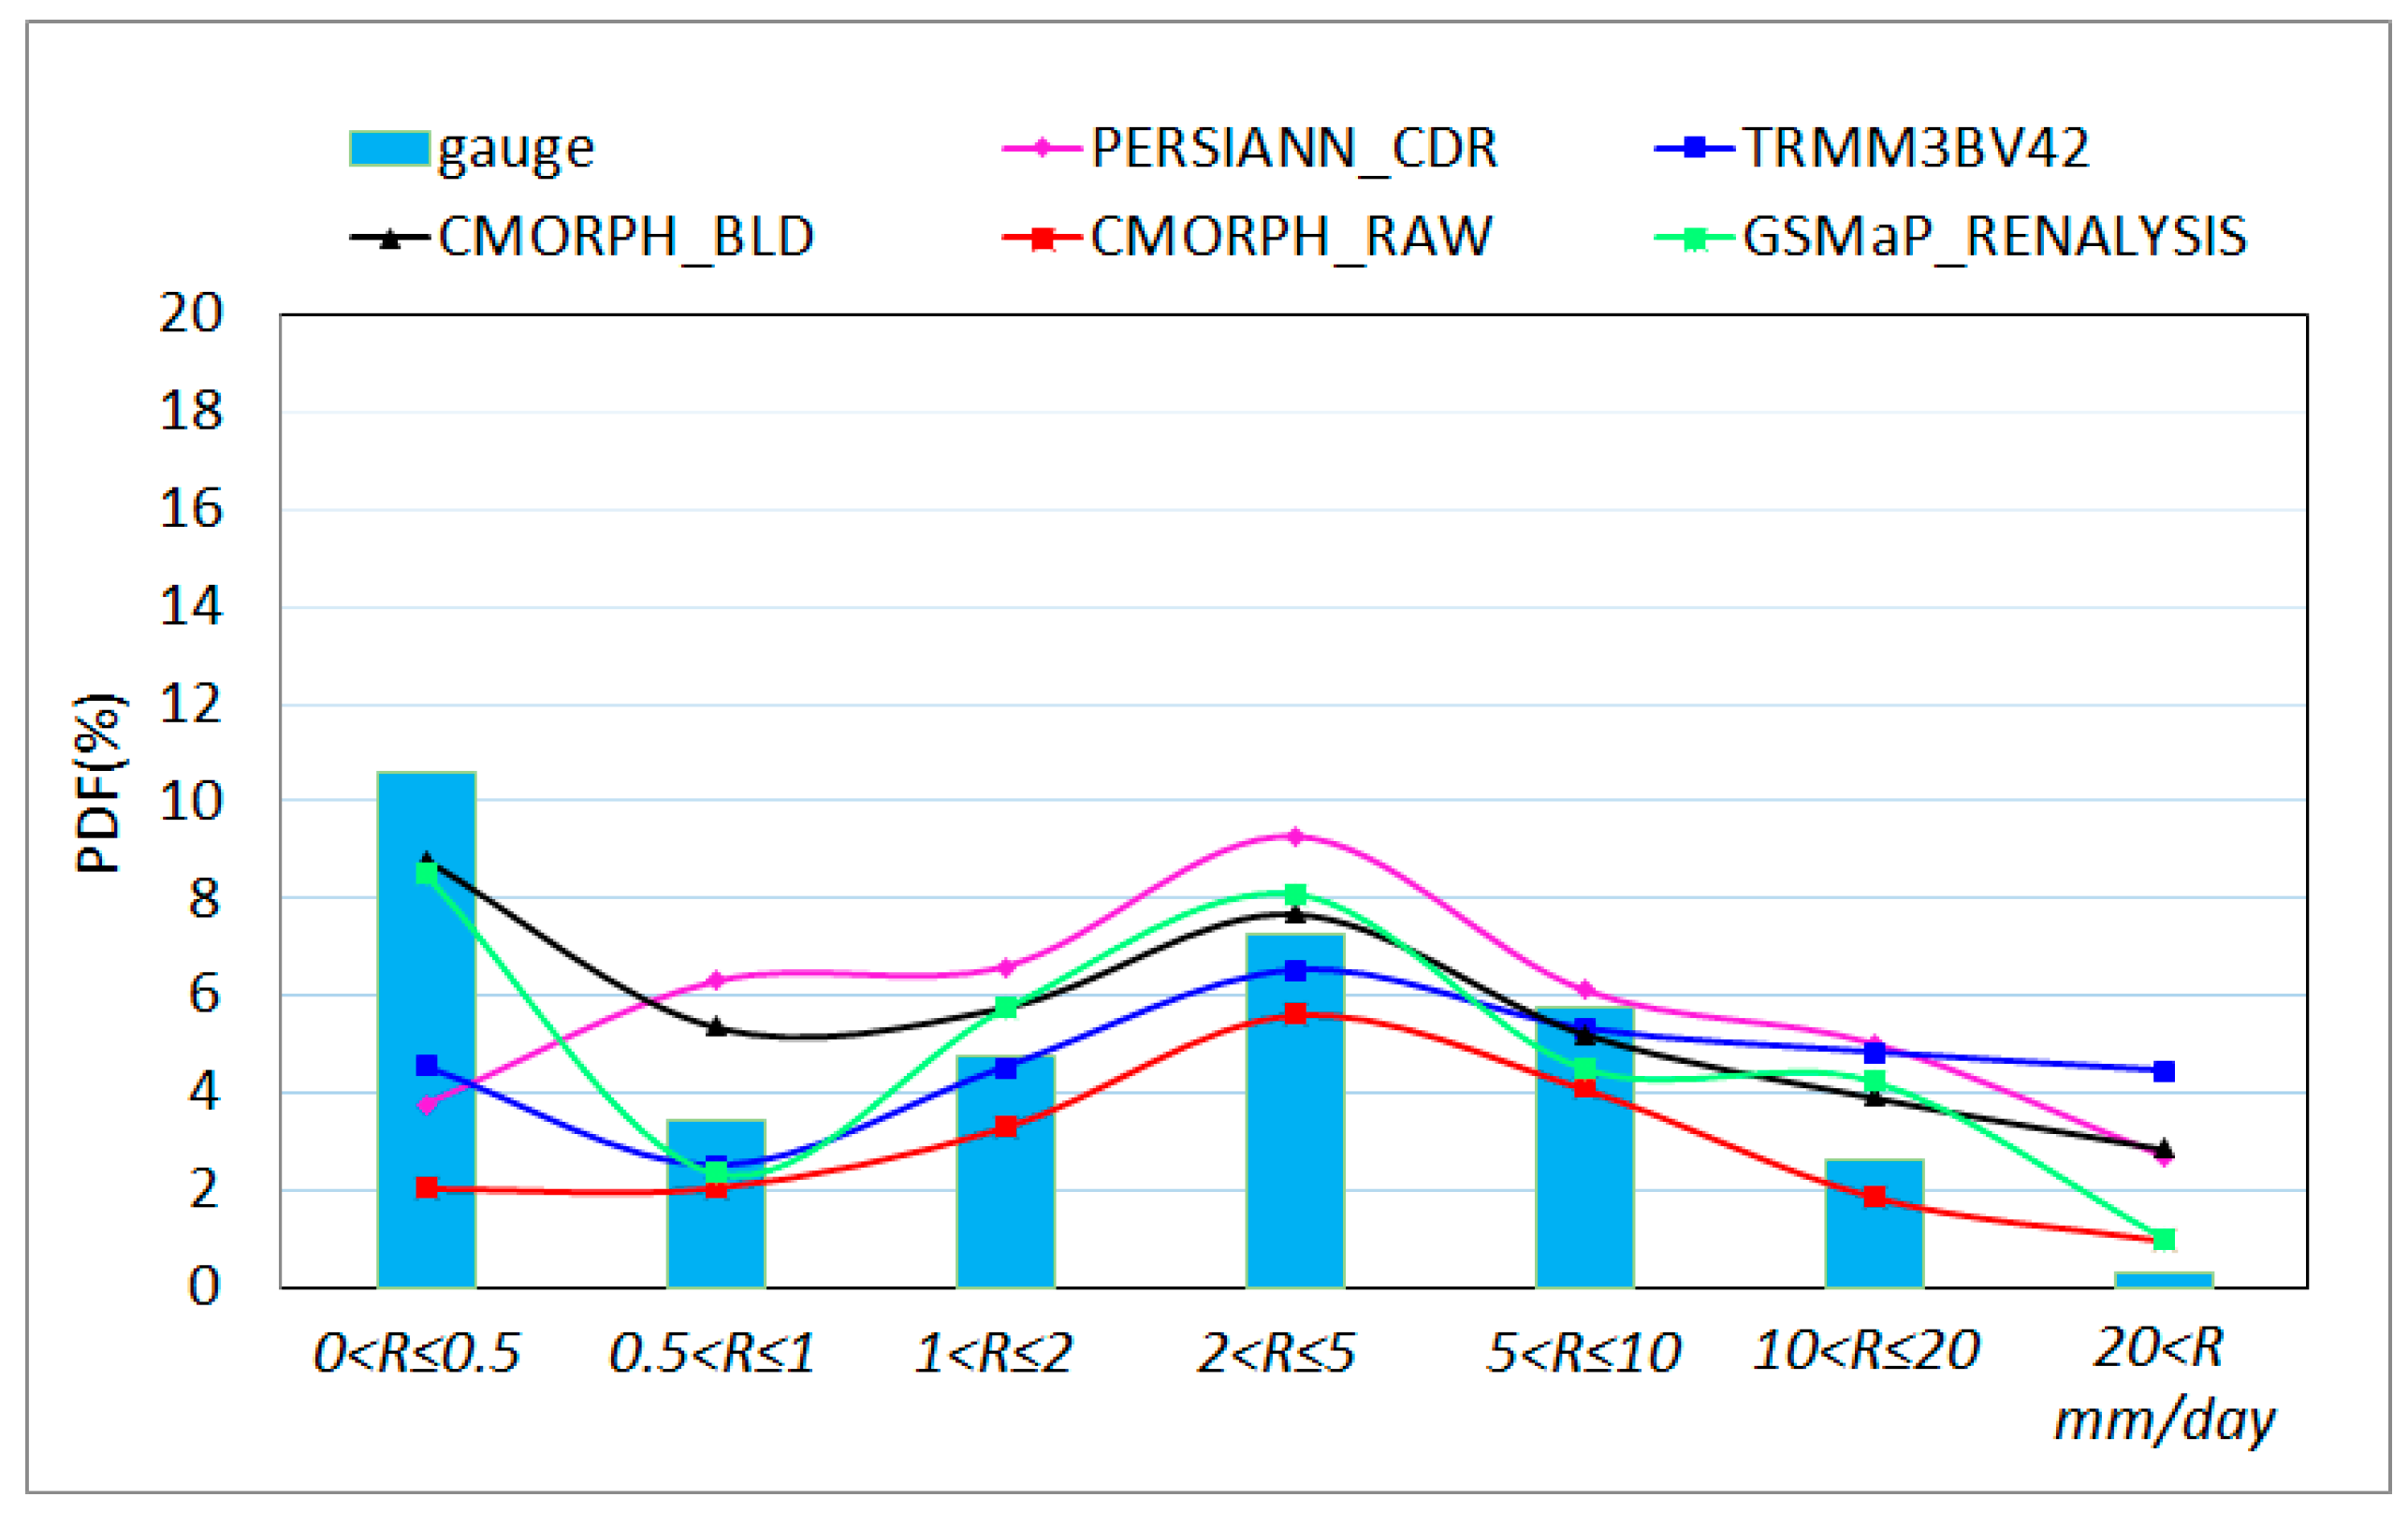
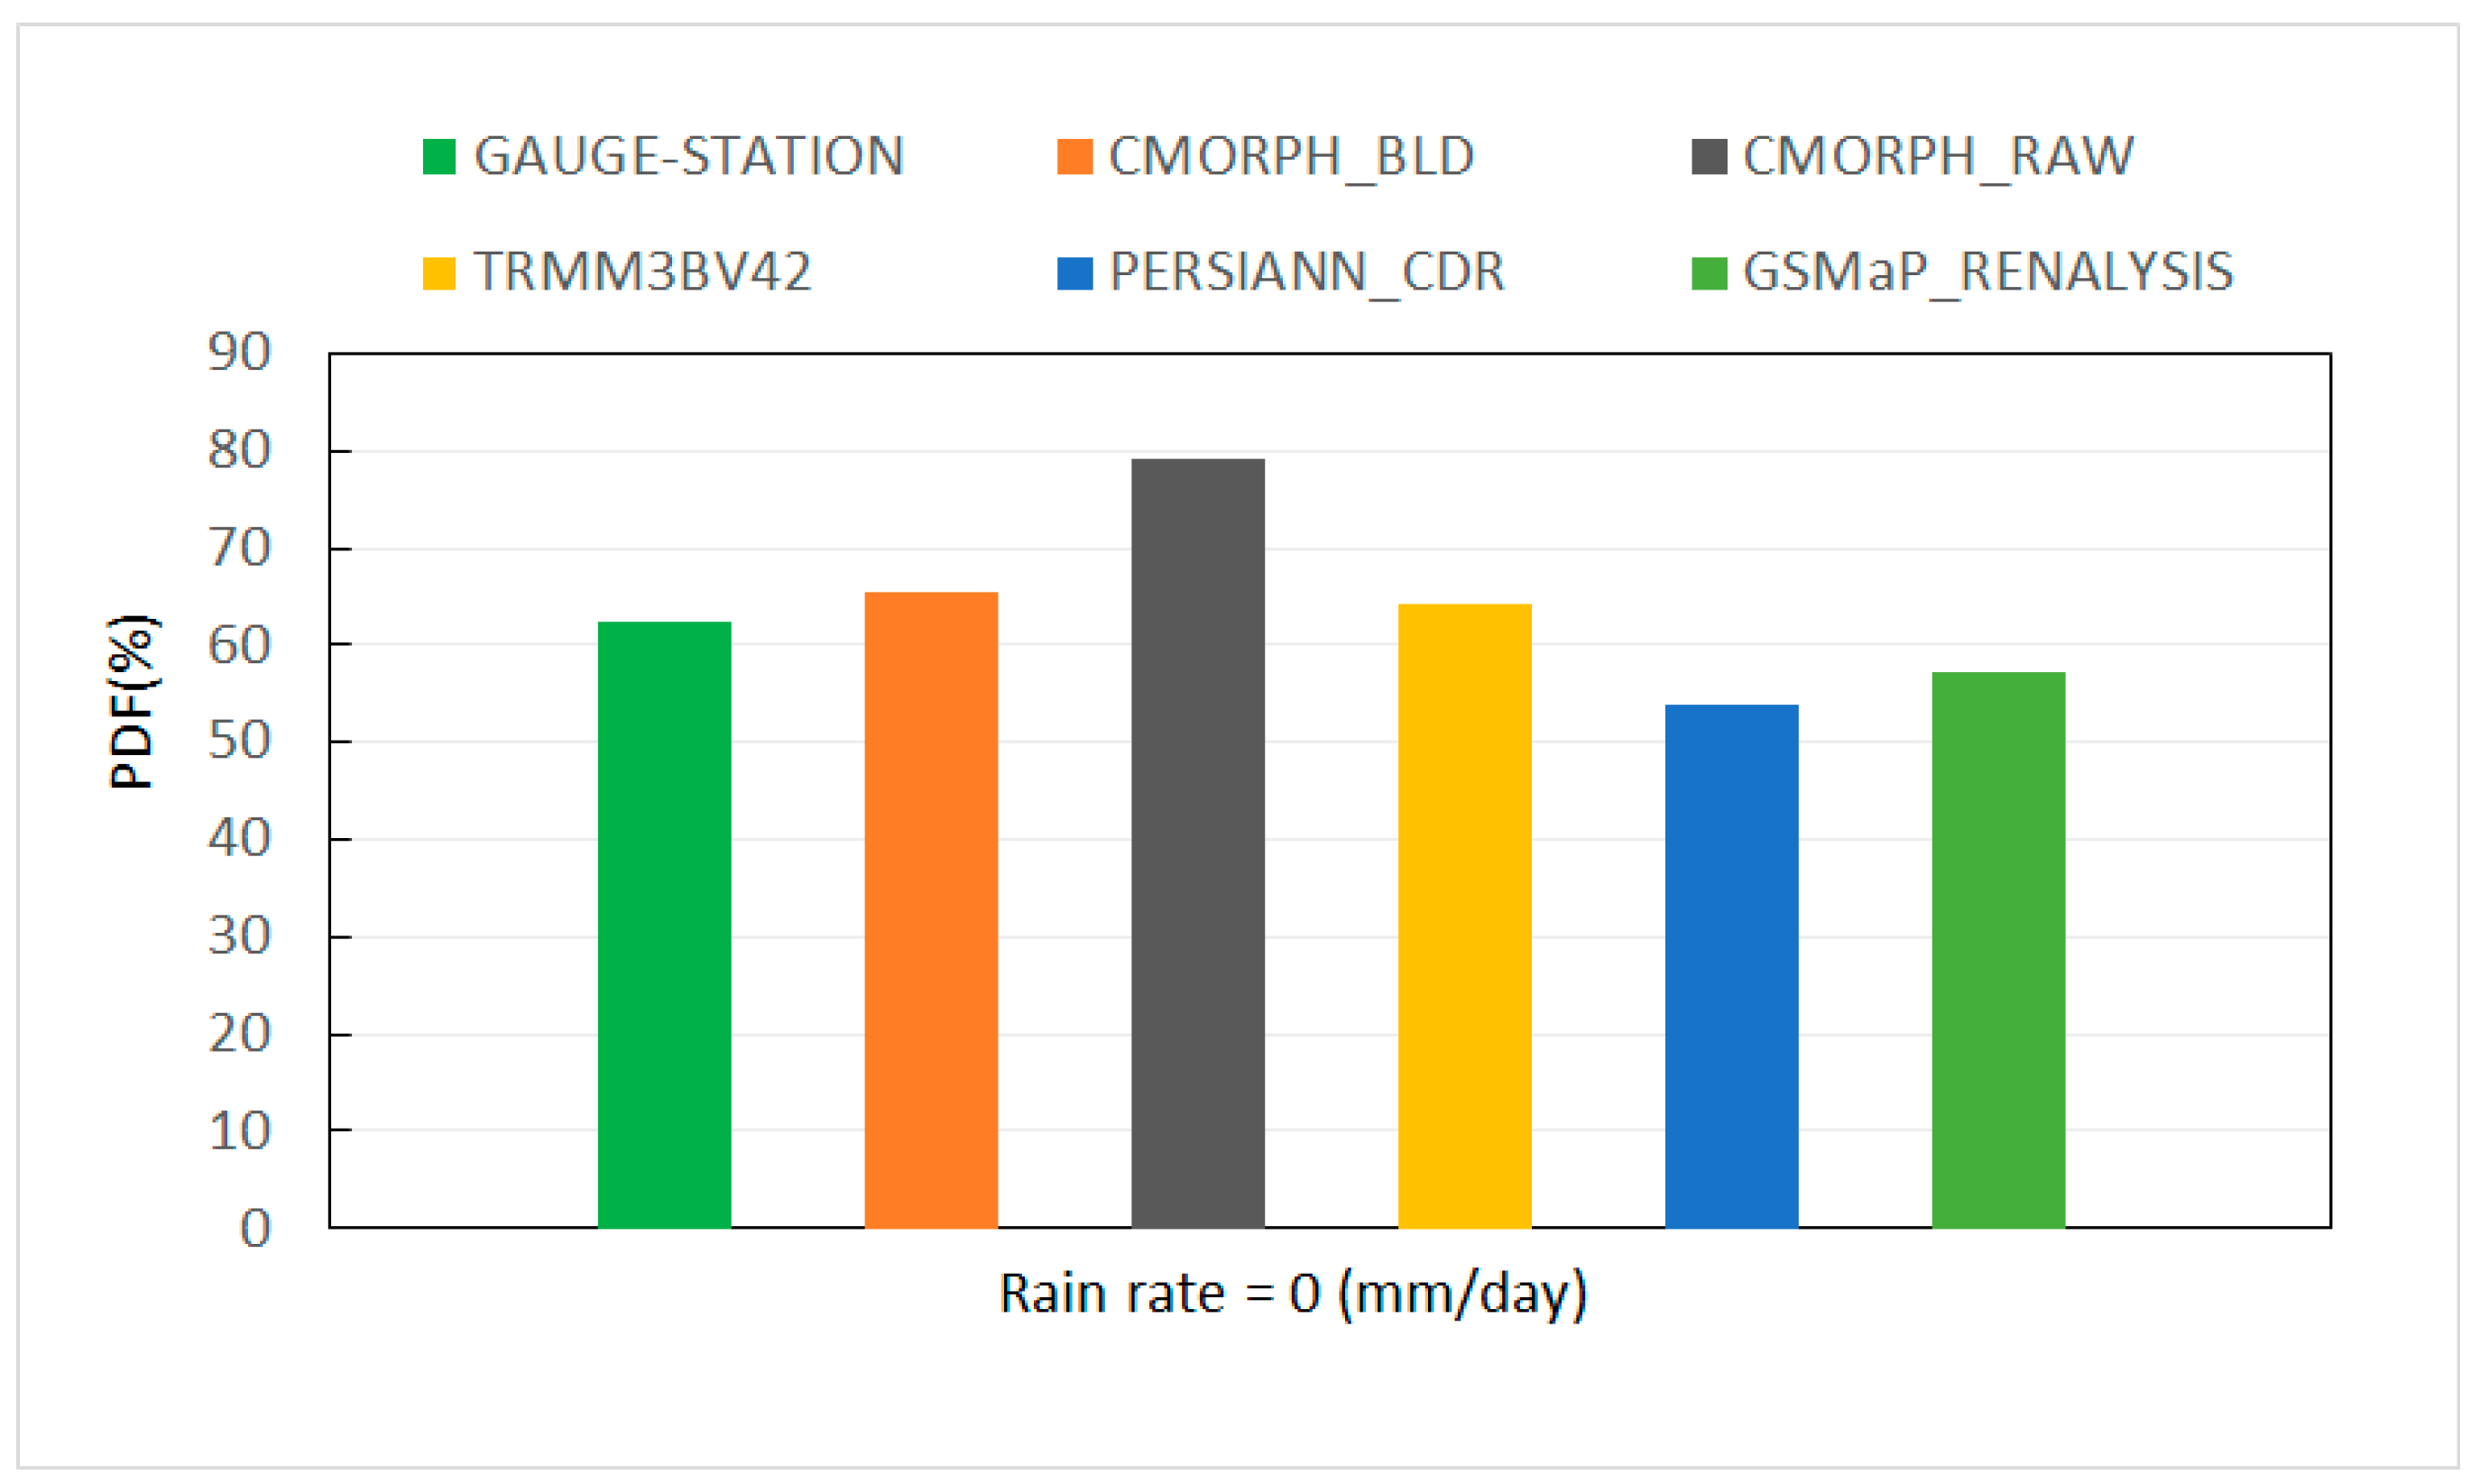
The PDFs reveal that CMORPH_RAW, CMORPH_BLD and TRMM3BV42 detected more no-rainfall events than other products (79%, 65.4% and 64.3%, respectively) and GSMaP_RENALYSIS is consistent with gauge stations. All the precipitation products detected heavier rainfall events than the rain gauge stations measured. According to the statistical parameters of the rainfall events (e.g., FBI, POD, CSI and FAR), TRMM3B42V exhibits the relative perfect performance with FBI but the low POD and high FAR. CMORPH_BLD gives the higher POD but relative high FBI and FAR. GSMaP_RENALYSIS outperforms other products with the highest POD and CSI and lowest FAR.
(4)
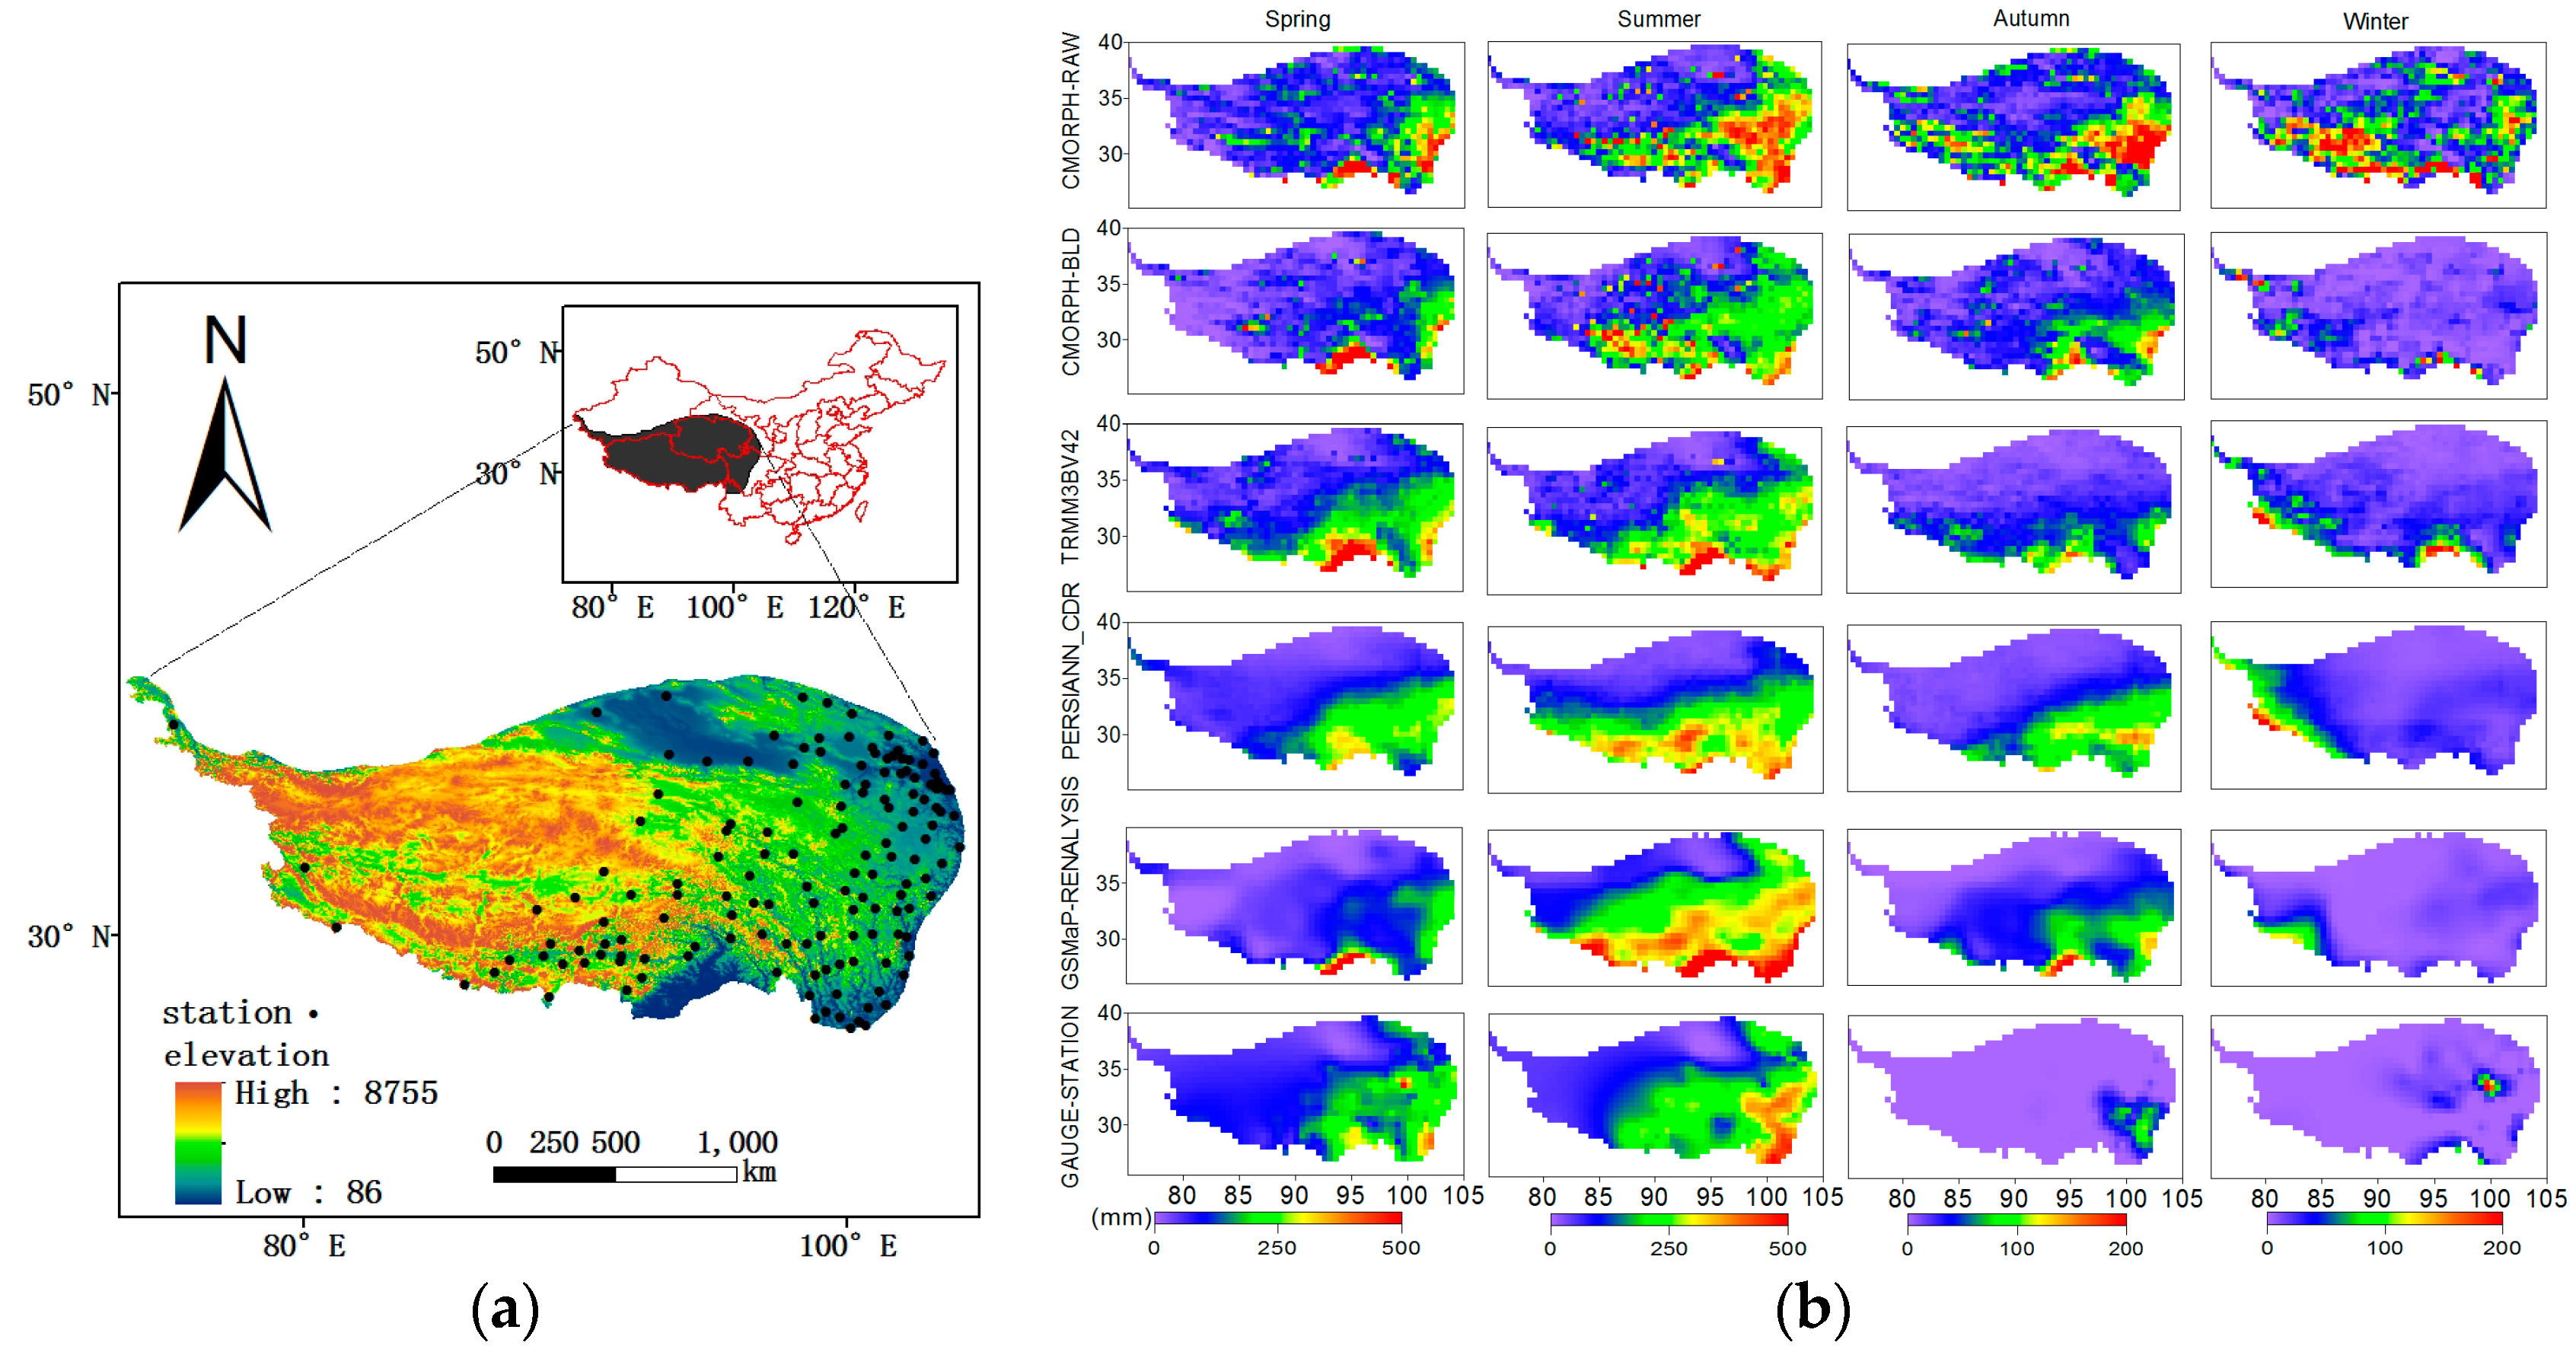
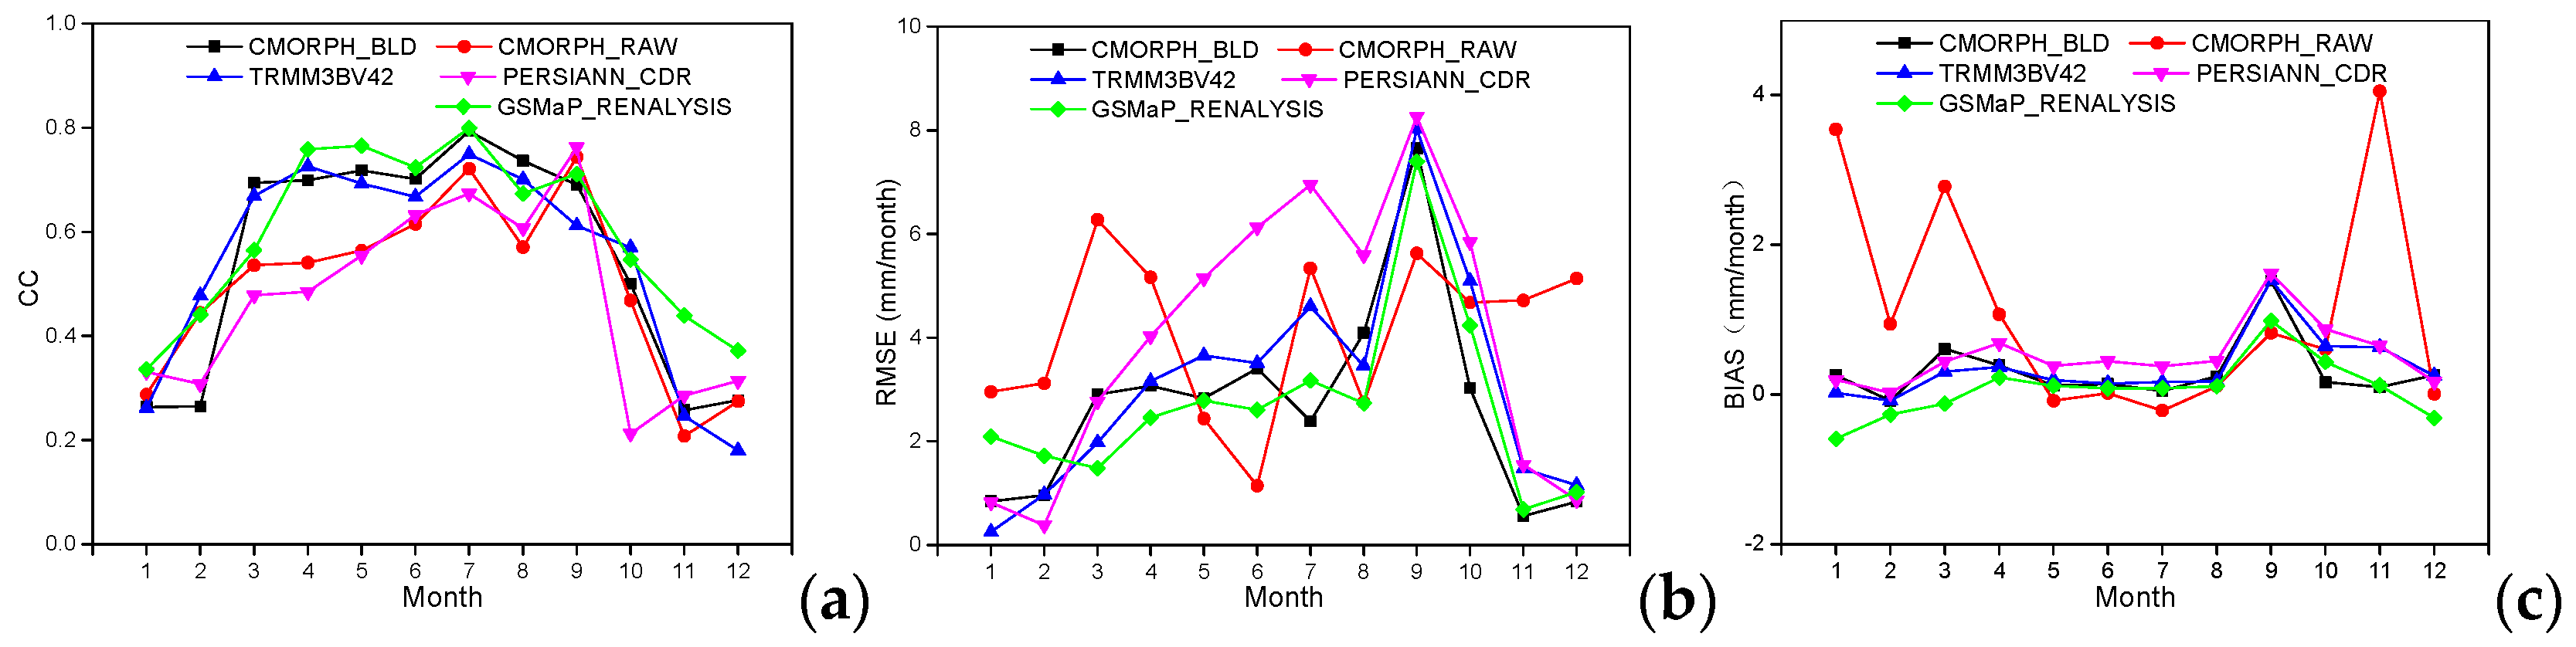
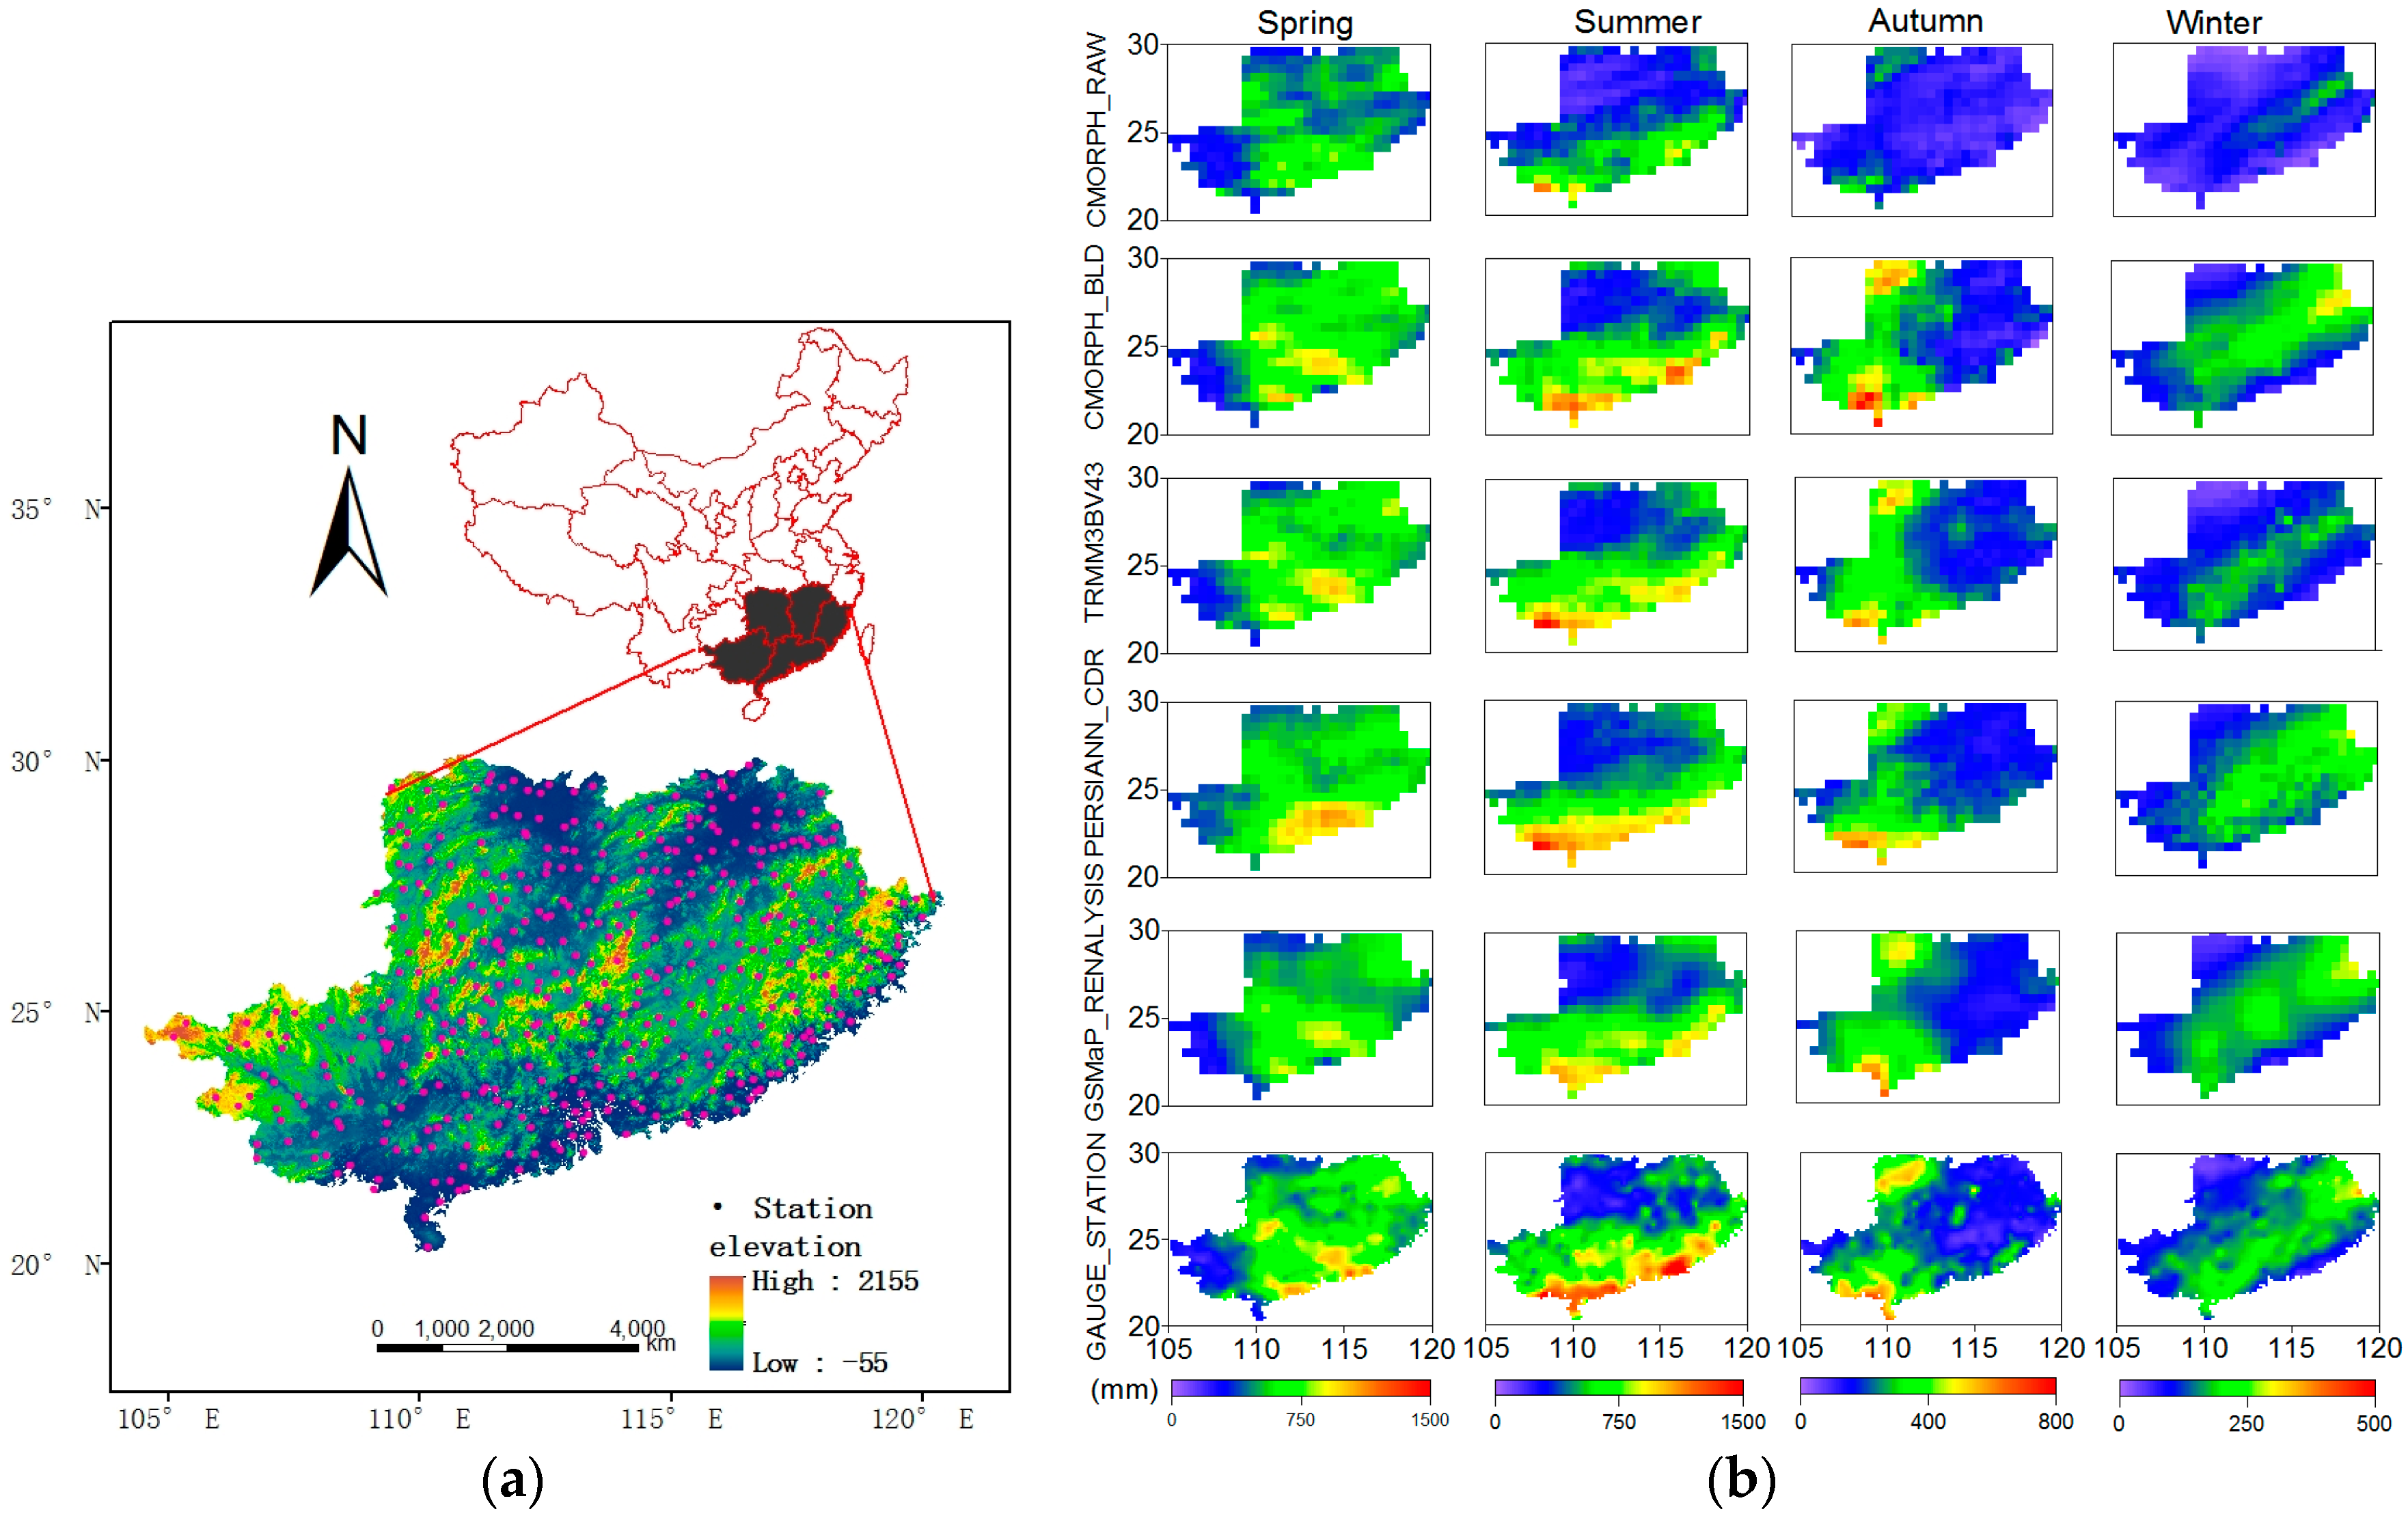
We analyzed two typical regions (the Tibetan Plateau and South China) in 2013. Over Tibetan Plateau, all products show the highest CC (~0.7) and low BIAS (±0.5 mm/month) and relative low RMSE (~3 mm/month) in July. The lowest CC (<0.3) and biggest RMSE were calculated in December and September, respectively. GSMaP_RENALYSIS exhibits the best consistency with gauge stations. Over south China, the maximum total monthly precipitation is more than 1500 mm/month. All products (except PERSIANN_CDR) give the highest CC (>0.8) and smallest BIAS in February. According to the precipitation distribution and the calculated statistical correlations, the CMORPH_BLD product outperforms other products with reference to the in situ measurements.
(5)
The gauge-corrected products outperform the CMORPH_RAW. CMORPH_BLD compared with CMORPH_RAW performs better with increase in CC (from 0.73 to 0.80) and the reduction of RMSE (from 2.79 mm/day to 2.14 mm/day) in nine-year mean daily precipitation. The CC of CMORPH_BLD is from 0.70 to 0.82 during 2005–2013, while the CC of CMORPH_RAW is from 0.36 to 0.71.
This paper analyzed the CMORPH_BLD, CMORPH_RAW, TRMM3BV42, PERSIANN_CDR and GSMaP_RENALYSIS precipitation products over China. The results are useful for selecting suitable satellite precipitation products for users with a variety of research interests. Because the differences in the algorithms may lead to varying degrees of error, it is necessary to adapt the method of retrieving precipitation information. This study evaluated only the study area of the Tibetan Plateau and southern China, so further precipitation research focusing on different terrains, such as high altitudes, basins and southern rainy areas, is necessary. These studies are useful for researching on atmospheric compositions and other fields and can help to improve GPM algorithms and comparisons.

Acknowledgments

This study was supported by the National Key Research and Development Program of China (Grant No. 2016YFC0200404), the National Natural Science Foundation of China (Grant No. 41571347), the Open Foundation of Chongqing Meteorology (KFJJ201402) and the Education Department Innovation team in Sichuan (16TD0024). The authors are grateful to China Meteorological Data Sharing Service System (http://data.cma.cn/), NASA (https://pmm.nasa.gov/), Japan Aerospace Exploration Agency (http://sharaku.eorc.jaxa.jp/), Shuttle Radar Topographic Mission (SRTM on http://srtm.csi.cgiar.org/) and NOAA (https://rda.ucar.edu/) scientific team for the provision of satellite data and situ measurement data utilized in this study. The authors acknowledge the China Meteorological Service Network and European Center, which made gauge station and satellite data available to us.

Author Contributions

Qiaolin Zeng proposed the method, collected data and wrote this paper; Yongqian Wang and Liangfu Chen conceived of the experiment and revised the paper; Zifeng Wang, Hao Zhu and Bin Li provided technical guidance and analyzed the data.

Conflicts of Interest

The authors declare no conflict of interest.

References

  1. Immerzeel, W.W.; Rutten, M.M.; Droogers, P. Spatial downscaling of trmm precipitation using vegetative response on the Iberian Peninsula. Remote Sens. Environ. 2009, 113, 362–370. [Google Scholar] [CrossRef]
  2. Maddox, R.A.; Zhang, J.; Gourley, J.J.; Howard, K.W. Weather radar coverage over the contiguous united states. Weather Forecast. 2001, 17, 927–934. [Google Scholar] [CrossRef]
  3. Tang, L.; Hossain, F. Investigating the similarity of satellite rainfall error metrics as a function of köppen climate classification. Atmos. Res. 2012, 104–105, 182–192. [Google Scholar] [CrossRef]
  4. Barrett, E.C.; Martin, D.W. Use of Satellite Data in Rainfall Monitoring; Academic Press: Cambridge, MA, USA, 1981. [Google Scholar]
  5. Kidd, C.; Levizanni, V. Status of satellite precipitation retrievals. In Proceedings of the Earth Observation and Water Cycle Science, Frascati, Italy, 18–20 November 2009. [Google Scholar]
  6. Levizzani, V.; Schmetz, J.; Lutz, H.J.; Kerkmann, J.; Alberoni, P.P.; Cervino, M. Precipitation estimations from geostationary orbit and prospects for meteosat second generation. Meteorol. Appl. 2001, 8, 23–41. [Google Scholar] [CrossRef]
  7. Atlas, D.; Thiele, O.W. Precipitation Measurements from Space: Workshop Report. An Element of the Climate Observing System Study; NASA Tech. Memo. NASA-TM-85329431; NASA Goddard Space Flight Center: Greenbelt, MD, USA, 1981.
  8. Behrangi, A.; Hsu, K.L.; Imam, B.; Sorooshian, S.; Kuligowski, R.J. Evaluating the utility of multispectral information in delineating the areal extent of precipitation. J. Hydrometeorol. 2009, 10, 684–700. [Google Scholar] [CrossRef]
  9. Kühnlein, M.; Appelhans, T.; Thies, B.; Nauss, T. Improving the accuracy of rainfall rates from optical satellite sensors with machine learning—A random forests-based approach applied to msg seviri. Remote Sens. Environ. 2014, 141, 129–143. [Google Scholar] [CrossRef]
  10. Stenz, R.; Dong, X.; Xi, B.; Feng, Z.; Kuligowski, R.J. Improving satellite quantitative precipitation estimation using goes-retrieved cloud optical depth. J. Hydrometeorol. 2015, 17. [Google Scholar] [CrossRef]
  11. Joyce, R.J.; Janowiak, J.E.; Arkin, P.A.; Xie, P. Cmorph: A method that produces global precipitation estimates from passive microwave and infrared data at high spatial and temporal resolution. J. Hydrometeorol. 2003, 5, 287–296. [Google Scholar] [CrossRef]
  12. Kidd, C.; Kniveton, D.R.; Todd, M.C.; Bellerby, T.J. Satellite rainfall estimation using combined passive microwave and infrared algorithms. J. Hydrometeorol. 2003, 4, 1088. [Google Scholar] [CrossRef]
  13. Wilheit, T.T.; Chang, A.T.C.; Rao, M.S.V.; Rodgers, E.B.; Theon, J.S. A satellite technique for quantitatively mapping rainfall rates over the oceans. J. Appl. Meteorol. 1977, 16. [Google Scholar] [CrossRef]
  14. Wilheit, T.; Kummerow, C.D.; Ferraro, R. Nasdarainfall algorithms for amsr-e. IEEE Trans. Geosci. Remote Sens. 2003, 41, 204–214. [Google Scholar] [CrossRef]
  15. Stephens, G.L.; Vane, D.G.; Tanelli, S.; Im, E.; Durden, S.; Rokey, M.; Reinke, D.; Partain, P.; Mace, G.G.; Austin, R. Cloudsat mission: Performance and early science after the first year of operation. J. Geophys. Res. Atmos. 2008, 113, 2036–2044. [Google Scholar] [CrossRef]
  16. Kalinga, O.A.; Gan, T.Y. Estimation of rainfall from infrared-microwave satellite data for basin-scale hydrologic modelling. Hydrol. Process. 2010, 24, 2068–2086. [Google Scholar] [CrossRef]
  17. Pan, M.; Li, H.; Wood, E. Assessing the skill of satellite-based precipitation estimates in hydrologic applications. Water Resour. Res. 2010, 46, 201–210. [Google Scholar] [CrossRef]
  18. Boushaki, F.I.; Hsu, K.L.; Sorooshian, S.; Park, G.H.; Mahani, S.; Shi, W. Bias adjustment of satellite precipitation estimation using ground-based measurement: A case study evaluation over the southwestern united states. J. Hydrometeorol. 2008, 10, 1231–1242. [Google Scholar] [CrossRef]
  19. Hirpa, F.A.; Gebremichael, M.; Hopson, T. Evaluation of high-resolution satellite precipitation products over very complex terrain in Ethiopia. J. Appl. Meteorol. Climatol. 2010, 49, 1044–1051. [Google Scholar] [CrossRef]
  20. Guo, H.; Chen, S.; Bao, A.; Hu, J.; Gebregiorgis, A.; Xue, X.; Zhang, X. Inter-comparison of high-resolution satellite precipitation products over central Asia. Remote Sens. 2015, 7, 7181–7211. [Google Scholar] [CrossRef]
  21. Awange, J.L.; Ferreira, V.G.; Forootan, E.; Andam-Akorful, S.A.; Agutu, N.O.; He, X.F. Uncertainties in remotely sensed precipitation data over Africa. Int. J. Climatol. 2016, 36, 303–323. [Google Scholar] [CrossRef]
  22. Huffman, G.J.; Adler, R.F.; Bolvin, D.T.; Gu, G.; Nelkin, E.J.; Bowman, K.P.; Hong, Y.; Stocker, E.F.; Wolff, D.B. The TRMM Multisatellite Precipitation Analysis (TMPA): Quasi-Global, Multiyear, Combined-Sensor Precipitation Estimates at Fine Scales. J. Hydrometeorol. 2007, 8, 38–55. [Google Scholar] [CrossRef]
  23. Joyce, R.; Janowiak, J.; Huffman, G. Latitudinally and seasonally dependent zenith-angle corrections for geostationary satellite ir brightness temperatures. J. Appl. Meteorol. 2001, 40, 689–703. [Google Scholar] [CrossRef]
  24. Xie, P.; Joyce, R.; Wu, S.; Yoo, S.H.; Yarosh, Y.; Sun, F.; Lin, R. Reprocessed, bias-corrected cmorph global high-resolution precipitation estimates from 1998. J. Hydrometeorol. 2017, 18. [Google Scholar] [CrossRef]
  25. Sorooshian, S.; Hsu, K.L.; Gao, X.; Gupta, H.V.; Imam, B.; Dan, B. Evaluation of PERSIANN system satellite–based estimates of tropical rainfall. Bull. Am. Meteorol. Soc. 2000, 81, 2035–2046. [Google Scholar] [CrossRef]
  26. Hsu, K.; Gao, X.; Sorooshian, S.; Gupta, H.V. Precipitation estimation from remotely sensed information using artificial neural networks. J. Appl. Meteorol. 2004, 36, 1176–1190. [Google Scholar] [CrossRef]
  27. Ashouri, H.; Hsu, K.L.; Sorooshian, S.; Braithwaite, D.K.; Knapp, K.R.; Cecil, L.D.; Nelson, B.R.; Prat, O.P. Persiann-cdr: Daily precipitation climate data record from multisatellite observations for hydrological and climate studies. Bull. Am. Meteorol. Soc. 2014, 96, 197–210. [Google Scholar] [CrossRef]
  28. Okamoto, K.I.; Ushio, T.; Iguchi, T.; Takahashi, N.; Iwanami, K. The global satellite mapping of precipitation (gsmap) project. In Proceedings of the 2005 IEEE International Geoscience and Remote Sensing Symposium—2005. IGARSS ’05, Seoul, Korea, 29–29 July 2005; pp. 3414–3416. [Google Scholar]
  29. Kubota, T.; Shige, S.; Hashizume, H.; Aonashi, K.; Takahashi, N.; Seto, S.; Takayabu, Y.N.; Ushio, T.; Nakagawa, K.; Iwanami, K. Global precipitation map using satellite-borne microwave radiometers by the gsmap project: Production and validation. IEEE Trans. Geosci. Remote Sens. 2007, 45, 2259–2275. [Google Scholar] [CrossRef]
  30. Mega, T.; Ushio, T.; Kubota, T.; Kachi, M.; Aonashi, K.; Shige, S. Gauge adjusted global satellite mapping of precipitation (gsmap_gauge). In Proceedings of the 2014 XXXIth URSI General Assembly and Scientific Symposium (URSI GASS), Beijing, China, 16–23 August 2014; pp. 1–4. [Google Scholar]
  31. Vila, D.A.; Goncalves, L.G.G.D.; Toll, D.L.; Rozante, J.R. Statistical evaluation of combined daily gauge observations and rainfall satellite estimates over continental south America. J. Hydrometeorol. 2009, 10, 533–543. [Google Scholar] [CrossRef]
  32. Wilks, D.S. Statistical Methods in the Atmospheric Sciences; Elsevier: San Diego, CA, USA, 2011. [Google Scholar]
  33. Condom, T.; Rau, P.; Espinoza, J.C. Correction of trmm 3b43 monthly precipitation data over the mountainous areas of Peru during the period 1998–2007. Hydrol. Process. 2011, 25, 1924–1933. [Google Scholar] [CrossRef]
  34. Brown, J.E.M. An analysis of the performance of hybrid infrared and microwave satellite precipitation algorithms over India and adjacent regions. Remote Sens. Environ. 2006, 101, 63–81. [Google Scholar] [CrossRef]
  35. Su, F.; Gao, H.; Huffman, G.J.; Lettenmaier, D.P. Potential utility of the real-time tmpa-rt precipitation estimates in streamflow prediction. J. Hydrometeorol. 2011, 12, 444–455. [Google Scholar] [CrossRef]
  36. Chen, S.; Hong, Y.; Cao, Q.; Tian, Y.; Hu, J.; Zhang, X.; Li, W.; Carr, N.; Shen, X.; Qiao, L. Intercomparison of precipitation estimates from wsr-88d radar and trmm measurement over continental united states. IEEE Trans. Geosci. Remote Sens. 2015, 53, 4444–4456. [Google Scholar] [CrossRef]
  37. Tian, Y.; Peterslidard, C.D.; Choudhury, B.J.; Garcia, M. Multitemporal analysis of trmm-based satellite precipitation products for land data assimilation applications. J. Hydrometeorol. 2007, 8, 1165–1183. [Google Scholar] [CrossRef]
  38. Chen, S.; Hong, Y.; Cao, Q.; Gourley, J.J.; Kirstetter, P.E.; Yong, B.; Tian, Y.; Zhang, Z.; Shen, Y.; Hu, J. Similarity and difference of the two successive v6 and v7 trmm multisatellite precipitation analysis performance over china. J. Geophys. Res. Atmos. 2013, 118, 13060–13074. [Google Scholar] [CrossRef]
  39. Tian, Y.D.; Peterslidard, C.D.; Adler, R.F.; Kubota, T.; Ushio, T. Evaluation of gsmap precipitation estimates over the contiguous united states. J. Hydrometeorol. 2010, 11, 566–574. [Google Scholar] [CrossRef]
  40. Ushio, T.; Sasashige, K.; Kubota, T.; Shige, S.; Okamoto, K.; Aonashi, K.; Inoue, T.; Takahashi, N.; Iguchi, T.; Kachi, M.; et al. A kalman filter approach to the global satellite mapping of precipitation (gsmap) from combined passive microwave and infrared radiometric data. J. Meteorol. Soc. Jpn. 2009, 87A, 137–151. [Google Scholar] [CrossRef]
  41. Li, Z.; Yang, D.; Hong, Y. Multi-scale evaluation of high-resolution multi-sensor blended global precipitation products over the Yangtze River. J. Hydrol. 2013, 500, 157–169. [Google Scholar] [CrossRef]
  42. Chen, M.; Shi, W.; Xie, P.; Silva, V.B.S.; Kousky, V.E.; Wayne Higgins, R.; Janowiak, J.E. Assessing objective techniques for gauge-based analyses of global daily precipitation. J. Geophys. Res. Atmos. 2008, 113, D04110. [Google Scholar] [CrossRef]
  43. Shen, Y.; Xiong, A.; Wang, Y.; Xie, P. Performance of high-resolution satellite precipitation products over china. J. Geophys. Res. Atmos. 2010, 115, 355–365. [Google Scholar] [CrossRef]
  44. Grody, N.C.; Weng, F. Microwave emission and scattering from deserts: Theory compared with satellite measurements. IEEE Trans. Geosci. Remote Sens. 2008, 46, 361–375. [Google Scholar] [CrossRef]
Figure 1. Site distribution and topography.
Remotesensing 10 00168 g001
Figure 2. Spatial features of the nine-year mean daily rainfall obtained from CMOPRH_BLD, CMORPH_RAW, TRMM3BV42, PERSIANN_CDR, GSMaP_RENALYSIS and GAUGE_STATION.
Remotesensing 10 00168 g002
Figure 3. Density-colored scatterplots of the different products against the in-situ measurements for the nine-year mean daily precipitation. The red line is the fit and the black is 1:1. (a) denotes CMOPRH_RAW &gauge, (b) denotes CMOPRH_BLD &gauge, (c) denotes TRMM3BV42 &gauge, (d) denotes PERSIANN_CDR &gauge, (e) denotes GSMaP_RENALYSIS &gauge.
Remotesensing 10 00168 g003
Figure 4. Seasonal nine-year daily mean rainfall features of CMOPRH_BLD, CMORPH_RAW, TRMM3BV42, PERSIANN_CDR, GSMaP_RENALYSIS and GAUGE_STATION.
Remotesensing 10 00168 g004
Figure 5. (ac) denote the CC, BIAS and RMSE values of the satellite products and rain gauge stations for the seasonal daily mean precipitation values, respectively.
Remotesensing 10 00168 g005
Figure 6. (ac) denote the time series of the CC, RMSE and BIAS from a variety products spanning 2005 to 2013 over China, respectively.
Remotesensing 10 00168 g006
Figure 7. Probability density function of daily rainfall for the no-rain case.
Remotesensing 10 00168 g007
Figure 8. Probability density function of the daily rainfall events with different intensities.
Remotesensing 10 00168 g008
Figure 9. The precipitation distributions of the rain gauge stations (a) and multiple satellite (b) in 2013 over southern China.
Remotesensing 10 00168 g009
Figure 10. (ac) denote the CC, RMSE and BIAS among a variety of products for each month in 2013 over the Tibetan Plateau, respectively.
Remotesensing 10 00168 g010
Figure 11. The precipitation distributions from the rain gauge stations (a) and multiple satellites (b) in 2013 over southern China.
Remotesensing 10 00168 g011
Figure 12. (ac) denote the CC, RMSE and BIAS values of the studied products for each month in 2013 over southern China, respectively.
Remotesensing 10 00168 g012
Table 1. Description of the precipitation datasets utilized in this study.
ProductTemporal ResolutionSpatial ResolutionDomainYes or No Added Gauges
CMORPH_RAW1 day0.25°60°S–60°NNo
CMORPH_BLD1 day0.25°60°S–60°NYes
PERSIANN_CDR1 day0.25°60°S–60°NYes
GSMaP-RENALYSIS1 day0.1°60°S–60°NYes
TRMM3BV421 day0.25°50°S–50°NYes
Table 2. Contingency table comparing rainfall retrievals by satellites and gauges.
Gauge ≥ ThresholdGauge < Threshold
Satellites ≥ thresholdHF
Satellites < thresholdMZ
Table 3. The CC, BIAS and RMSE values for a variety products and the gauge station data for a year of the daily mean precipitation values over China.
ProductsFactors200520062007200820092010201120122013
CMORPH_BLDCC0.740.820.700.750.760.770.740.760.76
RMSE1.451.341.461.501.411.361.301.381.50
BIAS−0.42−0.46−0.47−0.45−0.46−0.39−0.47−0.39−0.46
CMORPH_RAWCC0.680.710.600.670.630.710.610.370.66
RMSE1.571.631.651.691.701.531.561.611.77
BIAS−0.58−0.57−0.56−0.58−0.62−0.54−0.59−0.55−0.57
TRMM3BV42CC0.740.830.700.760.760.780.760.780.79
RMSE1.451.311.481.481.421.351.301.351.47
BIAS−0.38−0.42−0.43−0.41−0.42−0.36−0.44−0.35−0.43
PERSIANN_CDRCC0.730.800.670.720.670.730.710.730.80
RMSE1.481.411.541.561.631.471.401.501.42
BIAS0.470.310.300.340.420.340.410.540.26
GSMaP_RENALYSISCC0.820.870.810.820.840.840.830.850.84
RMSE1.281.211.281.421.231.361.161.191.27
BIAS−0.05−0.110.040.030.040.070.020.050.01
Table 4. The results of the statistics of FBI, POD, CSI and FAR.
CMORPH_BLDCMORPH_RAWTRMM3B42 VPERSIANNGSMaP_RENALYSIS
FBI1.271.131.001.031.01
POD0.760.570.600.570.81
CSI0.500.370.570.460.63
FAR0.400.490.450.420.36

