Super-Resolution Mapping of Impervious Surfaces from Remotely Sensed Imagery with Points-of-Interest


1
School of Earth Sciences and Engineering, Hohai University, Nanjing 210098, China
2
State Key Laboratory of Resources and Environmental Information System, Institute of Geographical Sciences and Natural Resources Research, Chinese Academy of Sciences, Beijing 100101, China
3
School of Geography Science, Nanjing Normal University, Nanjing 210023, China
*
Authors to whom correspondence should be addressed.
Remote Sens. 2018, 10(2), 242; https://doi.org/10.3390/rs10020242
Submission received: 11 December 2017
/
Revised: 27 January 2018
/
Accepted: 1 February 2018
/
Published: 6 February 2018
(This article belongs to the Special Issue Remote Sensing Image Downscaling)
Abstract
:The accurate mapping of impervious surfaces is of key significance for various urban applications. Usually, traditional methods extract the proportion image of impervious surfaces from remote sensing images; however, the proportion image cannot specify where the impervious surfaces spatially distribute within a pixel. Meanwhile, impervious surfaces often locate urban areas and have a strong correlation with the relatively new big (geo)data points of interest (POIs). This study, therefore, proposed a novel impervious surfaces mapping method (super-resolution mapping of impervious surfaces, SRMIS) by combining a super-resolution mapping technique and POIs to increase the spatial resolution of impervious surfaces in proportion images and determine the accurate spatial location of impervious surfaces within each pixel. SRMIS was evaluated using a 10-m Sentinel-2 image and a 30-m Landsat 8 Operational Land Imager (OLI) image of Nanjing city, China. The experimental results show that SRMIS generated satisfactory impervious surface maps with better-classified image quality and greater accuracy than a traditional hard classifier, the two existing super-resolution mapping (SRM) methods of the subpixel-swapping algorithm, or the method using both pixel-level and subpixel-level spatial dependence. The experimental results show that the overall accuracy increase of SRMIS was from 2.34% to 5.59% compared with the hard classification method and the two SRM methods in the first experiment, while the overall accuracy of SRMIS was 1.34–3.09% greater than that of the compared methods in the second experiment. Hence, this study provides a useful solution to combining SRM techniques and the relatively new big (geo)data (i.e., POIs) to extract impervious surface maps with a higher spatial resolution than that of the input remote sensing images, and thereby supports urban research.
1. Introduction
Impervious surfaces are mainly artificial areas where water cannot infiltrate the soil [1,2]. They are used as a critical indicator in a range of fields, such as urbanization [3,4], urban heat island effect [5,6], and urban water resource protection [7,8]. The accurate extraction of impervious surfaces from remote sensing imagery is a prerequisite of such applications. In past decades, there have been three main approaches to mapping impervious surfaces: (1) pixel-based (i.e., hard classification), (2) subpixel-based (i.e., soft classification or spectral unmixing), and (3) object-based algorithms [1]. These approaches have been applied to various remote sensing images including low spatial resolution (>100 m), medium spatial resolution (10–100 m), and high spatial resolution (<10 m) images and have achieved acceptable performances in mapping impervious surfaces [1]. However, the extraction of impervious surfaces from remote sensing imagery still suffers from several issues: (1) the accuracy of impervious surfaces is limited by the complexity of impervious surfaces because impervious surfaces are mainly distributed in complicated urban areas [9]; (2) mixed pixels composed of impervious surfaces and other land features are inevitable in various spatial resolution images [6,10]; (3) impervious surfaces from low and medium spatial resolution images are often too coarse to use in urban environments [1]; and (4) most impervious surface maps can provide the proportion of impervious surfaces by soft classification but cannot specify where impervious surfaces are spatially distributed within pixels [11,12,13]. Auxiliary datasets are usually applied to reduce the complexity and uncertainty of mapping impervious surfaces through providing complementary information, such as light detection and ranging (LiDAR) data [14]. However, LiDAR data concentrates mainly on geometric information (i.e., three-dimension representation of targets) rather than spectral information [1]. For the mixed pixel problem, an attractive solution is the super-resolution mapping (SRM) technique [15]. It first increases the spatial resolution of each pixel (i.e., dividing each pixel into several smaller subpixels) in the proportion images derived from a soft classification and then determines the spatial location of classes within each pixel [16,17,18,19,20]. Since SRM was proposed by Atkinson [15], there has been a proliferation of SRM methods developed; these include artificial neural networks [21,22,23], subpixel-swapping methods [11,24,25], spatial attraction models [26,27], Markov random fields [28,29,30], geostatistical solutions [16,31,32], interpolation-based approaches [33,34,35], and other advanced methods [19,36,37,38,39]. To improve the performance of SRM methods, various auxiliary data have been integrated into SRM methods, such as panchromatic images [40], multiple shifted images [41], and prior information [42]. Meanwhile, SRM methods have been widely used to increase the spatial resolution of many thematic maps from remote sensing images, such as wetland inundation [43,44], land use maps [45], lakes [11,46,47], urban trees [28], forests [42], and burned areas [48]. However, little if any attempt has been given to applying SRM to map impervious surfaces at a higher spatial resolution than that of its input images.
Usually, impervious surfaces are located in urban areas and have a strong correlation with places of human activity [49,50,51]. Points of interest (POIs) are often geographical points that mark the useful and important places of human activity [52,53,54], such as restaurants, nodes of roads, and residential areas. With the rapid development of online maps in recent years, a proliferation of POIs have been added to online maps for navigation. Therefore, POIs can be viewed as the relatively new big (geo)data and they are able to provide complementary information for mapping urban variables [51,55,56]. Recently, POIs have been successfully used in the enhancement of mapping several urban variables, such as the spatial distribution of urban land use [51], urban neighborhood vibrancy [49], and urban functional regions [54]. However, less evidence is available on using the auxiliary data of POIs in the field of SRM to improve the mapping of impervious surfaces.
Therefore, this study aims to develop a super-resolution mapping of impervious surfaces (SRMIS) method to incorporate POIs into SRM to solve these issues in mapping impervious surfaces. The main objectives are (1) to make full use of the complementary information from POIs to reduce the complexity and uncertainty of mapping impervious surfaces, (2) to estimate the accurate spatial location of impervious surfaces within mixed pixels and increase the spatial resolution of impervious surface maps, and (3) to provide a cost-effective way to obtain impervious surface maps with a higher spatial resolution than that of input remote sensing images, which may save money in purchasing expensive high spatial resolution remote sensing images in urban research.
2. Methods
2.1. Background of SRM
Suppose that the number of classes is and that the proportion images have been obtained by soft classification from originally coarse remote sensing images with pixels. By setting the zoom scale factor , each pixel in the coarse proportion images is decomposed into finer subpixels, generating an SRM map as . is a logical value for subpixel that means whether it is assigned to class . SRM is a post step of soft classification and can be considered as a hard classifier to produce the hard-classified maps with a higher spatial resolution than that of the input proportion images [12,36,41]. Under the assumption of maximal spatial dependence between and within pixels, SRM aims to estimate the most likely spatial locations of classes within a mixed pixel, subject to the class proportion constraints of each pixel in proportion images. SRM can be formulated as a binary integer spatial optimization problem [18,57,58]:
where is the measurement of the spatial dependence of class for subpixel , is the proportion of class in mixed pixel . The first constraint in Equation (2) indicates that each subpixel is assumed pure and is allocated only to a unique class, while the second constraint in Equation (2) means that the proportion of the number of subpixels for each class should be consistent with the class proportion in proportion images. When mapping impervious surfaces, SRM is considered as a special case in that only two classes—impervious surfaces and pervious surfaces—are involved.
2.2. SRMIS Method
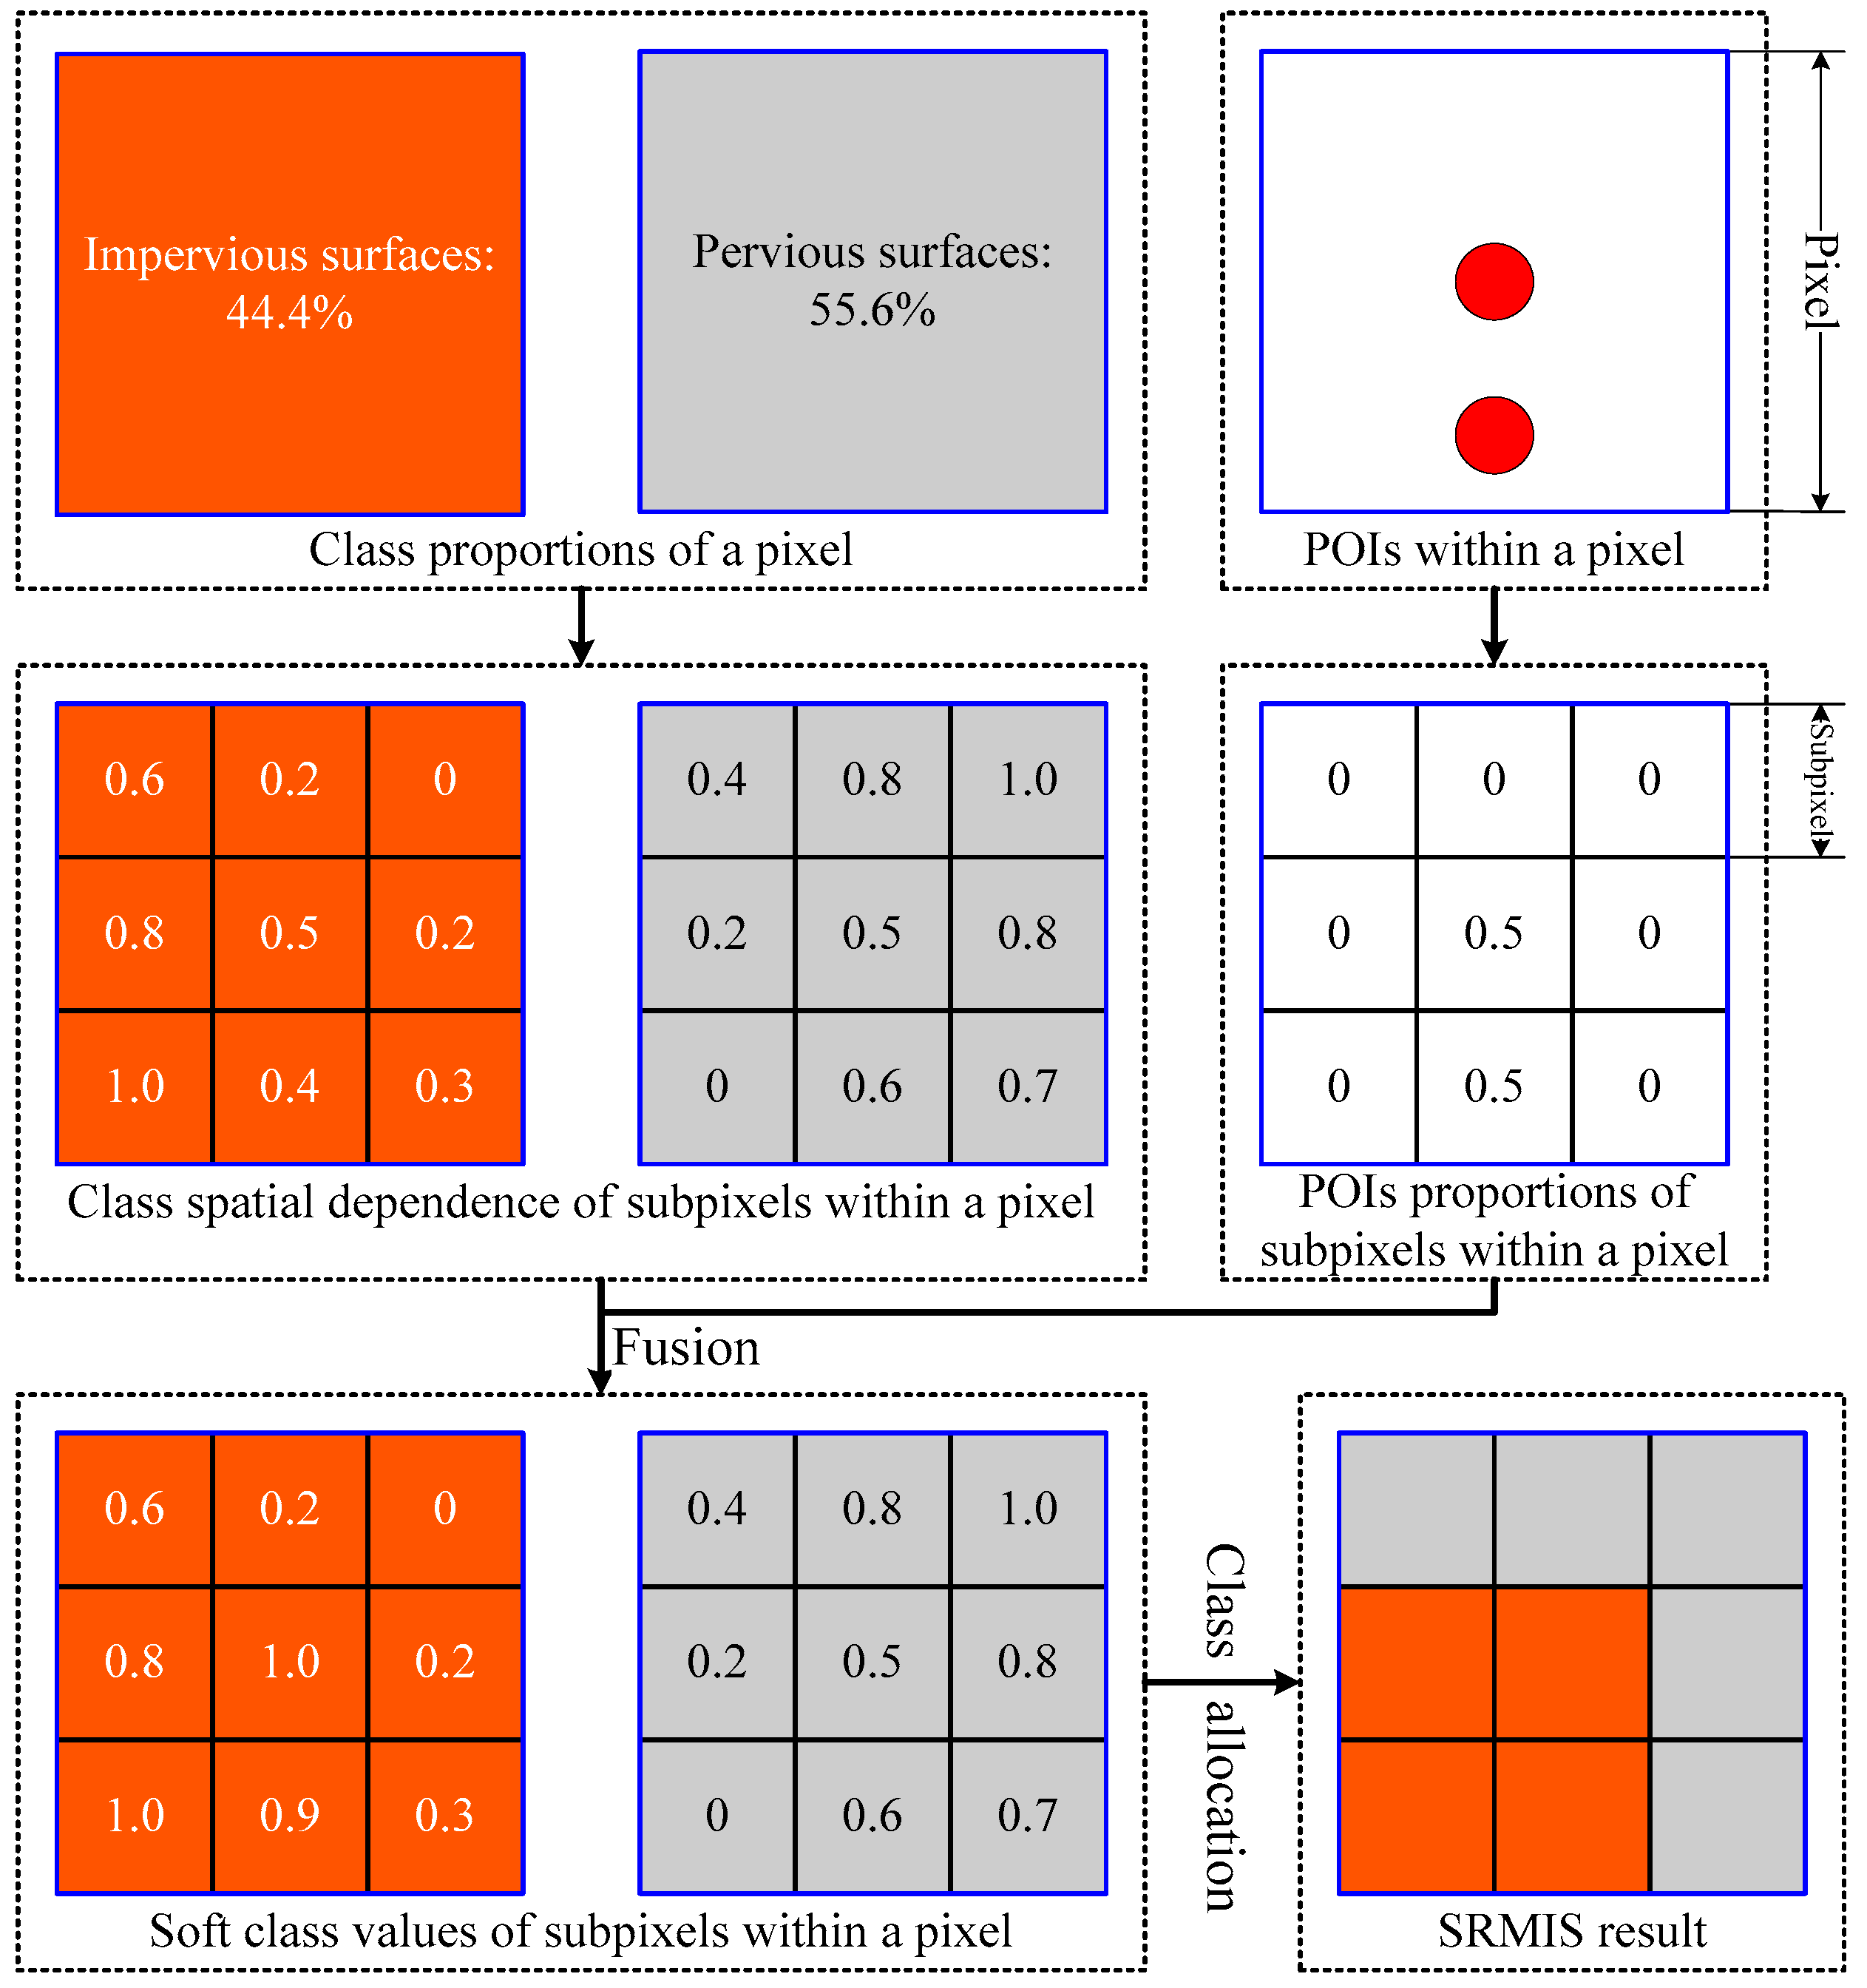
SRMIS inherits the basic idea of traditional SRM and extends it to use the complementary information of POIs in mapping impervious surfaces at subpixel scales. SRMIS involves four main processes: (1) characterizing and normalizing the spatial dependence of each subpixel for the two classes of impervious and pervious surfaces; (2) calculating the proportion of POIs located at each subpixel to POIs within the mixed pixel; (3) fusing spatial dependence and proportion of POIs for each subpixel; (4) building a spatial optimization model to allocate the optimal class to each subpixel. An example of SRMIS implementation for a mixed pixel is presented in Figure 1. The example shows a mixed pixel has 44.4% impervious surfaces and 55.6% pervious surfaces. Given a testing zoom scale factor of 3, the mixed pixel is divided into nine subpixels. The class spatial dependence of the nine subpixels is first obtained and then the proportion of POIs of the nine subpixels are calculated. Furthermore, the spatial dependence of impervious surfaces and the POI proportions are fused as the soft class values for each subpixel. Finally, the optimal class label of each subpixel is determined in terms of the soft class values and the class proportions within the mixed pixel.
(1) Perform the characterization and normalization of spatial dependence
The measurement of spatial dependence from the proportion images of soft classification for each subpixel is critical in determining the optimal class of subpixels. Currently, there are three categories of methods for measuring spatial dependence: (1) pixel-level methods, such as the spatial attraction model [26] and the high-accuracy surface modeling [34]; (2) subpixel-level methods, such as the exponential weighting function [24]; and (3) fused methods, such as combining pixel-level and subpixel-level spatial dependences algorithm (PSSD) [57]. PSSD has not only the merit of preserving structure information of patches by pixel-level dependence but also the advantage of providing local details by subpixel-level dependence. Therefore, it is adopted here to characterize the spatial dependence of subpixels and is calculated using
where are the pixel-level and subpixel-level spatial dependences of class for subpixel , is the weight for the pixel-level dependence, is the Euclidian distance between subpixel and neighboring pixel , is the parameter in the exponential function, are the numbers of neighboring pixels and subpixels. The surrounding neighborhood is used in calculating the pixel-level spatial dependence. Note that the equations in Equation (3) were developed in previous work [57].
To facilitate the fusion of spatial dependence and proportion of POIs, the spatial dependence is normalized using the following:
where is the normalized spatial dependence of class for subpixel from the original spatial dependence obtained by PSSD. Note that the normalization does not change the relative sequence of subpixel spatial dependences for all classes and adjusts only the spatial dependence values to the same value scale of POI proportions. That is to say, the SRMIS result is the same as the result when only the original spatial dependences are used when there are no POIs.
(2) Calculate the proportion of POIs for each subpixel
The proportion of POIs within each subpixel to POIs within the mixed pixel is used to characterize one possibility of impervious surface occurrence for the subpixel. The calculation of the POI proportions for subpixel is
where is the POI proportions of class for subpixel , is the number of POIs within subpixel , and is the total number of POIs for all subpixels within pixel . Note that it defines to be the class of impervious surfaces and to be the pervious surfaces because SRMIS deals with only the two classes. Therefore, the calculation in Equation (5) is only for one class of impervious surfaces (i.e., the case of ).
(3) Fuse spatial dependence and proportion of POIs for each subpixel
With the spatial dependence and proportion of POIs of each subpixel as inputs, they are fused to get the soft class values of subpixels to represent the probabilities of class occurrences. The soft class values of subpixels are calculated using
where is the soft class value of class for subpixel . Note that only the class of impervious surfaces is involved in this process in order to save computation time and the normalized spatial dependence of pervious surfaces is directly used as its soft class value. The reasons for using equal weight for the spatial dependence and proportion of POIs are that the proportion of POIs is considered as important for the spatial dependence of impervious surfaces; and the soft class value of impervious surfaces may be clearly increased when there are POIs and the soft class value of pervious surfaces cannot be decreased since only the class of impervious surfaces performs this process. According to the fusion process, subpixels with POIs can significantly improve the probability of allocating to the class of impervious surfaces because the soft class values of impervious surfaces may increase while the soft class values of pervious surfaces do not change.
(4) Allocate optimal class to each subpixel
Similar to traditional SRM, SRMIS builds a binary integer spatial optimization model to determine the optimal class of each subpixel. The objective of the model is to maximize the soft class values of subpixels within a mixed pixel, subject to the class proportion constraints imposed by proportion images and the POI proportion constraint; that is:
where the first two equations in Equation (8) are the same as the constraints of traditional SRM optimization model while the third equation in Equation (8) is added in SRMIS to allocate the impervious surfaces to subpixel when only subpixel has POIs within mixed pixel .
3. Case Study
3.1. Experimental Design
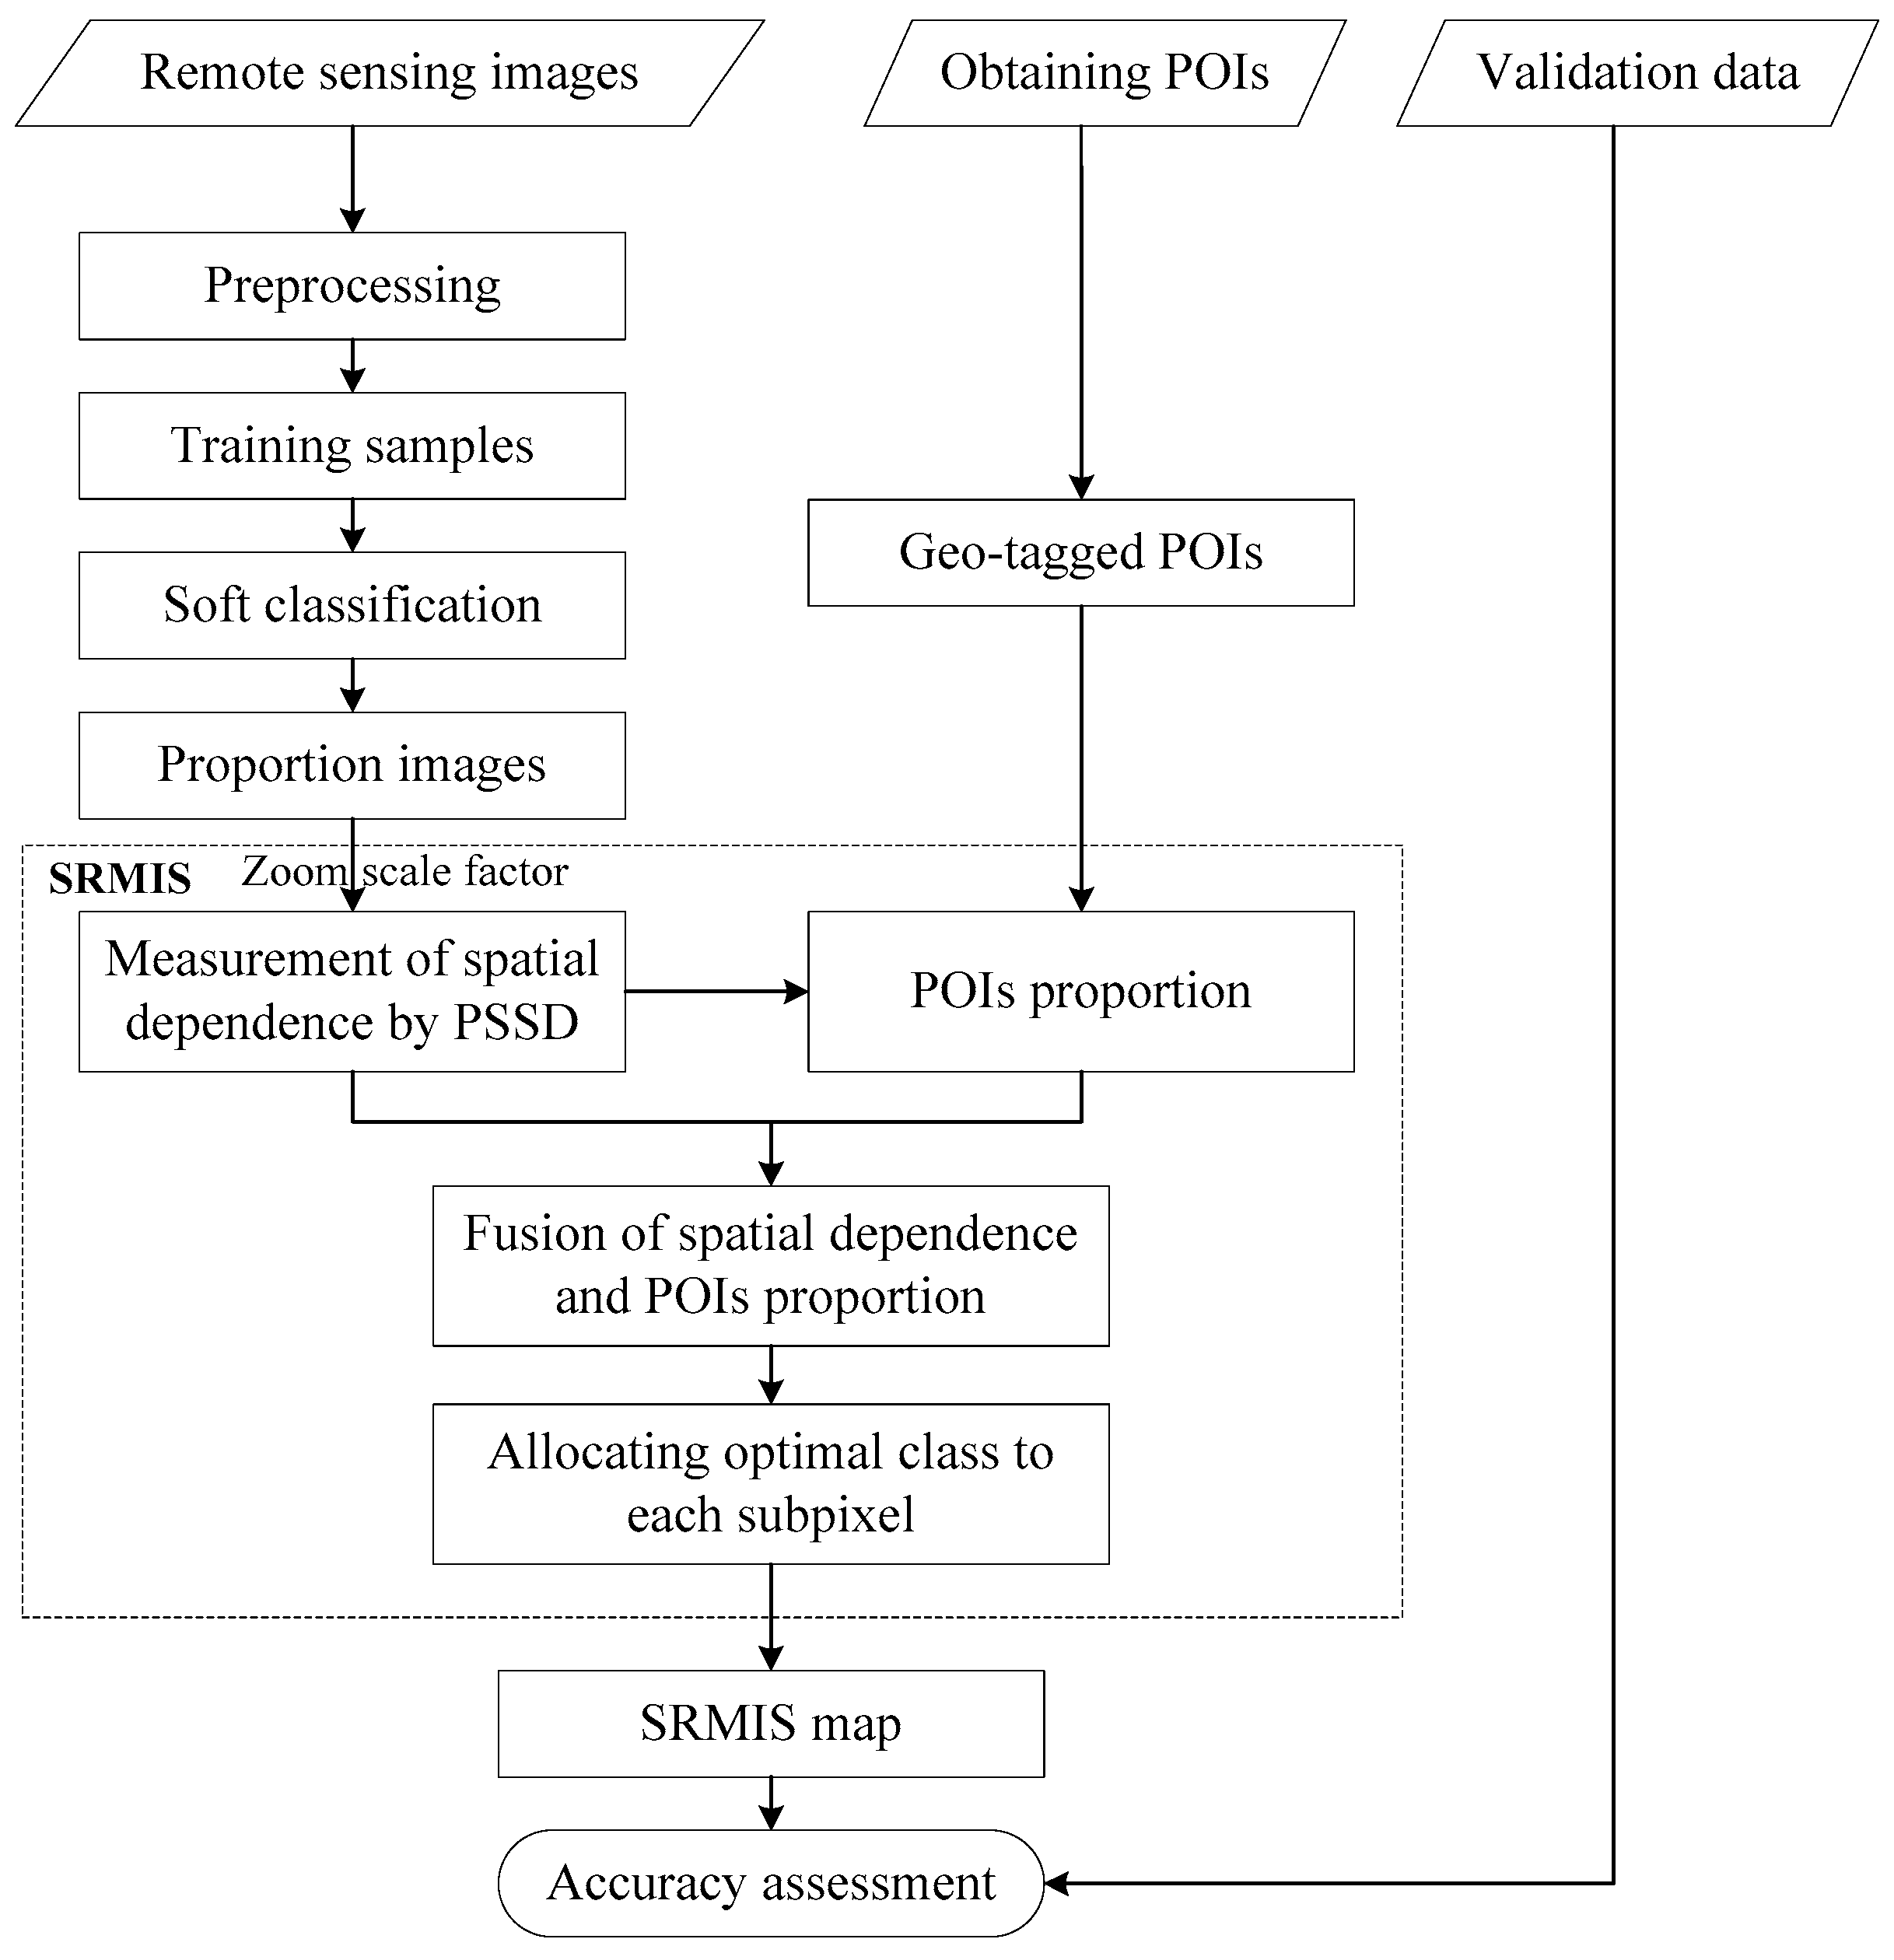
To evaluate the performance of SRMIS, two experiments—one on a Sentinel-2 image and one on a Landsat 8 OLI image in Nanjing city, China—were carried out to produce the impervious surface maps at a higher spatial resolution than that of the input images. The flowchart of the experiments is shown in Figure 2 and the experiments were implemented in four main steps: (1) prepared experimental datasets including remote sensing images, POIs, and validation data; (2) produced proportion images by a support vector machine (SVM) soft classifier [59]; (3) performed SRMIS; (4) assessed SRMIS maps with validation data.
3.2. Experiment on a Sentinel-2 Image
A multi-spectral Sentinel-2 image (8100 × 10,800 pixels) was chosen to test the SRMIS. The Sentinel-2 image, taken on 2 April 2017, locates Nanjing city, China. It is a level-2A product and contains four bands (i.e., blue, green, red, and near-infrared bands) with a spatial resolution of 10 m. The geo-tagged POIs within the Sentinel-2 image were acquired from one of the biggest online maps in China (http://map.qq.com/) on 6 July 2017. The number of POIs is 299,640 and they are divided into twelve categories (http://lbs.qq.com/webservice_v1/guide-appendix.html), as shown in Table 1. Note that only POIs that are related to impervious surfaces were obtained while POIs (e.g., scenic spots) that are not related to impervious surfaces were not obtained. The validation image in Figure 3c within this area was downloaded from Google Maps (http://www.google.cn/maps) and the acquisition date of the validation image was 9 February 2017. The impervious surfaces of Nanjing mainly distribute in its downtown area, as shown in the area marked by the black polygon in Figure 3a.
With the Sentinel-2 image in Figure 3a as input, a soft classification was implemented to produce proportion images of impervious and pervious surfaces by the SVM soft classifier. This experiment used a combination of two endmembers (i.e., buildings and roads) to represent impervious surfaces, while a combination of three endmembers (i.e., vegetation, water, and others) was built for the class of pervious surfaces. Training samples of the five endmembers were selected from Figure 3a for the soft classification of the Sentinel-2 image. The total number of training samples was 25,065 pixels, including 4561 pixels of buildings, 1644 pixels of roads, 10,602 pixels of vegetation, 7135 pixels of water, and 1123 pixels of others. Note that the normalized difference vegetation index (NDVI) was generated as an additional feature in soft classification because NDVI had near inverse correlation with impervious surfaces [1]. The proportion image of impervious surfaces in Figure 3d was generated by summing the two proportion images of buildings and roads; the same method was used to produce the proportion image of pervious surfaces. It can be observed from Figure 3b,d that the spatial distribution of impervious surfaces is strongly consistent with the POIs. Thus, POIs are able to provide effective complementary information in mapping the impervious surfaces.
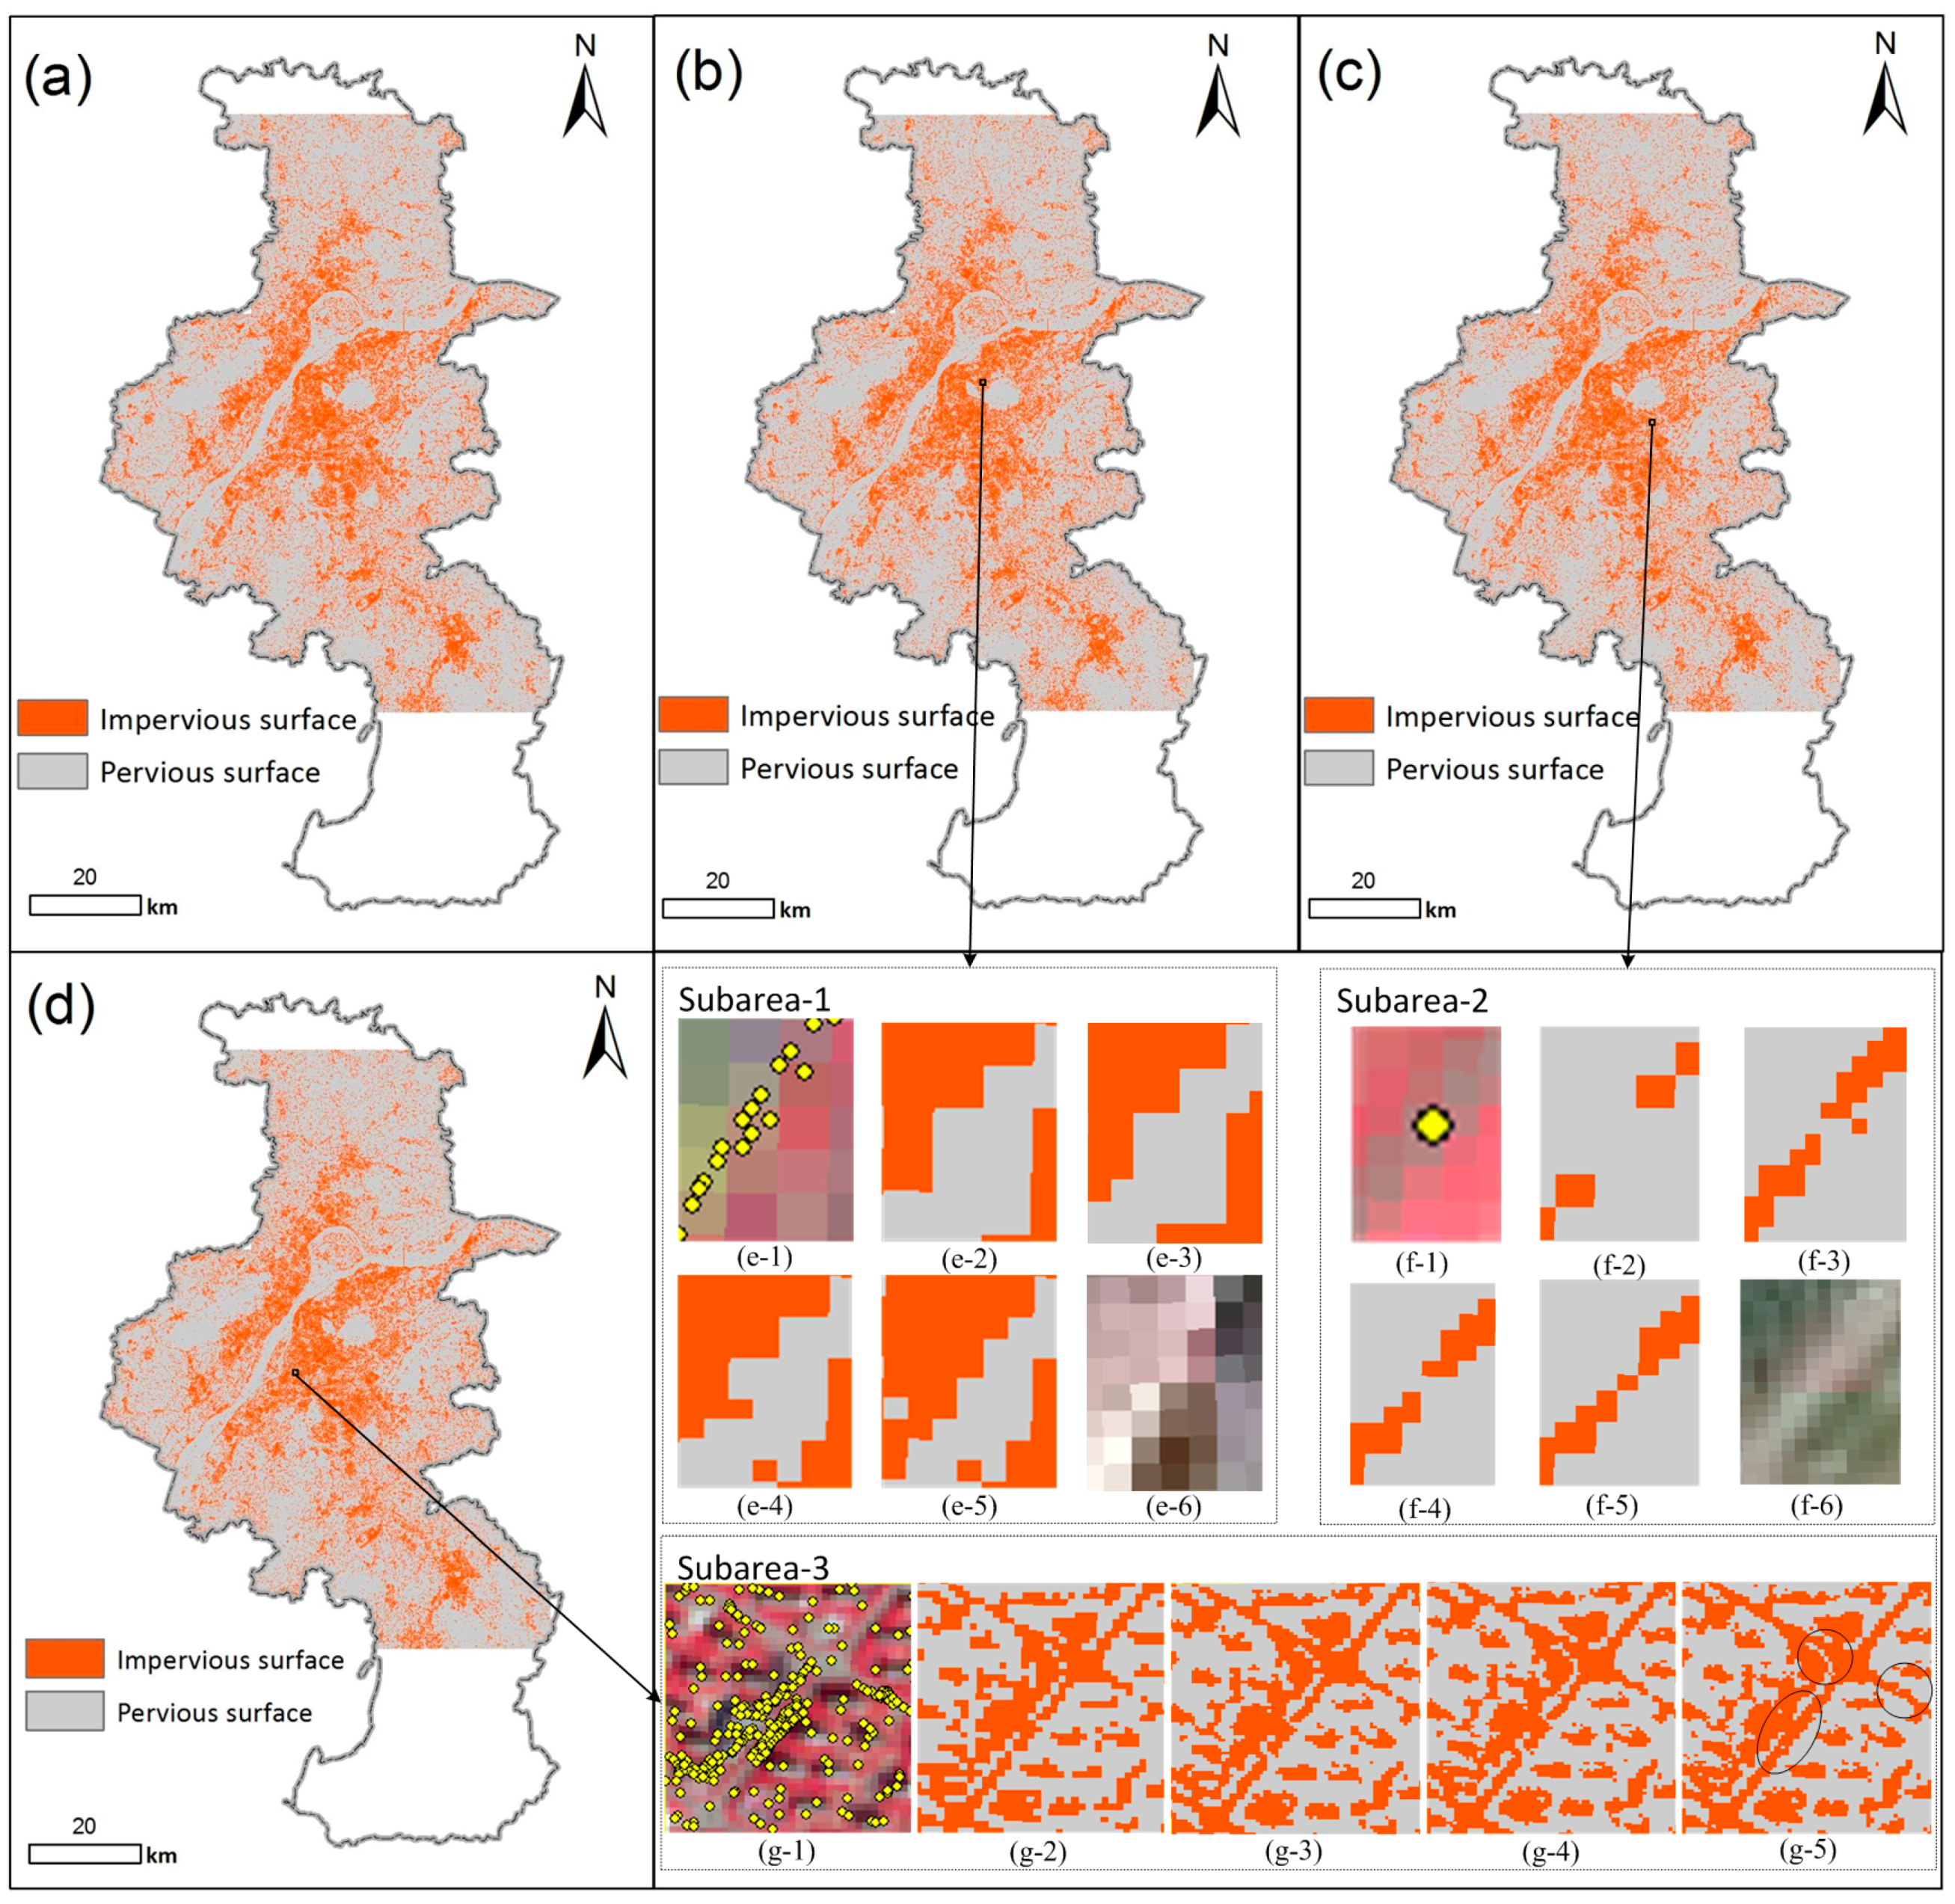
Two zoom scale factors (i.e., S = 2 and S = 4) were employed to increase the spatial resolution of the impervious surface maps and assess the performance of SRMIS maps. Meanwhile, PSSD without POIs and the subpixel-swapping algorithm (PSA) were used as the representative SRM methods to compare with SRMIS. Note that the spatial attraction model result was used as the initial result of PSA to reduce its iterations [26]. Moreover, the SVM hard classification map was generated from the SVM soft classification results for comparison with the SRM maps. Figure 4a shows the SVM hard classification map of impervious surfaces in Nanjing. Figure 4b–d present the PSA, PSSD, and SRMIS maps produced by the zoom scale factor of 2, respectively. It can be seen from Figure 4a–d that the spatial distribution of impervious surfaces is consistent with POIs in Figure 3b and the proportion map in Figure 3d. At the same time, most impervious surfaces of these results are spatially distributed within the black polygon in Figure 3a. Focusing on the details of three small subareas in Figure 4, three SVM hard classification results in Figure 4(e2–g2) show less local detail of impervious and pervious surfaces and more wrongly classified patches than the three SRM results. Specifically, there are some mixed pixels in the intersection areas between buildings and vegetation in subarea-1. Additionally, some overestimated pervious surfaces (i.e., vegetation) in Figure 4(e2) were produced by the hard classifier whereas the three SRM results have less overestimated pervious surfaces and more accurate impervious surfaces, especially in the SRMIS result of Figure 4(e5). The road in subarea-2 was obviously classified to pervious surfaces by the SVM hard classifier while the three SRM methods produced more accurate road patches than the SVM hard classifier. The impervious surfaces in Figure 4(g2) show coarser patches and less detail than the other three SRM results in Figure 4(g3,g5). Compared with the hard-classified result, the improvement of three SRM results is mainly due to the fact that SRM methods generated the details of impervious and pervious surfaces within mixed pixels and increased the spatial resolution of impervious surface maps. When comparing the three SRM results, PSA and PSSD produced slightly more underestimated impervious surfaces (i.e., the buildings) in Figure 4(e3,e4) than SRMIS in Figure 4(e5) and the SRMIS result in subarea-1 is closer to the validation image in Figure 4(e6) than those in Figure 4(e3,e4). At the same time, the unconnected road in Figure 4(f3,f4) was connected in Figure 4(f5) by SRMIS using the new constraints of POIs within this road to reduce the uncertainty in mapping impervious surfaces. Furthermore, SRMIS, with the help of POIs, produced more accurate impervious surfaces than PSA and PSSD in the subarea-3, especially for the three ellipse areas in Figure 4(g5). The classification enhancement within the three ellipse areas by SRMIS was largely due to lots of POIs. In visual assessment, PSA, PSSD, and SRMIS perform better than the traditional SVM hard classifier and SRMIS slightly outperforms PSA and PSSD.
To quantitatively assess the performances of the classification maps, 8000 validation sites (including 3787 impervious surfaces sites and 4213 pervious surfaces sites) were selected as test data from the validation data in Figure 3c by a stratified random sampling scheme. Each validation site was first manually interpreted into impervious surfaces or pervious surfaces from the validation image in Figure 3c, and then they were compared with the corresponding sites in the classification maps of impervious and pervious surfaces to generate confusion matrices. Finally, overall accuracy (OA) and Kappa coefficient were calculated from confusion matrices for each classification map, as shown in Table 2. Table 2 indicates that the OA and Kappa coefficient of the SVM hard classifier are lower than those of PSA, PSSD, and SRMIS and that SRMIS has higher OA and Kappa coefficient than PSA and PSSD for each zoom scale factor. Specifically, the OA of the SVM hard classifier is 2.99% and 0.92% lower than the average OA of PSA, PSSD, and SRMIS for the zoom scale factors of 2 and 4, respectively. Compared with the average OA of PSA and PSSD, the OA increases of SRMIS are 3.90% and 3.10% for the zoom scale factors of 2 and 4, respectively. The OA and Kappa coefficient of PSA, PSSD, and SRMIS decrease with the increase of zoom scale factors. It suggests that the improvement of SRMIS by POIs is suitable for different zoom scale factors. The quantitative accuracy assessment confirms the visual observation that PSA, PSSD, and SRMIS produce better results than the SVM hard classifier and that SRMIS has greater accuracy than the two existing SRM methods of PSA and PSSD. Thus, the proposed SRMIS with the help of POIs produced reliable impervious surface maps at subpixel scales from both visual and quantitative assessments.
3.3. Experiment on a Landsat 8 OLI Image
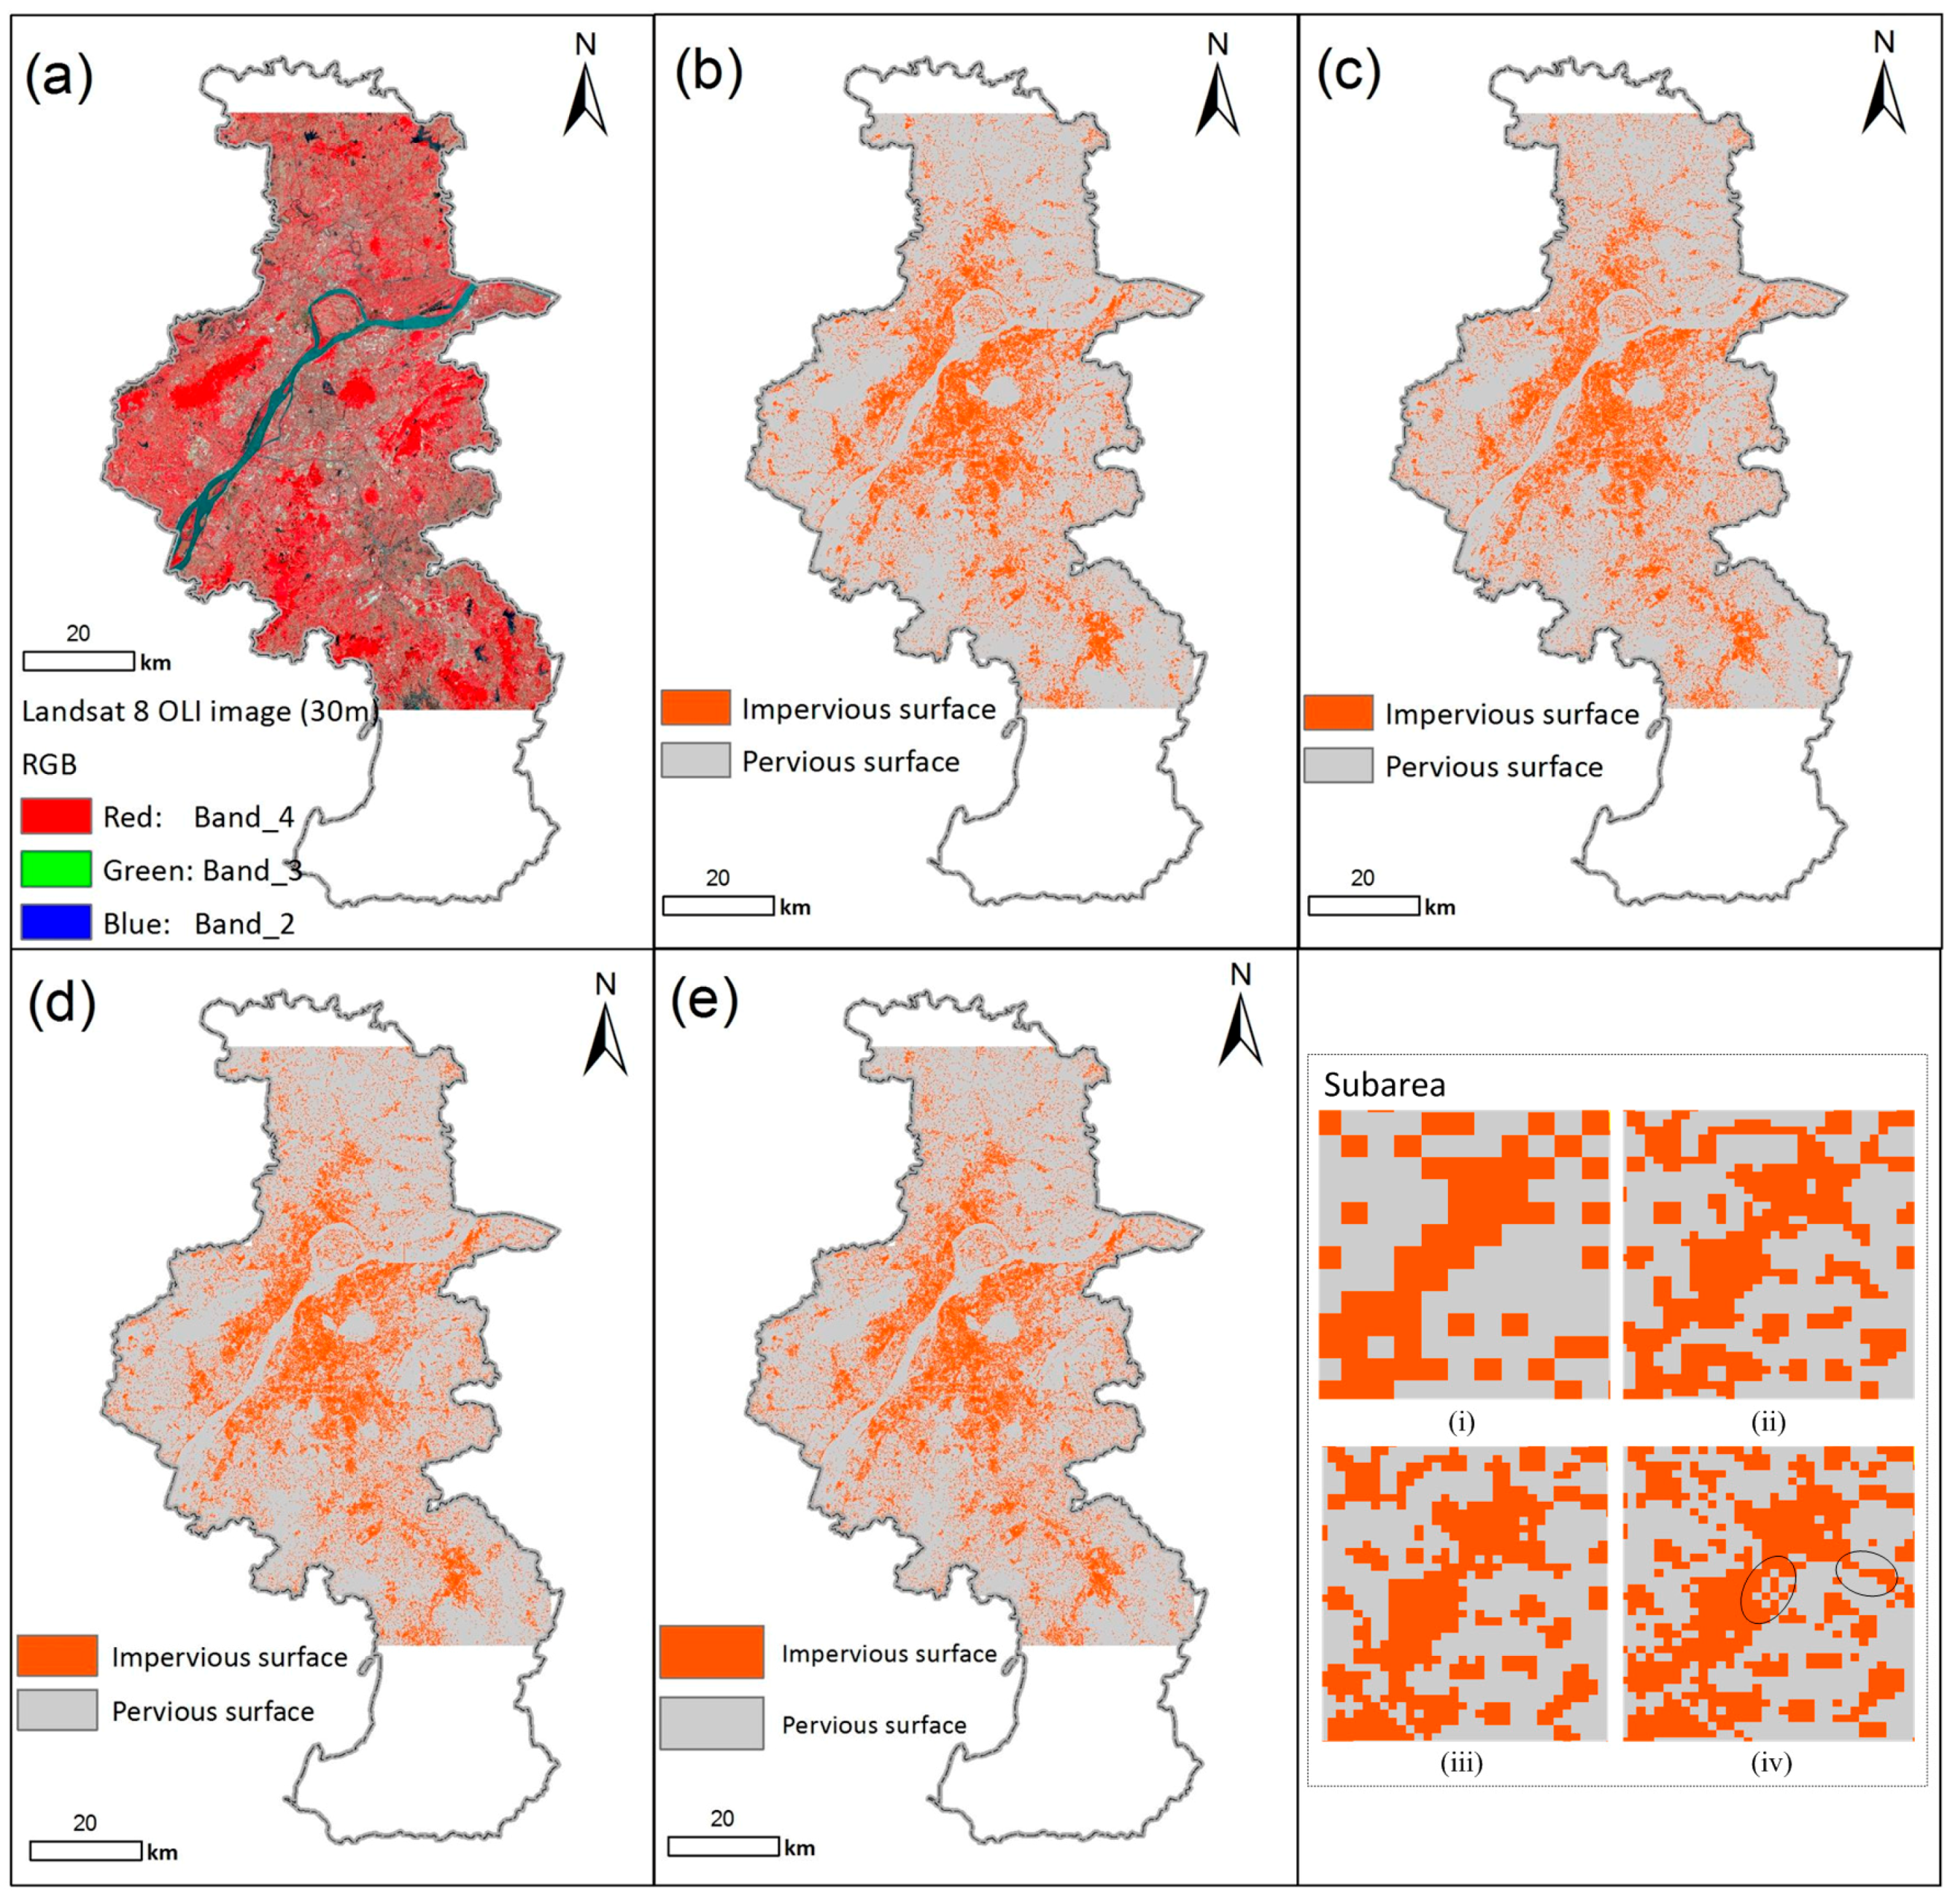
A 30-m Landsat 8 OLI image within the same area of the first experiment on the Sentinel-2 image was further employed to test the SRMIS. The Landsat 8 OLI image (2700 × 3600 pixels) in Figure 5a was taken on 18 May 2017 and six bands (i.e., from band2 to band7) were involved in this experiment. The POIs, training sample sites, and validation sites used in the first experiment were also used in this experiment. The SVM classification was performed on the Landsat 8 OLI image to generate the proportion image of impervious surfaces and the hard classification map. The zoom scale factor of 3 was employed to increase the spatial resolution of impervious surface maps and the proportion image of impervious surfaces was applied to PSA, PPSD, and SRMIS to yield the SRM maps with the increased spatial resolution of 10 m. Figure 5b–e present the hard classification, PSA, PSSD, and SRMIS maps, respectively. Most impervious surfaces in the four classification maps distribute in the black polygon in Figure 3a and their spatial distributions have high consistency with the POIs. The four results within a subarea that is the same as subarea-3 in Figure 4 are presented in Figure 5i–iv to compare their performances in detail. The SVM hard classification result in Figure 5i again shows less detail and coarser boundaries of impervious surface patches than the three SRM results in Figure 5ii–iv. PSA generated slightly more clustered impervious surfaces than PSSD and SRMIS. With the help of POIs, SRMIS preserved slightly more impervious surface details than PSSD. For example, SRMIS preserved the road in the right ellipse and the vegetation in the left ellipse in Figure 5iv, whereas PSSD made the road unconnected and the vegetation close to neighboring large pervious surface patches under the assumption of spatial dependence.
The quantitative accuracy assessment was conducted for the SVM hard classification result and three SRM maps of impervious surfaces in the experiment on a Landsat 8 OLI image. The OA and Kappa coefficient of each map are calculated in Table 3. It shows that SRMIS has greater accuracy than the SVM hard classifier, PSA, and PSSD. Specifically, the OA of SRMIS is 3.09%, 1.96%, and 1.34% greater than that of the SVM hard classifier, PSA, and PSSD, respectively.
4. Discussion
4.1. Improvements in Mapping Impervious Surfaces by SRM Methods
Three SRM methods of PSA, PSSD, and SRMIS were employed to increase the spatial resolution of proportion image of impervious surfaces and produce the hard classification map of impervious surfaces at subpixel scales. Compared with the SVM hard classifier, the three SRM methods produced better impervious surface maps in the two experiments because they determined where the impervious surfaces spatially distribute within a mixed pixel from the proportion image that tells only how many impervious surfaces are within a pixel. Especially, with the help of POIs, SRMIS generated slightly more accurate hard-classified impervious surface maps than PSA and PSSD in the two experiments. According to the accuracy assessment of the experimental results, the OA increase of SRMIS is from 2.34% to 5.59% for different methods in the first experiment while the OA of SRMIS is 1.34–3.09% higher than that of the compared methods in the second experiment. Compared with the traditional SVM hard classifier, the OA increases of the other two SRM methods (i.e., PSA and PSSD) are 1.13% and 2.25% in the first experiment using the zoom scale factor of 2, while the OA of PSA and PSSD is 1.13% and 1.75% greater than that of the traditional SVM hard classifier in the second experiment. Therefore, SRM methods, especially SRMIS, provide an alternative way to generate impervious surface maps with a higher spatial resolution than that of input remote sensing images for urban study. Although the proposed SRMIS method with POIs produced relatively satisfactory impervious surface maps (e.g., the OA is over 90% in the first experiment using the zoom scale factor of 2) with higher spatial resolutions than the input remote sensing images, other types of auxiliary data (e.g., the extent of POIs) may have potential to be incorporated in SRM methods in order to improve the accuracy of impervious surface maps. In future, more auxiliary data can be used to integrate into the SRM technique for mapping impervious surfaces.
4.2. Impact of the Density of POIs on SRMIS
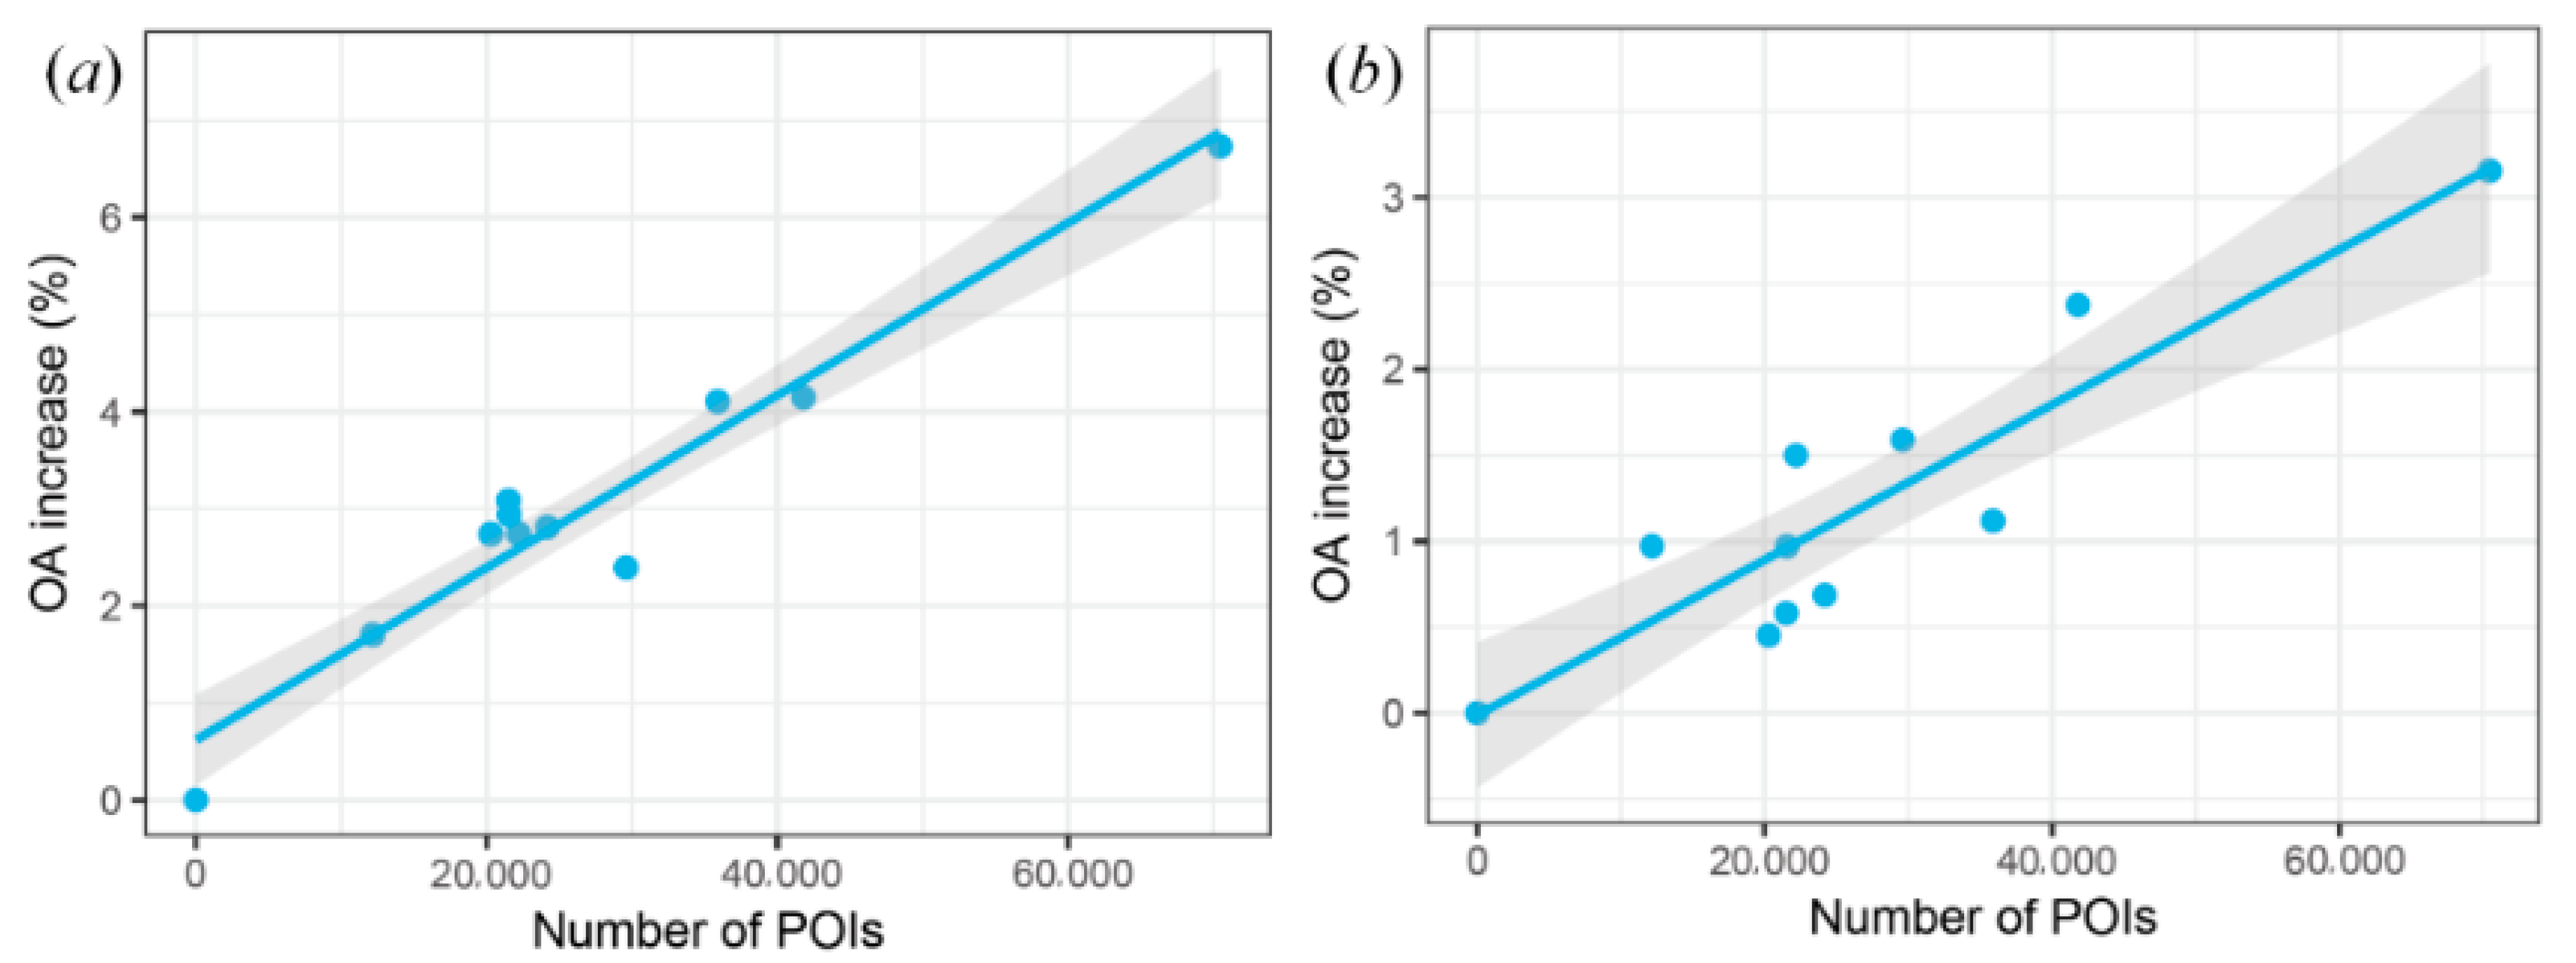
Although SRMIS increased the classification performance of impervious surfaces with the help of POIs, different regions have different numbers of POIs. Therefore, the performance of SRMIS was analyzed in different regions with different numbers of POIs. This study took the SRMIS map generated by the zoom scale factor of 2 from the Sentinel-2 image for an example. It can be found from the results of three subareas in Figure 4(e5–g5) that the classification image quality of impervious surfaces has different improvements with different numbers of POIs. The subarea-2 has the least POIs and only a few central subpixels were improved to correct classes in Figure 4(f5). The subarea-1 has a moderate number of POIs and the subpixels at the upper left part of the central pervious patch (i.e., vegetation) were correctly classified to impervious surfaces (i.e., buildings) with relatively more POIs than those in subarea-2. Subarea-3 has the most POIs and the improvement in the classification map is better than the other two subareas in Figure 4d. The reason is that the three ellipse areas with clustered POIs in Figure 4(g5) show improvement in mapping impervious and pervious surfaces in comparison with the results of PSA in Figure 4(g3) and PSSD in Figure 4(g4). Specifically, the connectivity of the roads in the left and right ellipse areas of Figure 4(g5) was preserved by SRMIS with the help of POIs. The connectivity of the green belt along a road in the central ellipse area of Figure 4(g5) was preserved under the constraints of POIs. However, the connectivity of the green belt and the roads in the left and right ellipse areas of Figure 4(g5) was not preserved by the SVM hard classifier in Figure 4(g2), PSA in Figure 4(g3), or PSSD in Figure 4(g4). To quantitatively evaluate the impact of the density of the POIs on the performance of SRMIS, the relationship between the density of POIs and OA increase within the administrative units of eleven districts in Nanjing was analyzed for the 5-m SRMIS map generated from the Sentinel-2 image and the 10-m SRMIS map generated from the Landsat 8 OLI image. The number of POIs and the OA increase within each district were first calculated and then they were plotted in Figure 6. It shows that the OA increase improved with an increase of POIs in the two experimental results when compared with the PSSD results. However, most OA increases range between 2% and 4% for the SRMIS map generated by the zoom scale factor of 2 from the Sentinel-2 image in Nanjing, whereas most OA increases range between 0.5% and 2% for the SRMIS result in the second experiment.
4.3. Impact of POI Uncertainty on SRMIS Maps
The proposed SRMIS was developed by incorporating relatively new big (geo)data (i.e., POIs) into an existing SRM method of PSSD to produce impervious surfaces at subpixel scales. According to the case study in Nanjing, SRMIS generated better classified image quality of impervious surfaces and greater accuracy with the complementary information from POIs than both the SVM hard classifier and PSSD. However, the uncertainty of POIs would affect the performance of SRMIS. First, POIs are points that only mark impervious surfaces with human activity; therefore, SRMIS cannot improve the mapping performance of the impervious surfaces without POIs and the result of these impervious surfaces is same as PSSD. Second, the acquisition time between remote sensing images and POIs is different and there may be inter-conversions between some impervious and pervious surfaces during the acquisition time period; additionally, SRMIS cannot enhance the performance of impervious surfaces in these areas. POIs usually appear after the presence of impervious surfaces because impervious surfaces are the basic conditions attracting human activities. Thus, POIs are better acquired after the remote sensing image acquisition. Third, although POIs can provide the location of some impervious surfaces, POIs cannot provide the extent of a POI. If the extent of a POI can be obtained, the performance of SRMIS would be improved. The extent of a POI can be characterized by the boundary of buildings. Some geospatial data companies can provide this service; however, the price of the boundary data of buildings is expensive. If the case study area is not too large, it is a good choice to buy the boundary data of buildings to improve the accuracy of impervious surfaces. An alternative method for obtaining the extent of a POI is an image recognition method that can be developed to recognize the boundary of buildings from online maps. Some online maps of China (e.g., http://map.qq.com/) provide tiles of online maps when an area is searched. Each tile is an image with a fixed size (e.g., 256 × 256 pixels) and may contain the boundary of POIs or buildings. In addition, SRMIS only used POIs related to impervious surfaces while other complementary data (e.g., water and scenic spots) related to pervious surfaces may have useful information to reduce the uncertainty in mapping impervious surfaces by SRM methods. Therefore, it is worthwhile considering these issues in future work.
5. Conclusions
This study presents a novel solution (i.e., SRMIS method) for extracting impervious surfaces at subpixel scales. The proposed SRMIS can take advantages of both SRM technique and the relatively new big (geo)data (i.e., POIs) to produce hard-classified impervious surface maps at subpixel scales according to the inputs of POIs and the proportion image derived from soft classification. The effectiveness of the proposed SRMIS was validated using two different remote sensing images of a Sentinel-2 image and a Landsat 8 OLI image of Nanjing city, China. The experimental results show that the overall accuracy (OA) increase of the proposed SRMIS is from 2.34% to 5.59% compared with the SVM hard classifier and two existing SRM methods in the first experiment; the OA of SRMIS is 1.34–3.09% higher than that of the compared methods in the second experiment. Meanwhile, the classification image quality of SRMIS outperforms the SVM hard classifier and two existing SRM methods in terms of visual evaluation. Hence, SRMIS provides a valuable way to combine SRM technique and POIs to extract impervious surface maps with a higher spatial resolution than that of the input remote sensing images for urban study.
Acknowledgments
This study was supported in part by the National Natural Science Foundation of China under Grant 41701376 and 41725006, in part by the Natural Science Foundation of Jiangsu Province under Grant BK20170866, in part by the Key Program of Chinese Academy of Sciences under Grant ZDRW-ZS-2016-6-3-4, in part by the Fundamental Research Funds for the Central Universities under Grant 2017B11714, in part by the China Postdoctoral Science Foundation under Grant 2016M600356, and in part by the State Key Laboratory of Resources and Environmental Information System.
Author Contributions
Yuehong Chen and Yong Ge conceived and designed this study, as well as wrote the paper; Yuehong Chen performed the experiments; Ru An and Yu Chen analyzed the experimental results and commented on the manuscript.
Conflicts of Interest
The authors declare no conflict of interest.
References
- Weng, Q.H. Remote sensing of impervious surfaces in the urban areas: Requirements, methods, and trends. Remote Sens. Environ. 2012, 117, 34–49. [Google Scholar] [CrossRef]
- Schueler, T.R. The importance of imperviousness. Watershed Prot. Tech. 1994, 1, 100–111. [Google Scholar]
- Kuang, W.H.; Chi, W.F.; Lu, D.S.; Dou, Y.Y. A comparative analysis of megacity expansions in China and the U.S.: Patterns, rates and driving forces. Landsc. Urban Plan. 2014, 132, 121–135. [Google Scholar] [CrossRef]
- Weng, Q.; Lu, D. A sub-pixel analysis of urbanization effect on land surface temperature and its interplay with impervious surface and vegetation coverage in Indianapolis, United States. Int. J. Appl. Earth Obs. Geoinf. 2008, 10, 68–83. [Google Scholar] [CrossRef]
- Imhoff, M.L.; Zhang, P.; Wolfe, R.E.; Bounoua, L. Urban heat island effect across biomes in the continental USA. Remote Sens. Environ. 2010, 114, 1920–1923. [Google Scholar] [CrossRef]
- Ridd, M.K. Exploring a V-I-S (vegetation-impervious surface-soil) model for urban ecosystem analysis through remote sensing: Comparative anatomy for cities. Int. J. Remote Sens. 1995, 16, 2165–2185. [Google Scholar] [CrossRef]
- Arnold, C.L.J.; Gibbons, C.J. Impervious surface coverage: The emergence of a key environmental indicator. J. Am. Plan. Assoc. 1996, 62, 243–258. [Google Scholar] [CrossRef]
- Shuster, W.D.; Bonta, J.; Thurston, H.; Warnemuende, E.; Smith, D.R. Impacts of impervious surface on watershed hydrology: A review. Urban Water J. 2005, 2, 263–275. [Google Scholar] [CrossRef]
- Linden, S.V.D.; Hostert, P. The influence of urban structures on impervious surface maps from airborne hyperspectral data. Remote Sens. Environ. 2009, 113, 2298–2305. [Google Scholar] [CrossRef]
- Fisher, P. The pixel: A snare and a delusion. Int. J. Remote Sens. 1997, 18, 679–685. [Google Scholar] [CrossRef]
- Foody, G.M.; Muslim, A.M.; Atkinson, P.M. Super-resolution mapping of the waterline from remotely sensed data. Int. J. Remote Sens. 2005, 26, 5381–5392. [Google Scholar] [CrossRef]
- Atkinson, P.M. Downscaling in remote sensing. Int. J. Appl. Earth Obs. Geoinf. 2013, 22, 106–114. [Google Scholar] [CrossRef]
- Wang, Q.; Atkinson, P.M. The effect of the point spread function on sub-pixel mapping. Remote Sens. Environ. 2017, 193, 127–137. [Google Scholar] [CrossRef]
- Hodgson, M.E.; Jensen, J.R.; Tullis, J.A.; Riordan, K.D.; Archer, C.M. Synergistic use of lidar and color aerial photography for mapping urban parcel imperviousness. Photogramm. Eng. Remote Sens. 2003, 69, 973–980. [Google Scholar] [CrossRef]
- Atkinson, P.M. Mapping sub-pixel boundaries from remotely sensed images. In Innovations in GIS 4; Kemp, Z., Ed.; Taylor and Francis: London, UK, 1997; pp. 166–180. [Google Scholar]
- Boucher, A.; Kyriakidis, P.C. Super-resolution land cover mapping with indicator geostatistics. Remote Sens. Environ. 2006, 104, 264–282. [Google Scholar] [CrossRef]
- Chen, Y.; Ge, Y.; Jia, Y. Integrating object boundary in super-resolution land cover mapping. IEEE J. Sel. Top. Appl. Earth Obs. Remote Sens. 2016, 10, 219–230. [Google Scholar] [CrossRef]
- Verhoeye, J.; De Wulf, R. Land cover mapping at sub-pixel scales using linear optimization techniques. Remote Sens. Environ. 2002, 79, 96–104. [Google Scholar] [CrossRef]
- Zhong, Y.; Wu, Y.; Xu, X.; Zhang, L. An adaptive subpixel mapping method based on map model and class determination strategy for hyperspectral remote sensing imagery. IEEE Trans. Geosci. Remote Sens. 2015, 53, 1411–1426. [Google Scholar] [CrossRef]
- Ling, F.; Du, Y.; Li, X.; Zhang, Y.; Xiao, F.; Fang, S.; Li, W. Superresolution land cover mapping with multiscale information by fusing local smoothness prior and downscaled coarse fractions. IEEE Trans. Geosci. Remote Sens. 2014, 52, 5677–5692. [Google Scholar] [CrossRef]
- Tatem, A.J.; Lewis, H.G.; Atkinson, P.M.; Nixon, M.S. Super-resolution land cover pattern prediction using a hopfield neural network. Remote Sens. Environ. 2002, 79, 1–14. [Google Scholar] [CrossRef]
- Wang, L.; Zhang, Y.; Li, J. Bp Neural Network Based Subpixel Mapping Method. In Intelligent Computing in Signal Processing and Pattern Recognition; Huang, D.-S., Li, K., Irwin, G.W., Eds.; Springer: Berlin, Germany, 2006; pp. 755–760. [Google Scholar]
- Li, X.; Ling, F.; Du, Y.; Feng, Q.; Zhang, Y. A spatial–temporal hopfield neural network approach for super-resolution land cover mapping with multi-temporal different resolution remotely sensed images. ISPRS J. Photogramm. Remote Sens. 2014, 93, 76–87. [Google Scholar] [CrossRef]
- Atkinson, P.M. Sub-pixel target mapping from soft-classified, remotely sensed imagery. Photogramm. Eng. Remote Sens. 2005, 71, 839–846. [Google Scholar] [CrossRef]
- Ling, F.; Li, X.; Du, Y.; Xiao, F. Sub-pixel mapping of remotely sensed imagery with hybrid intra- and inter-pixel dependence. Int. J. Remote Sens. 2013, 34, 341–357. [Google Scholar] [CrossRef]
- Mertens, K.C.; De Baets, B.; Verbeke, L.P.C.; de Wulf, R.R. A sub-pixel mapping algorithm based on sub-pixel/pixel spatial attraction models. Int. J. Remote Sens. 2006, 27, 3293–3310. [Google Scholar] [CrossRef]
- Wang, Q.; Wang, L.; Liu, D. Particle swarm optimization-based sub-pixel mapping for remote-sensing imagery. Int. J. Remote Sens. 2012, 33, 6480–6496. [Google Scholar] [CrossRef]
- Ardila, J.P.; Tolpekin, V.A.; Bijker, W.; Stein, A. Markov-random-field-based super-resolution mapping for identification of urban trees in VHR images. ISPRS J. Photogramm. Remote Sens. 2011, 66, 762–775. [Google Scholar] [CrossRef]
- Kasetkasem, T.; Arora, M.K.; Varshney, P.K. Super-resolution land cover mapping using a Markov random field based approach. Remote Sens. Environ. 2005, 96, 302–314. [Google Scholar] [CrossRef]
- Wang, L.G.; Wang, Q.M. Subpixel mapping using Markov random field with multiple spectral constraints from subpixel shifted remote sensing images. IEEE Geosci. Remote Sens. Lett. 2013, 10, 598–602. [Google Scholar] [CrossRef]
- Wang, Q.; Atkinson, P.M.; Shi, W. Indicator cokriging-based subpixel mapping without prior spatial structure information. IEEE Trans. Geosci. Remote 2015, 53, 309–323. [Google Scholar] [CrossRef]
- Shi, Z.; Li, P.; Jin, H.; Tian, Y.; Chen, Y.; Zhang, X. Improving super-resolution mapping by combining multiple realizations obtained using the indicator-geostatistics based method. Remote Sens. 2017, 9, 773. [Google Scholar] [CrossRef]
- Wang, Q.; Shi, W.; Atkinson, P.M. Sub-pixel mapping of remote sensing images based on radial basis function interpolation. ISPRS J. Photogramm. Remote Sens. 2014, 92, 1–15. [Google Scholar] [CrossRef]
- Chen, Y.; Ge, Y.; Song, D. Superresolution land-cover mapping based on high-accuracy surface modeling. IEEE Geosci. Remote Sens. Lett. 2015, 12, 2516–2520. [Google Scholar] [CrossRef]
- Ling, F.; Du, Y.; Li, X.; Li, W.; Xiao, F.; Zhang, Y. Interpolation-based super-resolution land cover mapping. Remote Sens. Lett. 2013, 4, 629–638. [Google Scholar] [CrossRef]
- Ge, Y.; Chen, Y.; Stein, A.; Li, S.; Hu, J. Enhanced sub-pixel mapping with spatial distribution patterns of geographical objects. IEEE Trans. Geosci. Remote Sens. 2016, 54, 2356–2370. [Google Scholar] [CrossRef]
- Xu, X.; Zhong, Y.; Zhang, L. Adaptive subpixel mapping based on a multiagent system for remote-sensing imagery. IEEE Trans. Geosci. Remote 2014, 52, 787–804. [Google Scholar] [CrossRef]
- Zhang, Y.; Atkinson, P.M.; Li, X.; Ling, F.; Wang, Q.; Du, Y. Learning-based spatia-temporal superresolution mapping of forest cover with MODIS images. IEEE Trans. Geosci. Remote 2017, 55, 600–614. [Google Scholar] [CrossRef]
- Li, X.; Ling, F.; Foody, G.M.; Du, Y. Improving super-resolution mapping through combining multiple super-resolution land-cover maps. Int. J. Remote Sens. 2016, 37, 2415–2432. [Google Scholar] [CrossRef]
- Li, X.; Ling, F.; Du, Y.; Zhang, Y. Spatially adaptive superresolution land cover mapping with multispectral and panchromatic images. IEEE Trans. Geosci. Remote 2014, 52, 2810–2823. [Google Scholar] [CrossRef]
- Chen, Y.; Ge, Y.; Heuvelink, G.B.M.; Hu, J.; Jiang, Y. Hybrid constraints of pure and mixed pixels for soft-then-hard super-resolution mapping with multiple shifted images. IEEE J. Sel. Top. Appl. Earth Obs. Remote Sens. 2015, 8, 2040–2052. [Google Scholar] [CrossRef]
- Li, X.; Du, Y.; Ling, F. Super-resolution mapping of forests with bitemporal different spatial resolution images based on the spatial-temporal Markov random field. IEEE J. Sel. Top. Appl. Earth Obs. Remote Sens. 2014, 7, 29–39. [Google Scholar]
- Huang, C.; Chen, Y.; Wu, J. Dem-based modification of pixel-swapping algorithm for enhancing floodplain inundation mapping. Int. J. Remote Sens. 2014, 35, 365–381. [Google Scholar] [CrossRef]
- Li, L.Y.; Chen, Y.; Xu, T.B.; Liu, R.; Shi, K.F.; Huang, C. Super-resolution mapping of wetland inundation from remote sensing imagery based on integration of back-propagation neural network and genetic algorithm. Remote Sens. Environ. 2015, 164, 142–154. [Google Scholar] [CrossRef]
- Ge, Y.; Jiang, Y.; Chen, Y.; Stein, A.; Jiang, D.; Jia, Y. Designing an experiment to investigate subpixel mapping as an alternative method to obtain land use/land cover maps. Remote Sens. 2016, 8, 360. [Google Scholar] [CrossRef]
- Ling, F.; Xiao, F.; Du, Y.; Xue, H.; Ren, X. Waterline mapping at the subpixel scale from remote sensing imagery with high-resolution digital elevation models. Int. J. Remote Sens. 2008, 29, 1809–1815. [Google Scholar] [CrossRef]
- Muad, A.M.; Foody, G.M. Super-resolution mapping of lakes from imagery with a coarse spatial and fine temporal resolution. Int. J. Appl. Earth Obs. Geoinf. 2012, 15, 79–91. [Google Scholar] [CrossRef]
- Ling, F.; Du, Y.; Zhang, Y.H.; Li, X.D.; Xiao, F. Burned-area mapping at the subpixel scale with MODIS images. IEEE Geosci. Remote Sens. Lett. 2015, 12, 1963–1967. [Google Scholar] [CrossRef]
- Yue, Y.; Zhuang, Y.; Yeh, A.G.O.; Xie, J.-Y.; Ma, C.-L.; Li, Q.-Q. Measurements of poi-based mixed use and their relationships with neighbourhood vibrancy. Int. J. Geogr. Inf. Sci. 2017, 31, 658–675. [Google Scholar] [CrossRef]
- Yu, W.; Ai, T.; He, Y.; Shao, S. Spatial co-location pattern mining of facility points-of-interest improved by network neighborhood and distance decay effects. Int. J. Geogr. Inf. Sci. 2017, 31, 280–296. [Google Scholar] [CrossRef]
- Yao, Y.; Li, X.; Liu, X.; Liu, P.; Liang, Z.; Zhang, J.; Mai, K. Sensing spatial distribution of urban land use by integrating points-of-interest and google word2vec model. Int. J. Geogr. Inf. Sci. 2017, 31, 825–848. [Google Scholar] [CrossRef]
- Jiang, S.; Alves, A.; Rodrigues, F.; Ferreira, J.; Pereira, F.C. Mining point-of-interest data from social networks for urban land use classification and disaggregation. Comput. Environ. Urban Syst. 2015, 53, 36–46. [Google Scholar] [CrossRef]
- Elwood, S.; Goodchild, M.F.; Sui, D.Z. Researching volunteered geographic information: Spatial data, geographic research, and new social practice. Ann. Assoc. Am. Geogr. 2012, 102, 571–590. [Google Scholar] [CrossRef]
- Yuan, J.; Zheng, Y.; Xie, X. Discovering regions of different functions in a city using human mobility and POIs. In Proceedings of the ACM SIGKDD International Conference on Knowledge Discovery and Data Mining, Beijing, China, 12–16 August 2012; pp. 186–194. [Google Scholar]
- Zheng, Y.; Capra, L.; Wolfson, O.; Yang, H. Urban computing: Concepts, methodologies, and applications. ACM Trans. Intell. Syst. Technol. 2014, 5, 38. [Google Scholar] [CrossRef]
- Liu, Y.; Liu, X.; Gao, S.; Gong, L.; Kang, C.; Zhi, Y.; Chi, G.; Shi, L. Social sensing: A new approach to understanding our socioeconomic environments. Ann. Assoc. Am. Geogr. 2015, 105, 512–530. [Google Scholar] [CrossRef]
- Chen, Y.; Ge, Y.; Wang, Q.; Jiang, Y. A subpixel mapping algorithm combining pixel-level and subpixel-level spatial dependences with binary integer programming. Remote Sens. Lett. 2014, 5, 902–911. [Google Scholar] [CrossRef]
- Wang, Q.; Shi, W.; Wang, L. Allocating classes for soft-then-hard subpixel mapping algorithms in units of class. IEEE Trans. Geosci. Remote Sens. 2014, 52, 2940–2959. [Google Scholar] [CrossRef]
- Chang, C.C.; Lin, C.J. Libsvm: A library for support vector machines. ACM Trans. Intell. Syst. Technol. 2001, 2, 1–27. [Google Scholar] [CrossRef]
Figure 1.
An example of the implementation of super-resolution mapping of impervious surfaces (SRMIS).
Figure 1.
An example of the implementation of super-resolution mapping of impervious surfaces (SRMIS).

Figure 2.
Flowchart of the experiment.

Figure 3.
Experiment on a Sentinel-2 image. (a) A 10-m Sentinel image; (b) Points of interest (POIs); (c) Validation image; (d) Proportion image of impervious surfaces.
Figure 3.
Experiment on a Sentinel-2 image. (a) A 10-m Sentinel image; (b) Points of interest (POIs); (c) Validation image; (d) Proportion image of impervious surfaces.

Figure 4.
Experimental results using a Sentinel-2 image. (a) Support vector machine (SVM) hard classification map (10-m); (b) Subpixel-swapping algorithm (PSA) map (5-m); (c) Subpixel-level spatial dependences (PSSD) map (5-m); (d) SRMIS map (5-m). (e1–e6) are the POIs, SVM hard classification result, PSA result, PSSD result, SRMIS result, and validation image in subarea-1, respectively. (f1–f6) are the POIs, SVM hard classification result, PSA result, PSSD result, SRMIS result, and validation image in subarea-2, respectively. (g1–g5) are the POIs, SVM hard classification, PSA, PSSD, and SRMIS results in subarea-3, respectively.

Figure 5.
Experimental results using a Landsat 8 OLI image. (a) Landsat 8 OLI image (30 m); (b) SVM hard classification map (30 m); (c) PSA map (10 m); (d) PSSD map (10 m); (e) SRMIS map (10 m). (i–iv) are the SVM hard classification, PSA, PSSD, and SRMIS results in a subarea, respectively.
Figure 5.
Experimental results using a Landsat 8 OLI image. (a) Landsat 8 OLI image (30 m); (b) SVM hard classification map (30 m); (c) PSA map (10 m); (d) PSSD map (10 m); (e) SRMIS map (10 m). (i–iv) are the SVM hard classification, PSA, PSSD, and SRMIS results in a subarea, respectively.

Figure 6.
Relationship between the number of POIs (x-axis) and the overall accuracy (OA) increase (y-axis) for SRMIS results. (a) The 5-m SRMIS map generated from the Sentinel-2 image; (b) The 10-m SRMIS map generated from the Landsat 8 OLI image.
Figure 6.
Relationship between the number of POIs (x-axis) and the overall accuracy (OA) increase (y-axis) for SRMIS results. (a) The 5-m SRMIS map generated from the Sentinel-2 image; (b) The 10-m SRMIS map generated from the Landsat 8 OLI image.


Table 1.
The number of points of interest (POIs) for each category in Nanjing.
| Category | FD | SP | LS | RC | CS | HC | HS | CV | SS | BF | IE | RA |
|---|---|---|---|---|---|---|---|---|---|---|---|---|
| Number | 52,435 | 80,853 | 47,806 | 14,310 | 1384 | 7427 | 7513 | 2541 | 11,912 | 7148 | 22,356 | 43,955 |
FD: food and drink, SP: shopping places, RC: recreation centers, CS: car service places, HC: health care, HS: hotels, CV: cultural venues, SS: schools, BF: banks and finance, IE: infrastructure, RA: residential areas, LS: life service places including travel agency, express sites, business offices, etc.
Table 2.
Accuracy assessment for the classification results using a Sentinel-2 image.
| Hard Classification | PSA | PSSD | SRMIS | ||||
|---|---|---|---|---|---|---|---|
| S = 2 | S = 4 | S = 2 | S = 4 | S = 2 | S = 4 | ||
| OA (%) | 84.91 | 86.04 | 84.04 | 87.16 | 85.55 | 90.50 | 87.89 |
| Kappa | 0.6977 | 0.7204 | 0.6803 | 0.7428 | 0.7108 | 0.8097 | 0.7575 |
Table 3.
Accuracy assessment for the classification results using a Landsat 8 OLI image.
| Hard Classification | PSA | PSSD | SRMIS | |
|---|---|---|---|---|
| OA (%) | 76.16 | 77.29 | 77.91 | 79.25 |
| Kappa | 0.5229 | 0.5458 | 0.5582 | 0.5850 |
© 2018 by the authors. Licensee MDPI, Basel, Switzerland. This article is an open access article distributed under the terms and conditions of the Creative Commons Attribution (CC BY) license (http://creativecommons.org/licenses/by/4.0/).
Share and Cite
MDPI and ACS Style
Chen, Y.; Ge, Y.; An, R.; Chen, Y. Super-Resolution Mapping of Impervious Surfaces from Remotely Sensed Imagery with Points-of-Interest. Remote Sens. 2018, 10, 242. https://doi.org/10.3390/rs10020242
AMA Style
Chen Y, Ge Y, An R, Chen Y. Super-Resolution Mapping of Impervious Surfaces from Remotely Sensed Imagery with Points-of-Interest. Remote Sensing. 2018; 10(2):242. https://doi.org/10.3390/rs10020242
Chicago/Turabian StyleChen, Yuehong, Yong Ge, Ru An, and Yu Chen. 2018. "Super-Resolution Mapping of Impervious Surfaces from Remotely Sensed Imagery with Points-of-Interest" Remote Sensing 10, no. 2: 242. https://doi.org/10.3390/rs10020242
Note that from the first issue of 2016, this journal uses article numbers instead of page numbers. See further details here.