Article

Validation of the SARAH-E Satellite-Based Surface Solar Radiation Estimates over India

1
Finnish Meteorological Institute, Erik Palménin aukio 1, P.O. Box 503, FI-00101 Helsinki, Finland
2
The Energy and Resources Institute, Darbari Seth Block, IHC Complex, Lodhi Road, New Delhi 110003, India
3
TERI School of Advanced Studies, Vasant Kunj Institutional Area 10, New Delhi 110070, India
*
Author to whom correspondence should be addressed.
Remote Sens. 2018, 10(3), 392; https://doi.org/10.3390/rs10030392
Submission received: 15 December 2017 / Revised: 28 February 2018 / Accepted: 2 March 2018 / Published: 3 March 2018
(This article belongs to the Special Issue Solar Radiation, Modelling and Remote Sensing)

Abstract

:
We evaluate the accuracy of the satellite-based surface solar radiation dataset called Surface Solar Radiation Data Set - Heliosat (SARAH-E) against in situ measurements over a variety of sites in India between 1999 and 2014. We primarily evaluate the daily means of surface solar radiation. The results indicate that SARAH-E consistently overestimates surface solar radiation, with a mean bias of 21.9 W/m2. The results are complicated by the fact that the estimation bias is stable between 1999 and 2009 with a mean of 19.6 W/m2 but increases sharply thereafter as a result of rapidly decreasing (dimming) surface measurements of solar radiation. In addition, between 1999 and 2009, both in situ measurements and SARAH-E estimates described a statistically significant (at 95% confidence interval) trend of approximately −0.6 W/m2/year, but diverged strongly afterward. We investigated the cause of decreasing solar radiation at one site (Pune) by simulating clear-sky irradiance with local measurements of water vapor and aerosols as input to a radiative transfer model. The relationship between simulated and measured irradiance appeared to change post-2009, indicating that measured changes in the clear-sky aerosol loading are not sufficient to explain the rapid dimming in measured total irradiance. Besides instrumentation biases, possible explanations in the diverging measurements and retrievals of solar radiation may be found in the aerosol climatology used for SARAH-E generation. However, at present, we have insufficient data to conclusively identify the cause of the increasing retrieval bias. Users of the datasets are advised to be aware of the increasing bias when using the post-2009 data.

1. Introduction

India has experienced an extended period of rapid economic growth driven largely by coal-based nonrenewable energy production [1]. Given the climatic and environmental issues inherent in reliance on nonrenewable energy sources, the Indian Government has recently launched an ambitious initiative to substantially increase solar energy production at a national level [2,3]. As a low-latitude country, India has a large solar resource at its disposal. However, for planning the locations and production capability of the solar energy plants, accurate mapping of the surface incoming solar radiation (SSR), or global radiation as it is also called, is required.
For spatiotemporally comprehensive mapping of SSR over the Indian subcontinent, satellite-based remote sensing offers the most cost effective solution. To answer this need, the Satellite Application Facility on Climate Monitoring (CM SAF), a project of the European Organization for the Exploitation of Weather Satellites (EUMETSAT), has developed and released a long-term dataset. This dataset, called Surface Solar Radiation Data Set—Heliosat, Meteosat-East (SARAH-E), Edition 1 [4,5], is a satellite-based climate data record of the solar radiative quantities over India and surrounding regions. The dataset is derived from observations of the reflected solar radiation from the geostationary Meteosat Indian Ocean Data Coverage (IODC) satellites. The dataset spans 15 years at a spatial resolution of 0.05°.
In addition to SARAH-E, there exists a growing number of satellite-derived datasets of SSR, calculated with a variety of algorithms for both regional [6,7] and global coverage [8,9,10]. A multitude of studies also exists on the validation of said datasets (e.g., [11,12,13]), but to our knowledge, satellite-based SSR estimates, including SARAH-E, have not been validated over India at the sub-continental scale. Therefore, to facilitate the use of this satellite-based dataset, we must be able to ascertain its accuracy in determining SSR, its seasonal cycle and any possible trends. The goal of this paper is to provide this information, specifically answering these research questions:
  • What is the accuracy of the SARAH-E dataset against quality controlled in situ SSR measurements from sites all across India? Is the SSR estimation accuracy stable over time? Are there regional differences in SSR estimation bias?
  • Are the source datasets in general robust and long-term enough for reliable trend determination? If yes, what can we say about trends in SSR over India over the past 15 years? Do the satellite-based estimates agree with in situ measurements over the magnitude and direction of the trends?
We use ~120 station-years of in situ SSR measurement data from 17 sites across India, maintained by the India Meteorological Department (IMD), as our reference. The sites cover a wide variety of environmental conditions, from rural mountainous areas to sites located in India’s largest cities. The paper is organized as follows: We first summarize the primary parameters of the SARAH-E dataset, followed by a description of the in situ measurement dataset, its accuracy, and quality control measures. We then present the validation methods, metrics, and the study results themselves. The paper concludes with a discussion of the obtained results and the conclusions drawn.
Although the SARAH-E dataset also contains estimates for direct solar radiation, here we focus exclusively on investigation of the SSR estimate. In this study, when referring to a daily mean SSR, we mean the 24-h mean of insolation. Further, monthly mean SSR values are derived from averaging the daily means to enable comparability between the satellite estimates, provided at daily mean resolution, and the in situ data, provided on an hourly basis.

2. Materials and Methods

2.1. SARAH-E

The SARAH-E satellite dataset being evaluated covers 1999–2015, with a spatial resolution of 0.05 degrees, based on observations from the Meteosat Visible Infra-Red Imager (MVIRI) instruments on board the Meteosat First Generation (MFG) satellites 5 and 7 [4,5]. Here, we validate the daily means of SARAH-E. The year 2006 was not processed in the original release of SARAH-E; however, it was post-processed and provided for this validation study, to be later included in the publicly available data. In Figure 1, we illustrate the average SSR in June over the Indian subcontinent between 1999 and 2015, based on averaging the relevant daily means.
The retrieved SSR in SARAH-E is based on the following equation:
SSR = SSR CLR ( 1 CAL )
where SSRCLR is the clear-sky irradiance and CAL is the effective cloud albedo, as observed by the satellite imager (CAL is also referred to as cloud index). The method, also known as the Heliosat method [14,15,16], is based on the concept that all solar radiation entering the Earth’s atmosphere will either be reflected away by the cloud cover or will penetrate it to reach the surface as (attenuated) solar irradiance. Therefore, the absorbing and scattering impacts on SSR from atmospheric constituents such as aerosols or water vapor, or variable solar geometry conditions are accounted for in the calculation of the clear-sky irradiance SSRCLR. Absorption and saturation effects in optically thick clouds (CAL > 0.8) are considered through adjustment of the cloud albedo. The clear-sky irradiance is obtained from a linear interpolation of a look-up-table (LUT) of precomputed irradiances from the libRadTran model (Mayer and Kylling, 2005) for a wide range of atmospheric states [5]. Full retrieval details are available in Gracia-Amillo et al. [4].
The atmospheric state inputs considered in SARAH-E are the total atmospheric water vapor, aerosol optical depth (at 550 nm) and type, and ozone content. Water vapor data are from the monthly means of the ERA-Interim reanalysis [17]. Aerosols are considered as a climatology, calculated from the 2003–2010 monthly means of the Monitoring Atmospheric Composition and Climate (MACC) dataset [18,19]. Ozone content is considered through climatological values from standard profiles of the Max-Planck Institute of Air Chemistry [20].
Furthermore, the effective cloud albedo in SARAH-E is calculated from the following equation:
CAL =   C VIS C CLS C MAX C CLS
where all terms are based on observed digital counts of the MVIRI instrument, i.e., uncalibrated observed reflectivities. CVIS is the observed count of the observation (pixel value) for which CAL is to be determined, CCLS is an iteratively precomputed clear-sky count for the observed time slot and pixel (keeping in mind that the viewing geometry is fixed), and CMAX is the typical (statistical) maximum reflectivity count for thick bright clouds, precomputed as the 95th percentile of observed counts in a region within 45.8°S–52.7°S and 40°E–56°E, known for being consistently very cloudy. Before usage in this equation, the MVIRI counts are corrected for the instrument dark current as well as variations in Sun–Earth distance and Solar Zenith Angle. CMAX is also corrected for the effects of varying scattering angle between time slots. See Gracia-Amillo et al. [4] for further details on SARAH-E calculations.

2.2. In Situ SSR Measurements

The India Meteorological Department (IMD) operates a network of sites where SSR is observed on a regular basis. Time series of SSR observations from this network forms the primary in situ reference data source of this study. The locations of the sites are shown in Figure 1 and their primary attributes are listed in Table 1. The provided SSR observations were daytime hourly means only (05:00–20:00 Indian time), extended here into full 24-h days with nighttime hours set to zero irradiance.
The IMD irradiance measurement network is described in detail in Soni et al. [21]. The sites operate WMO Class 1 or 2 pyranometers, with periodic re-calibrations every two years against reference standards (cavity pyrheliometer as primary, PSP pyranometers as secondary) according to present knowledge. For most of the sites, a change of pyranometer instrumentation and data loggers took place in 2009 to equipment manufactured by Apogee Instruments and EKO Instruments. The pyranometers are cleaned and maintained daily at principal measurement sites (e.g., Pune). The provided hourly averages were subjected to further quality assurance procedures (see below).
The sites represent a wide variety of atmospheric and surface regimes, from the dry, arid conditions of Jodhpur and Jaipur to the yearlong tropical monsoon climate of Trivandrum in the south. The summer monsoon season (southwest monsoon; June–September) brings intensive cloudiness and rainfall to sites in the central and southern parts of the subcontinent. Sites in the north such as Sri Nagar are also affected by the monsoon, but to a much lesser degree [22]. Some sites, such as Chennai, also experience rains during the northeast monsoon during October–December, further altering their annual rainfall cycle.
In terms of aerosol properties, the sites again display a complex variety of conditions and annual cycles. During the monsoon, sea salts and marine dust form the dominant contribution to aerosol loading over coastal sites, also impacting inland sites in the central and southern parts of the subcontinent. On the other hand, rainfall scavenging during monsoon often lowers the overall aerosol loading of the atmosphere [23]. Anthropogenic industrial and automotive sources have a large impact on aerosol loading over the urban, densely industrialized sites such as Hyderabad or Bangalore [24,25]. Increased biomass burning during the cooler winter months leads to an increase in aerosol loading over several urban sites, such as Kolkata [26]. Dust storms are a major natural source of aerosol loading over the arid sites in Northern India (Jodhpur and Jaipur) [27]. Because of its location in the foothills of the Himalayas, Shillong is the only site in the study with a relatively clean atmosphere, with AOD generally in the range of 0.2–0.25 [28].

2.3. Quality Assurance of SSR Measurements

Quality control of in situ SSR measurements is a critical component to be undertaken prior to any analysis [29,30,31]. A series of quality control tests were made to ensure the robustness of the reference SSR dataset and to provide both liberal and conservative quality control limits for the dataset. The tests conducted were the BSRN (Baseline Surface Radiation Network) quality check made by Long and Dutton [32] for the use of irradiance data quality control in the BSRN program, a 0-limit for daytime values, and percentile based upper and lower limits. In addition to the tests, some basic quality control measures were taken. The data were found to have some measurement periods with a fixed SSR; these periods were all discarded as unphysical.
The BSRN quality check has a limit for physically possible and extremely rare values. The extremely rare-limit was used here, for which the lower limit is −2 W/m², and the upper limit is calculated with:
BSRN upper =   S a × 1.2 × μ 0 1.2 + 50 W m 2
where Sa = S0/AU², S0 is the solar constant at mean Earth–Sun distance, AU is the Earth–Sun distance in astronomical units, μ0 equals the cosine of SZA, and SZA is the solar zenith angle [32]. In the calculation of the astronomical quantities and solar position, the python-pvlib package was used [33]. The 0-limit for daytime irradiance values was necessary as several days with 0 W/m² measurements for daytime irradiance were found after applying the BSRN limits. All irradiances of 0 W/m2 for times when SZA < 90 degrees were considered unrealistic and thus removed. All irradiances exceeding the upper limit or below the lower limit in BSRN were removed. As only days with full coverage (24 available one-hour averages) are used in this analysis, this approach provides the highest coverage without affecting the data reliability.
To provide a more conservative quality control test, percentile based limits were calculated from the data to remove some of the physically possible, yet highly unlikely irradiances from both lower and higher ends of the data. This was made by dividing the data into bins by calendar month and time of day. The lower percentile limit was determined as the 1st percentile of each bin, and the upper limit as the 98th percentile with 20% of the 98th percentile added as follows:
Percentile top limit = 98th percentile + 98th percentile × 0.2.
Note that the data used for the calculation of percentiles contain only the days for which full coverage remains after the BSRN and 0-limit corrections. Other percentiles were tested; however, the aforementioned limits were found to limit the erroneous values appropriately with little effect on the data distribution. The percentile limits were also combined to form the most conservative set of limits. As the validation metrics showed a dependence of less than 1 W/m2 on the chosen set of QA limits, we present only the in situ data that have passed the most rigorous QA testing in the subsequent analysis. The original dataset consisted of 74,719 days of observations (204.71 station-years). The various QA phases discarded a fraction of these observations as follows (cumulative and relative to the original dataset): BSRN testing, 17.34%; daytime 0-limit filtering, 31.27%; percentile top limit, 33.20%; lower percentile limit, 35.76%; and top and low percentile limit combined, 37.54%. Therefore, after the strictest set of QA measures, a total of 46,670 full days of observations (127.86 station-years) remained for the validation. A visualization of the limits employed is available as Figure S1.
As a further QA measure, we obtained level 1.5 (V3) measurement data on aerosols and water vapor from the Aerosol Robotic Network (AERONET) site at Pune, spanning 2004–2014 [34]. These cloud-screened AERONET measurements acted as inputs for the python-pvlib implementation of the Simplified Solis radiative transfer model [35], which provided an independent estimate of clear-sky SSR to compare against the in situ SSR measurements at Pune. The comparison is presented in Section 3. In addition to Pune, the AERONET site at Jaipur also possesses a relatively long-term measurement record. However, the Jaipur AERONET data begin in 2009 when the SSR measurements end at the IMD site, thus no comparison at this site was possible.

2.4. Validation Metrics and Methods

We have chosen to use validation methods and metrics applied in past studies (e.g., [11,13,36]) to facilitate easier comparison of results. Thus, for each site, we report the Mean Bias Difference, Mean Absolute Bias Difference and Root Mean Square Difference (MBD, MABD and RMSD, respectively):
MBD = 1 n i = 1 n ( SIS i F i )
MABD = 1 n i = 1 n | SIS i F i |
RMSD = i = 1 n ( SIS i F i ) 2 n
where SIS is the satellite-derived SSR, F is the site-measured SSR, and n is the number of available valid observations (in the period in question).
The in situ SSR measurement data were spatiotemporally collocated to the SARAH-E satellite-based estimates. The hourly in situ data were averaged into daily means, discarding any days with missing hourly measurements. The daily means were then spatially matched with SARAH-E daily means using a nearest-neighbor search. A nearest-neighbor collocation retains the basic impediment of a point-to-pixel comparison, however, the representativeness impact into SSR bias determination has been studied over Europe and generally found to be very small for a spatial resolution of 0.05 degrees, such as SARAH-E [37]. However, this result may not hold for sites in mountainous terrain with rapidly varying topography. In this study, the site at Sri Nagar is potentially such a site, but we have retained its measurements for completeness.

3. Results and Discussion

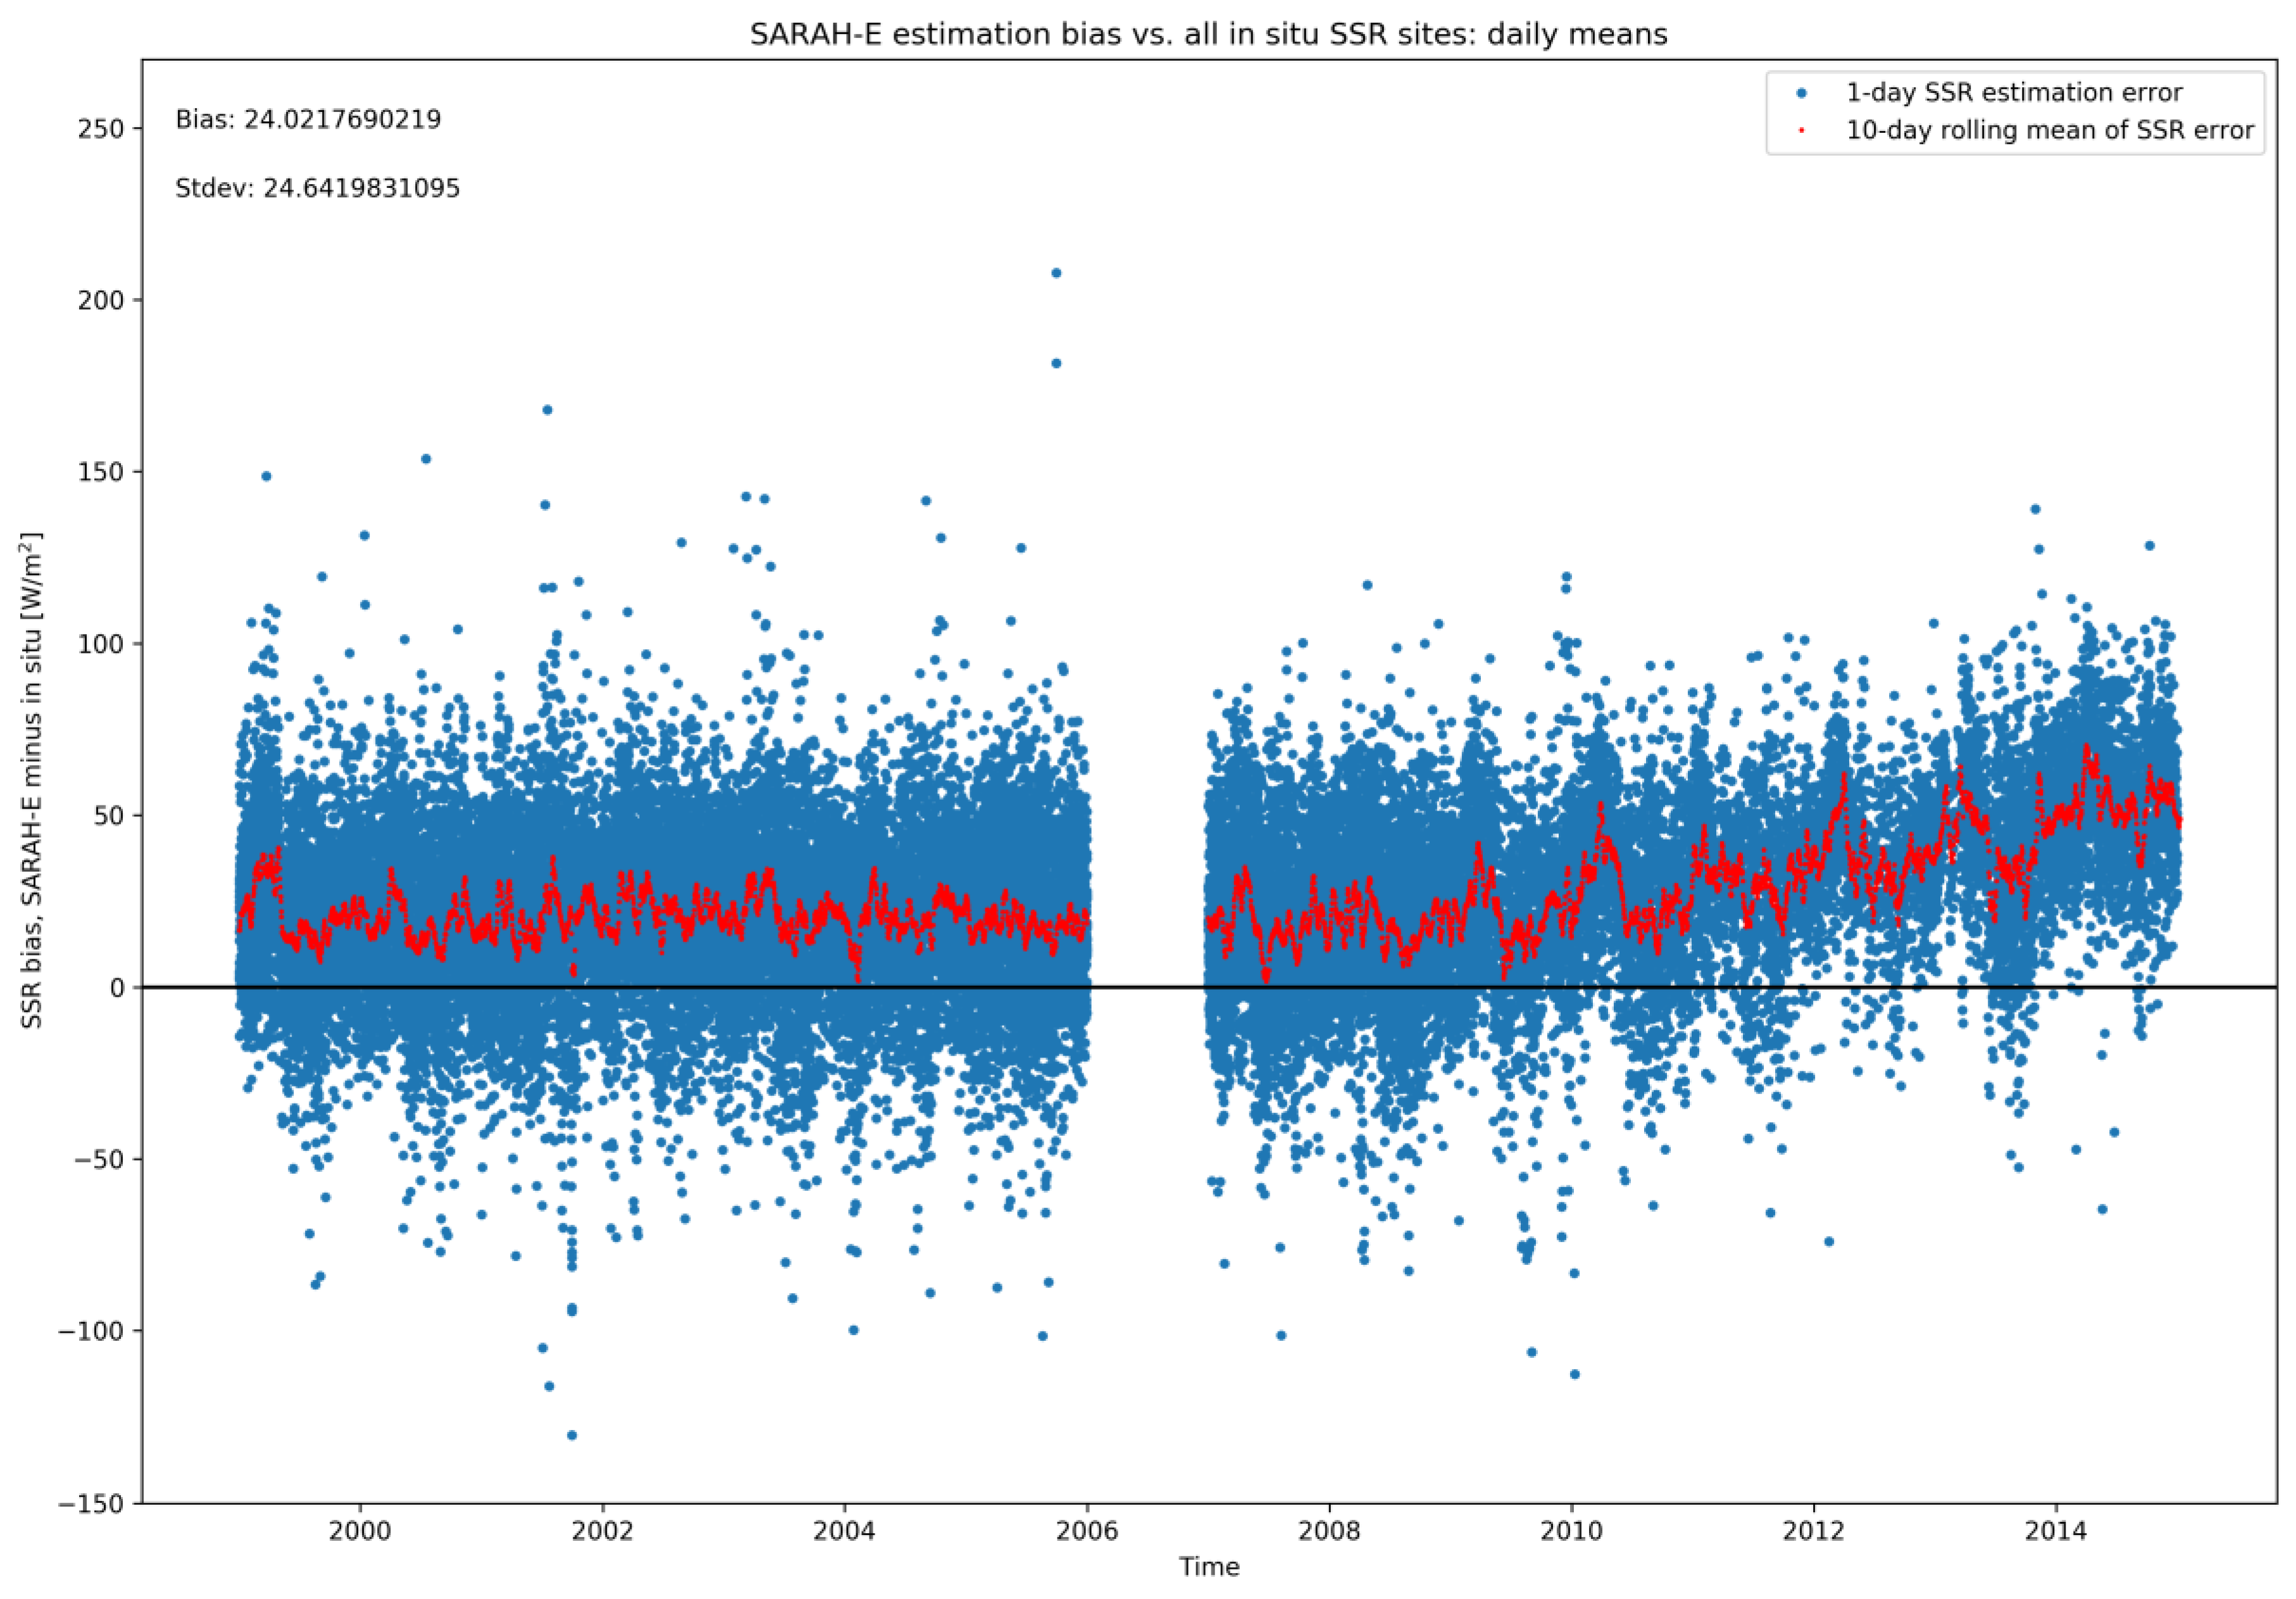
We begin with a general overview of SARAH-E performance. Figure 2 shows the temporal evolution of the SARAH-E SSR estimation bias against all in situ measurement sites with valid data. The result suggests very stable estimation precision and scatter between 1999 and 2009, but increasing and more variable estimation bias since then. The difference in annual mean SSR bias between 2013 and 2000 is 23.9 W/m2, while the annual mean bias between 1999 and 2009 varied by less than 5 W/m2.
We point out that the in situ data shown here have been filtered with the strictest set of tests, i.e., BSRN tests combined with discarding realistic but improbable daily means with SSR in the lowest 1%, or in the highest 98% + 0.2 × 98%. We point out that the mean bias or standard deviation of the full comparison varied by less than 1 W/m2 between this set and the set filtered with the basic BSRN tests, making the choice of filter conditions of secondary important. Because IMD measurements were available only until 2014, the 2015 SARAH-E data are not included and do not affect the results.
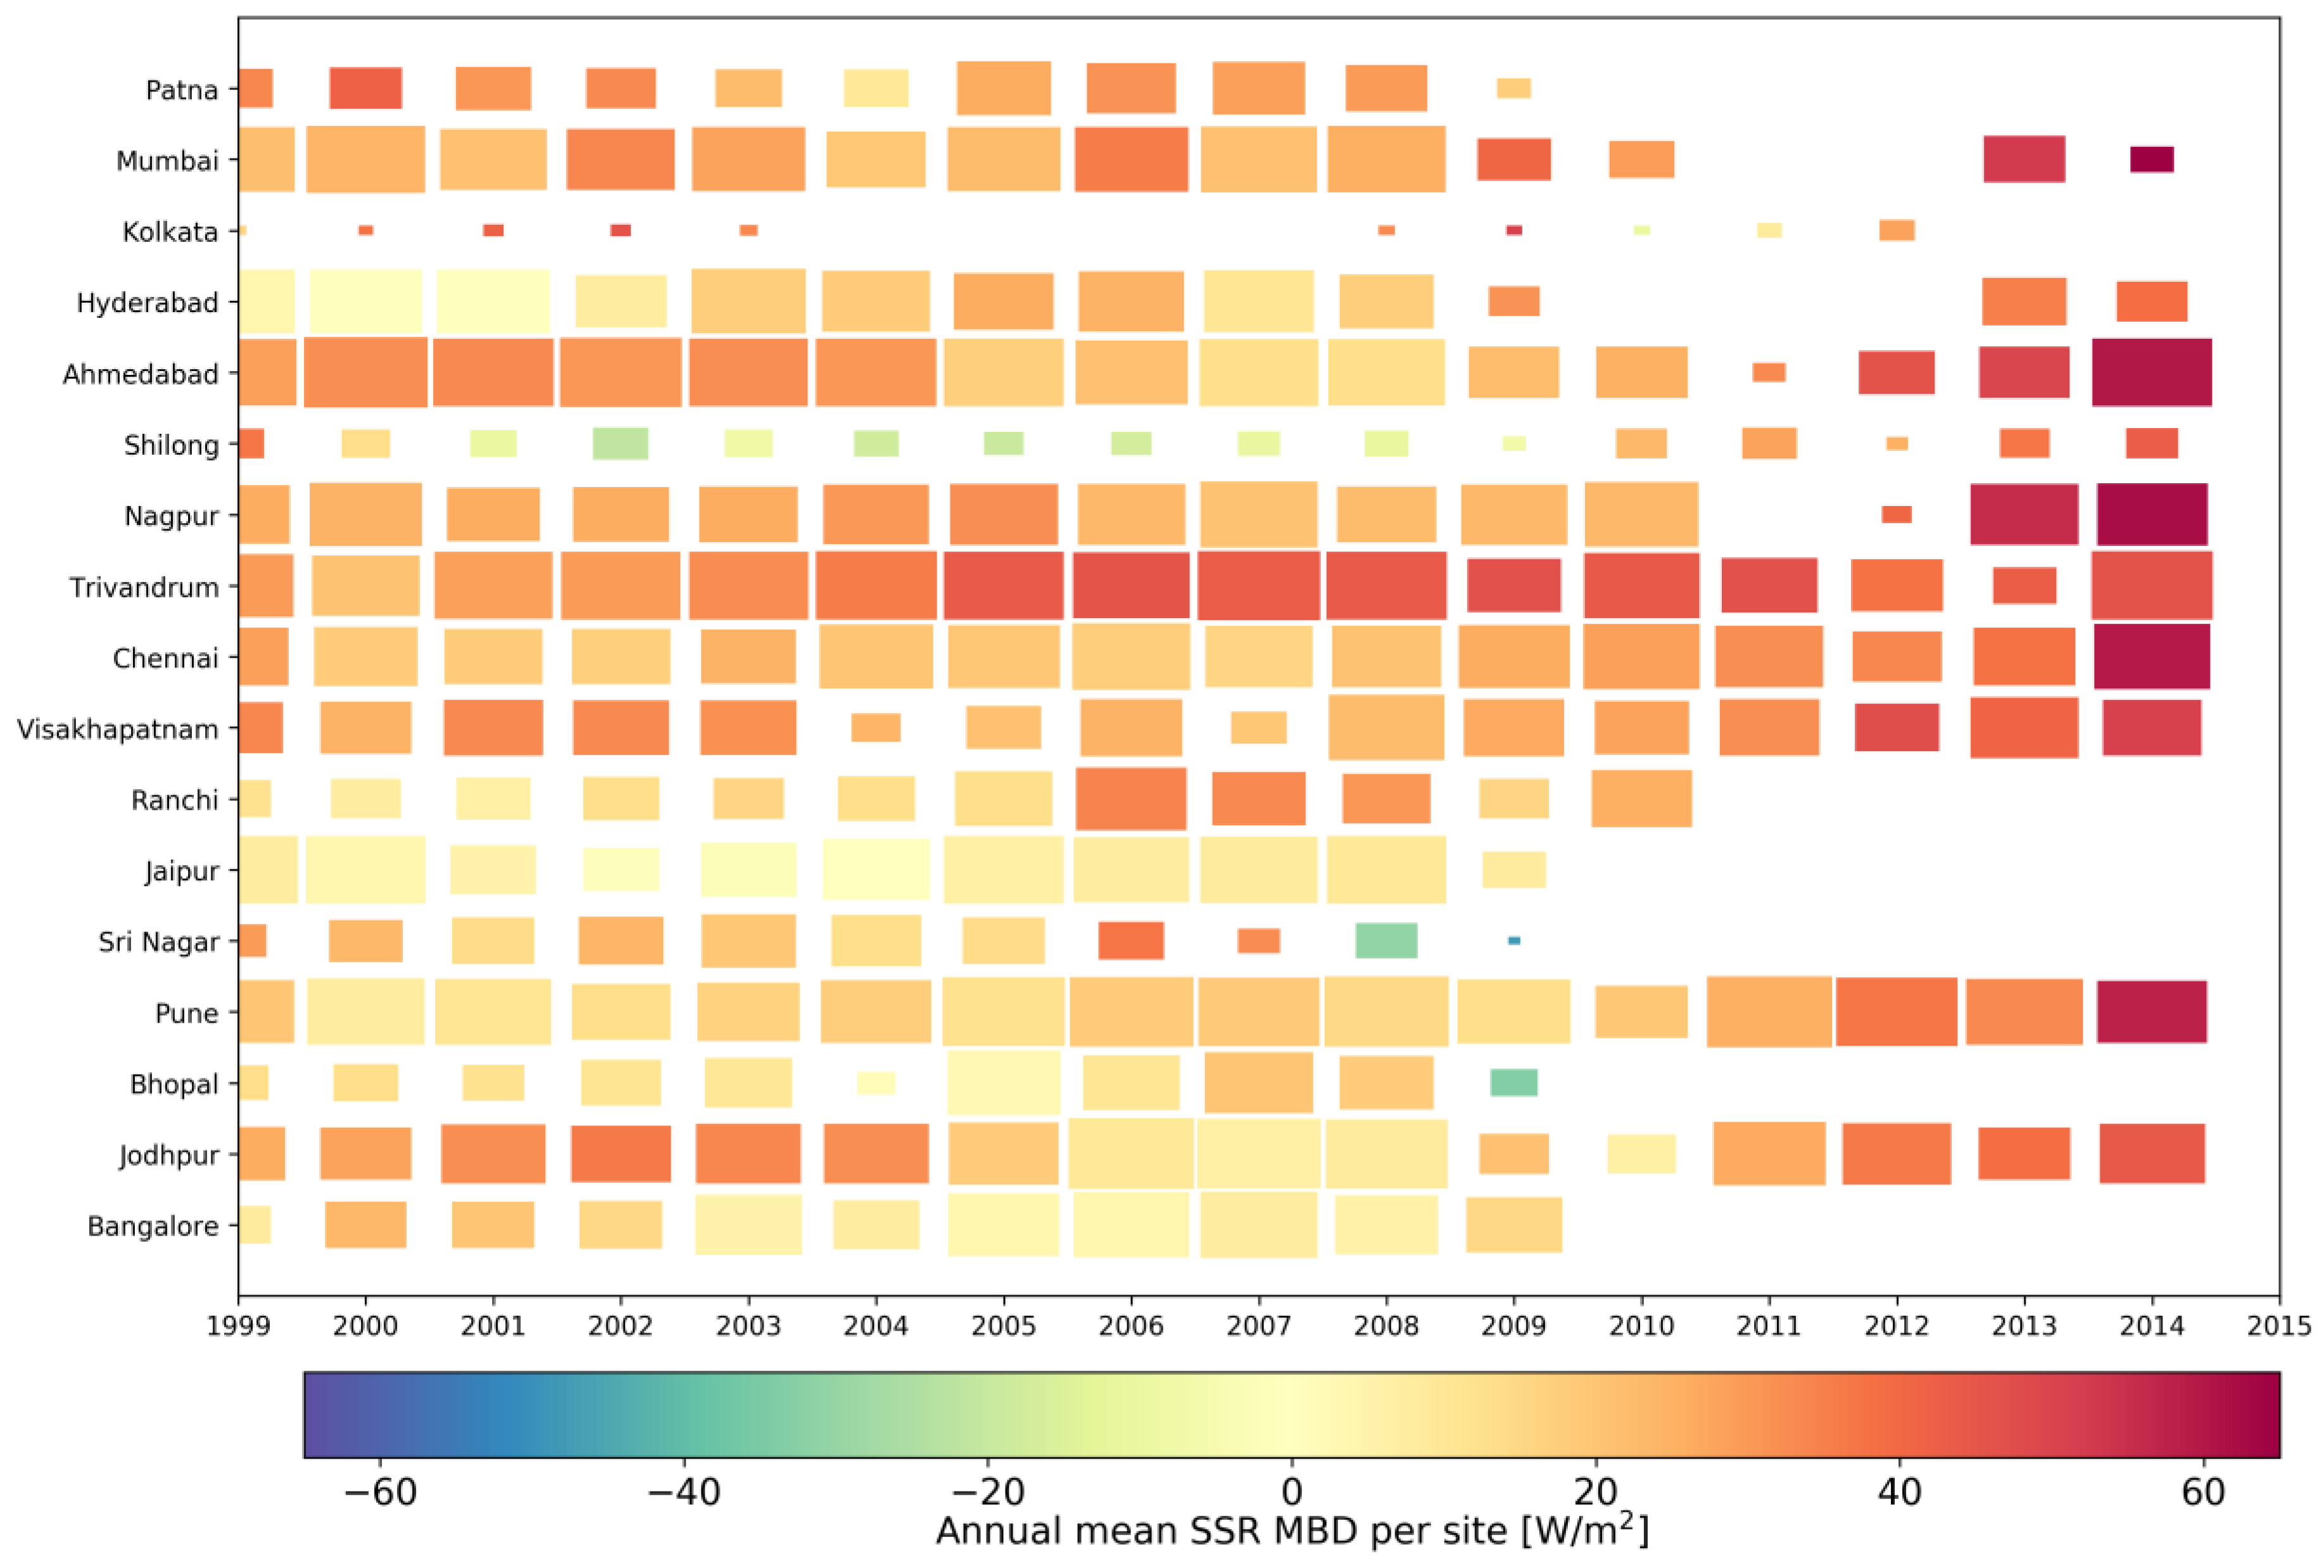
Resolving the validation for each individual site shows that the upward trend in SSR estimation bias is not specific to any subset of the validation sites, but rather a common feature for many of the investigated sites (Figure 3). The year-to-year variation and level shifts in MBD over some sites such as Jodhpur or Ahmedabad are nearly always a result of variations in measured SSR; SARAH-E retrieved SSR generally varies much less from year to year. The validation metrics for the individual sites are also collected and shown in Table 2. For MBD, we also show value for both pre- and post-2009 periods to illustrate the scale of the change in bias. We further note that MBD and MABD are similar for many sites, suggesting that SARAH-E consistently overestimates the in situ SSR measurement, as shown in Figure 2.
The mean MBD and RMSD per site are geographically visualized in Figure 4. SSR retrievals over coastal validation sites have, in general, both a larger bias (MBD) and more scatter (RMSD) than retrievals further inland. Nagpur and Patna appear to be exceptions; at Nagpur, the metrics are affected by sharply decreasing measured SSR in 2013 and 2014, while at Patna, the larger MBD and RMSD are quite constant through time (Figure 3).
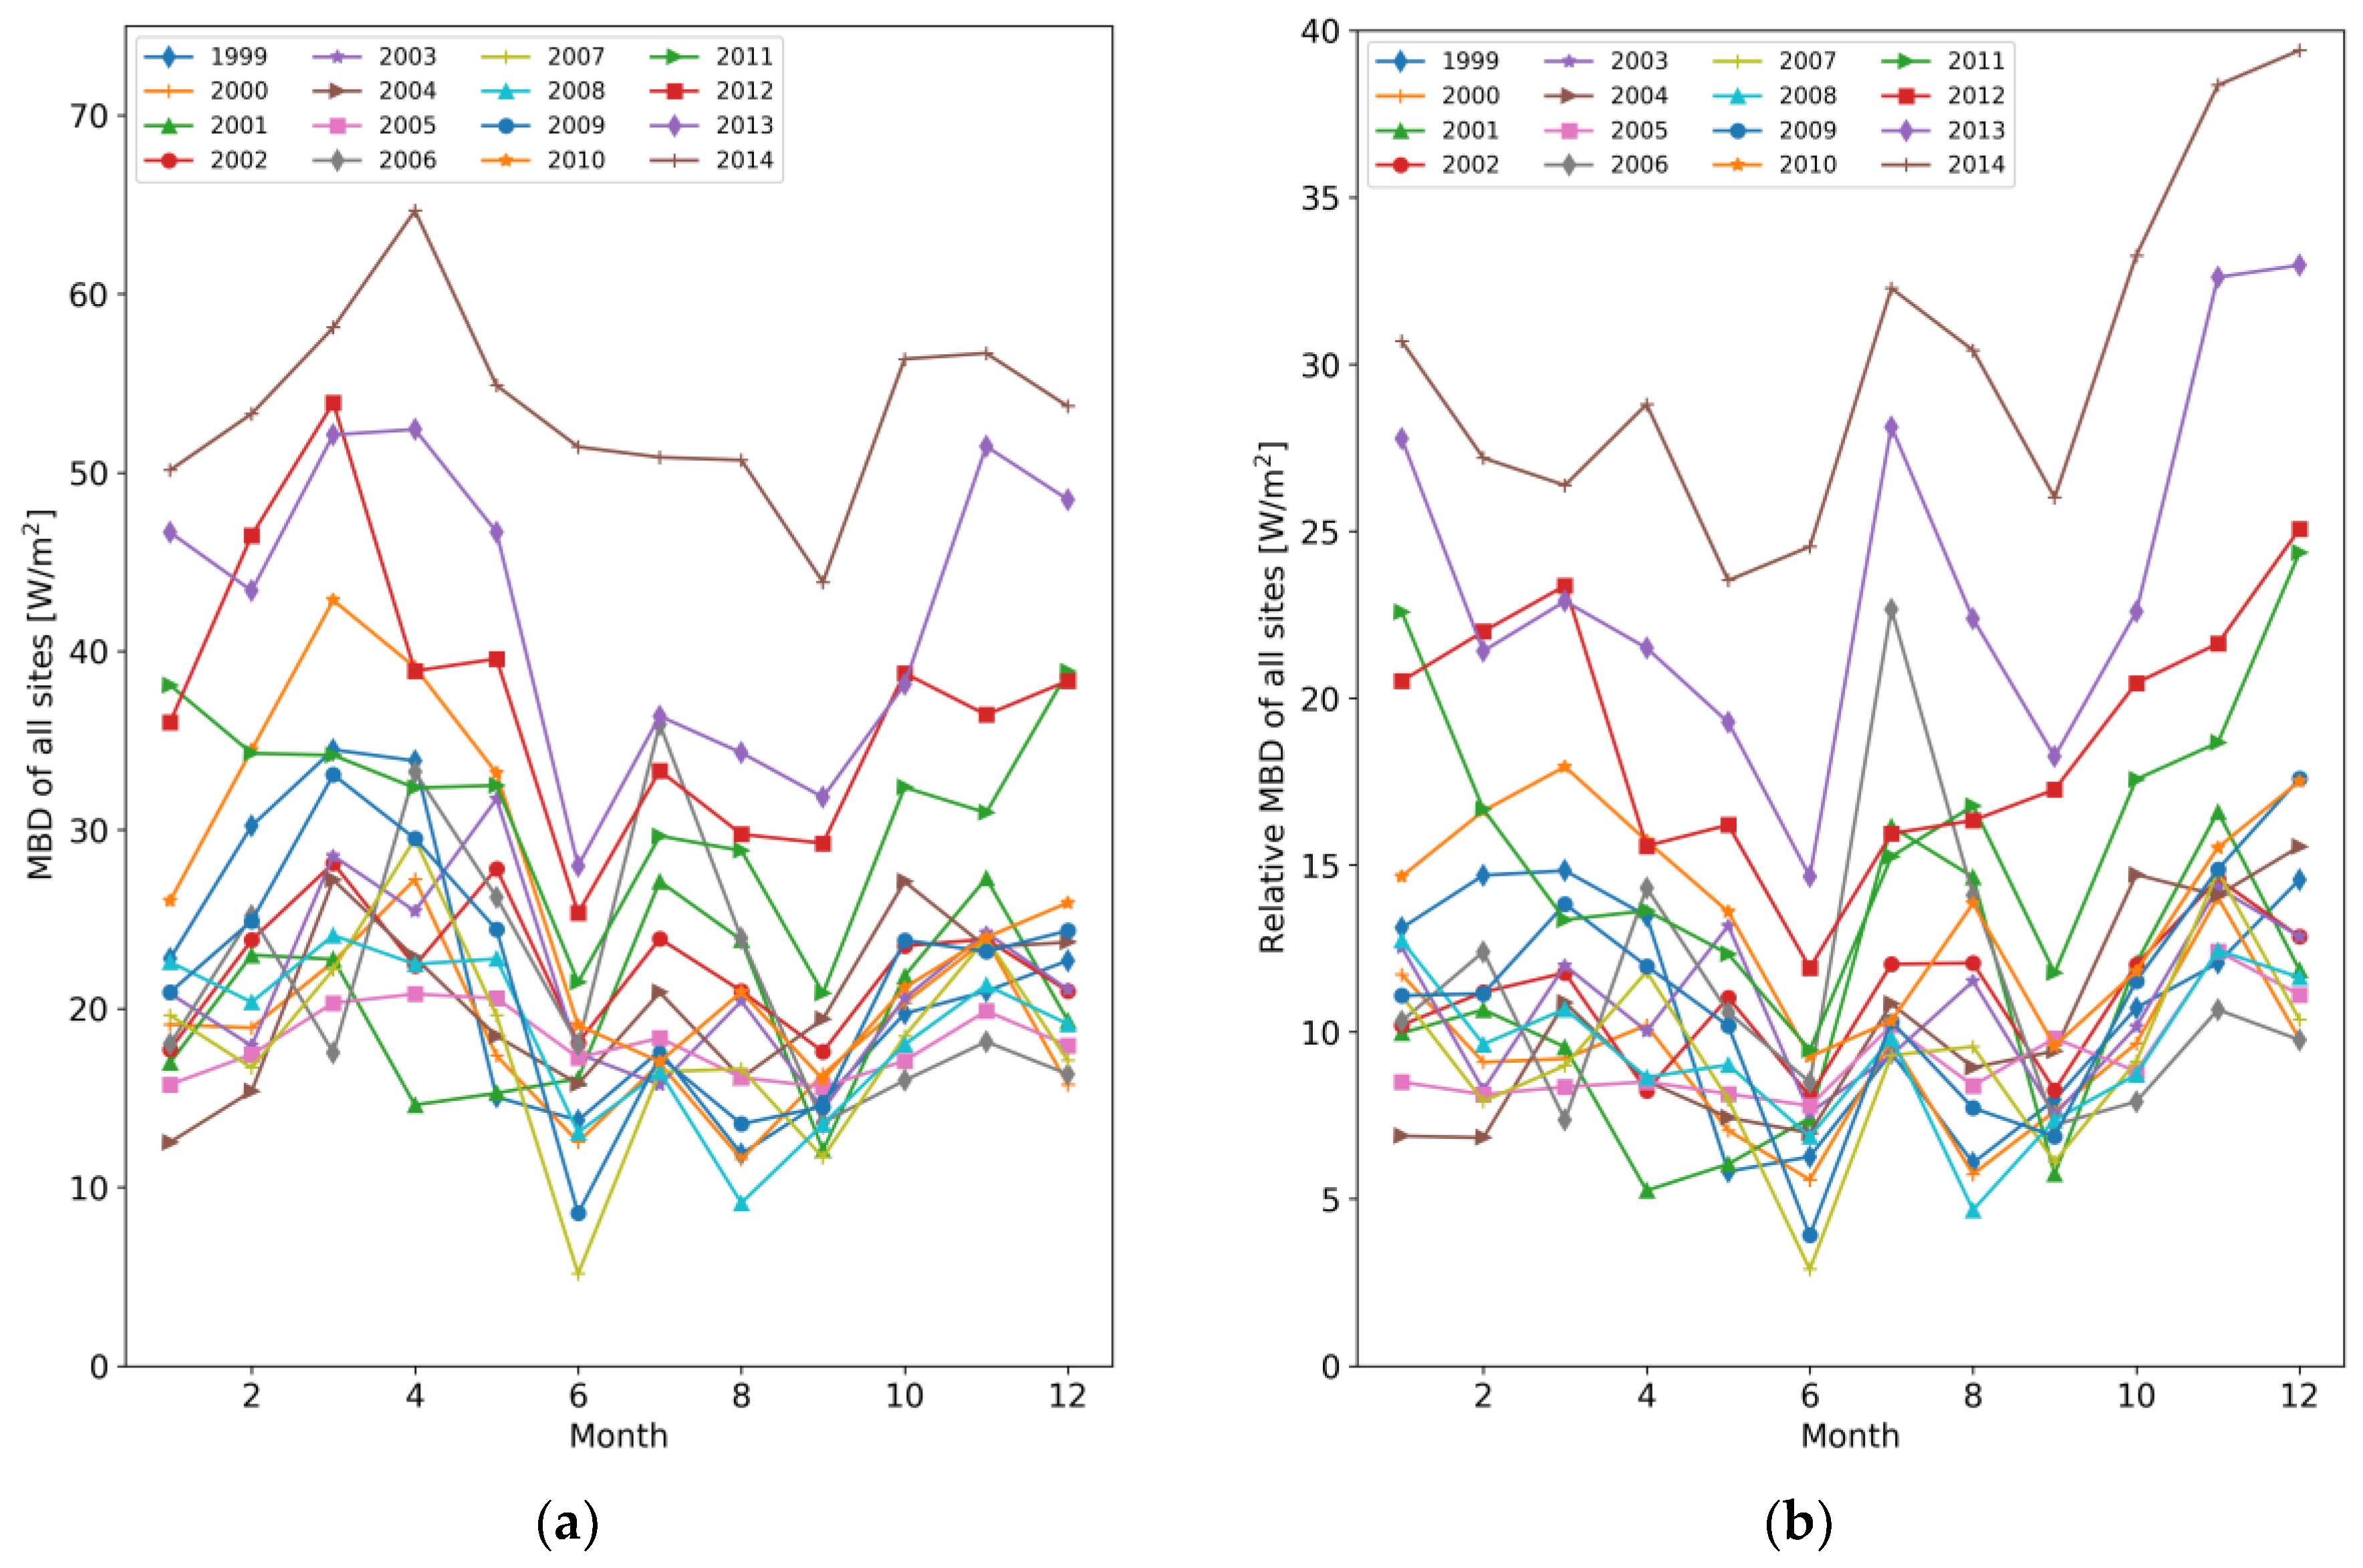
We also examine the SARAH-E estimation bias on monthly basis. Figure 5 illustrates these results, showing MBD (a) and relative MBD (b). The post-2009 increase in MBD is clearly seen to affect all months, though most prominently in the early and late part of the year, particularly when taking the seasonal SSR variation into account (Figure 5b). Interestingly, retrievals fare better during the monsoon season (April–June/July) contrary to expectations; a common finding in satellite-based SSR validation studies has been that biases grow during intensively cloudy periods, either because of incomplete cloud characterization from satellites, or small-scale variability in cloudiness which affects in situ measurements differently from the coarser satellite observations. The winter and autumn seasons are well-known to be less cloudy than summer over India.
All of the results shown here suggest the same conclusion: The mean SARAH-E SSR estimation accuracy has been 10–35 W/m2 between 1999 and 2009 for any month of the year (with midsummer retrievals accurate to within 10–20 W/m2), but has grown to 30–65 W/m2 post-2009 for virtually all sites providing data for this period. These biases are on average larger than reported by Gracia Amillo et al. [4] when validating SARAH-E against Baseline Surface Radiation Network (BSRN) sites across Asia, although their analysis did not cover sites in India. In addition, their reported SSR estimation biases were in the range of −7–+14 W/m2 for MBD, and 22–44 W/m2 for MABD. This suggests that the biases seen here for SSR, particularly for 1999–2009, are relatively close to the expected performance envelope, although with a clear tendency for overestimation particularly after 2009. Next, we will investigate possible causes of this behavior using independent in situ measurements and stability analyses of both SARAH-E and the in situ SSR record.
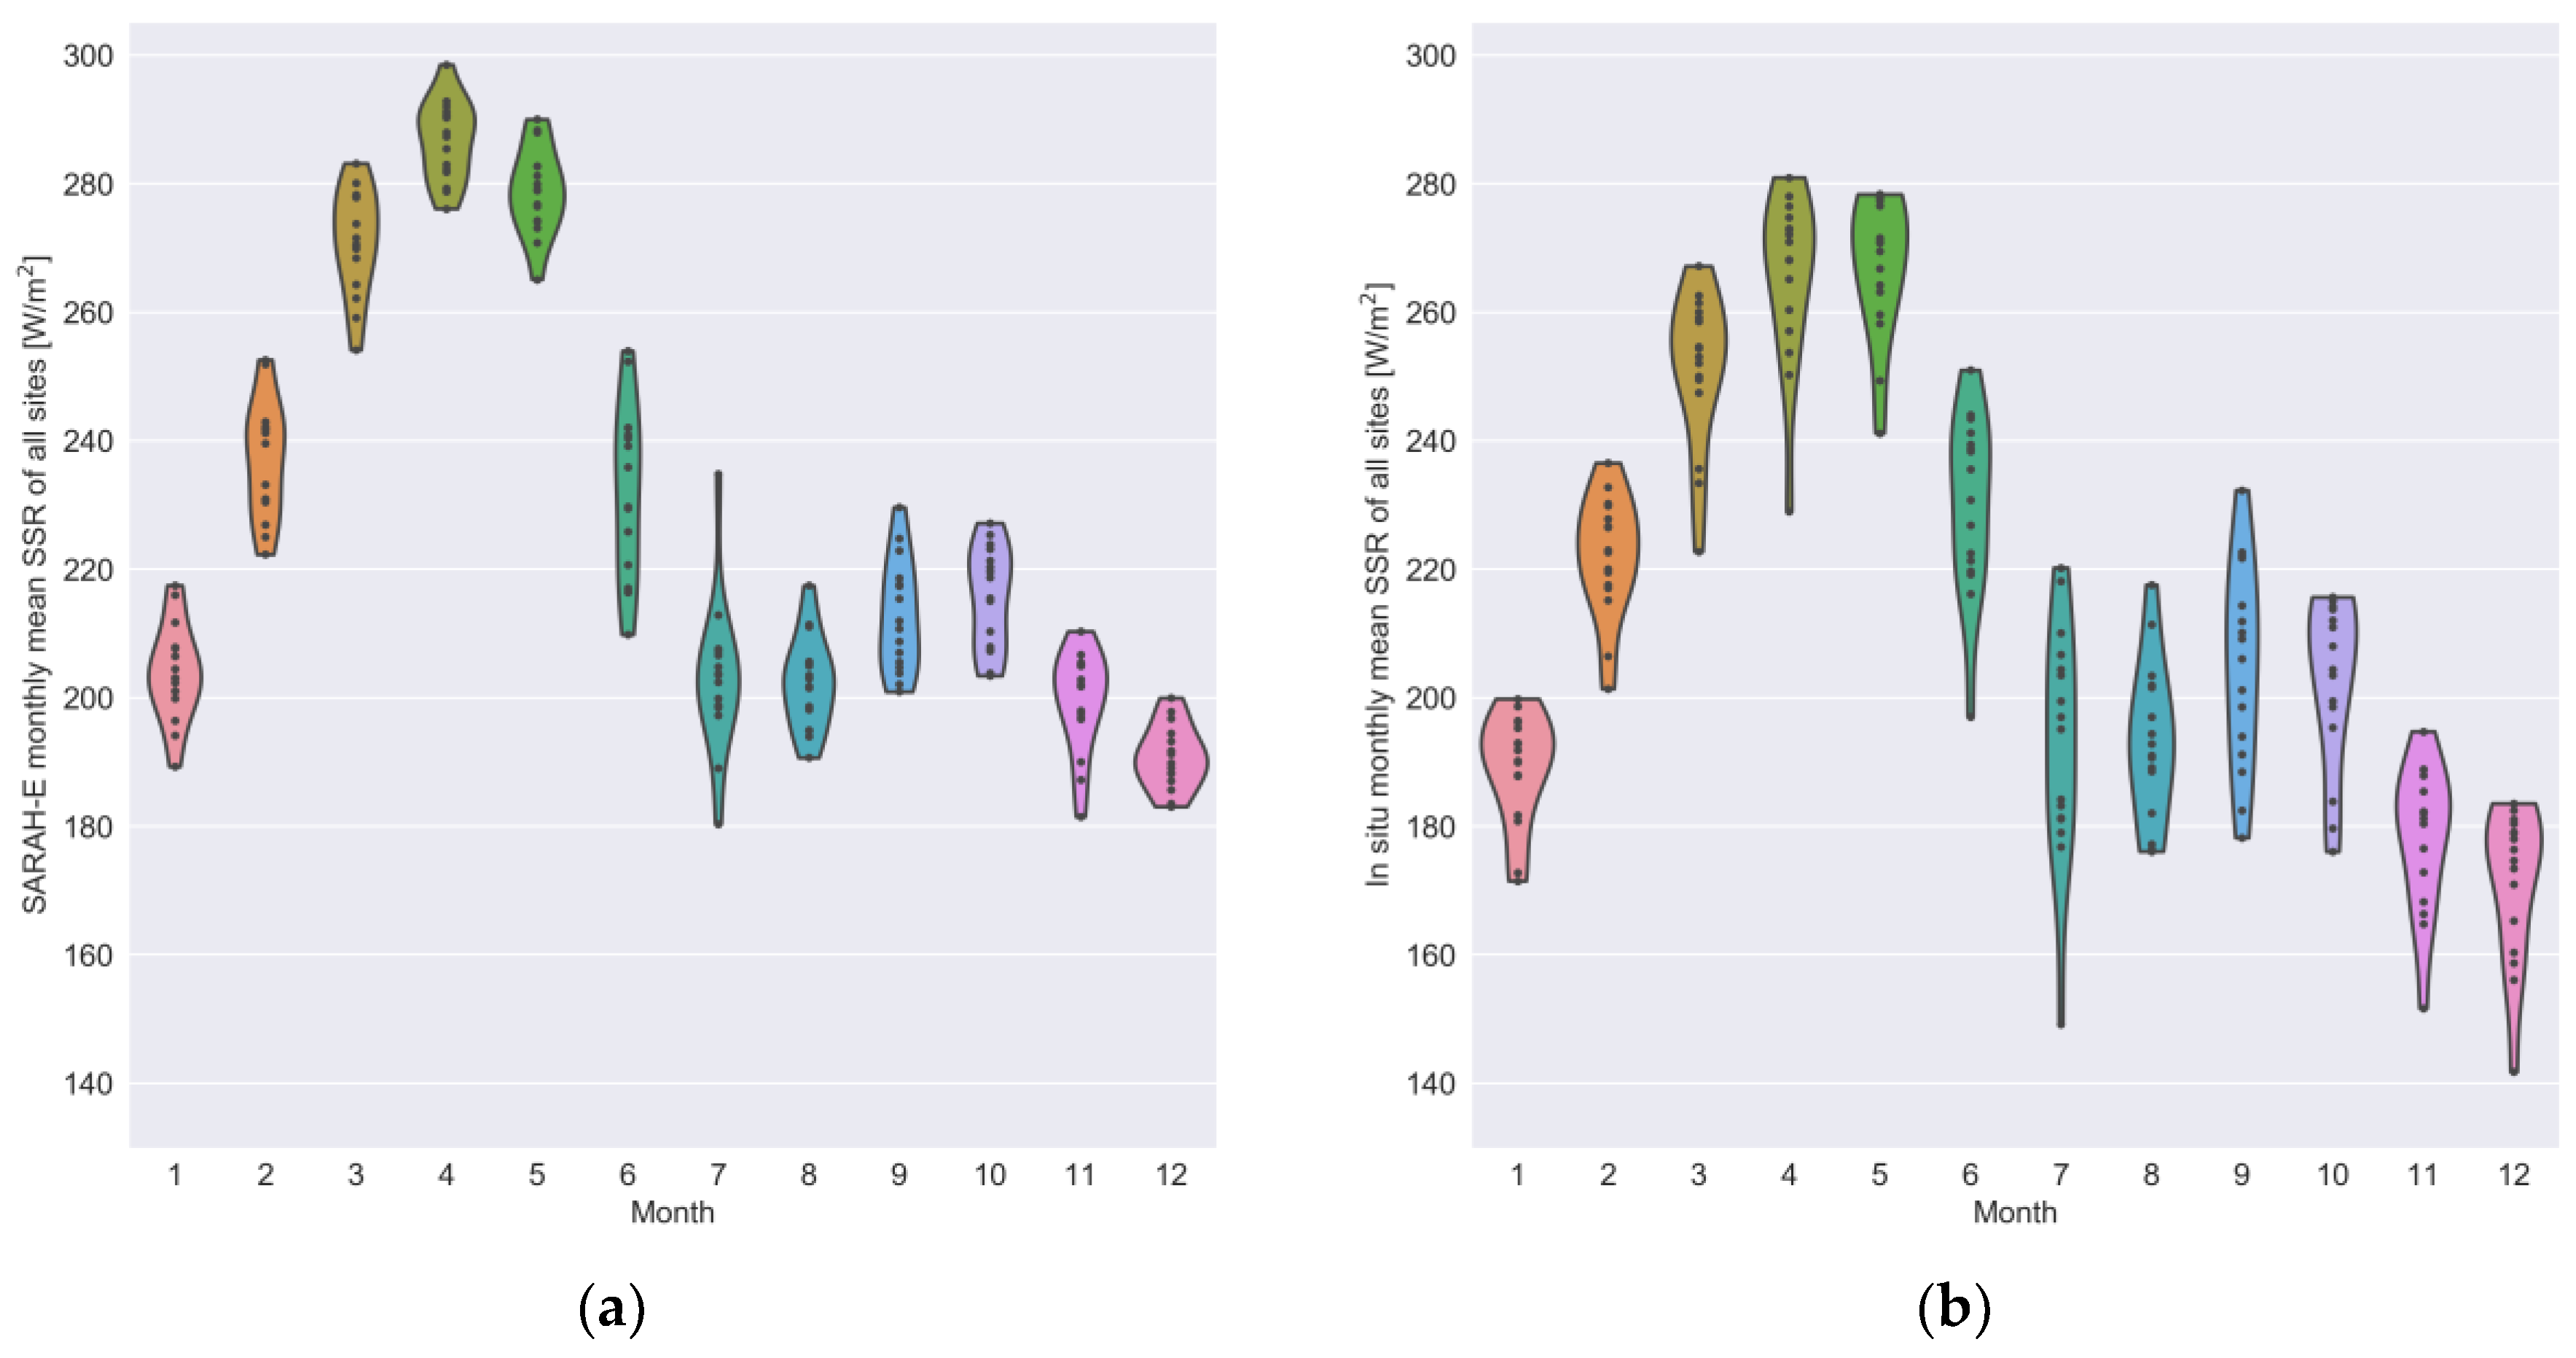
Figure 6 shows a per-month stability analysis of both SARAH-E and in situ monthly mean SSR. We show the analysis as a violin plot to simultaneously compare the extents and distribution of the monthly mean SSR, averaged across all validation sites, across 1999–2014. Markers within the violin plots show the SSR values for each year. We immediately note that while the groups of SARAH-E monthly mean SSRs are relatively tightly packed and their distribution is usually fairly even, the in situ record distribution displays both wider scatter and a prominent lower tail for most months of the year. The tail is predominantly formed from values of the years 2010–2014.
While the differences post-2009 are clear, this comparison alone does not reveal if the increasing difference results from an undetected and uncompensated bias in the satellite retrievals or the in situ measurements. Soni et al. [21] showed a decreasing SSR trend from in situ measurements of a subset of the IMD sites used here, but for a longer analysis period which ended in 2009. They argued that the SSR measurement network is well-maintained and that a large factor in the decrease is the increasing in aerosol loading over India from anthropogenic emissions. This would imply that the atmospheric constituent records (aerosols, water vapor, etc.) used in SARAH-E generation do not adequately consider a substantial increase in aerosol loading over the subcontinent as a whole after 2010, since we observe an increasing bias for nearly all sites in that period.
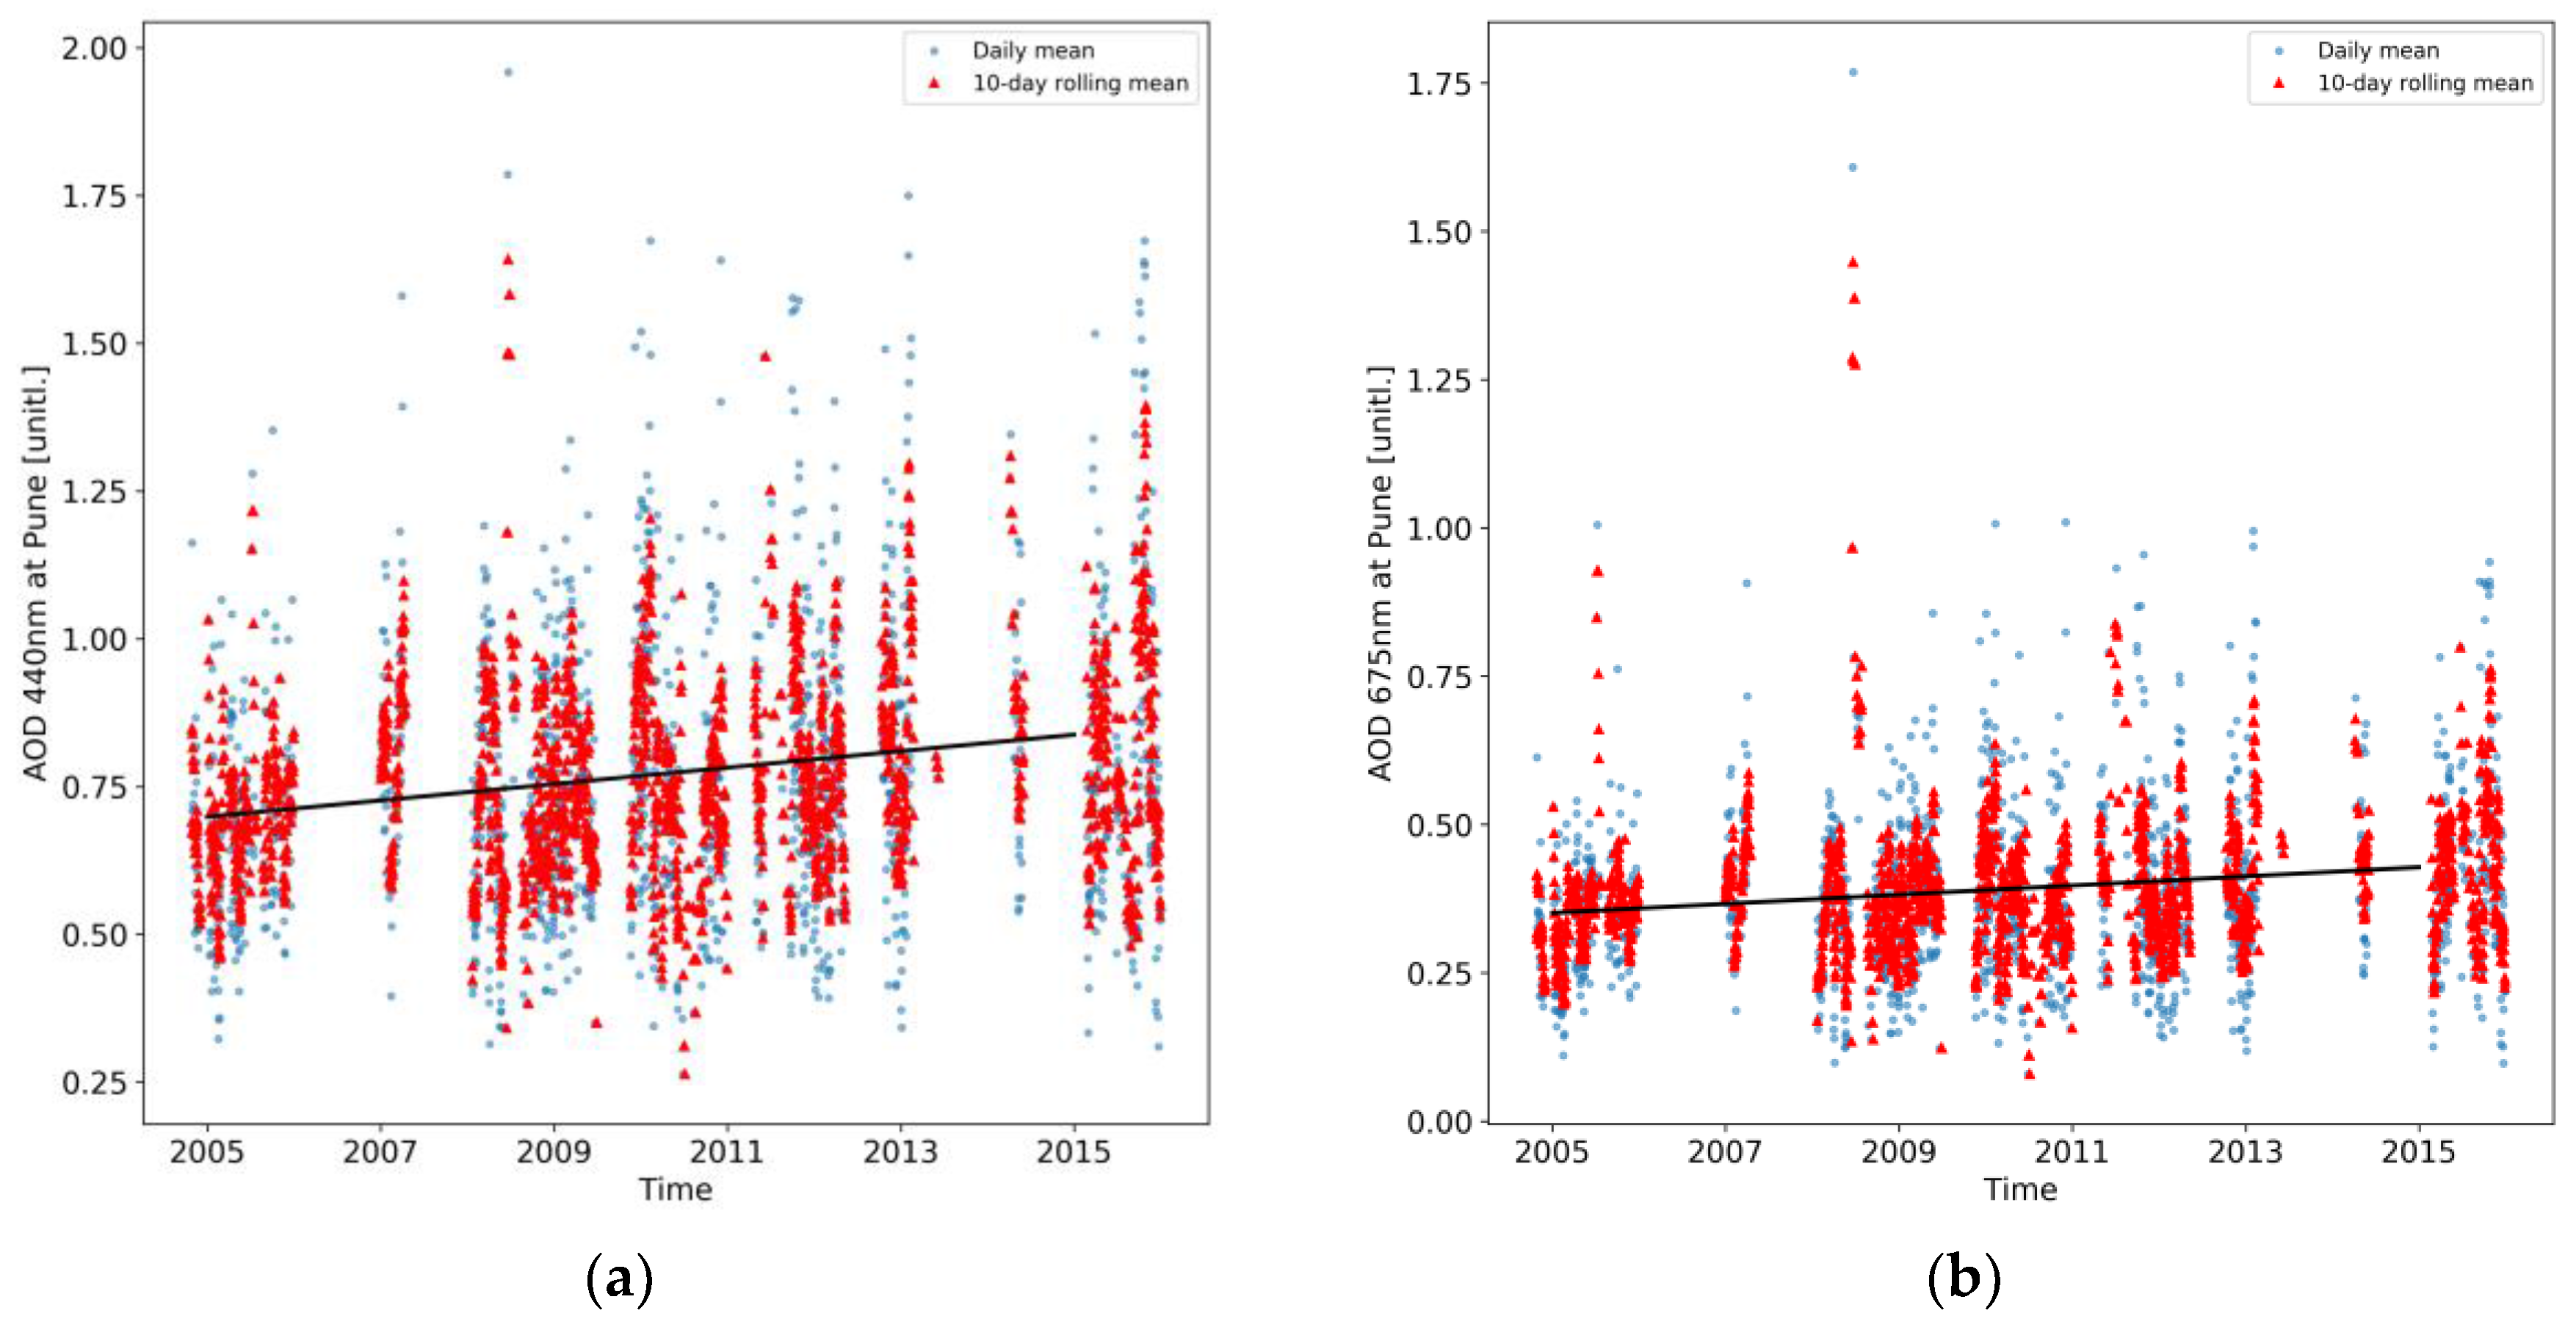
To partially test this supposition, we extracted the AERONET level 1.5 measurement record at Pune, as described in Section 2. The record at Pune is the longest available for Indian AERONET sites, and the only one with a significant overlap with the SARAH data record. Level 1.5 is cloud-screened, although the final calibration of the data is not yet applied. Level 2 data are not yet available at Pune. Figure 7 shows the measured AOD at 440 and 675 nm at Pune between 2005 and 2015. The measurements show slight increasing trends in AOD at these wavelengths close to the one used in SARAH generation from the MACC dataset. However, the increases are modest in comparison to the magnitude of bias growth. Moreover, between 2010 and 2013, there is little evidence of an increasing aerosol loading, whereas the SARAH-E MBD was already seen to grow over several sites (Figure 3). Similarly, the single scattering albedo (SSA) of aerosols at 440 and 675 nm at Pune showed no evidence of a downward trend consistent with increased aerosol absorption (not shown).
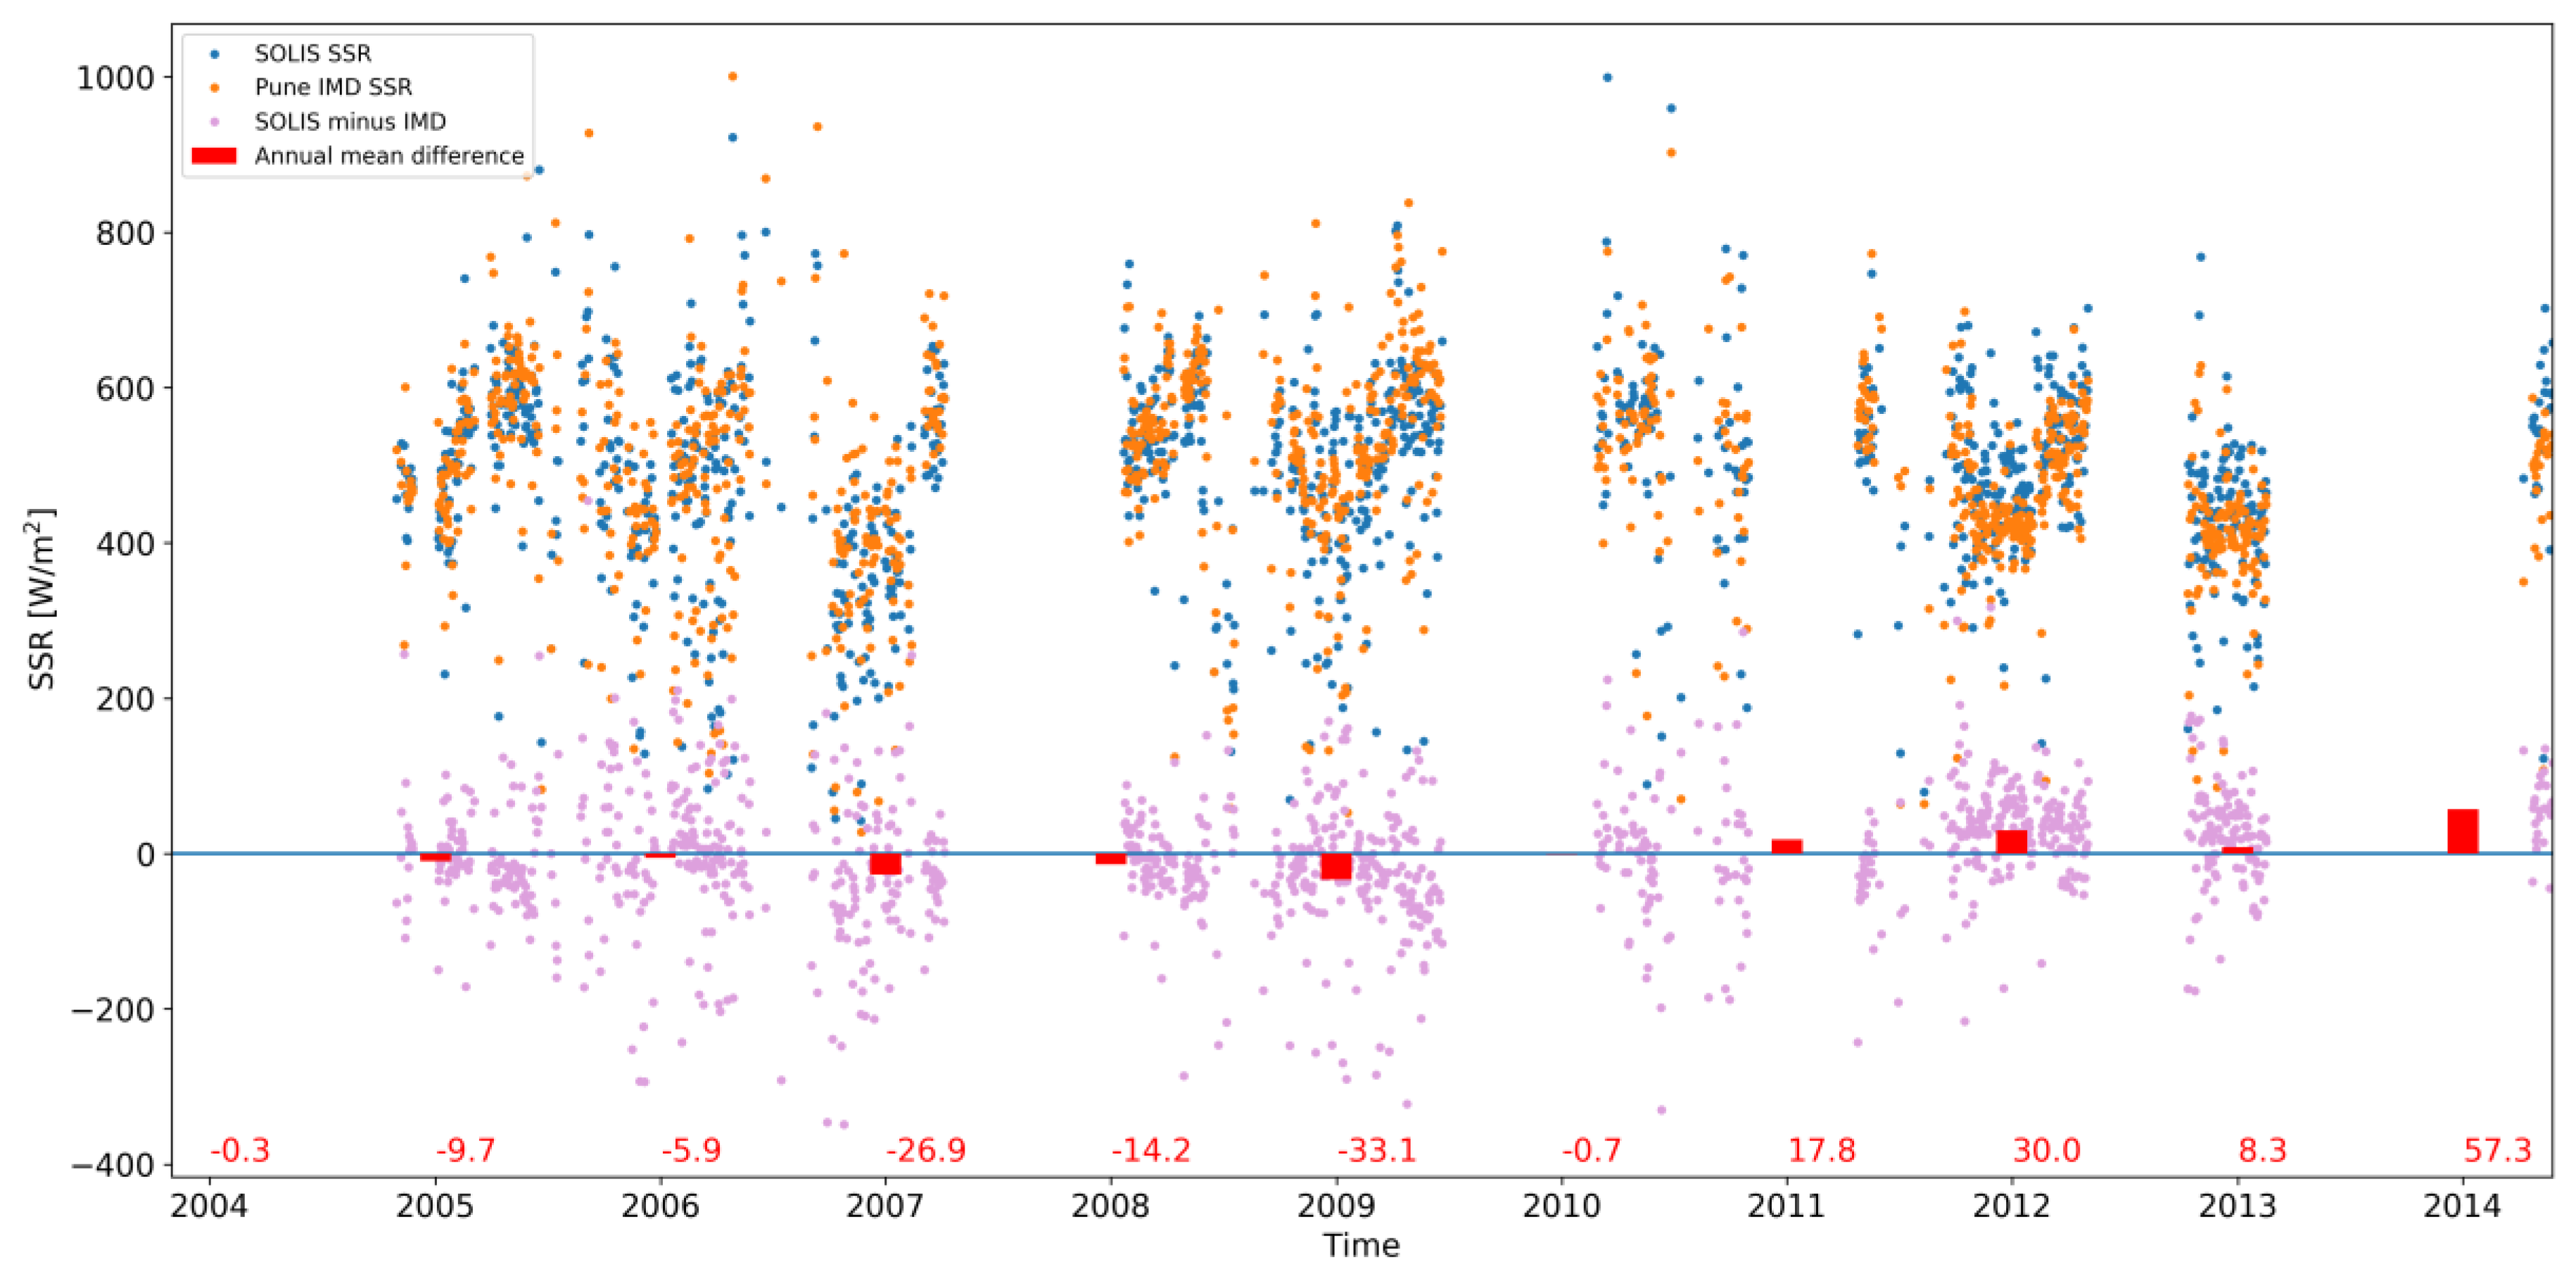
A more direct means of assessing any radiative impact of increasing aerosol loading is to model the clear-sky SSR given the AERONET observations as the atmospheric state descriptors. We have done this for the Pune AERONET record using the clear-sky Simplified Solis radiative transfer model [35]. AOD at 675 nm is used as proxy for AOD at 700 nm, which is the Solis input variable. We further average the AERONET-Solis record to one-hour temporal resolution and use the timestamps to select corresponding clear-sky measured SSR one-hour averages at Pune between 2004 and 2014. A differential comparison between these data is shown in Figure 8.
The data are variably sparse and therefore we must refrain from any strong conclusions based on them; however, it is apparent that post-2009, Solis-modeled SSR predominantly overestimates the in situ measurement whereas over- and underestimations were much more equally distributed prior to that. In fact, the annual mean biases (relative to in situ SSR measurement) of SARAH-E and Solis-AERONET over Pune are linearly correlated with r2 of 0.65. Despite the sparse data, this suggests that the observed decrease in measured SSR at Pune disagrees with both SARAH-E and the AERONET clear-sky measurements.
Furthermore, a recent validation document with the CM SAF project [38] reports the evaluation of the CM SAF Clouds, Albedo and Radiation dataset—Edition 2 (CLARA-A2) over India. The CLARA-A2 is based on polar-orbiting satellites and its algorithm is independent of SARAH-E; however, the findings on SSR retrieval accuracy over India mainly reflect those reported here: a stable period of retrievals in the 2000s, followed by a sharp increase in retrieval bias associated with an across-the-board drop in in situ measured SSR. The SSR from CLARA-A2 has been validated in the literature against a very large number of in situ measurements from different station networks over Europe [13] with little evidence of a bias increase post-2009. However, the validity of the aerosol dataset used in CLARA-A2 generation has not been specifically validated over India in the recent years. In addition, it should be kept in mind that both SARAH-E and CLARA-A2 use climatological aerosol backgrounds for their retrievals.
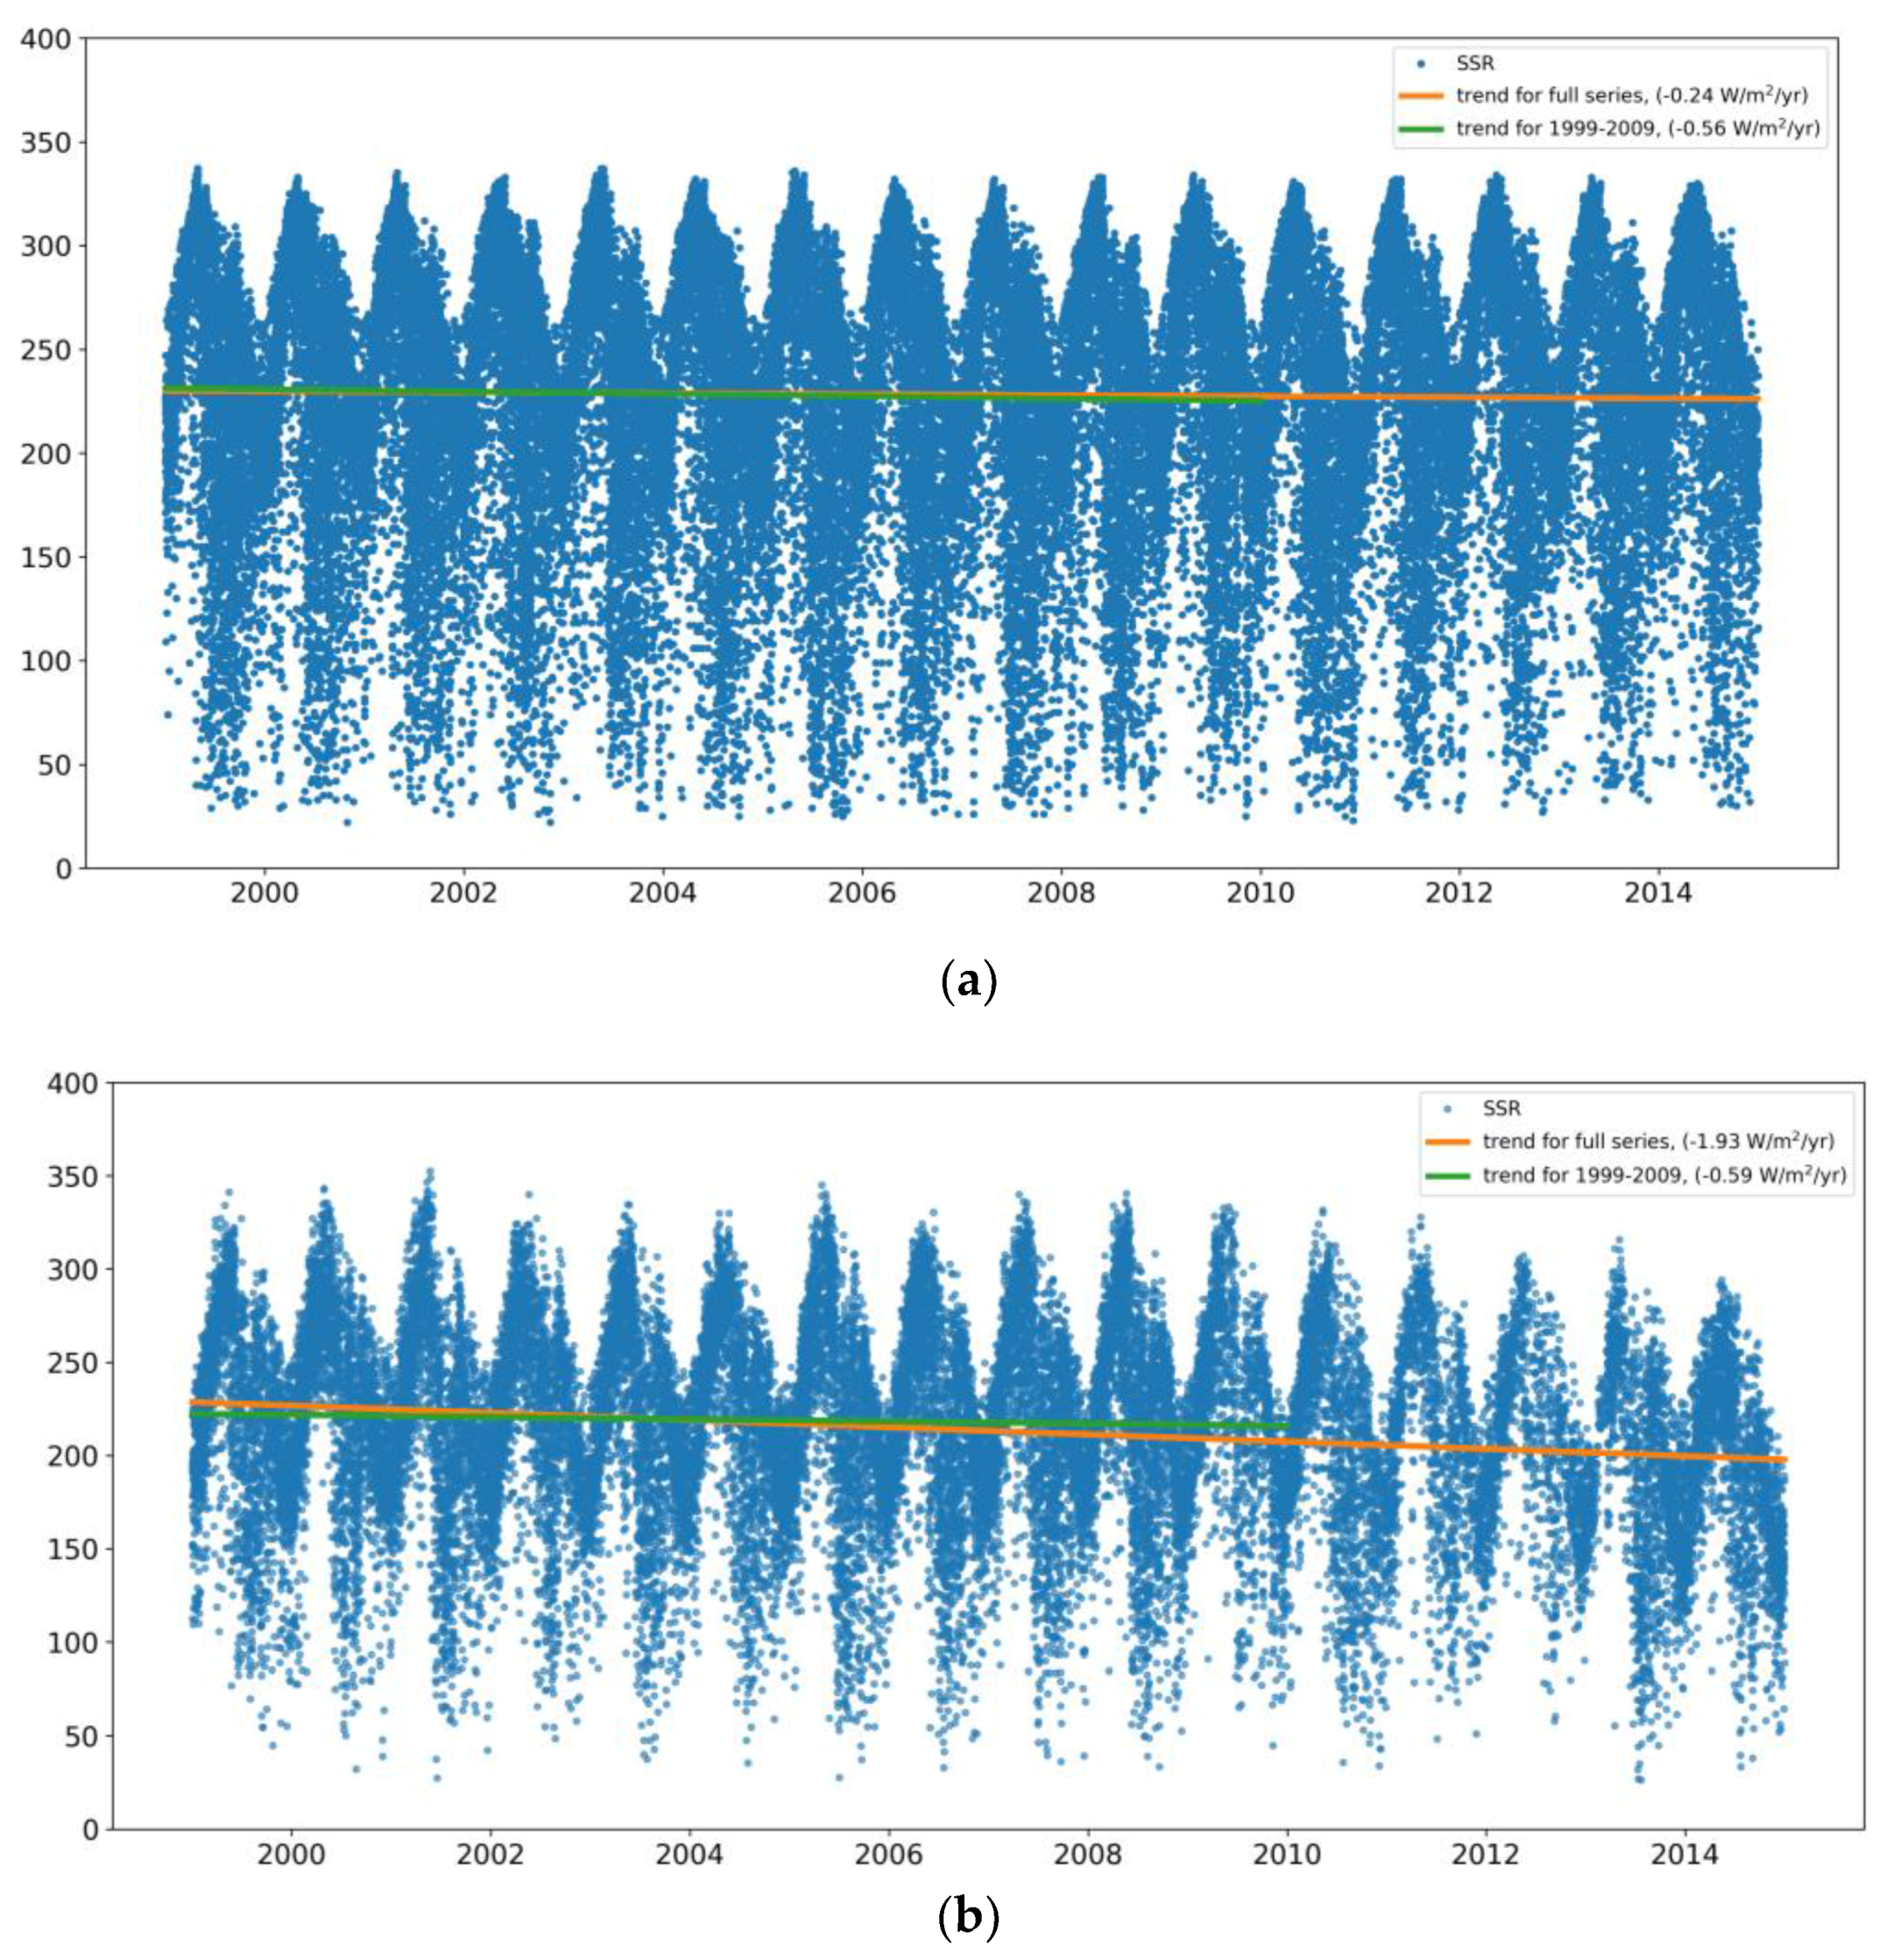
Considering the divergent measurements and retrievals, the question of SSR trend estimation should be approached with utmost care and caution. Because of the varying temporal coverage of the IMD sites, the first precaution is to only include sites which offer the full 1999–2014 coverage, and calculate both in situ and SARAH-E SSR trends based on that subset. The resulting data and its trends are shown in Figure 9. While the overall trend in measured in situ SSR is stronger than in SARAH-E (−1.93 W/m2/year vs. −0.24 W/m2/year), the trends diverge strongly only after 2009. Prior to that, both datasets describe a decreasing trend with a comparable magnitude of ~−0.6 W/m2/year. All trends described here are statistically significant (i.e., non-zero trend) at the 95% confidence interval when evaluated with either the two-tailed t test or the nonparametric Mann–Kendall test. The diverging trends also remain when the datasets are evaluated through seasonal decomposition (not shown). Again, these findings should be considered preliminary prior to conclusively identifying the cause of the increasing discrepancy between satellite estimates and in situ measurements.
While the period 2010–2014 is too short for any reliable trend estimation, it remains notable that, should present circumstances persist, the IMD measurements would describe a decreasing trend of ~−7 W/m2/year, an exceedingly high rate of dimming.
Overall, we must say that the available data do not allow conclusive findings about the cause of the increasing SARAH-E (or CLARA-A2) bias vs. Indian in situ measurements post-2009. If the sharp drop in measured SSR reflects intensifying aerosol loading, suggested to be caused by anthropogenic sources in the literature [21], this loading is not seen in the aerosol climatologies behind SARAH-E, or CLARA-A2. This is certainly within limits of possibility, especially considering the recent increases in air pollution over India [39]. However, the currently available AERONET measurements at Pune do not describe clear-sky aerosol or water vapor conditions which would agree with a drastically dimming clear-sky global radiation after 2009. This would imply that the cause of the large divergence of this period lies in SSR retrievals under cloudy skies, but there are no Supplementary Materials to test this hypothesis at present.
Contrary to expectations, SARAH-E estimation accuracy appears highest against in situ observations during the monsoon season. This is the period when rainfall scavenging of aerosols is most efficient, although the aerosol loading is reported to be on average higher than the winter period over most of India [40]. In addition, during the October–March (winter/pre-monsoon) season, anthropogenic particles contribute relatively more to the aerosol properties than during the monsoon season when natural particles dominate [40]. In principle, the larger SARAH-E bias during the winter period could therefore be consistent with increasing anthropogenic aerosol loading during that period post-2010 that is not present in the aerosol climatology; however, the sheer magnitude of the negative SSR trend in station observations, present for any month of the year, and our inability to reproduce the decrease with AERONET-measured clear-sky aerosol properties at Pune casts some doubt on that theory.
To summarize, it remains possible that the increasing bias post-2009 results from an undetected issue in the Indian in situ measurement network. On the other hand, deficiencies related to recent changes in aerosol loading or properties unseen by the SARAH-E aerosol climatology over India are also a possible cause. There is also a distinct possibility of a multi-factor explanation, the divergence resulting partly from an instrumentation bias on the ground, and partly from a deficiency in the aerosol background in the last years of this analysis.

4. Conclusions

We have evaluated the surface solar radiation (SSR) retrieval accuracy of the satellite-based SARAH-E dataset against in situ measured SSR over India. The primary findings of this study are:
  • Between 1999 and 2009, SARAH-E consistently overestimates in situ measured SSR over India by 10–30 W/m2 (~10–20% in relative terms).
  • Between 1999 and 2009, both SARAH-E and the in situ measurements indicate an overall decreasing trend in SSR with a magnitude of ~−0.6 W/m2/year. The trends are statistically significant at the 95% confidence interval.
  • Post-2009, in situ measured SSR begins to decline sharply whereas SARAH-E retrievals remain stable, leading to a sharply increasing estimation bias.
  • A modeling test of the clear-sky SSR over Pune with AERONET-measured aerosol and water vapor data as input indicates that the relationship between AERONET-based SSR estimate and measured SSR (in clear-sky conditions) is different pre- and post-2009. However, it should also be noted that the SARAH-E aerosol background is based on a 2003–2010 climatology, which may not fully capture recent changes in ambient atmospheric conditions over India.
While the diverging SSR retrievals and measurements are clearly seen post-2009, the cause remains unconfirmed at this stage. Identifying the cause of the rapidly increasing bias would require both radiometric calibration studies on the in situ data as well as decomposition of the satellite retrieval algorithm, both of which are beyond the scope of the present study. Here, we outline potential explanations (in Section 3) and recommend further studies and assessments for both in situ SSR measurements, and the validity of the atmospheric constituents used in the satellite retrievals.
Overall, while the SARAH-E retrieval bias observed in this study during 1999–2009 is higher than reported in general for the dataset [4], the bias for this period is largely stable enough to encourage usage, with due attention to seasonal and geographical limitations. Post 2009, we advise users to caution until the cause of the increasing estimation bias has been ascertained. As stated, we also encourage and highly recommend further studies on the topic, examining the full measurement chain from raw data to temporally averaged SSR means for both satellite and in situ sources.

Supplementary Materials

The following are available online at https://www.mdpi.com/2072-4292/10/3/392/s1, Figure S1: An illustration of the QA measures taken with the in situ data for one example site (Hyderabad) for one month of data. Circles indicate hourly mean SSR at the site versus measurement time (Indian time, night set to zero SSR). The graphs indicate the maximum allowable SSR by the various QA phases.

Acknowledgments

The research has been funded by the Academy of Finland, decision 284536 and Department of Science & Technology, India, contract number: INT/Fin/P-14, jointly. The authors would like to thank Thomas Huld and Jörg Trentmann for enlightening discussions. The SARAH-E dataset is publicly available from CM SAF: wui.cmsaf.eu. The AERONET data are available through aeronet.gsfc.nasa.gov. We thank the PIs for their efforts in establishing and maintaining the Pune site. IMD can be contacted directly for more information on in situ data availability, calibration, and procurement.

Author Contributions

A.R. co-designed the study, performed the analysis, and wrote the majority of the manuscript. V.K. carried out the in situ data QA testing and analysis, and contributed to the manuscript. S.D. and A.S. procured the SSR and AERONET data, performed an initial QA screening, and contributed to the manuscript. A.V.L. co-designed the study and contributed to the manuscript.

Conflicts of Interest

The authors declare no conflict of interest.

References

  1. Bhattacharya, M.; Paramati, S.R.; Ozturk, I.; Bhattacharya, S. The effect of renewable energy consumption on economic growth: Evidence from top 38 countries. Appl. Energy 2016, 162, 733–741. [Google Scholar] [CrossRef]
  2. Sharma, N.K.; Tiwari, P.K.; Sood, Y.R. Solar energy in India: Strategies, policies, perspectives and future potential. Renew. Sustain. Energy Rev. 2012, 16, 933–941. [Google Scholar] [CrossRef]
  3. Kar, S.K.; Sharma, A.; Roy, B. Solar energy market developments in India. Renew. Sustain. Energy Rev. 2016, 62, 121–133. [Google Scholar] [CrossRef]
  4. Amillo, A.G.; Huld, T.; Müller, R. A new database of global and direct solar radiation using the eastern meteosat satellite, models and validation. Remote Sens. 2014, 6, 8165–8189. [Google Scholar] [CrossRef] [Green Version]
  5. Huld, T.; Müller, R.; Gracia-Amillo, A.; Pfeifroth, U.; Trentmann, J. Surface Solar Radiation Data Set—Heliosat, Meteosat-East (SARAH-E), 1st ed.; Satellite Application Facility on Climate Monitoring: Offenbach, Germany, 2016; Available online: https://doi.org/10.5676/DWD/JECD/SARAH_E/V001 (accessed on 15 December 2017).
  6. Rigollier, C.; Lefèvre, M.; Wald, L. The method Heliosat-2 for deriving shortwave solar radiation from satellite images. Sol. Energy 2004, 77, 159–169. [Google Scholar] [CrossRef]
  7. Huld, T.; Müller, R.; Gambardella, A. A new solar radiation database for estimating PV performance in Europe and Africa. Sol. Energy 2012, 86, 1803–1815. [Google Scholar] [CrossRef]
  8. Pinker, R.T.; Laszlo, I. Modeling surface solar irradiance for satellite applications on a global scale. J. Appl. Meteorol. 1992, 31, 194–211. [Google Scholar] [CrossRef]
  9. Lohmann, S.; Schillings, C.; Mayer, B.; Meyer, R. Long-term variability of solar direct and global radiation derived from ISCCP data and comparison with reanalysis data. Sol. Energy 2006, 80, 1390–1401. [Google Scholar] [CrossRef] [Green Version]
  10. Karlsson, K.G.; Anttila, K.; Trentmann, J.; Stengel, M.; Meirink, J.F.; Devasthale, A.; Benas, N. CLARA-A2: The second edition of the CM SAF cloud and radiation data record from 34 years of global AVHRR data. Atmos. Chem. Phys. 2017, 17, 5809. [Google Scholar] [CrossRef]
  11. Riihelä, A.; Carlund, T.; Trentmann, J.; Müller, R.; Lindfors, A.V. Validation of CM SAF surface solar radiation datasets over Finland and Sweden. Remote Sens. 2015, 7, 6663–6682. [Google Scholar] [CrossRef]
  12. Pfenninger, S.; Staffell, I. Long-term patterns of European PV output using 30 years of validated hourly reanalysis and satellite data. Energy 2016, 114, 1251–1265. [Google Scholar] [CrossRef]
  13. Urraca, R.; Gracia-Amillo, A.M.; Koubli, E.; Huld, T.; Trentmann, J.; Riihelä, A.; Antonanzas-Torres, F. Extensive validation of CM SAF surface radiation products over Europe. Remote Sens. Environ. 2017, 199, 171–186. [Google Scholar] [CrossRef] [PubMed]
  14. Cano, D.; Monget, J.M.; Albuisson, M.; Guillard, H.; Regas, N.; Wald, L. A method for the determination of the global solar radiation from meteorological satellite data. Sol. Energy 1986, 37, 31–39. [Google Scholar] [CrossRef]
  15. Beyer, H.G.; Costanzo, C.; Heinemann, D. Modifications of the Heliosat procedure for irradiance estimates from satellite images. Sol. Energy 1996, 56, 207–212. [Google Scholar] [CrossRef]
  16. Hammer, A.; Heinemann, D.; Hoyer, C.; Kuhlemann, R.; Lorenz, E.; Müller, R.; Beyer, H.G. Solar energy assessment using remote sensing technologies. Remote Sens. Environ. 2003, 86, 423–432. [Google Scholar] [CrossRef]
  17. Dee, D.P.; Uppala, S.M.; Simmons, A.J.; Berrisford, P.; Poli, P.; Kobayashi, S.; Bechtold, P. The ERA-Interim reanalysis: Configuration and performance of the data assimilation system. Q. J. R. Meteorol. Soc. 2011, 137, 553–597. [Google Scholar] [CrossRef]
  18. Morcrette, J.J.; Boucher, O.; Jones, L.; Salmond, D.; Bechtold, P.; Beljaars, A.; Schulz, M. Aerosol analysis and forecast in the European Centre for medium-range weather forecasts integrated forecast system: Forward modeling. J. Geophys. Res. Atmos. 2009, 114, 605–617. [Google Scholar] [CrossRef]
  19. Müller, R.; Pfeifroth, U.; Träger-Chatterjee, C.; Trentmann, J.; Cremer, R. Digging the METEOSAT treasure—3 decades of solar surface radiation. Remote Sens. 2015, 7, 8067–8101. [Google Scholar] [CrossRef]
  20. Krämer, M.; Müller, R.; Bovensmann, H.; Burrows, J.; Brinkmann, J.; Röth, E.P.; Günther, G. Intercomparison of stratospheric chemistry models under polar vortex conditions. J. Atmos. Chem. 2003, 45, 51–77. [Google Scholar] [CrossRef] [Green Version]
  21. Soni, V.K.; Pandithurai, G.; Pai, D.S. Evaluation of long-term changes of solar radiation in India. Int. J. Climatol. 2012, 32, 540–551. [Google Scholar] [CrossRef]
  22. Kumar, V.; Jain, S.K.; Singh, Y. Analysis of long-term rainfall trends in India. Hydrol. Sci. J. 2010, 55, 484–496. [Google Scholar] [CrossRef]
  23. Tiwari, S.; Dumka, U.C.; Gautam, A.S.; Kaskaoutis, D.G.; Srivastava, A.K.; Bisht, D.S.; Chakrabarty, R.K.; Sumlin, B.J.; Solmon, F. Assessment of PM 2.5 and PM 10 over Guwahati in Brahmaputra River Valley: Temporal evolution, source apportionment and meteorological dependence. Atmos. Pollut. Res. 2016, 8, 13–28. [Google Scholar] [CrossRef]
  24. Yerramsetti, V.S.; Gauravarapu Navlur, N.; Rapolu, V.; Dhulipala, N.S.K.; Sinha, P.R.; Srinavasan, S.; Anupoju, G.R. Role of nitrogen oxides, black carbon, and meteorological parameters on the variation of surface ozone levels at a tropical urban site–Hyderabad, India. Clean Soil Air Water 2013, 41, 215–225. [Google Scholar] [CrossRef]
  25. Sreekanth, V. Satellite derived aerosol optical depth climatology over Bangalore, India. Adv. Space Res. 2013, 51, 2297–2308. [Google Scholar] [CrossRef]
  26. Pani, S.K.; Verma, S. Variability of winter and summertime aerosols over eastern India urban environment. Atmos. Res. 2014, 137, 112–124. [Google Scholar] [CrossRef]
  27. Bhaskar, V.V.; Safai, P.D.; Raju, M.P. Long term characterization of aerosol optical properties: Implications for radiative forcing over the desert region of Jodhpur, India. Atmos. Environ. 2015, 114, 66–74. [Google Scholar] [CrossRef]
  28. Biswas, J.; Pathak, B.; Patadia, F.; Bhuyan, P.K.; Gogoi, M.M.; Babu, S.S. Satellite-retrieved direct radiative forcing of aerosols over North-East India and adjoining areas: Climatology and impact assessment. Int. J. Climatol. 2017, 37, 4756. [Google Scholar] [CrossRef]
  29. Moradi, I. Quality control of global solar radiation using sunshine duration hours. Energy 2009, 34, 1–6. [Google Scholar] [CrossRef]
  30. Tang, W.; Yang, K.; He, J.; Qin, J. Quality control and estimation of global solar radiation in China. Sol. Energy 2010, 84, 466–475. [Google Scholar] [CrossRef]
  31. Shi, G.Y.; Hayasaka, T.; Ohmura, A.; Chen, Z.H.; Wang, B.; Zhao, J.Q.; Xu, L. Data quality assessment and the long-term trend of ground solar radiation in China. J. Appl. Meteorol. Climatol. 2008, 47, 1006–1016. [Google Scholar] [CrossRef]
  32. Long, C.N.; Dutton, E.G. BSRN Global Network Recommended QC Tests, V2. 2010. Available online: https://epic.awi.de/30083/1/BSRN_recommended_QC_tests_V2.pdf (accessed on 15 December 2017).
  33. Holmgren, W.F.; Andrews, R.W.; Lorenzo, A.T.; Stein, J.S. Pvlib python 2015. In Proceedings of the IEEE 42nd Photovoltaic Specialist Conference (PVSC), New Orleans, LA, USA, 14–19 June 2015; pp. 1–5. [Google Scholar]
  34. Holben, B.N.; Eck, T.F.; Slutsker, I.; Tanre, D.; Buis, J.P.; Setzer, A.; Lavenu, F. AERONET—A federated instrument network and data archive for aerosol characterization. Remote Sens. Environ. 1998, 66, 1–16. [Google Scholar] [CrossRef]
  35. Ineichen, P. A broadband simplified version of the Solis clear sky model. Sol. Energy 2008, 82, 758–762. [Google Scholar] [CrossRef]
  36. Sanchez-Lorenzo, A.; Wild, M.; Trentmann, J. Validation and stability assessment of the monthly mean CM SAF surface solar radiation dataset over Europe against a homogenized surface dataset (1983–2005). Remote Sens. Environ. 2013, 134, 355–366. [Google Scholar] [CrossRef]
  37. Hakuba, M.Z.; Folini, D.; Sanchez-Lorenzo, A.; Wild, M. Spatial representativeness of ground-based solar radiation measurements. J. Geophys. Res. Atmos. 2013, 118, 8585–8597. [Google Scholar] [CrossRef]
  38. Sanchez Lorenzo, A. Stability Assessment and Trends of CM SAF Surface Solar Radiation Data Sets (RadTrend); CM SAF Visiting Scientist Report; Satellite Application Facility on Climate Monitoring: Offenbach, Germany, 2017. [Google Scholar]
  39. Gurjar, B.R.; Khaiwal, R.; Nagpure, A.S. Air pollution trends over Indian megacities and their local-to-global implications. Atmos. Environ. 2016, 142, 475–495. [Google Scholar] [CrossRef]
  40. Dey, S.; Di Girolamo, L. A climatology of aerosol optical and microphysical properties over the Indian subcontinent from 9 years (2000–2008) of Multiangle Imaging Spectroradiometer (MISR) data. J. Geophys. Res. Atmos. 2010, 115. [Google Scholar] [CrossRef]
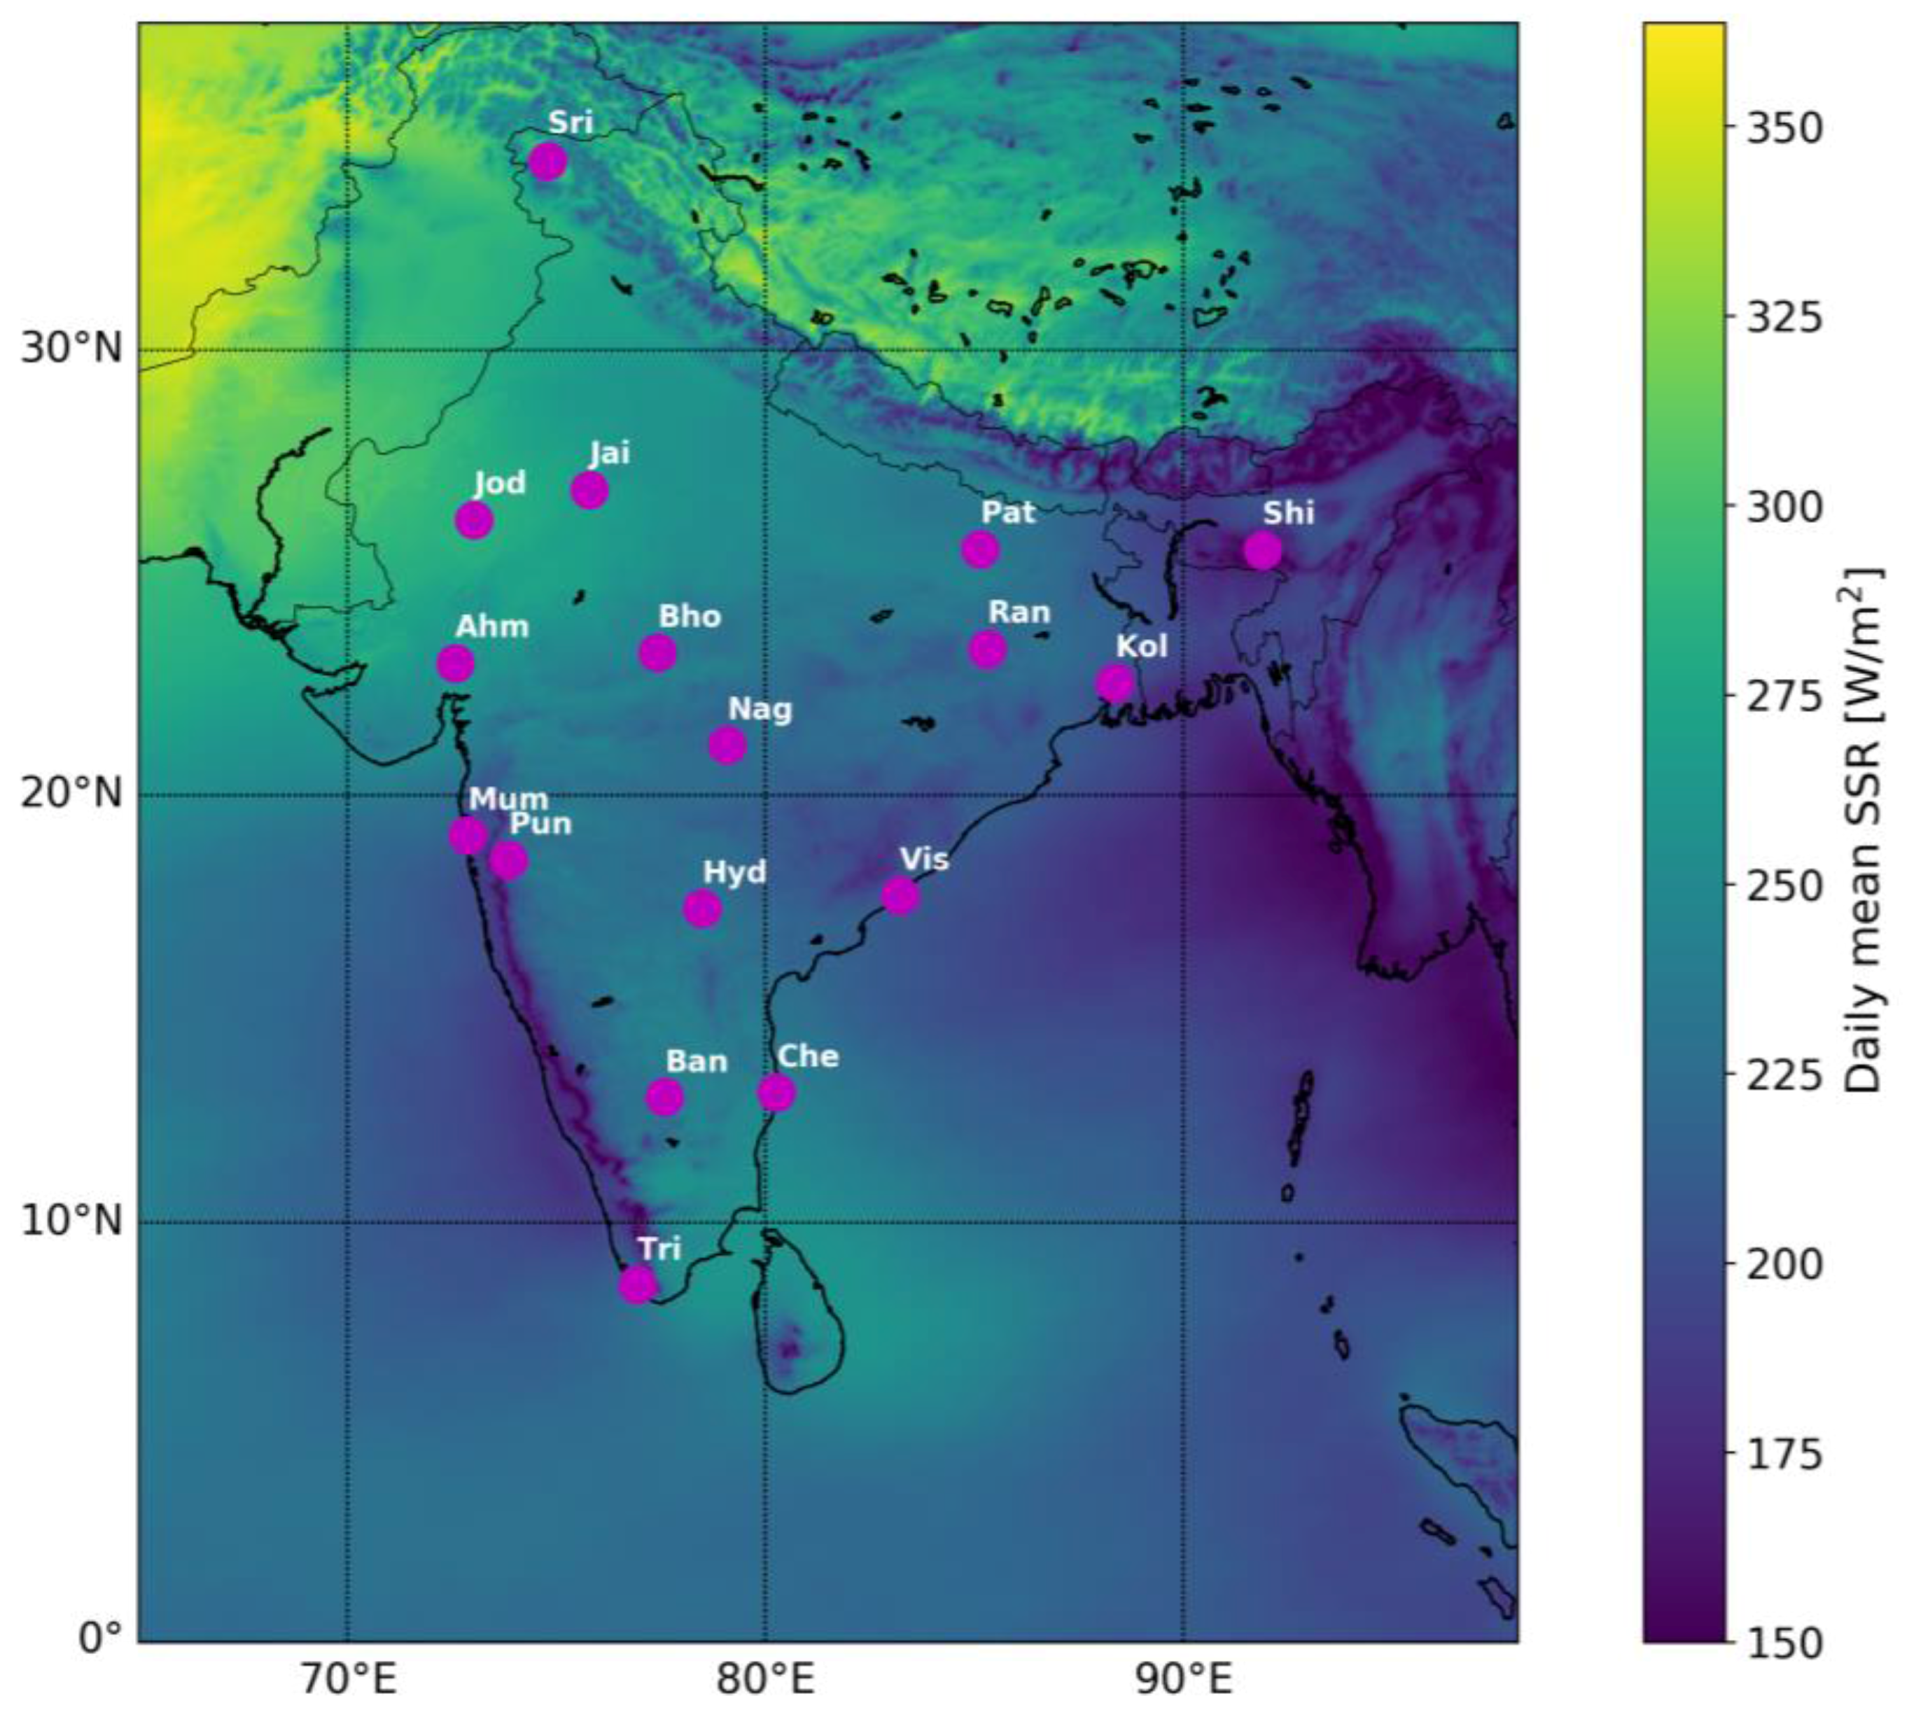
Figure 1. June mean SSR during 1999–2015 over the Indian subcontinent from SARAH-E data. Validation site locations shown with circular markers and partial site names. Decreased SSR along the western seaboard reflects the intense coastal cloudiness of the monsoon season.
Remotesensing 10 00392 g001
Figure 2. SARAH-E SSR estimation bias versus all in situ measurement sites. Blue markers are the daily mean SSR estimation errors (marker per site per day), while the red markers are the 10-day rolling mean of estimation errors.
Remotesensing 10 00392 g002
Figure 3. Annual mean SSR estimation bias per site (MBD, satellite minus in situ, W/m2). Rectangle color indicates the magnitude of annual mean SSR bias, size is proportional to the amount of valid in situ measurement days in each year.
Remotesensing 10 00392 g003
Figure 4. Geographical distribution across the validation sites of: (a) SARAH-E MBD; and (b) SARAH-E RMSD.
Remotesensing 10 00392 g004
Figure 5. (a) Monthly mean MBD of SARAH-E vs. all validation sites resolved for 1999–2014; and (b) relative monthly mean MBD of SARAH-E vs. all validation sites resolved for 1999–2014.
Remotesensing 10 00392 g005
Figure 6. Monthly mean SSR over all validation sites between 1999 and 2014 from: (a) SARAH-E; and (b) in situ measurements. Violin plots indicate the kernel density estimates for each month, cropped to data extents. Markers within represent the SSR of the different years in the period.
Remotesensing 10 00392 g006
Figure 7. AERONET level 1.5 measurements of Aerosol Optical Depth (AOD) at Pune for: (a) 440 nm; and (b) 675 nm. Blue circles indicate daily means, red triangles 10-day rolling mean. Black line indicates linear trend for 2005–2015.
Remotesensing 10 00392 g007
Figure 8. Comparison of daily mean SSR calculated from Simplified Solis with AERONET atmospheric inputs, and in situ measured SSR at Pune. Red bars and numbers at the bottom show their annual mean difference.
Remotesensing 10 00392 g008
Figure 9. Daily mean SSR trends for 1999–2009 (green) and 1999–2014 (orange): (a) from the SARAH-E time series; and (b) from IMD in situ measurements. Blue markers indicate available SSR data. SARAH-E and in situ data included only from sites with coverage from 1999 to 2014 (see Table 1).
Remotesensing 10 00392 g009
Table 1. Characteristics of the India Meteorological Department (IMD) sites measuring Surface Solar Radiation (SSR).
SiteLatitude (°N)Longitude (°E)Data CoverageComments and Climate Regime
Bangalore12.971677.59461999–2009Urban, tropical
Jodhpur26.238973.02431999–2014Desert, arid
Bhopal23.259977.41261999–2009Humid, subtropical
Pune18.520473.85671999–2014Suburban
Sri Nagar34.083774.79731999–2009Valley, mountainous
Jaipur26.912475.78731999–2009Semi-arid, dry
Ranchi23.344185.30961999–2010Urban, hilly
Visakhapatnam17.686883.21851999–2014Coastal, urban
Chennai13.082780.27071999–2014Coastal, urban
Trivandrum8.524176.93661999–2014Coastal, tropical
Nagpur21.145879.08821999–2010, 2013–2014Urban, dry apart from monsoon
Shillong25.578891.89331999–2014Subtropical highland, low AOD
Ahmedabad23.022572.57141999–2009, 2013–2014Dry, semi-arid
Hyderabad17.38578.48671999–2014Semi-arid
Kolkata22.572688.36391999–2012Sparse data, urban subtropical
Mumbai19.07672.87771999–2010, 2013–2014Coastal, urban
Patna25.594185.13761999–2009Urban
Table 2. Validation metrics for all sites (QA method: conservative).
SiteMBD (W/m2)MABD (W/m2)RMSD (W/m2)MBD (W/m2) 1999–2009MBD (W/m2) 2010–2014
Bangalore9.1218.8424.399.12N/A
Jodhpur24.6026.6431.4221.1837.71
Bhopal10.4518.5724.0910.45N/A
Pune20.9225.6031.4614.6942.84
Sri Nagar17.0426.7135.1217.04N/A
Jaipur5.3013.8318.045.30N/A
Ranchi20.9223.9229.6020.2632.67
Visakhapatnam31.8334.3439.6527.5547.10
Chennai26.3330.1937.4420.4347.12
Trivandrum38.3538.7742.3536.4546.99
Nagpur30.5231.9037.9825.5452.70
Shillong7.8530.1537.61-5.0540.75
Ahmedabad29.5530.8436.5825.1851.77
Hyderabad14.6222.1628.2212.3541.65
Kolkata27.8935.3543.0738.2237.34
Mumbai27.8531.2536.2925.9953.35
Patna28.9332.9838.9228.93N/A
All (mean)21.8927.7733.6619.6244.33