Article

Fast Automatic Airport Detection in Remote Sensing Images Using Convolutional Neural Networks

1
School of Resources and Environment, University of Electronic Science and Technology of China, 2006 Xiyuan Avenue, West Hi-Tech Zone, Chengdu 611731, Sichuan, China
2
Center for Information Geoscience, University of Electronic Science and Technology of China, 2006 Xiyuan Avenue, West Hi-Tech Zone, Chengdu 611731, Sichuan, China
3
Department of Geography, Vrije Universiteit Brussel, Pleinlaan 2, 1050 Brussels, Belgium
4
Department of Geography, Ghent University, Krijgslaan 281, S8, 9000 Ghent, Belgium
*
Author to whom correspondence should be addressed.
Remote Sens. 2018, 10(3), 443; https://doi.org/10.3390/rs10030443
Submission received: 5 February 2018 / Revised: 28 February 2018 / Accepted: 4 March 2018 / Published: 12 March 2018

Abstract

:
Fast and automatic detection of airports from remote sensing images is useful for many military and civilian applications. In this paper, a fast automatic detection method is proposed to detect airports from remote sensing images based on convolutional neural networks using the Faster R-CNN algorithm. This method first applies a convolutional neural network to generate candidate airport regions. Based on the features extracted from these proposals, it then uses another convolutional neural network to perform airport detection. By taking the typical elongated linear geometric shape of airports into consideration, some specific improvements to the method are proposed. These approaches successfully improve the quality of positive samples and achieve a better accuracy in the final detection results. Experimental results on an airport dataset, Landsat 8 images, and a Gaofen-1 satellite scene demonstrate the effectiveness and efficiency of the proposed method.

Graphical Abstract

1. Introduction

Fast and automatic detection of airports from remote sensing images is useful in many military and civilian applications [1,2]. In recent years, airport detection has gained increased attention and has been a topic of interest in computer vision and remote sensing research.
Many researchers have studied this problem and have reported valuable results in literature. Some previous works focused on using the characteristics of runways, which generally have obvious elongated parallel edges [3,4,5,6,7]. They used edge or line segment extraction methods to delineate the shape of airport runways. Some scholars used textural information or shape features for airport detection via classifiers, such as support vector machine (SVM) or Adaptive Boosting (AdaBoost) algorithm [8,9,10]. In remote sensing images, however, there could be ground objects such as roads or coastlines, which demonstrate linear shape features or textural features similar to runways. This will lower the performance of these algorithms and can lead to a relatively high false alarm rate. Tao et al. [1] proposed to implement the airport detection task based on a set of scale-invariant feature transform (SIFT) local features. Within a dual-scale and hierarchical architecture, they first used clustered SIFT keypoints and segmented region information to locate candidate regions that may contain an airport in the coarse scale. Then, these candidate regions were mapped to the original scale and texture information was used for airport detection with a SVM classifier. Similarly, Zhu et al. [11] used SIFT descriptors and SVM to detect airports, but using a two-way saliency technique to predict candidate regions. Tang et al. [2] proposed a two-step classification method for airport detection. They first used a SVM classifier on the line segments to extract candidate regions, and then used another SVM on the texture features. Budak et al. [12] also used a line segment detector (LSD) to locate candidate regions, but they employed SIFT features and Fisher vector representation to detect airports with a SVM classifier. More recently, Zhang et al. [13] proposed to detect airports from optical satellite images using deep convolutional neural networks, and achieved some good results. However, the computational load of their method is heavy. They first used a hand-designed line detection approach to generate region proposals (From this point on, we will use the terms ‘candidate regions’ and ‘region proposals’ alternatively without a meaningful differentiation because both are used interchangeably in the literature), and then used the AlexNet to identify airport in each proposal separately. A heavy computational load impedes this method’s practical applications when computational resources are limited, and fast detection is required. Deriving candidate regions from line segments is indeed rather complicated and requires careful hand-tuning of many parameters. For example, the widely used LSD algorithm generally takes about 1 s for a typical image of size 880 × 1600. Computing features from images is also heavy. For example, the SIFT algorithm generally takes about 1 s for a proposal, while computing texture features derived from the co-occurrence matrix generally takes more than 3 s. Current methods therefore cannot achieve an adequate real-time or near real-time detection performance. As far as we know, all the reported airport detection methods in the literature cannot perform the detection procedure in less than 1 s. The common weakness of the current methods therefore appears to be the heavy computational loads. Nevertheless, computational efficiency is important to most applications.
In recent years, many methods were proposed for detecting ordinary objects in natural images by using convolutional neural networks (CNN). Girshick et al. [14] first used region-based convolutional neural networks (R-CNN) for object detection. In their method, selective search algorithm [15] is first used to generate region proposals. Then, each scale-normalized proposal is classified using the features that are extracted with a convolutional neural network. Because this method performs a forward pass in the convolutional neural network for each object proposal without sharing computation, it is very slow. He et al. [16] proposed a method to speed up the original R-CNN algorithm by introducing a spatial pyramid pooling layer and reusing the features generated at several image resolutions. This method avoids repeatedly computing the convolutional features. Girshick [17] proposed a region of interest (RoI) pooling layer to extract a fixed-length feature vector from the feature map at a single scale. Based on the work of Girshick [17], Ren et al. [18] proposed the Faster R-CNN algorithm, which shows that the selective search proposals can be replaced by the ones that are learned from a convolutional neural network. This method has demonstrated good object detection accuracy with fast computational speed. Recently, Redmon et al. [19,20] proposed two real-time object detection approaches. Although these two algorithms are very fast, it is observed that they are not good at detecting small objects and they struggle to generalize to objects in new or unusual aspect ratios [19,20]. These CNN-based object detection approaches have achieved some state-of-the-art results for ordinary objects in daily life scenes. However, for some special objects like airports in remote sensing images, specific techniques to improve detection performance are still needed.
In this paper, we propose a fast automatic airport detection method that relies on convolutional neural networks, using the Faster R-CNN algorithm [18]. Based on a deep convolutional neural network architecture, this method first uses a region proposal network (RPN) to obtain many candidate proposals. The features extracted from the CNN’s convolutional feature map of these proposals are then used for airport detection. The CNN for airport detection and the RPN for region proposal share the same convolutional layers. This adds only a small computational load for the airport detection network, and allows for training the CNN and the RPN alternatively with the same training dataset. To handle the typical elongated linear geometric shape of airports with the Faster R-CNN algorithm, which is typically used to detect ordinary objects in daily life scenes, we propose to include additional scale and aspect ratios to increase the quality of positive samples. In addition, we use a constraint to sieve low quality positive samples. Experimental results on an airport dataset, Landsat 8 images, and a Gaofen-1 satellite scene demonstrate the effectiveness and efficiency of the proposed method.
The remainder of this paper is organized as follows. In Section 2, we first introduce the neural network architecture and the domain-specific fine-tuning and data argumentation methods of the proposed approach. We then present some specific improvement techniques for airport detection. In Section 3, we first test the proposed method on a set of airport images, and then evaluate its practical performance on Landsat 8 images and a Gaofen-1 satellite scene. Next, the results of these improvements are presented and discussed and, finally, conclusions are drawn in Section 4.

2. Methodology

In the machine learning area, CNNs have demonstrated a much better feature representation than traditional methods [21] and they have shown great potential in many visual applications. A CNN is formed by a stack of distinct layers, where each successive layer uses the output from the previous layer as input. These multiple layers make the network very expressive to learn relationships between inputs and outputs. By using an appropriate loss function on a set of labeled training data, which penalizes the deviation between the predicted and true labels, the weights of these layers can be obtained by supervised learning. In the following, we first introduce the network architecture of the proposed method for airport detection, and then present some specific improvement techniques of the proposed method. The flowchart of the proposed algorithm is shown in Figure 1.

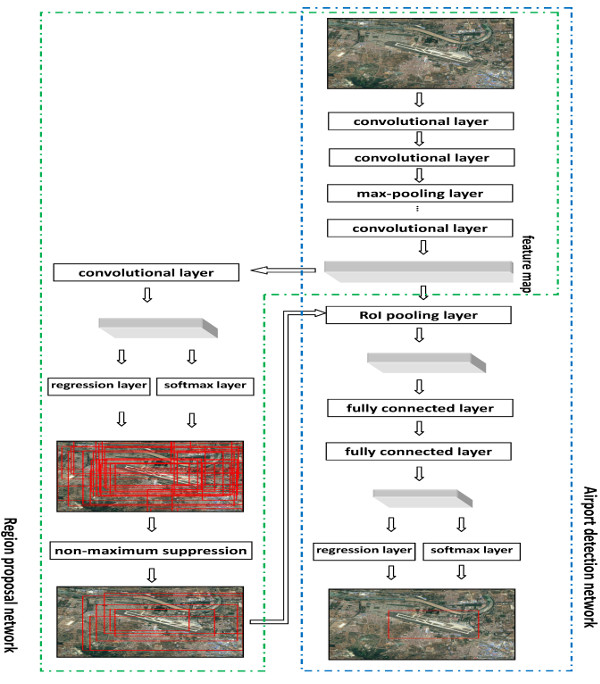
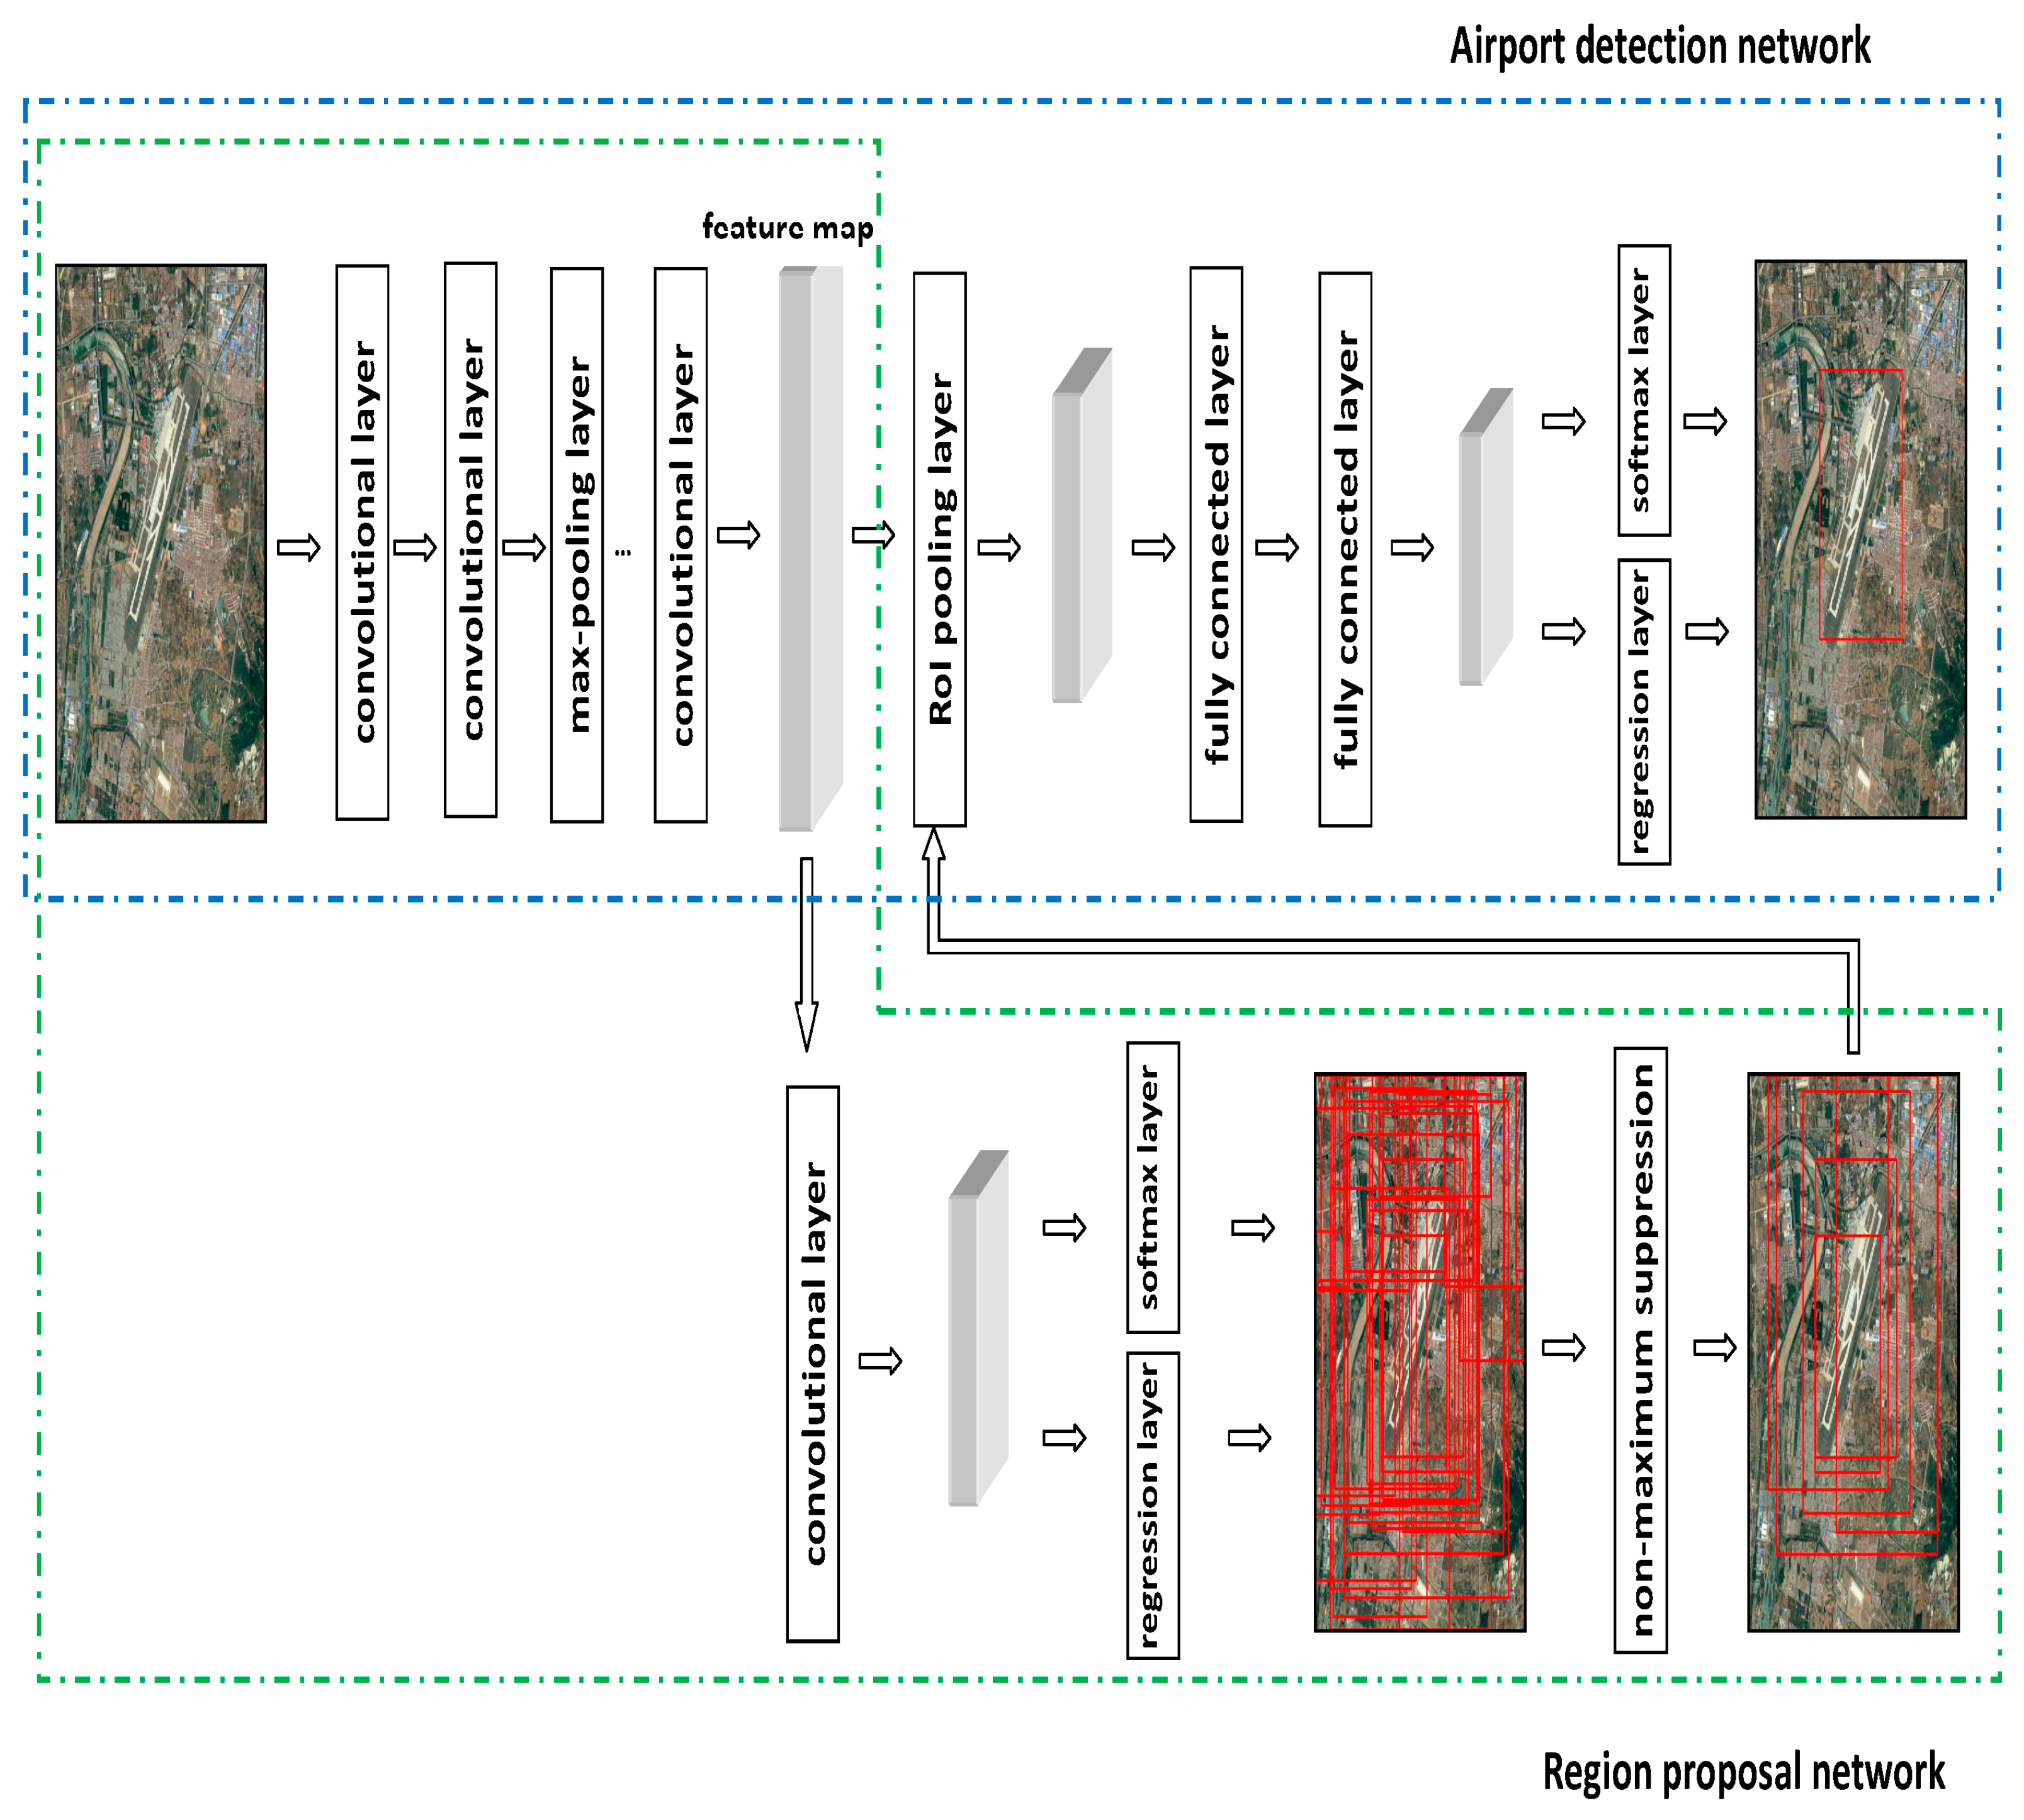
2.1. Convolutional Neural Network for Airport Detection

The Visual Geometry Group network with 16 layers (VGG-16) [22] was used in our experiments. This network has demonstrated better performance than many other networks by using a deeper convolutional network architecture [17,18,22]. The network has 13 convolutional layers, where the filters have 3 × 3 receptive fields with stride 1. The convolutional process is defined as
y i , j , d = i = 1 H j = 1 W d = 1 D f i , j , d , d × x i + i 1 , j + j 1 , d + b d
where x i , j , d and y i , j , d are the respective input and output neuron values at position ( i , j ) in the dth channel. f is the filter, and b d is the bias in the dth channel. Nonlinear rectified linear unit (ReLU)
f ( x ) = max ( 0 , x )
where x is the input to a neuron, is used for each layer.
Max-pooling
y i , j , d = max i = 1 , 2 ; j = 1 , 2 x i + i 1 , j + j 1 , d
where x i , j , d and y i , j , d are the input and output neuron values at position ( i , j ) in the dth channel, respectively, is performed with stride 2, following two or three convolutional layers [21,22,23].
A RoI pooling layer and two fully connected layers were used to extract a fixed-length (4096-dimensional in the experiments) feature vector from the convolutional feature map for each proposal generated by the RPN, which will be introduced in the following section. The RoI pooling layer divides a region proposal into a fixed-size grid and then in each grid cell uses max-pooling on the values, which are in the corresponding sub-windows in the feature map. The extracted feature vector was used in a fully connected layer to produce the softmax probability estimated as airport and in another fully connected layer to produce the four values that encoded the refined bounding box position of the airport using regression. For the two fully connected layers, dropout regularization [24] was performed with probability 0.5 for individual nodes. More details about the network architecture can found in [17,22]. If the score of a proposal generated by the network is larger than a pre-specified threshold, an airport is claimed to be detected in the refined proposal.

2.2. Region Proposal Network

RPN is a deep network that can produce proposals in an effective forward computational way with the feature map produced by the CNN described in the previous section. It first adds an additional convolutional layer on the top of the feature map obtained by that CNN to extract a fixed-length (512-dimensional in the experiments) feature vector at each convolutional map position. Then, the extracted feature vector is fed into two additional sibling fully connected layers. One outputs a set of rectangular positions relative to different scales and aspect ratios at that convolutional map position, and the other outputs the scores of these rectangular positions. ReLU is also used for the convolutional layer. Because the RPN shares the convolutional layers with the CNN for airport detection, the RPN adds only small computational load to the original CNN for airport detection. More details of the RPN architecture can be found in [18].
Note that the region proposals produced by the RPN generally overlap each other. Therefore, non-maximum suppression (NMS) is performed on the produced proposals based on their scores. A region proposal is rejected if it has an intersection-over-union (IoU) overlap, which is more than a specified threshold, with another region proposal that has higher score. IoU was computed as the intersection divided by the union of two sets
IoU = area ( A B ) area ( A B )
where A B and A B denote the union and intersection of two concerned sets, respectively, and area() denotes the area of a set.
After NMS, the top-300 proposals are fed in the above CNN RoI pooling layer to produce the final airport detection.

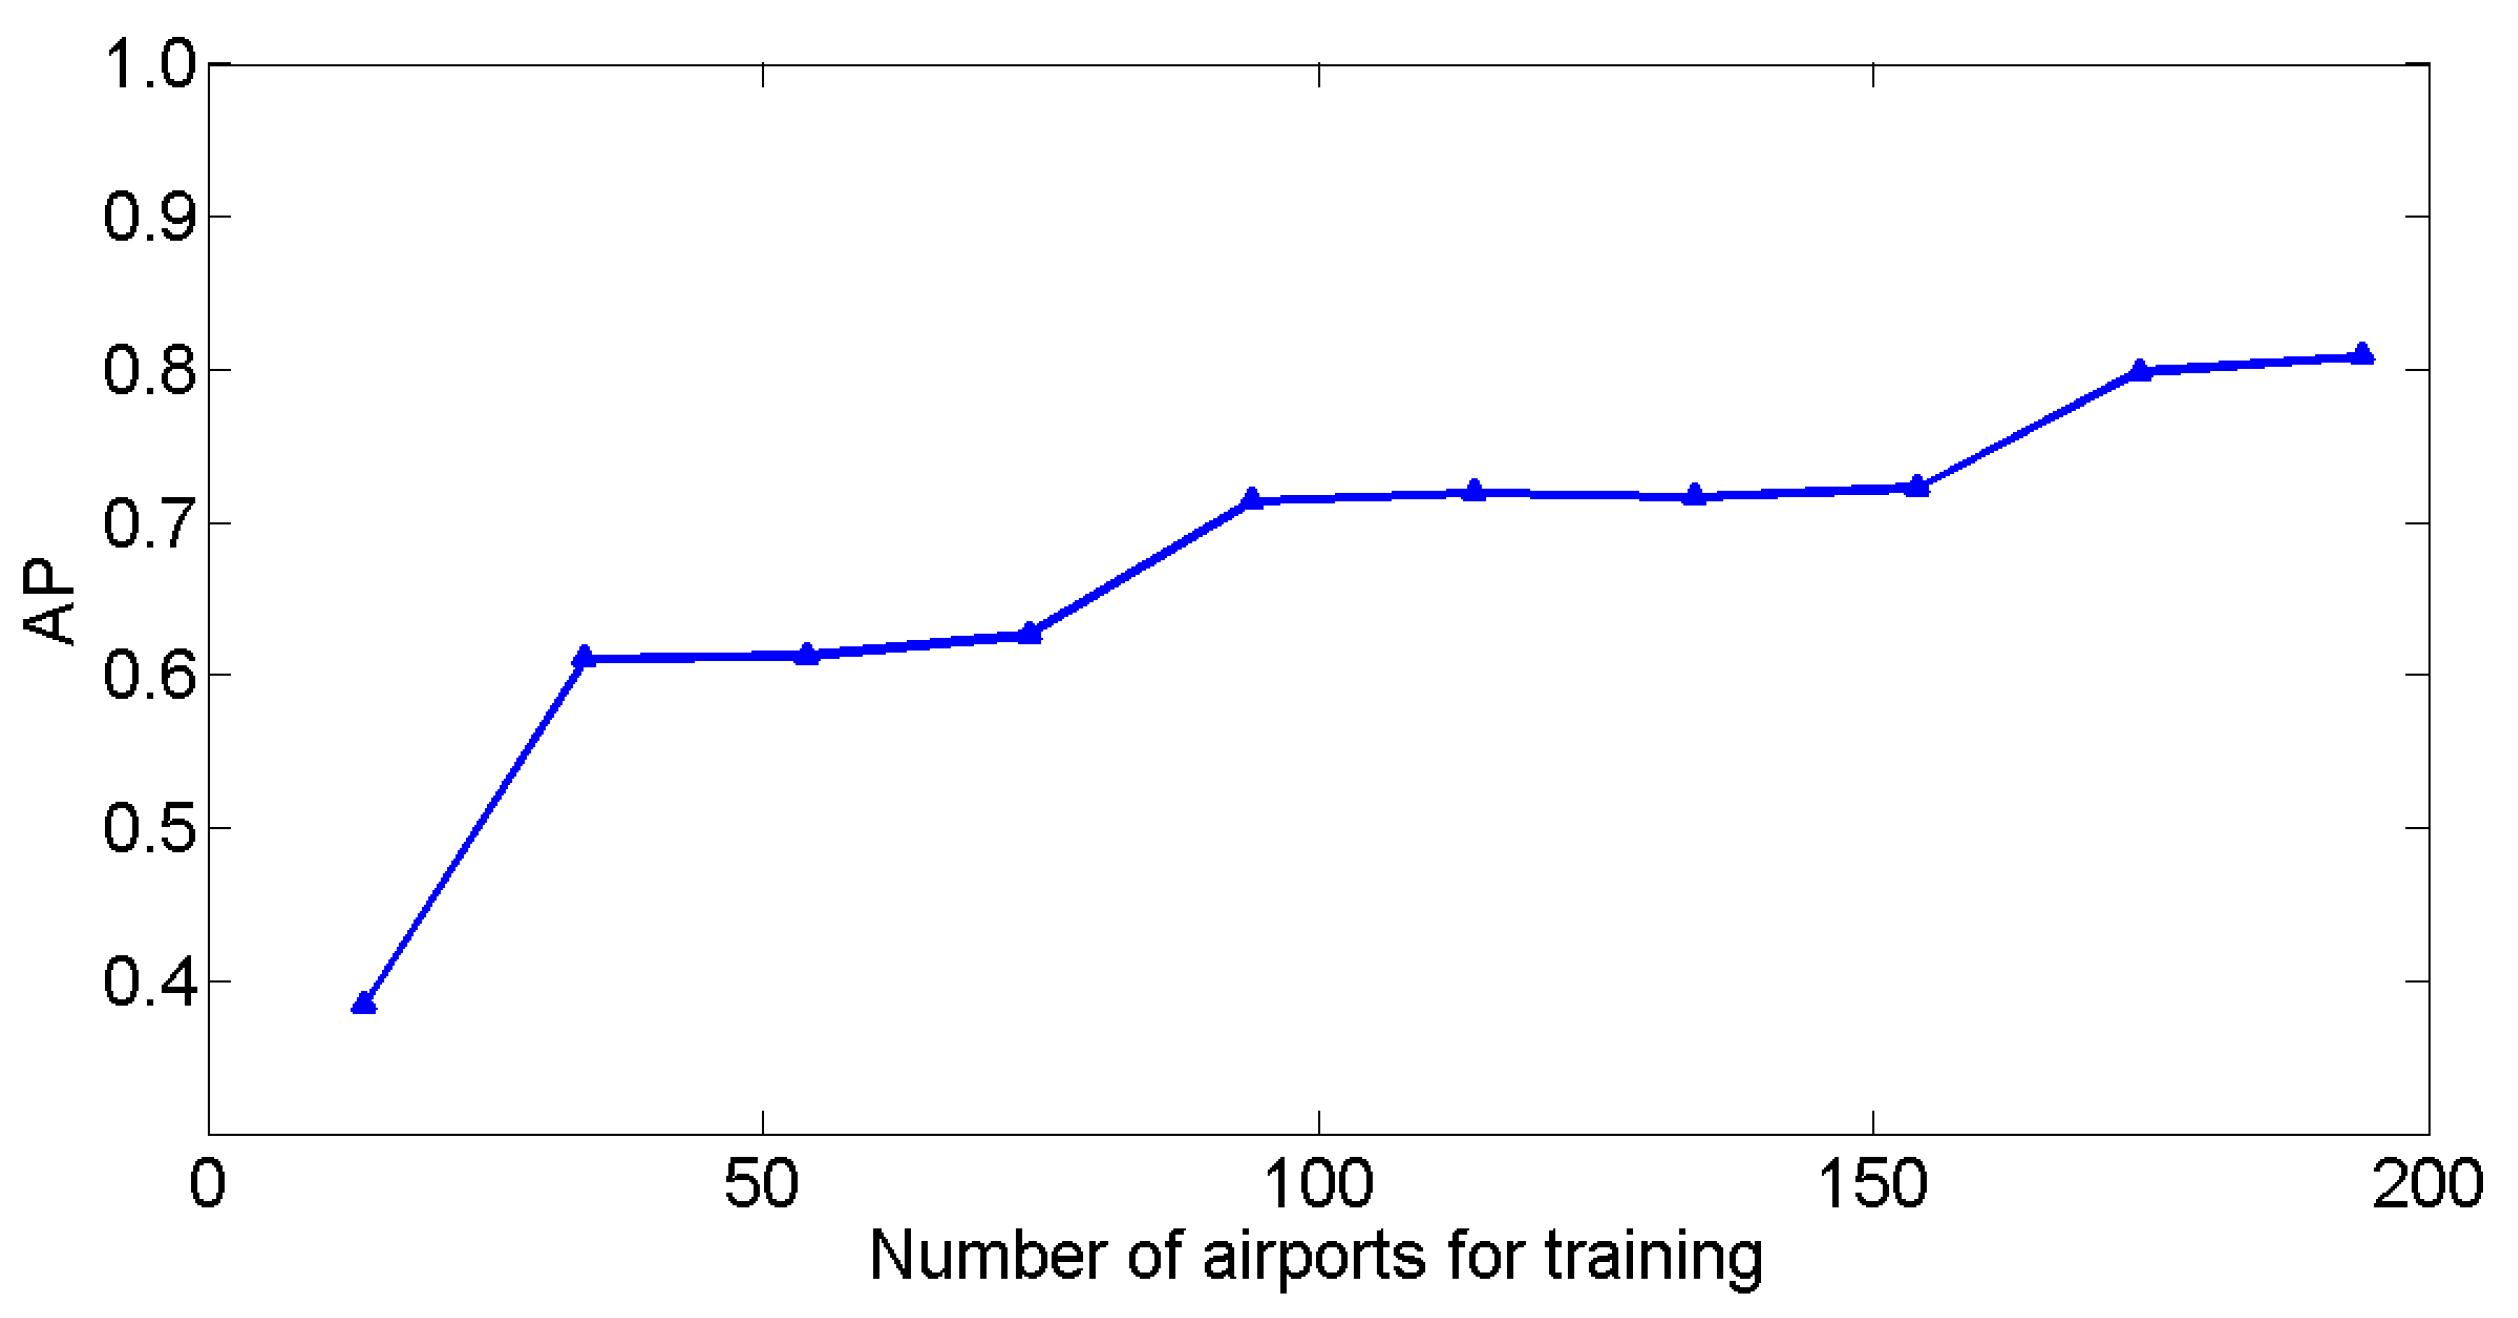
2.3. Fine-Tuning and Argumentation

In our collected airport dataset, which is introduced in the following section, only a limited number of airports were available. As the CNN requires a large amount of data for training in order to avoid overfitting, we used the pre-trained network weights of the VGG model, which was successfully trained with the widely used ImageNet Large Scale Visual Recognition Challenge (ILSVRC) dataset [18,21]. To adapt the pre-trained CNN to the airport detection task, we fine-tuned these network weights using the collected airport dataset. Due to limited memory, the shared convolutional layers were initialized by the pre-trained VGG model weights and only the conv3_1 (the first layer of the third stack of convolutional layers) and upper layers were fine-tuned. Because the RPN shares the convolutional layers with the CNN for airport detection, these two networks can be trained alternatively between fine-tuning for the region proposal task and then fine-tuning for the airport detection task. In our experiments, we used argumentation techniques such as horizontal flip, vertical flip, image rotation, and image translation to enlarge the training data. It was observed that this domain-specific fine-tuning allows learning good network weights for a high-capacity CNN for airport detection.

2.4. Improvement Techniques

In the original Faster R-CNN algorithm [18], which was proposed for detecting ordinary objects, at each feature map position, nine region proposals were predicted at three scales of 1282, 2562, and 5122, and three aspect ratios of 1:1, 1:2, and 2:1. However, we found that there are many small airfields in remote sensing images of medium spatial resolution (e.g., 16 m), especially in America, Europe and on certain islands. In such cases, the smallest scale of 1282 would be too large to accurately locate these. Therefore, in our implementation, another scale of 642 was added. For example, in Figure 2, there is a small airport (Matsu Peigan) located in the scene, and its bounding box is indicated by the blue rectangle. One of the positive samples, which were obtained by the original Faster R-CNN algorithm with the smallest scale of 1282, is indicated by the red rectangle in Figure 2a. Although this positive sample includes the whole area of the airfield, it is too large and most of the pixels in it are other ground objects. This redundant information lowers the quality of the training samples. By using a smaller scale of 642, the positive sample, which is shown in Figure 2b, is more accurate than the one shown in Figure 2a. The runway, which always demonstrates an elongated geometric linear shape, is the most important feature for airport detection. We found that the aspect ratios of 1:1, 1:2, and 2:1, which are generally sufficient for detecting ordinary objects, cannot accurately locate those vertical or horizontal runways that have elongated bounding boxes. Therefore, two aspect ratios of 1:3 and 3:1 were added in our implementation. For example, in Figure 3, there is a nearly horizontal airport (Matsu Nangan airport) and its bounding box, indicated by the blue rectangle, demonstrates an elongated geometric shape. One of the positive samples, which were obtained by the original Faster R-CNN algorithm with the aspect ratio of 1:2, is shown in the red rectangle in Figure 3a. One can see that this positive sample only covers a part of the runway area. By using a bigger aspect ratio of 1:3, one can obtain a better positive sample (shown in red rectangle in Figure 3b). In our experiments, we observed that the added scale and aspect ratios helped to increase both the quality of positive samples and the final accuracy of airport detection.
In CNN training by back-propagation and stochastic gradient descent [25], the quality of the positive samples is important to obtain good network weights, which will affect the final detection accuracy. In the original Faster R-CNN algorithm [18], which was proposed for ordinary object detection, positive samples were labeled to the region that has the highest IoU overlap with the bounding box or to those regions that have an IoU ratio overlap higher than 0.7 with the bounding box. This works for ordinary objects that have a relatively small aspect ratio. However, in this paper we want to detect airports, which have elongated linear shapes. Simply using the IoU ratio overlap with the bounding box for that purpose could generate positive samples that cover only a small fraction of the runway area in the ground-truth. As the runway is often the only obvious feature that can be used for airport detection, this could lead to low-quality positive samples.
Nominal positive samples that are generated from airfield images in which the runway has a diagonal or anti-diagonal direction, for example, may cover only a small part of that runway. We observed that such samples contain so little valuable information that they cannot have a positive effect on network training. In Figure 4a, the Zhangjiakou Ningyuan airport (blue rectangle indicates bounding box) has a runway with an elongated linear shape in the diagonal direction. The ground-truth of the runway area occupies only a small fraction of pixels in its bounding box. One of the positive samples, obtained using the rules of the original Faster R-CNN algorithm (red rectangle in Figure 4a), only covers a very small fraction of the runway located in the right top corner. Most of the information in this nominal positive sample is therefore redundant. In Figure 4b, there is a smaller airport (Yangzhou Taizhou airport). One of the positive samples that were obtained using the original Faster R-CNN algorithm (red rectangle) only covers the terminal building and a very small fraction of the runway. As the runway could be the only detectable feature in this airport, we believe that this positive sample is not a typical airport image. In fact, it is even very hard for a human to determine whether it is an airport by looking at only this sample. We therefore propose to add a constraint on the positive samples to sieve the low quality ones, i.e., those that only cover a few airport pixels such as the examples shown in Figure 4. In our implementation, if a positive sample obtained by the original Faster R-CNN algorithm covers less than 70% of ground-truth runway pixels, it will be discarded in the training process. Although this will decrease the number of positive samples for CNN training, in our experiments, we observed that the final accuracy of airport detection did not decrease but increased instead.

3. Results

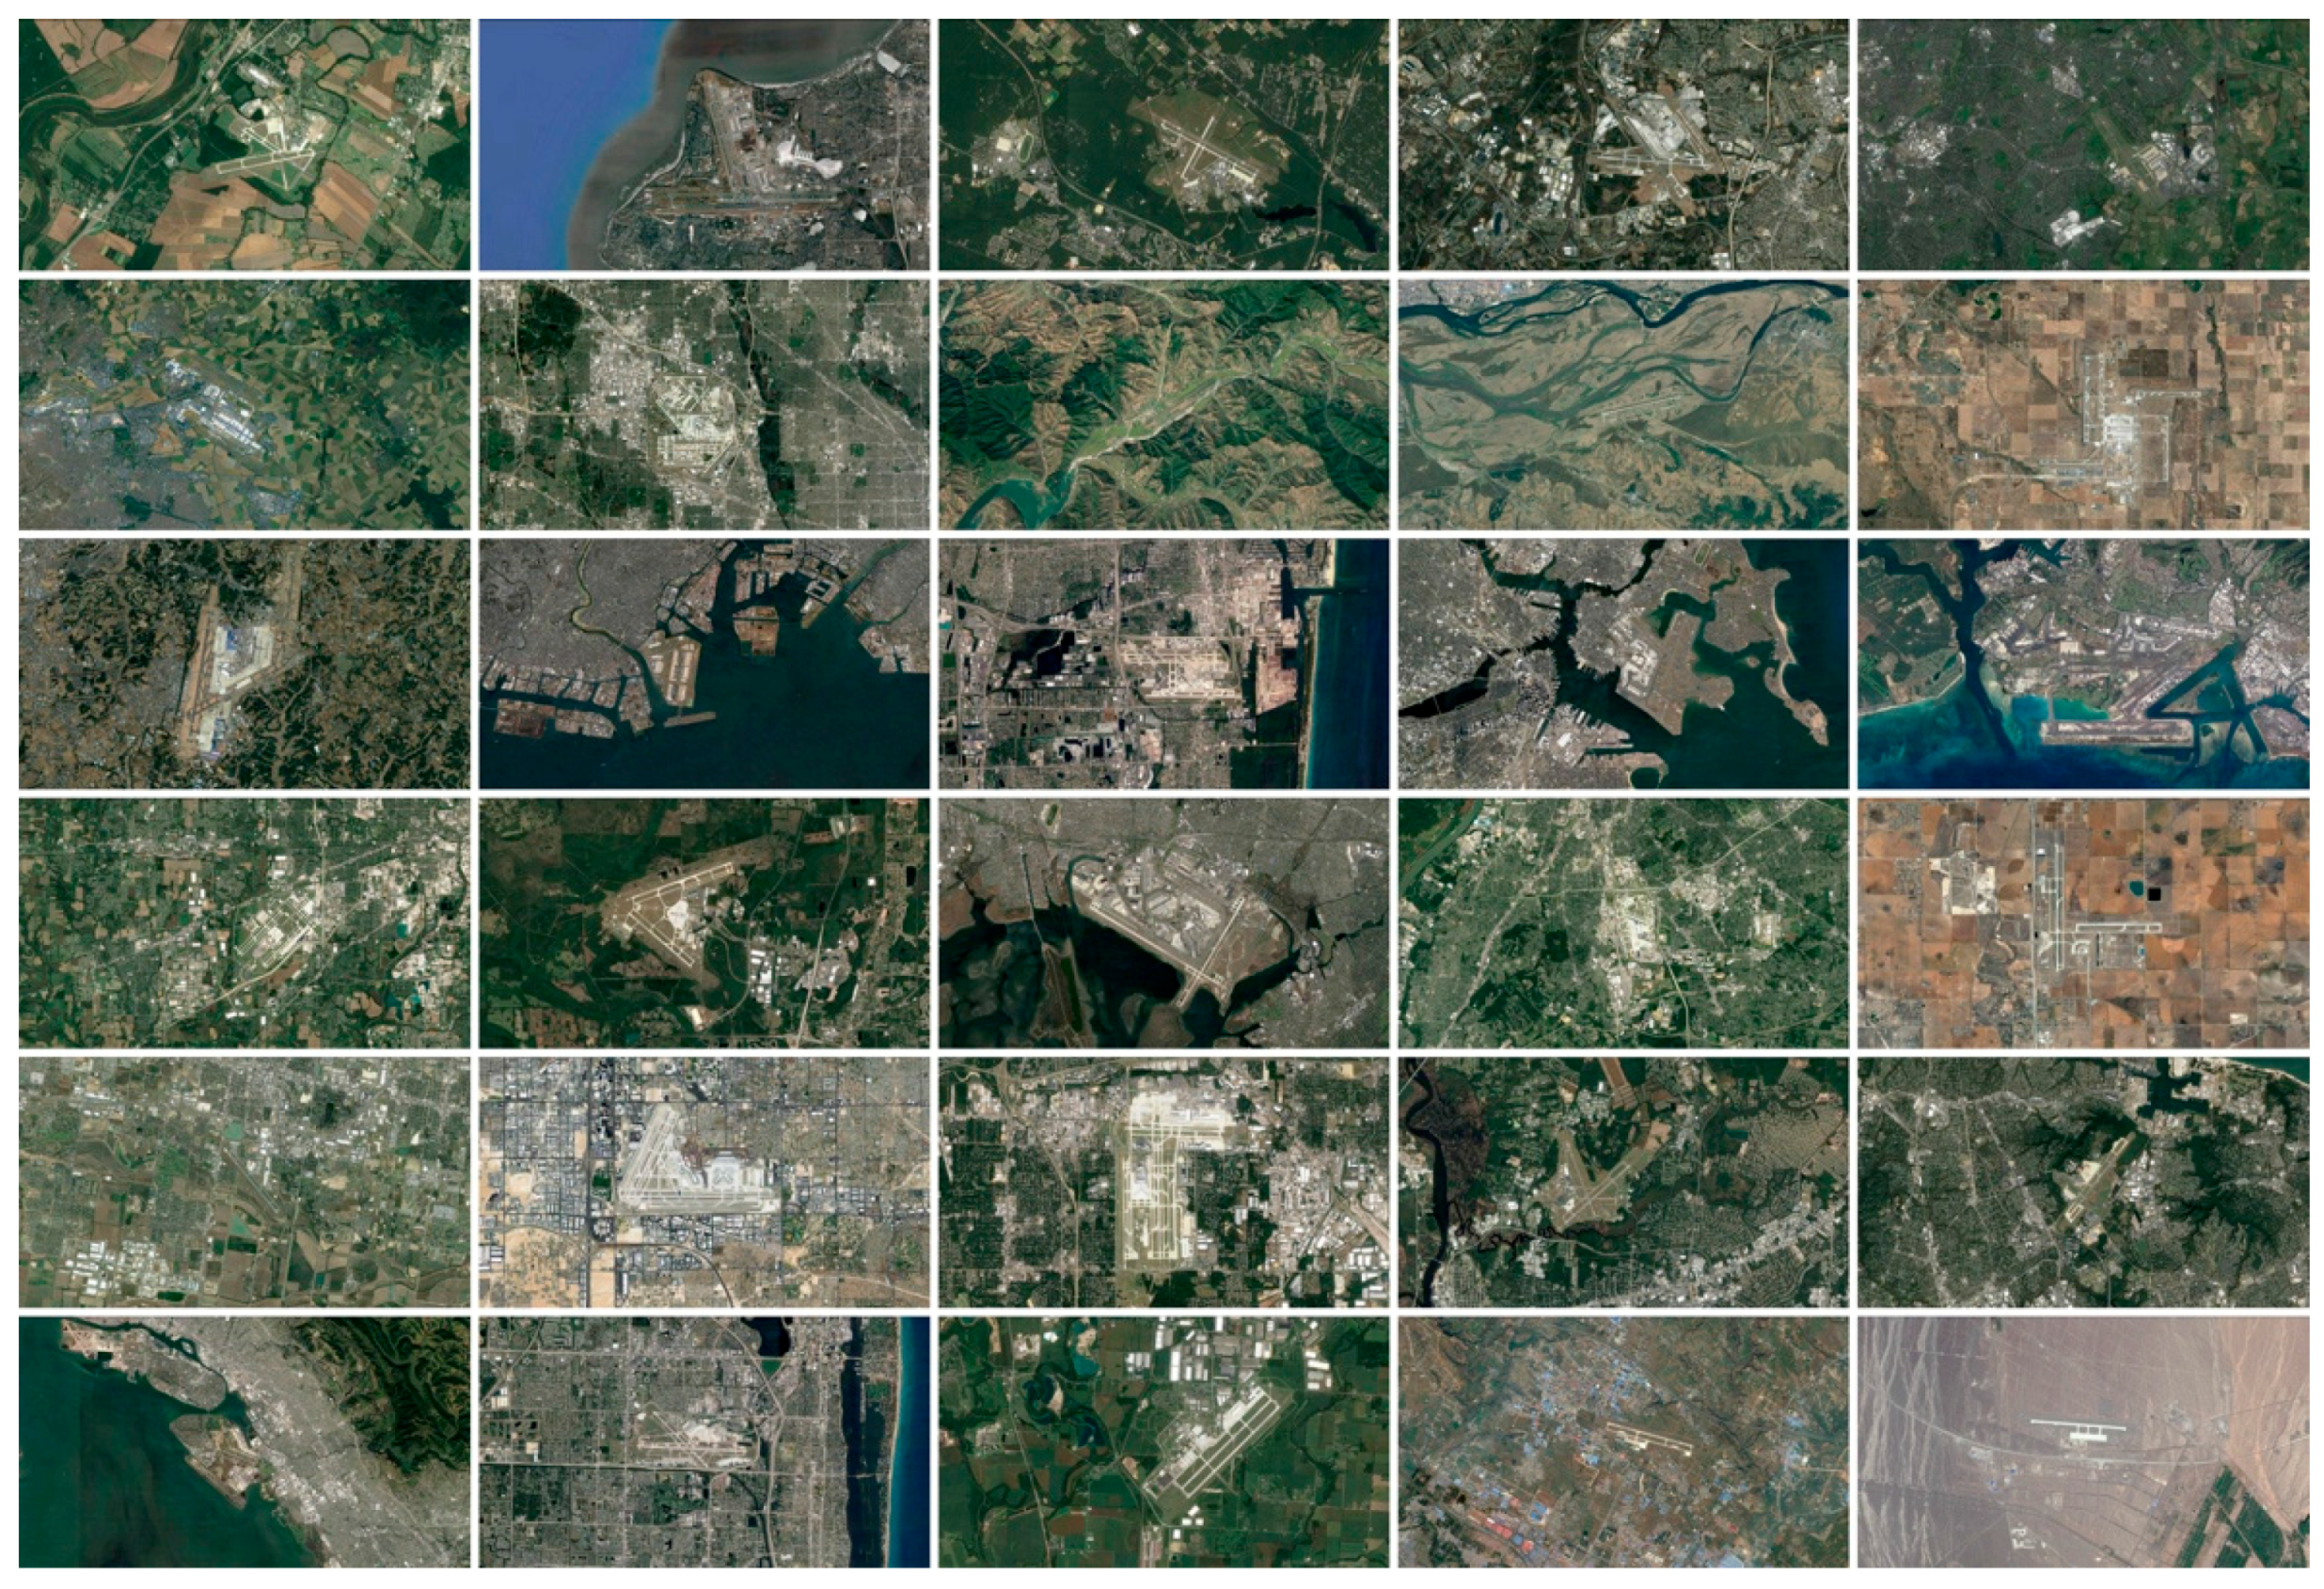
3.1. Dataset and Computational Platform

We collected images from 343 airports around the world from Google Earth. These airports have various sizes from very large ones such as Chicago O’Hare to very small airfields such as Matsu Peigan. For each airport, images were collected at a spatial resolution of 8 m or 16 m and at different angles of view. The average size of these images is about 885 × 1613 pixels. 194 airports were randomly chosen as training data, which include 377 images collected at these airports. Some of the training airport images are shown in Figure 5. By using the argumentation methods mentioned in Section 2.3, an enlarged training dataset of about 28,000 images was obtained. The rest of the 149 airports were used for detection performance testing, which include 281 images collected at these airports. Another 50 images, which have no airports but some similar ground objects, were also used for testing. Landsat 8 images acquired in four seasons, and a Gaofen-1 satellite scene that covers the Beijing-Tianjin-Hebei area, China, were also taken to test the practical performance of the proposed method.
All the experiments were implemented on a personal computer with double 3.6-GHz Intel i7 cores, 8 GB DDR4 memory, and an NVIDIA GeForce GTX1060 graphics card with 6 GB memory. The experiments were implemented using Caffe [26].

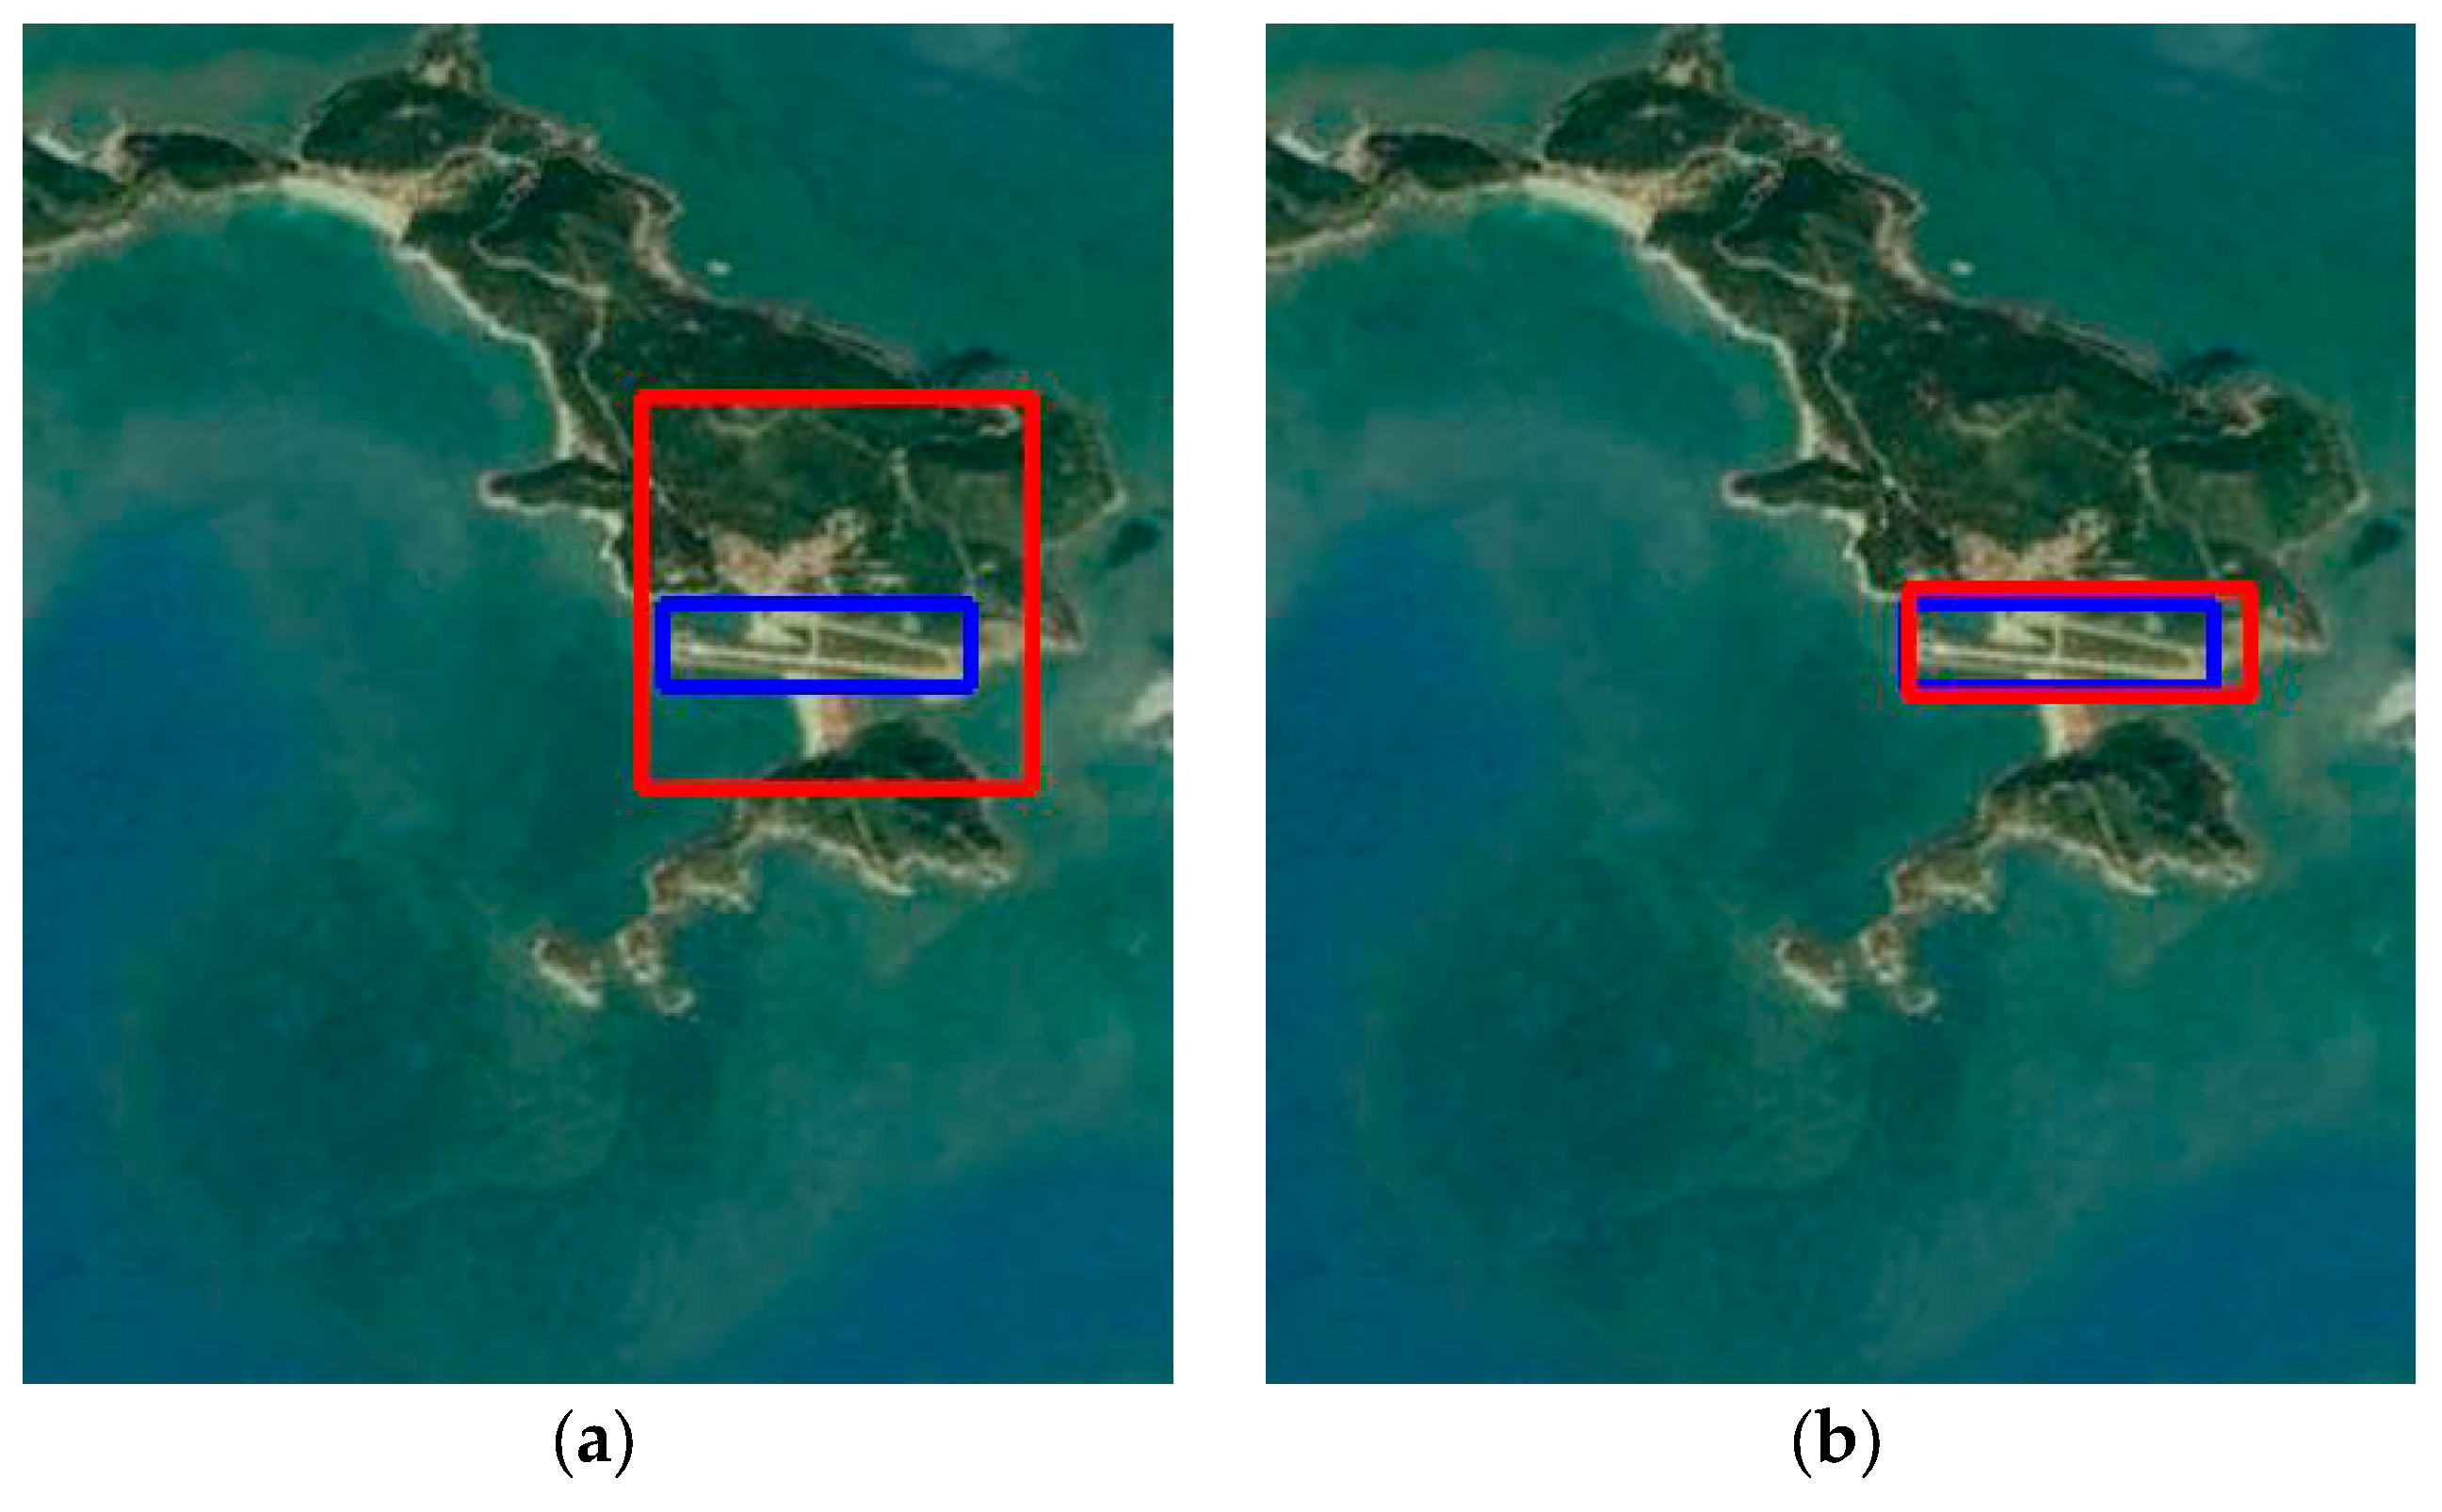
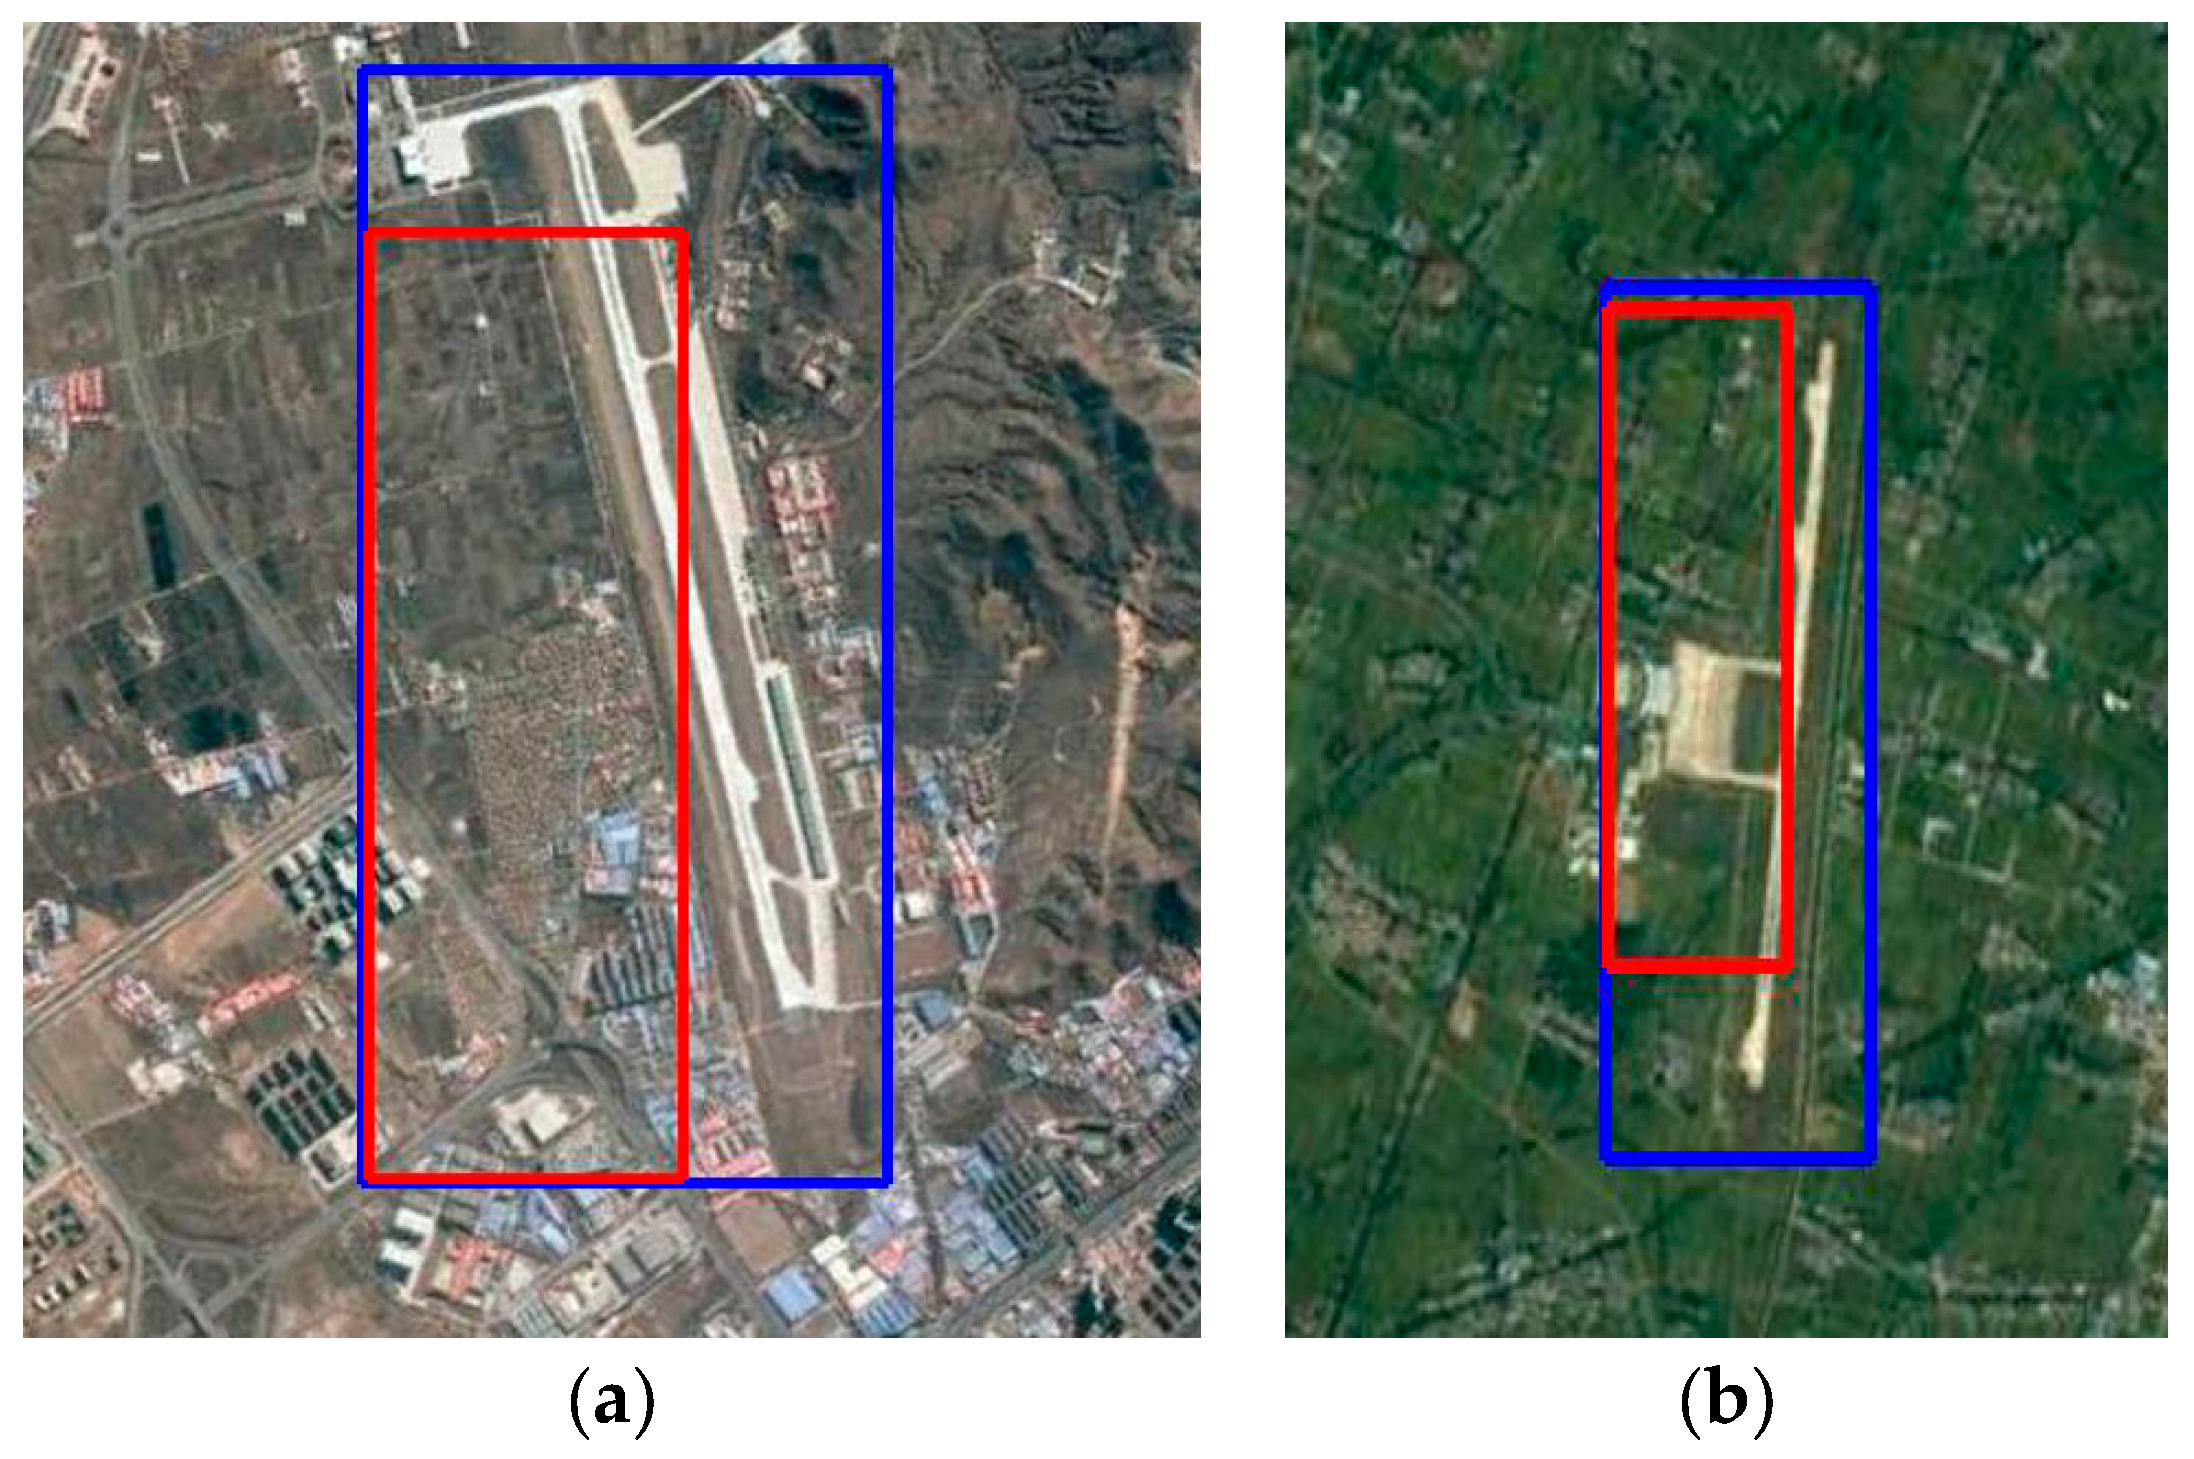
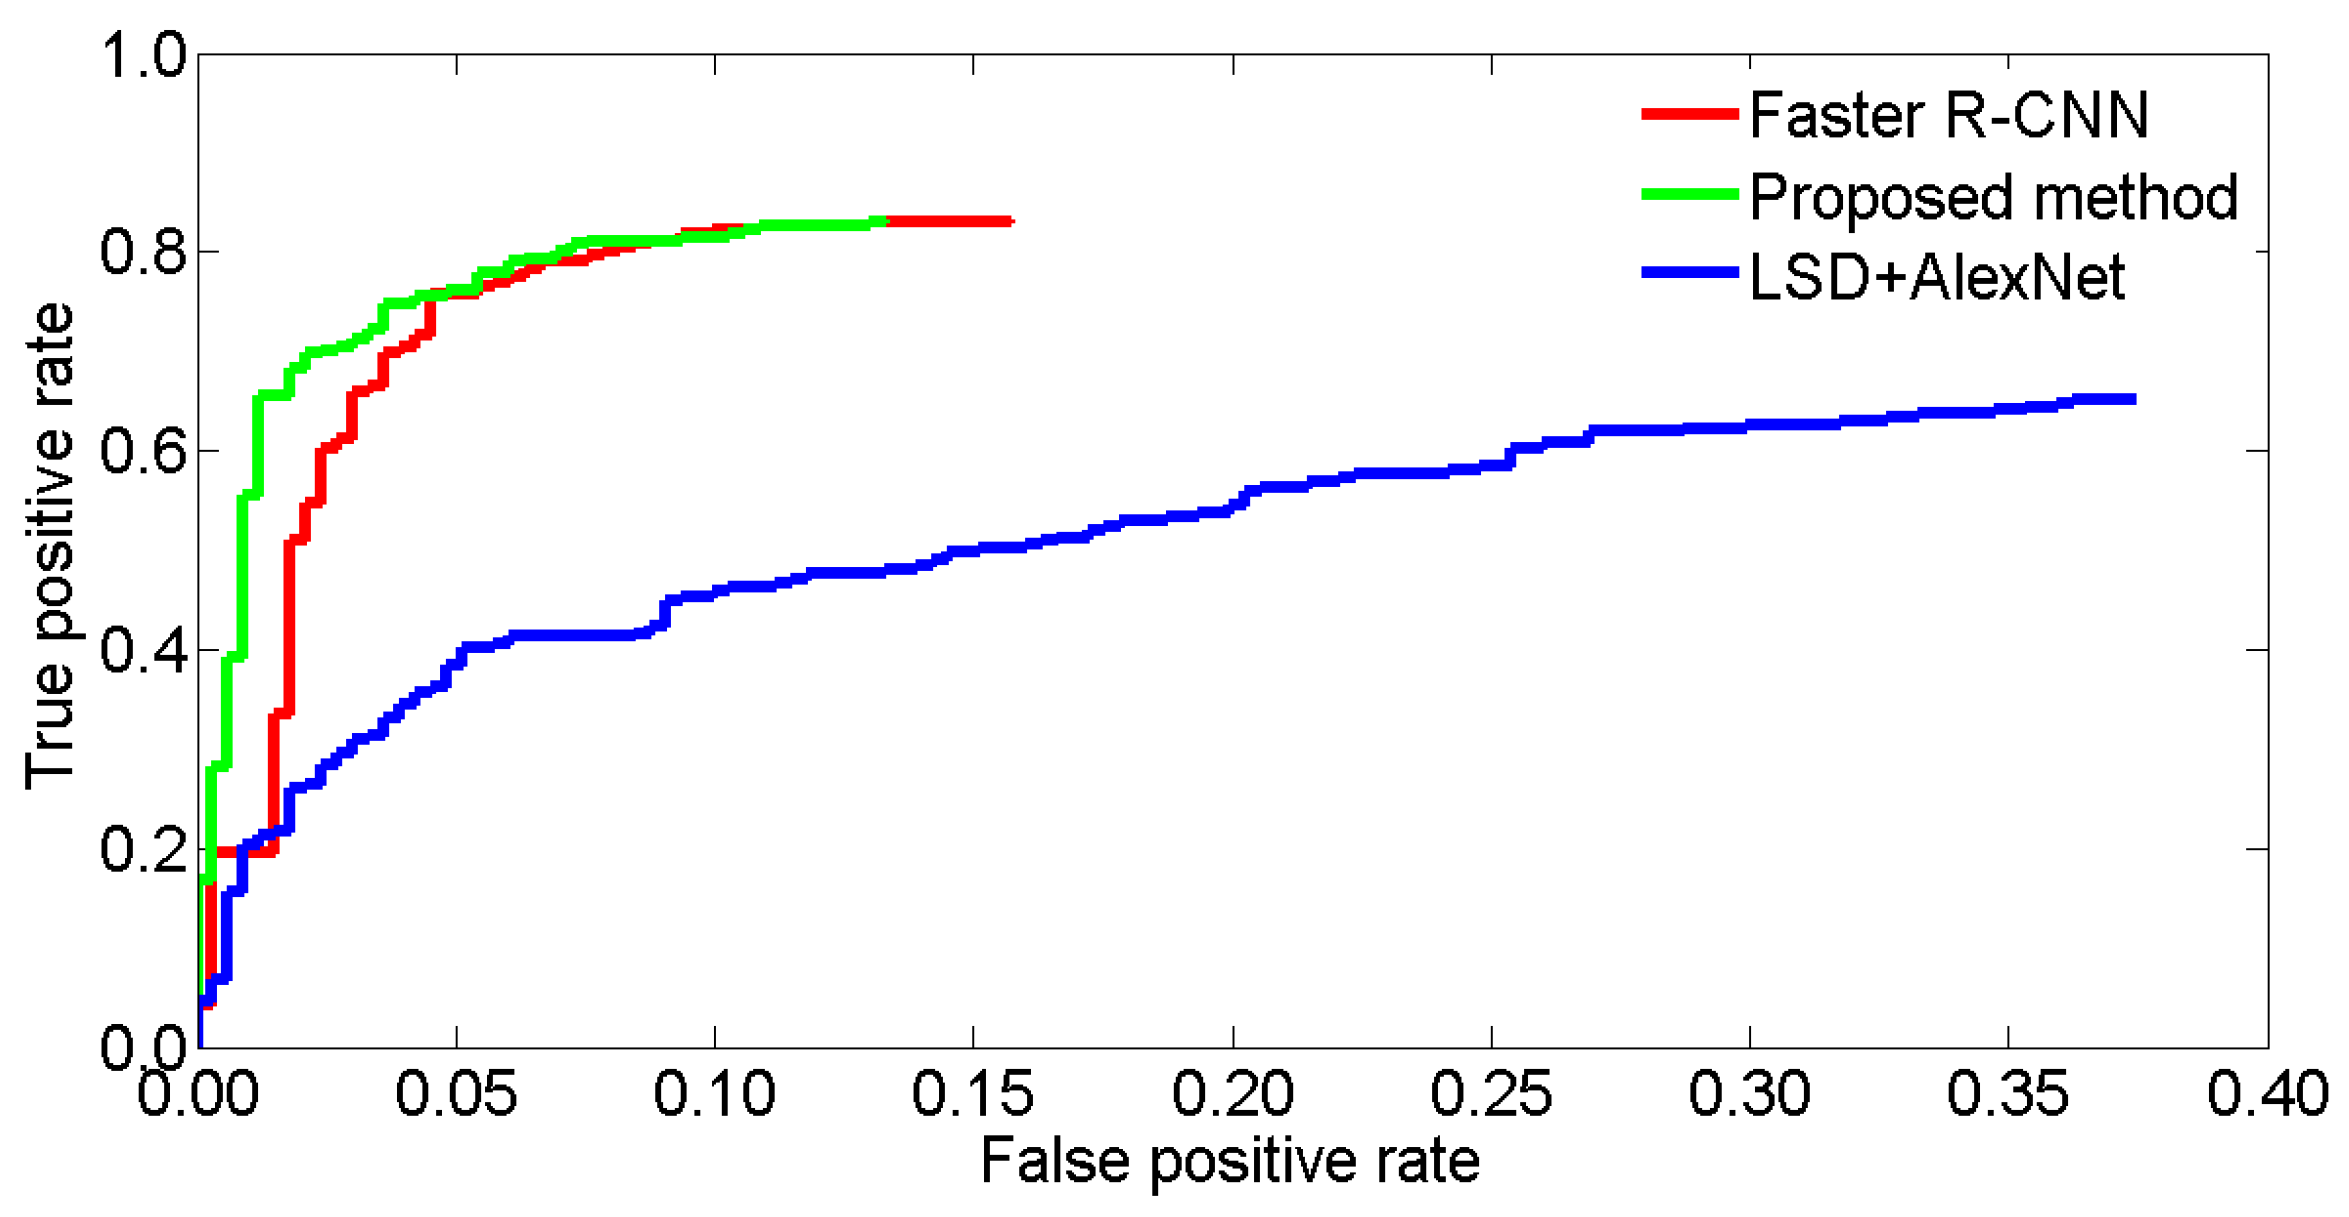
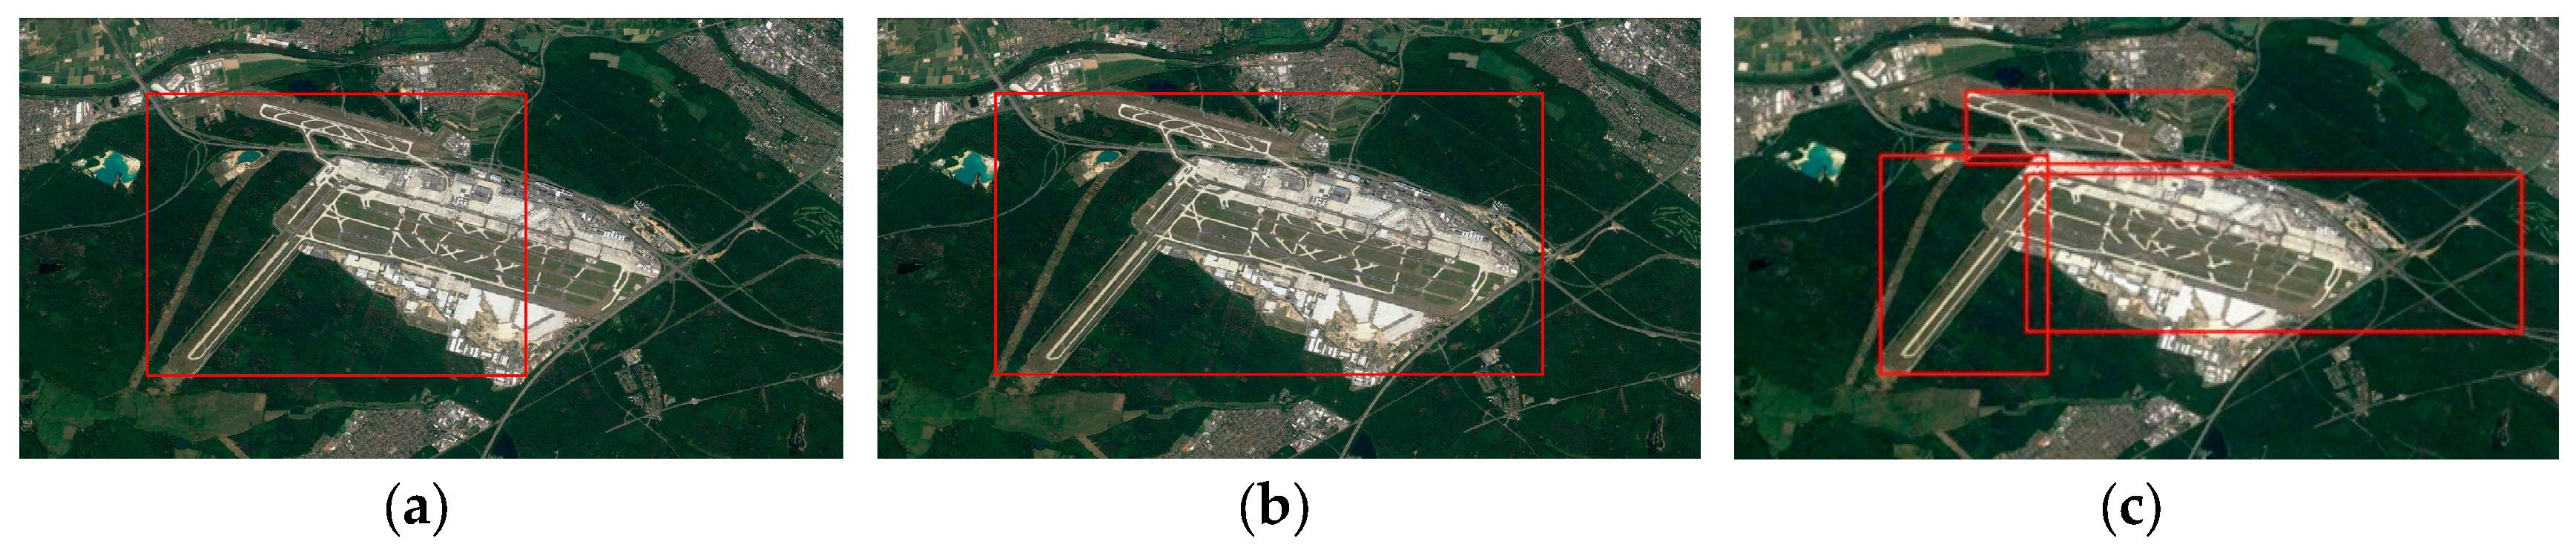
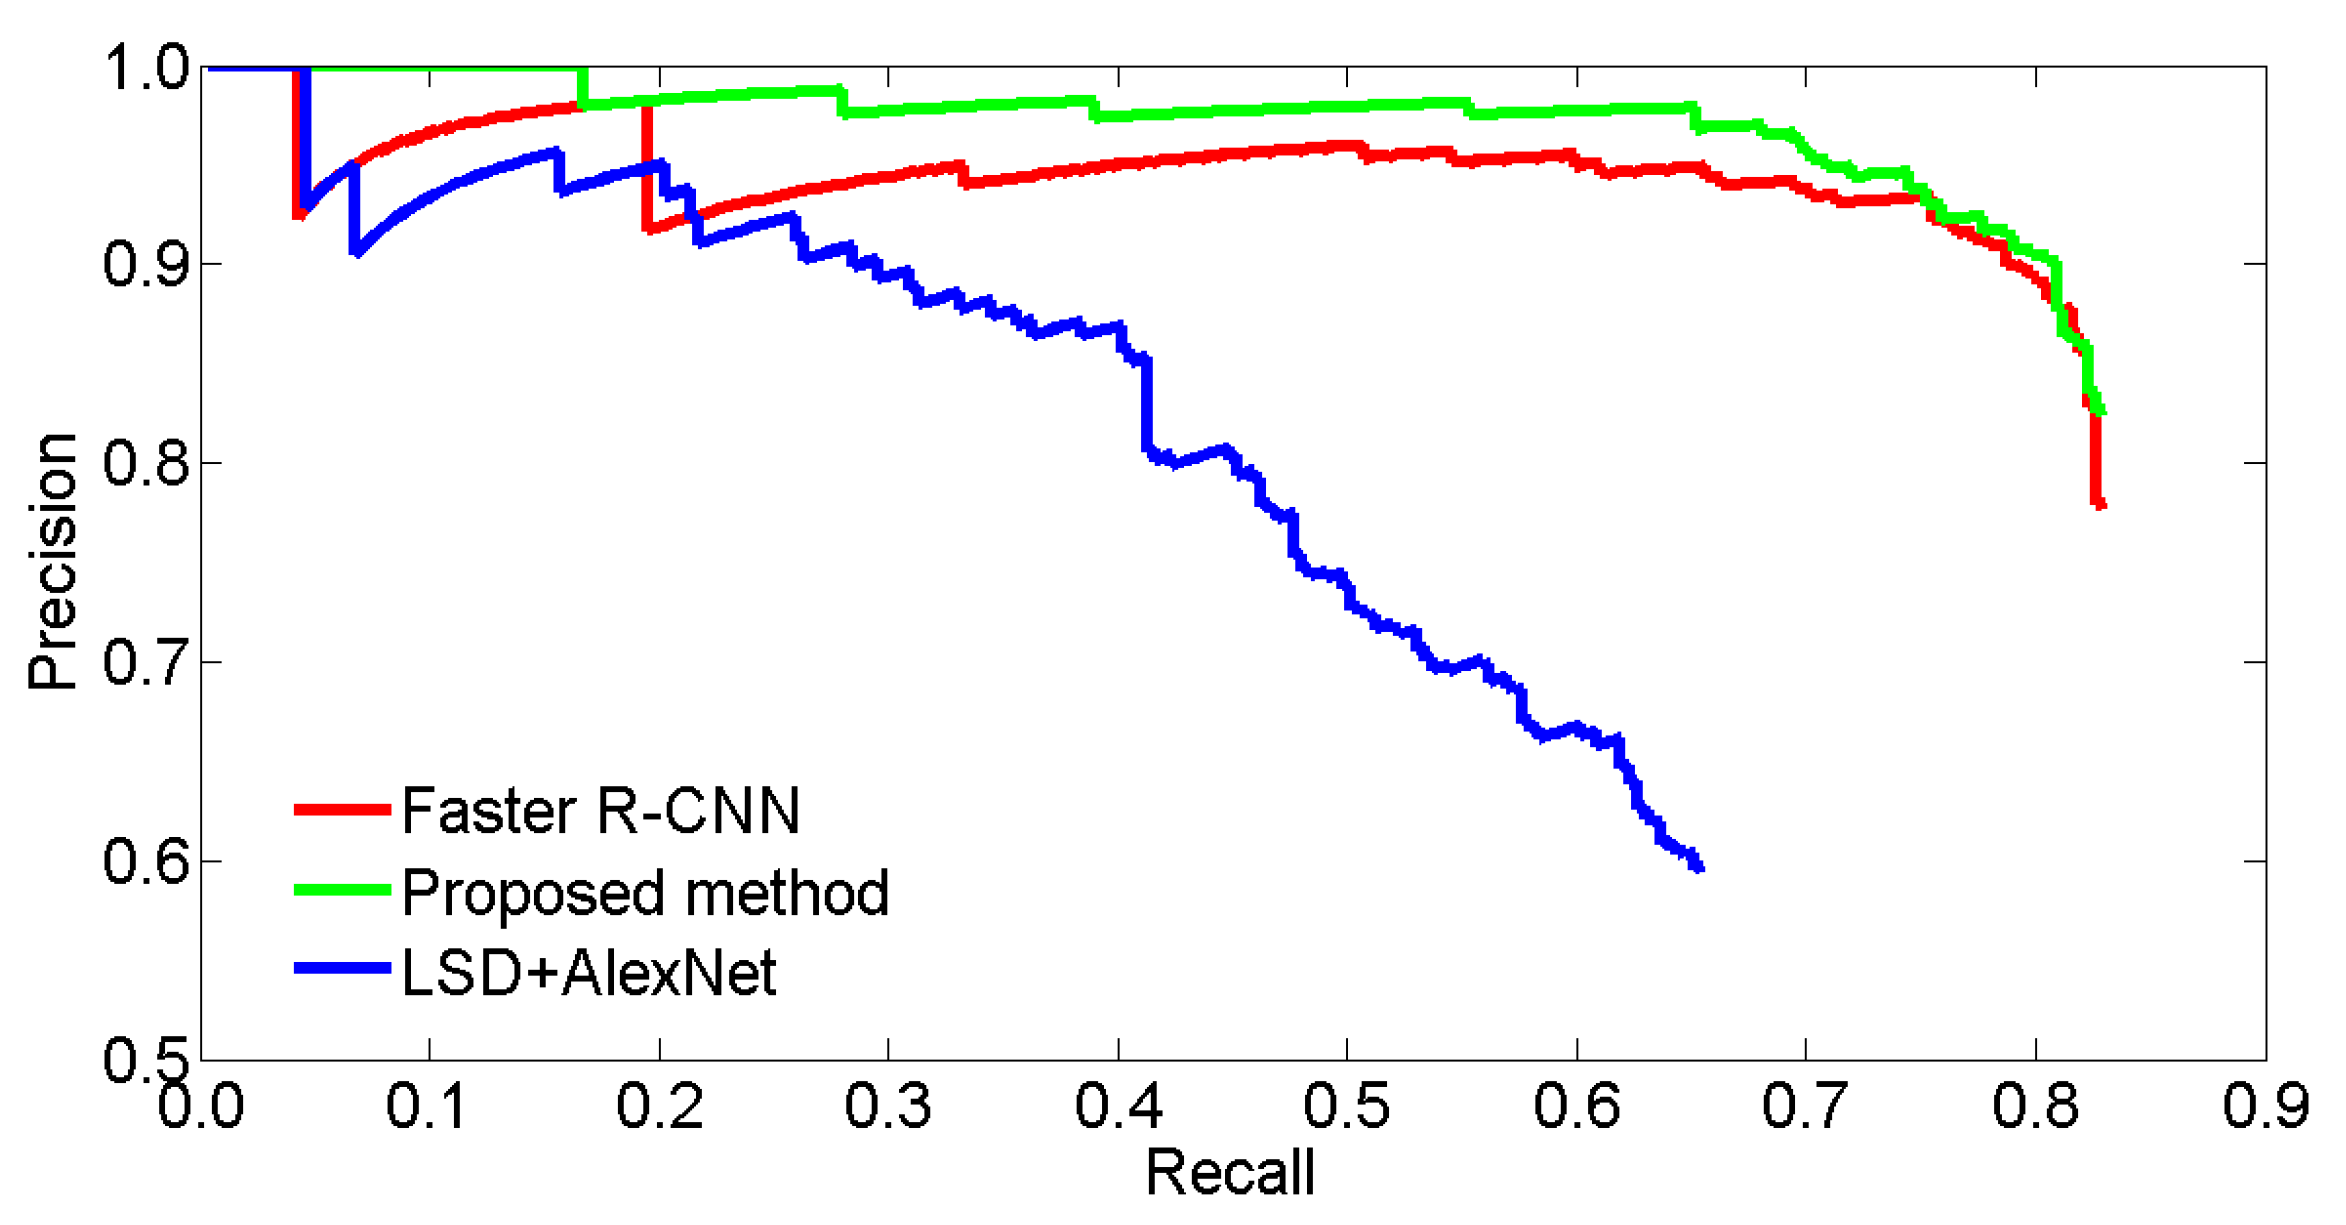
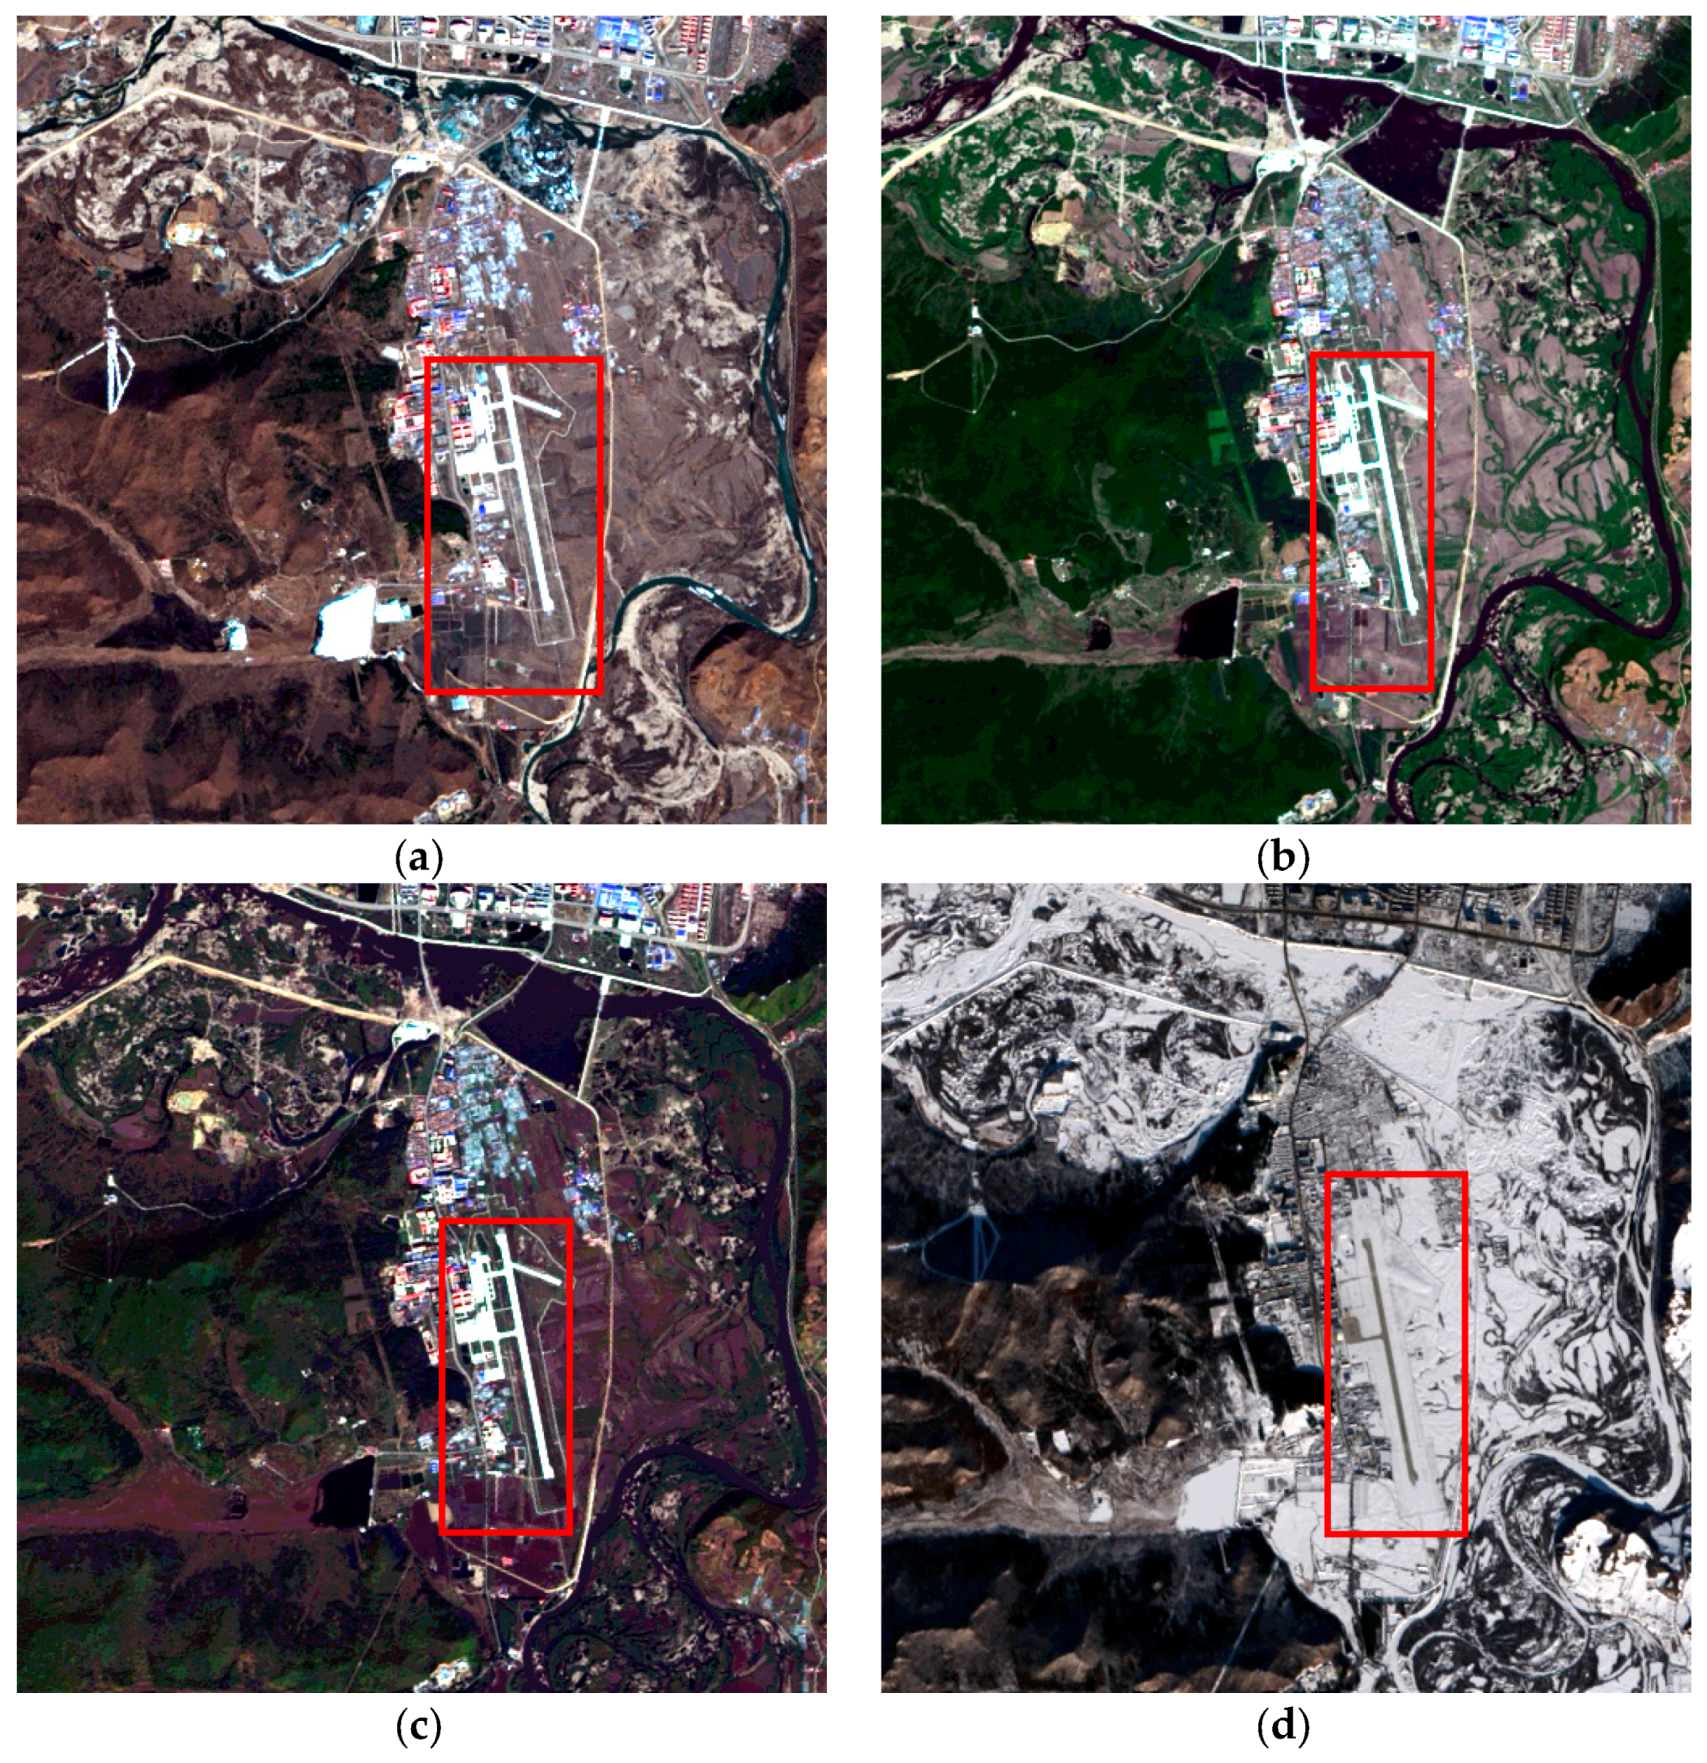
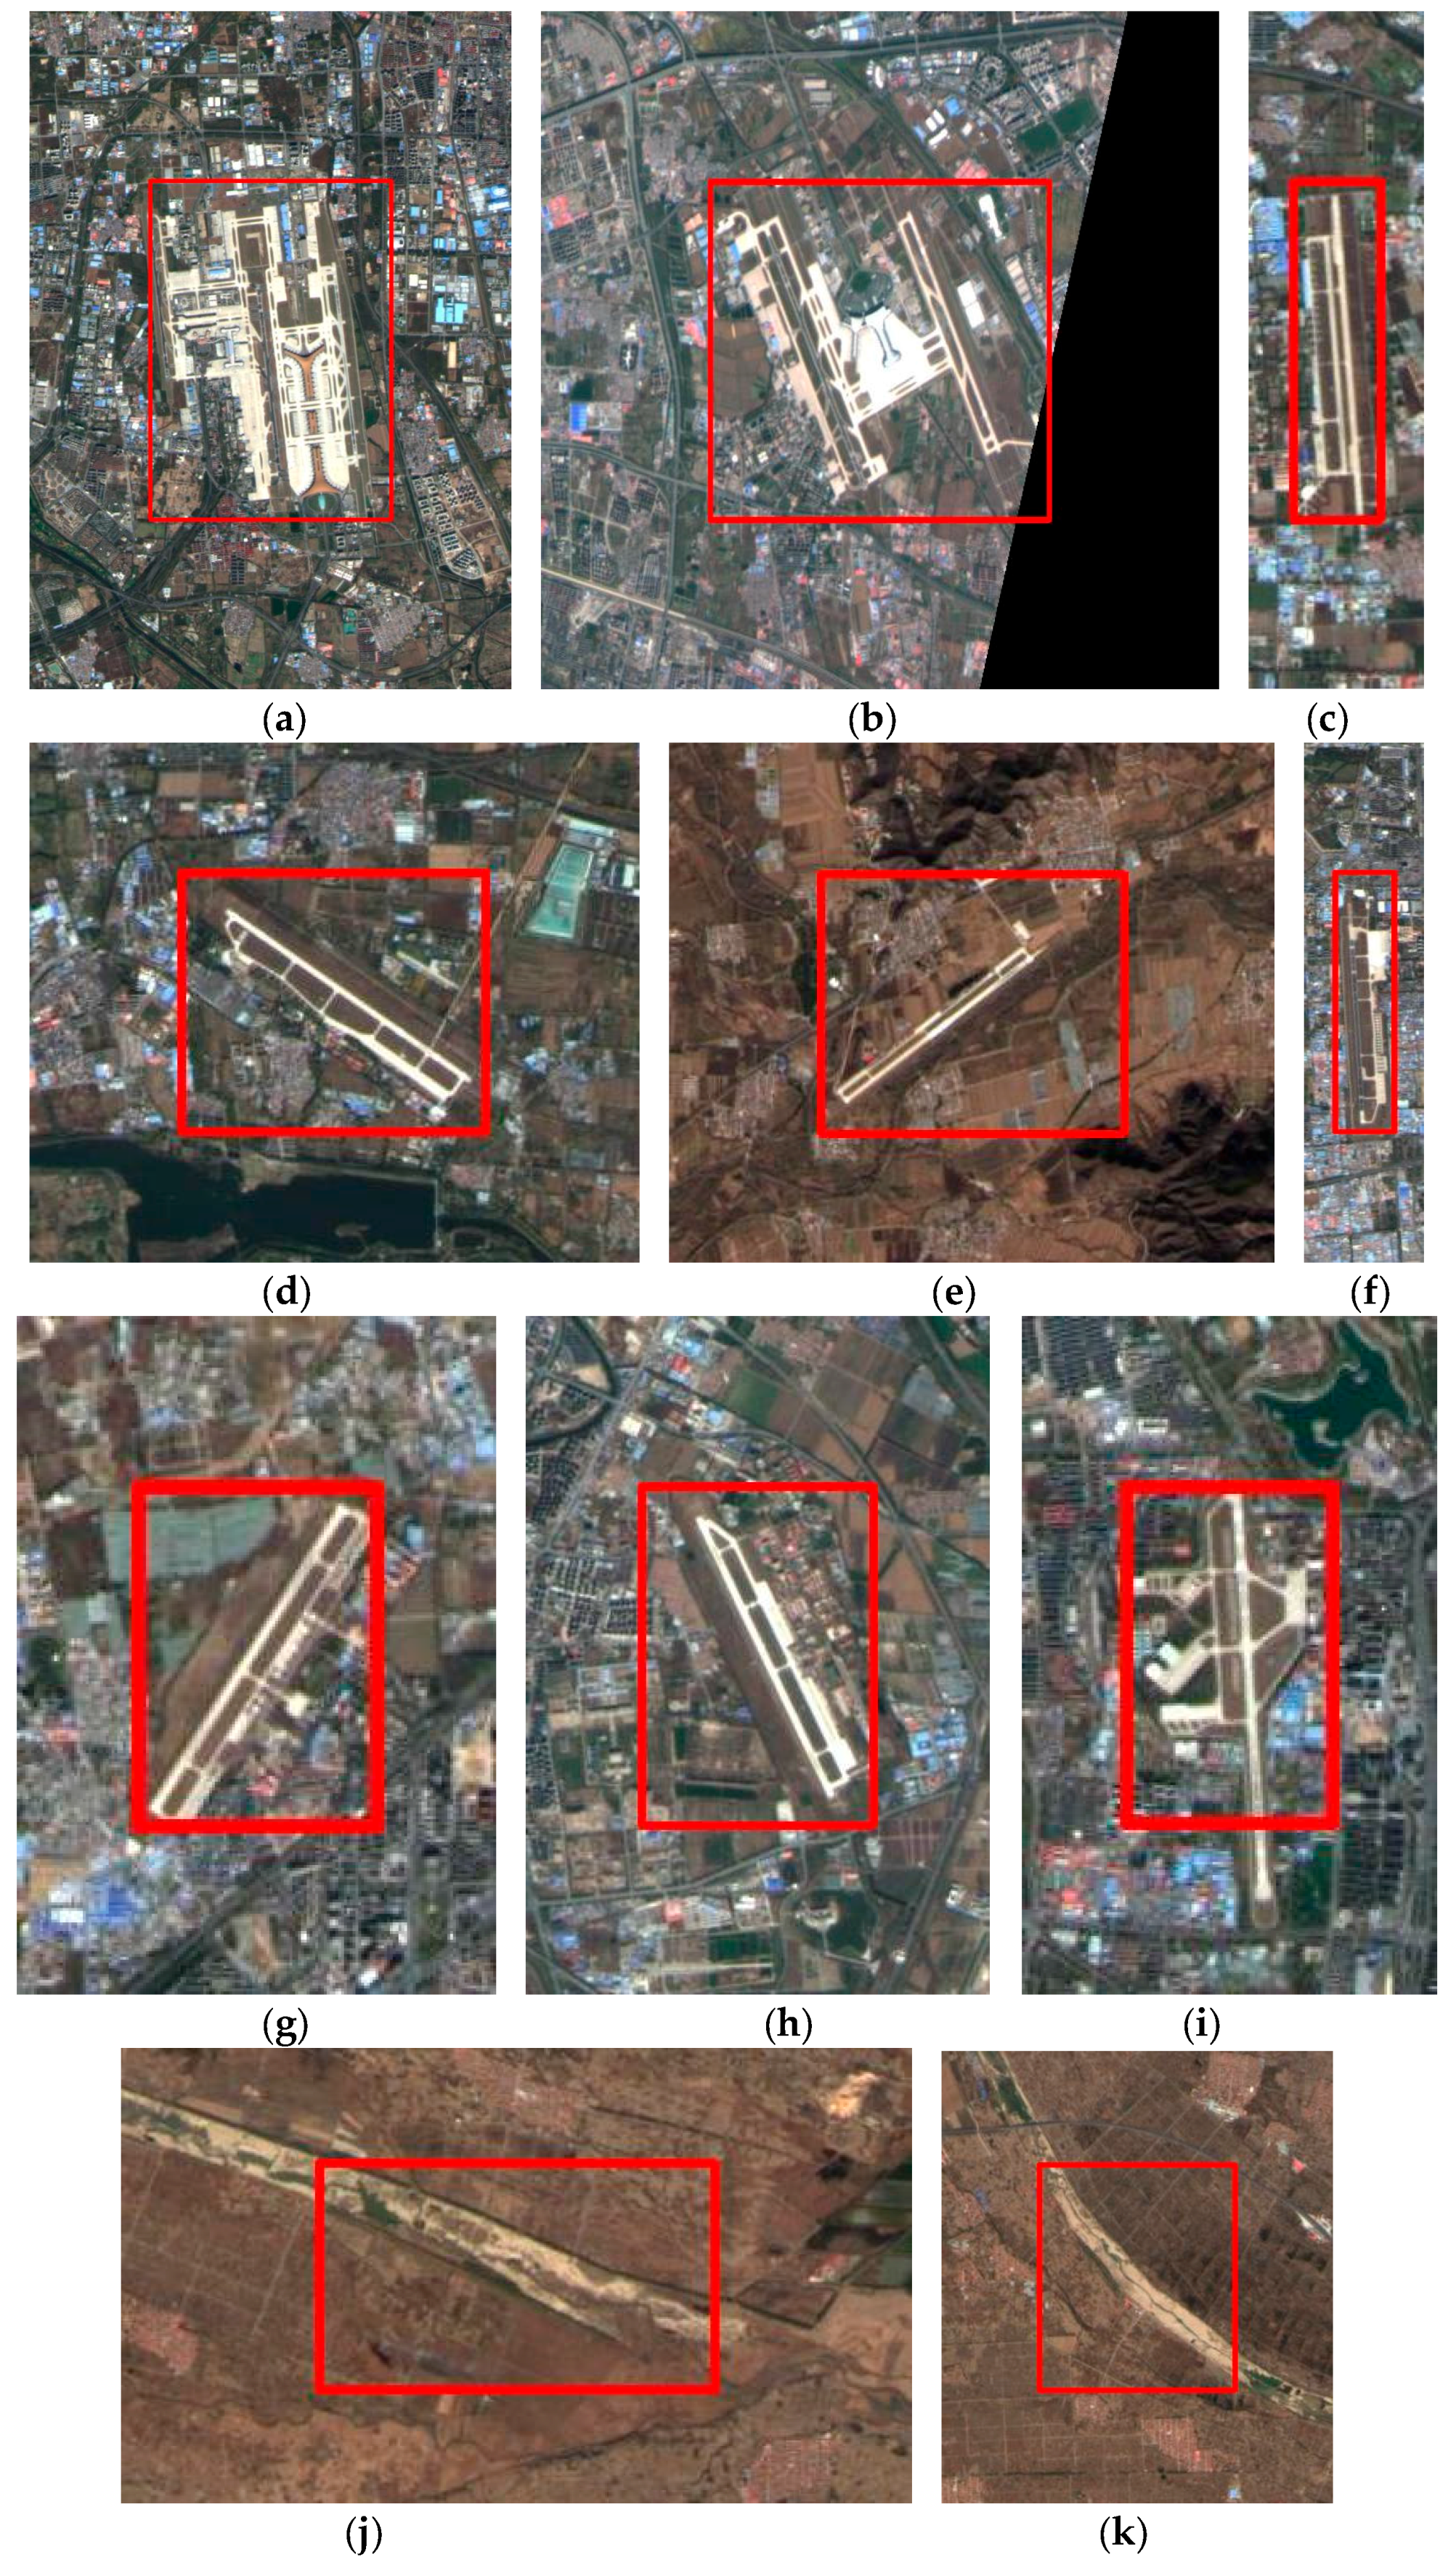
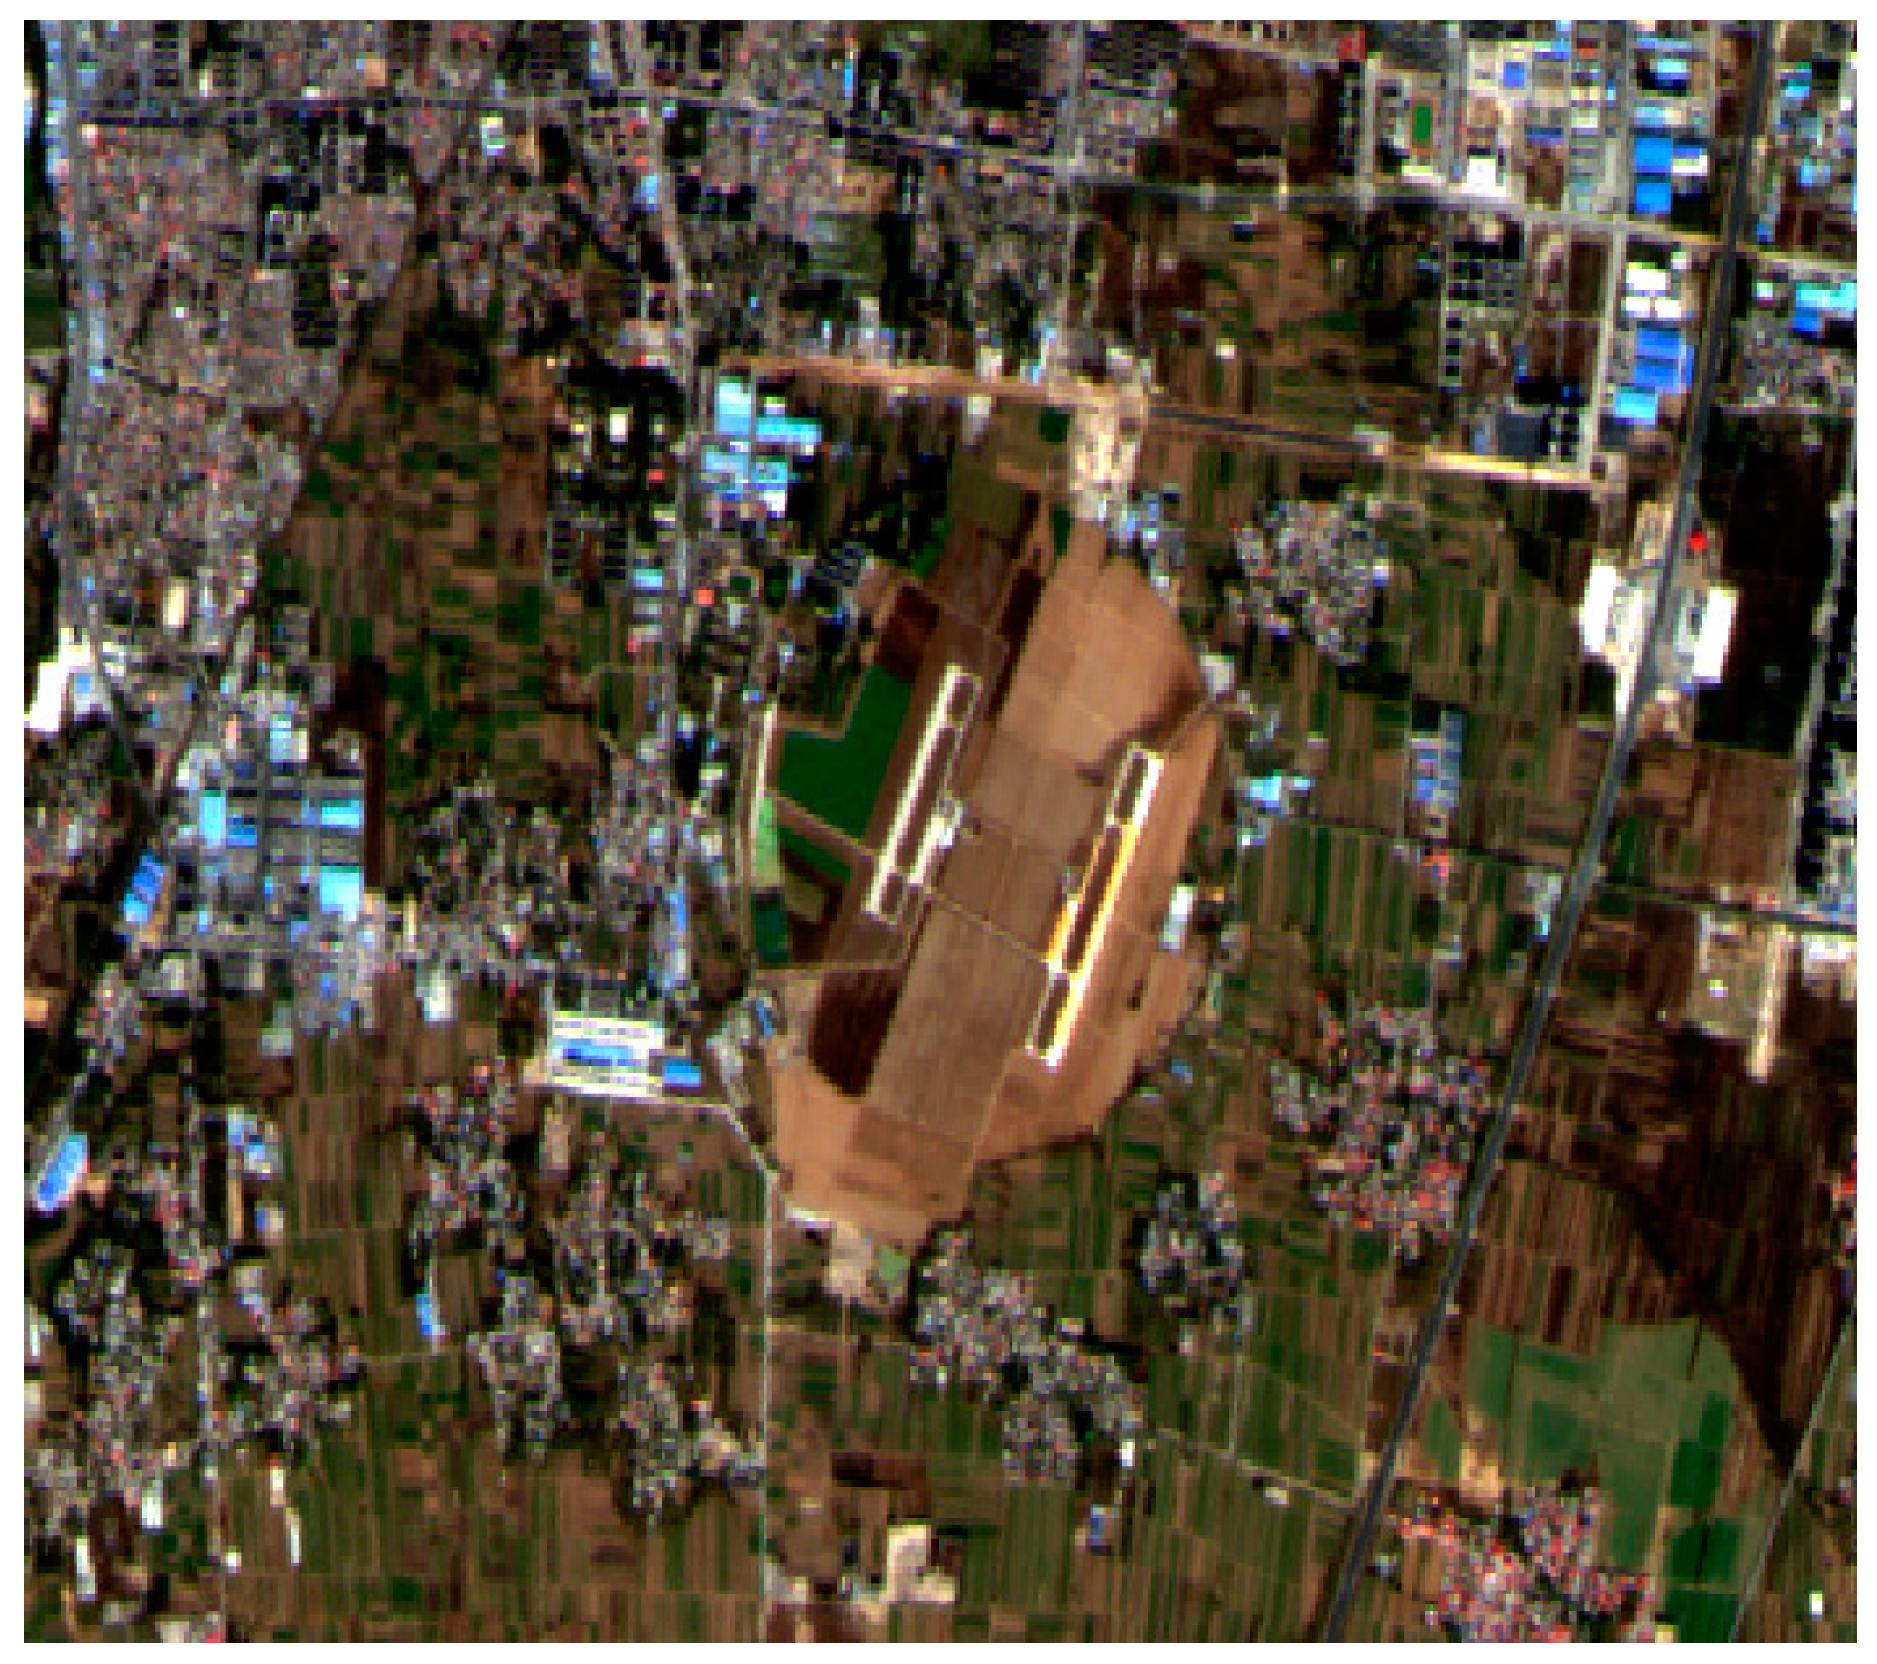
3.2. Results on Test Images

We qualitatively and quantitatively compared our proposed method with the original Faster R-CNN algorithm and the airport detection method proposed in [13] (this method will be denoted by LSD + AlexNet further in the text). We used the default parameter setting in the code (Available online: https://github.com/rbgirshick/py-faster-rcnn) for both the original Faster R-CNN algorithm and our proposed method. The average IoU overlap ratio was used to assess location accuracy and evaluate the performance. In addition, the commonly used average precision (AP) [27] was adopted as metric for evaluating detection performance. An obtained bounding box was considered correct if it had an IoU overlap with the ground truth that is higher than 50%. Otherwise it was considered incorrect. Other metrics of precision, recall, and accuracy were also used to evaluate the results [28,29]. The false alarm rate (FAR), which is defined as the ratio of the number of falsely detected airports to the number of testing images, was used as an additional metric for performance evaluation.
Figure 6 shows the detection results of the Tianshui Maijishan airport by the Faster R-CNN algorithm (Figure 6a) and by the proposed method (Figure 6b). The Faster R-CNN algorithm wrongly identified an elongated water body as airport while our proposed method did successfully detect the airport in the scene. Although the LSD + AlexNet method also detected this airport in the scene (Figure 6c), the location accuracy was clearly a little lower than the result shown in Figure 6b.
The Frankfurt-Hahn airport (Figure 7) was detected by all the three algorithms, but the proposed method (Figure 7b) is more accurate as part of the airport area was not detected by the Faster R-CNN algorithm (Figure 6a). The LSD + AlexNet method detected the three runways separately in this scene. The Meixian Changgangji airport (Figure 8) was also detected more accurately by the proposed method than by the Faster R-CNN algorithm. The LSD + AlexNet method wrongly identified an elongated water body as airport although part of the airport area was included in the bounding box. All the three approaches successfully detected the smaller Fuyang Xiguan airport (Figure 9). The LSD + AlexNet method only detected the runway, while both the proposed method and the Faster R-CNN algorithm successfully detected the whole airport area (including the terminal building).
Provided with a scene without airport in it (Figure 10), both the Faster R-CNN algorithm and LSD + AlexNet method wrongly detected an area with an elongated linear feature similar to a runway as airport (show in red rectangles). Our proposed method, by contrast, successfully detected that there was no airport present in this image.
In our experiments we found that most of the relatively large airports were successfully detected by the proposed method. Most of the errors occurred on small airfields that are difficult to distinguish from similar ground objects. This is because the runway is the only useful geometric feature for detecting small airfields, and in medium-resolution satellite images its elongated linear geometric shape is very similar to some other ground objects like highways, long ditches, etc. There is no airport, for example, in the scene shown in Figure 11, but all the three methods nevertheless falsely detected one. The detected area contains an elongated ground object that is visually similar to a runway.
We carried out three experiments with different random training sets and reported the mean performance of the proposed method in Table 1. After adding the additional scale and aspect ratios (denoted as T1 in Table 1), the detection performance increased. In particular, the location accuracy and the precision of the proposed method are better than the result obtained by the original Faster R-CNN algorithm. After sieving low quality positive samples (denoted by T2 in the table), the detection performance increased further. This demonstrates that our specific improvement techniques, which were proposed to handle the elongated airport runway shapes, effectively improved detection performance. The final recall value (0.837) of the proposed method is slightly less than the recall value (0.838) of the original Faster R-CNN algorithm. This means that the former is only slightly more conservative than the latter, and that the proposed method can achieve better precision and accuracy with almost identical recall. The Receiver Operating Characteristics (ROC) graphs and the precision-recall curves of the results (Figure 12 and Figure 13) also demonstrate that the proposed method outperforms the original Faster R-CNN algorithm. The proposed method can achieve a lower false positive rate with the same true positive rate and also has a higher precision with the same recall value. The proposed method and the original Faster R-CNN algorithm, which both generate proposals based on the RPN, outperformed the LSD + AlexNet method. On our computational platform, it took about 0.16 s to process an image for both our proposed method and the Faster R-CNN algorithm, and about 3.23 s for the LSD + AlexNet method.
We also tested the performance of the proposed method with a different number of training airports. Figure 14 indicates that the performance increased when more airport images were used. Using more airport images for training will therefore be beneficial for further increasing the detection performance. However, due to the difficulty of collecting many airport images from remote sensing scenes, we consider this to be part of our future work.

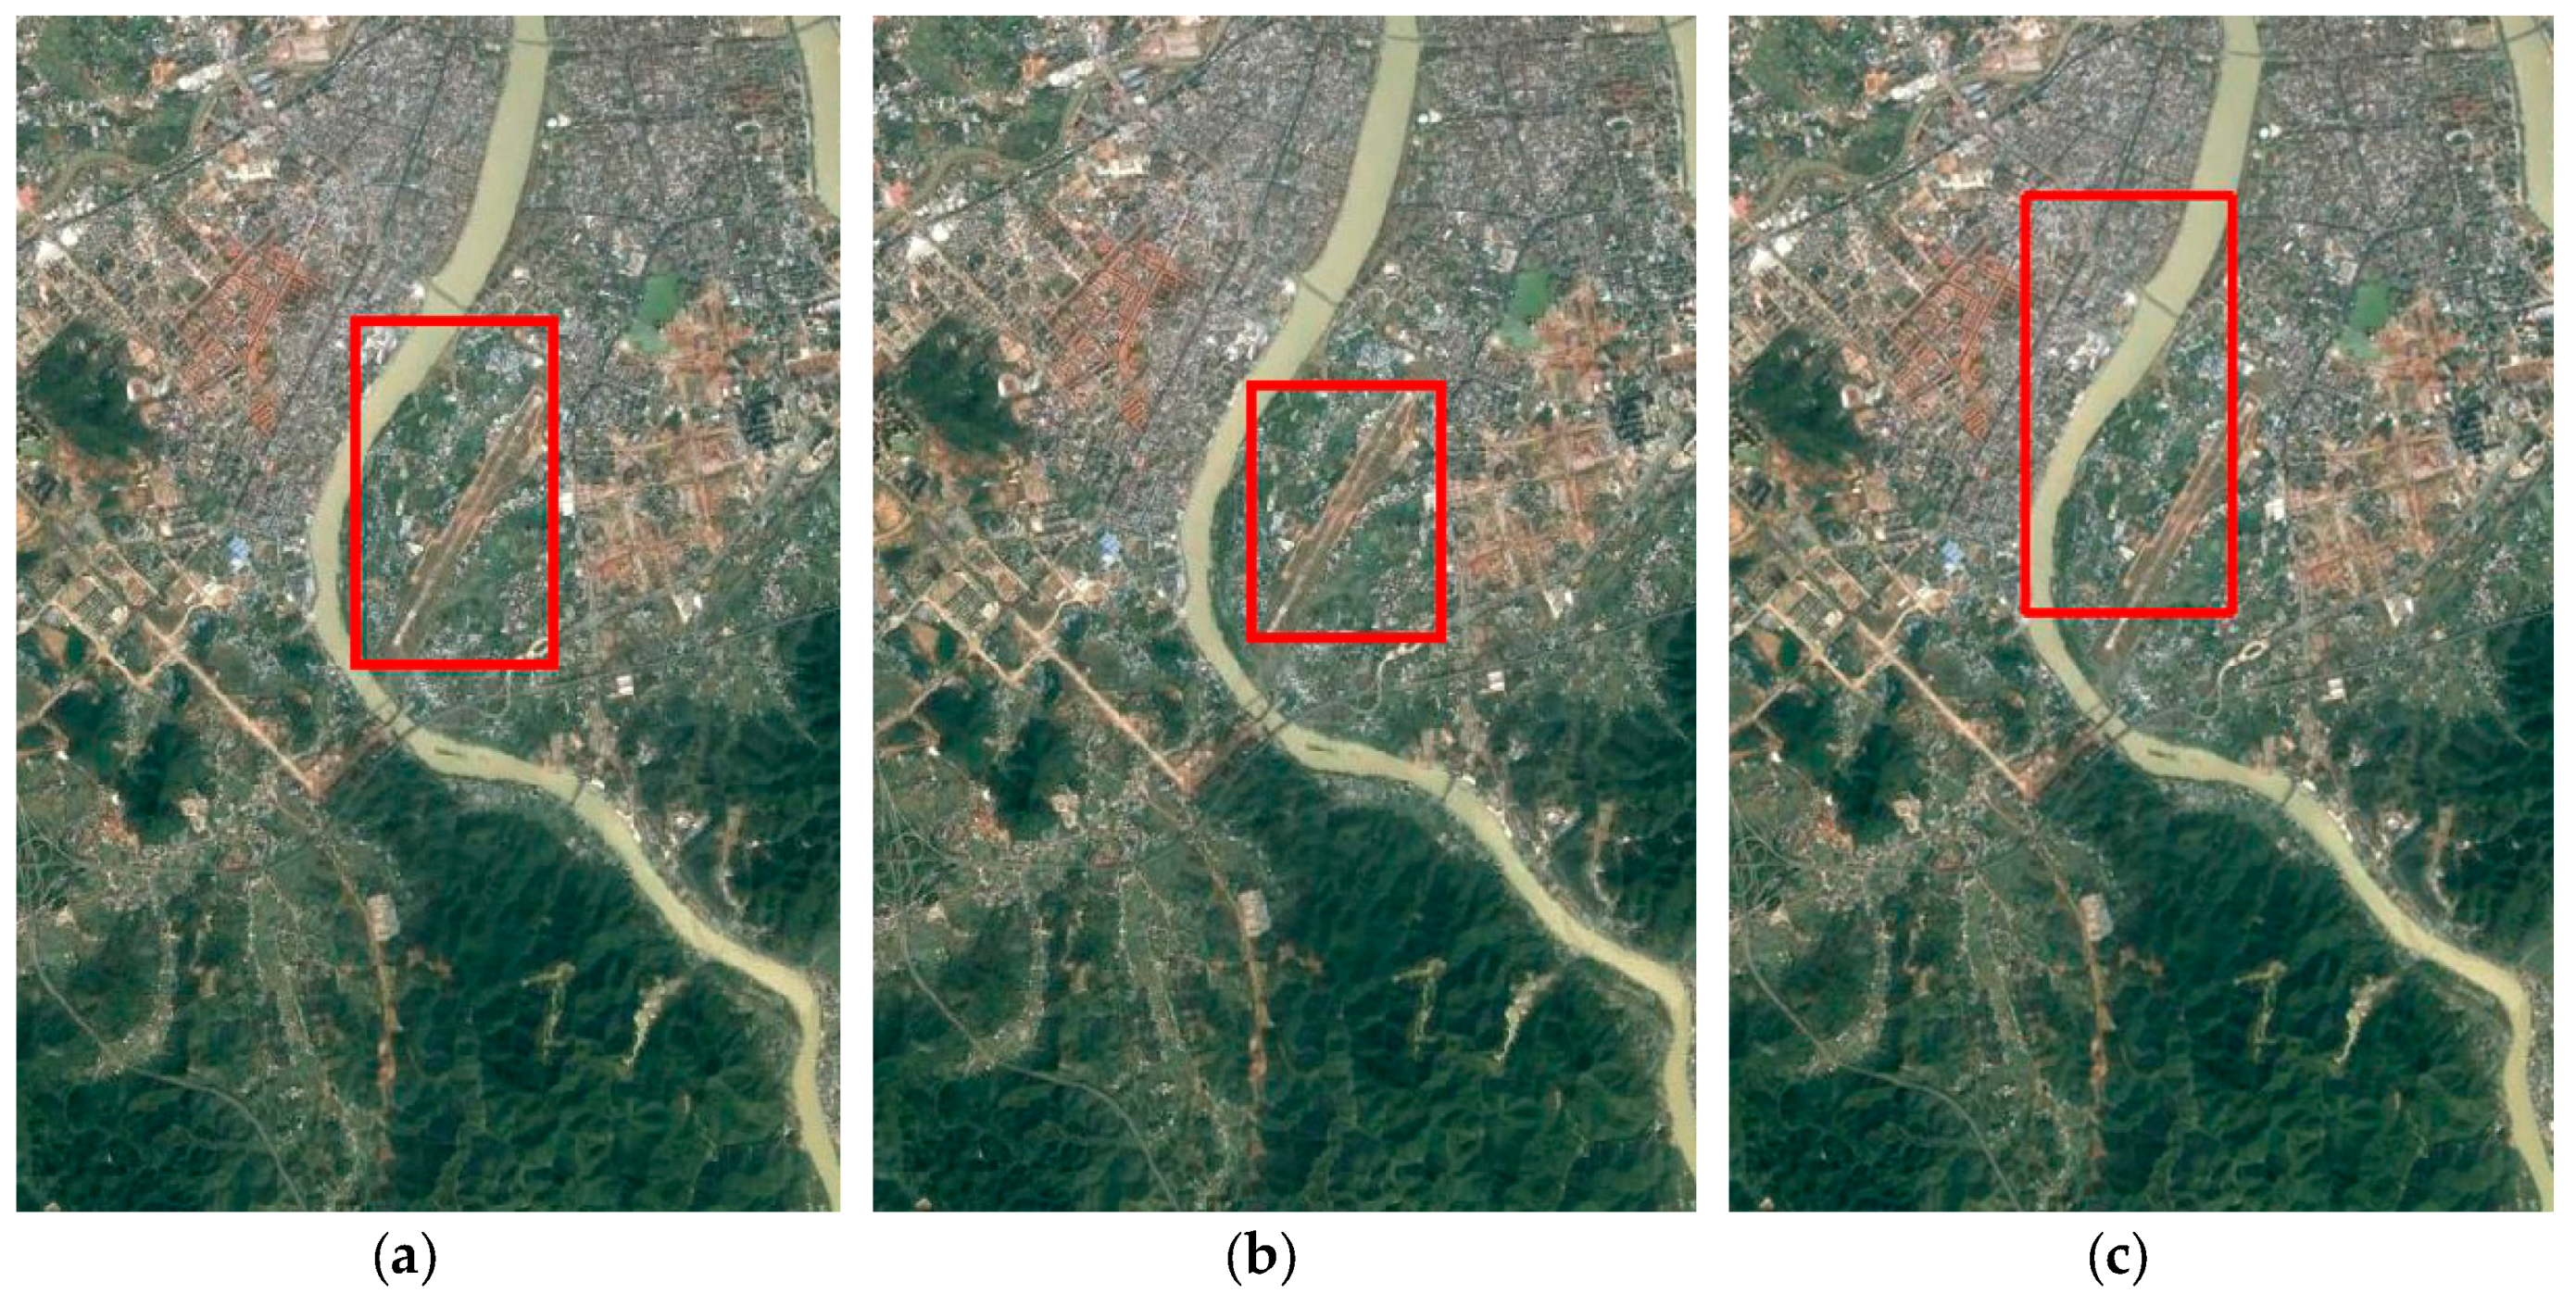
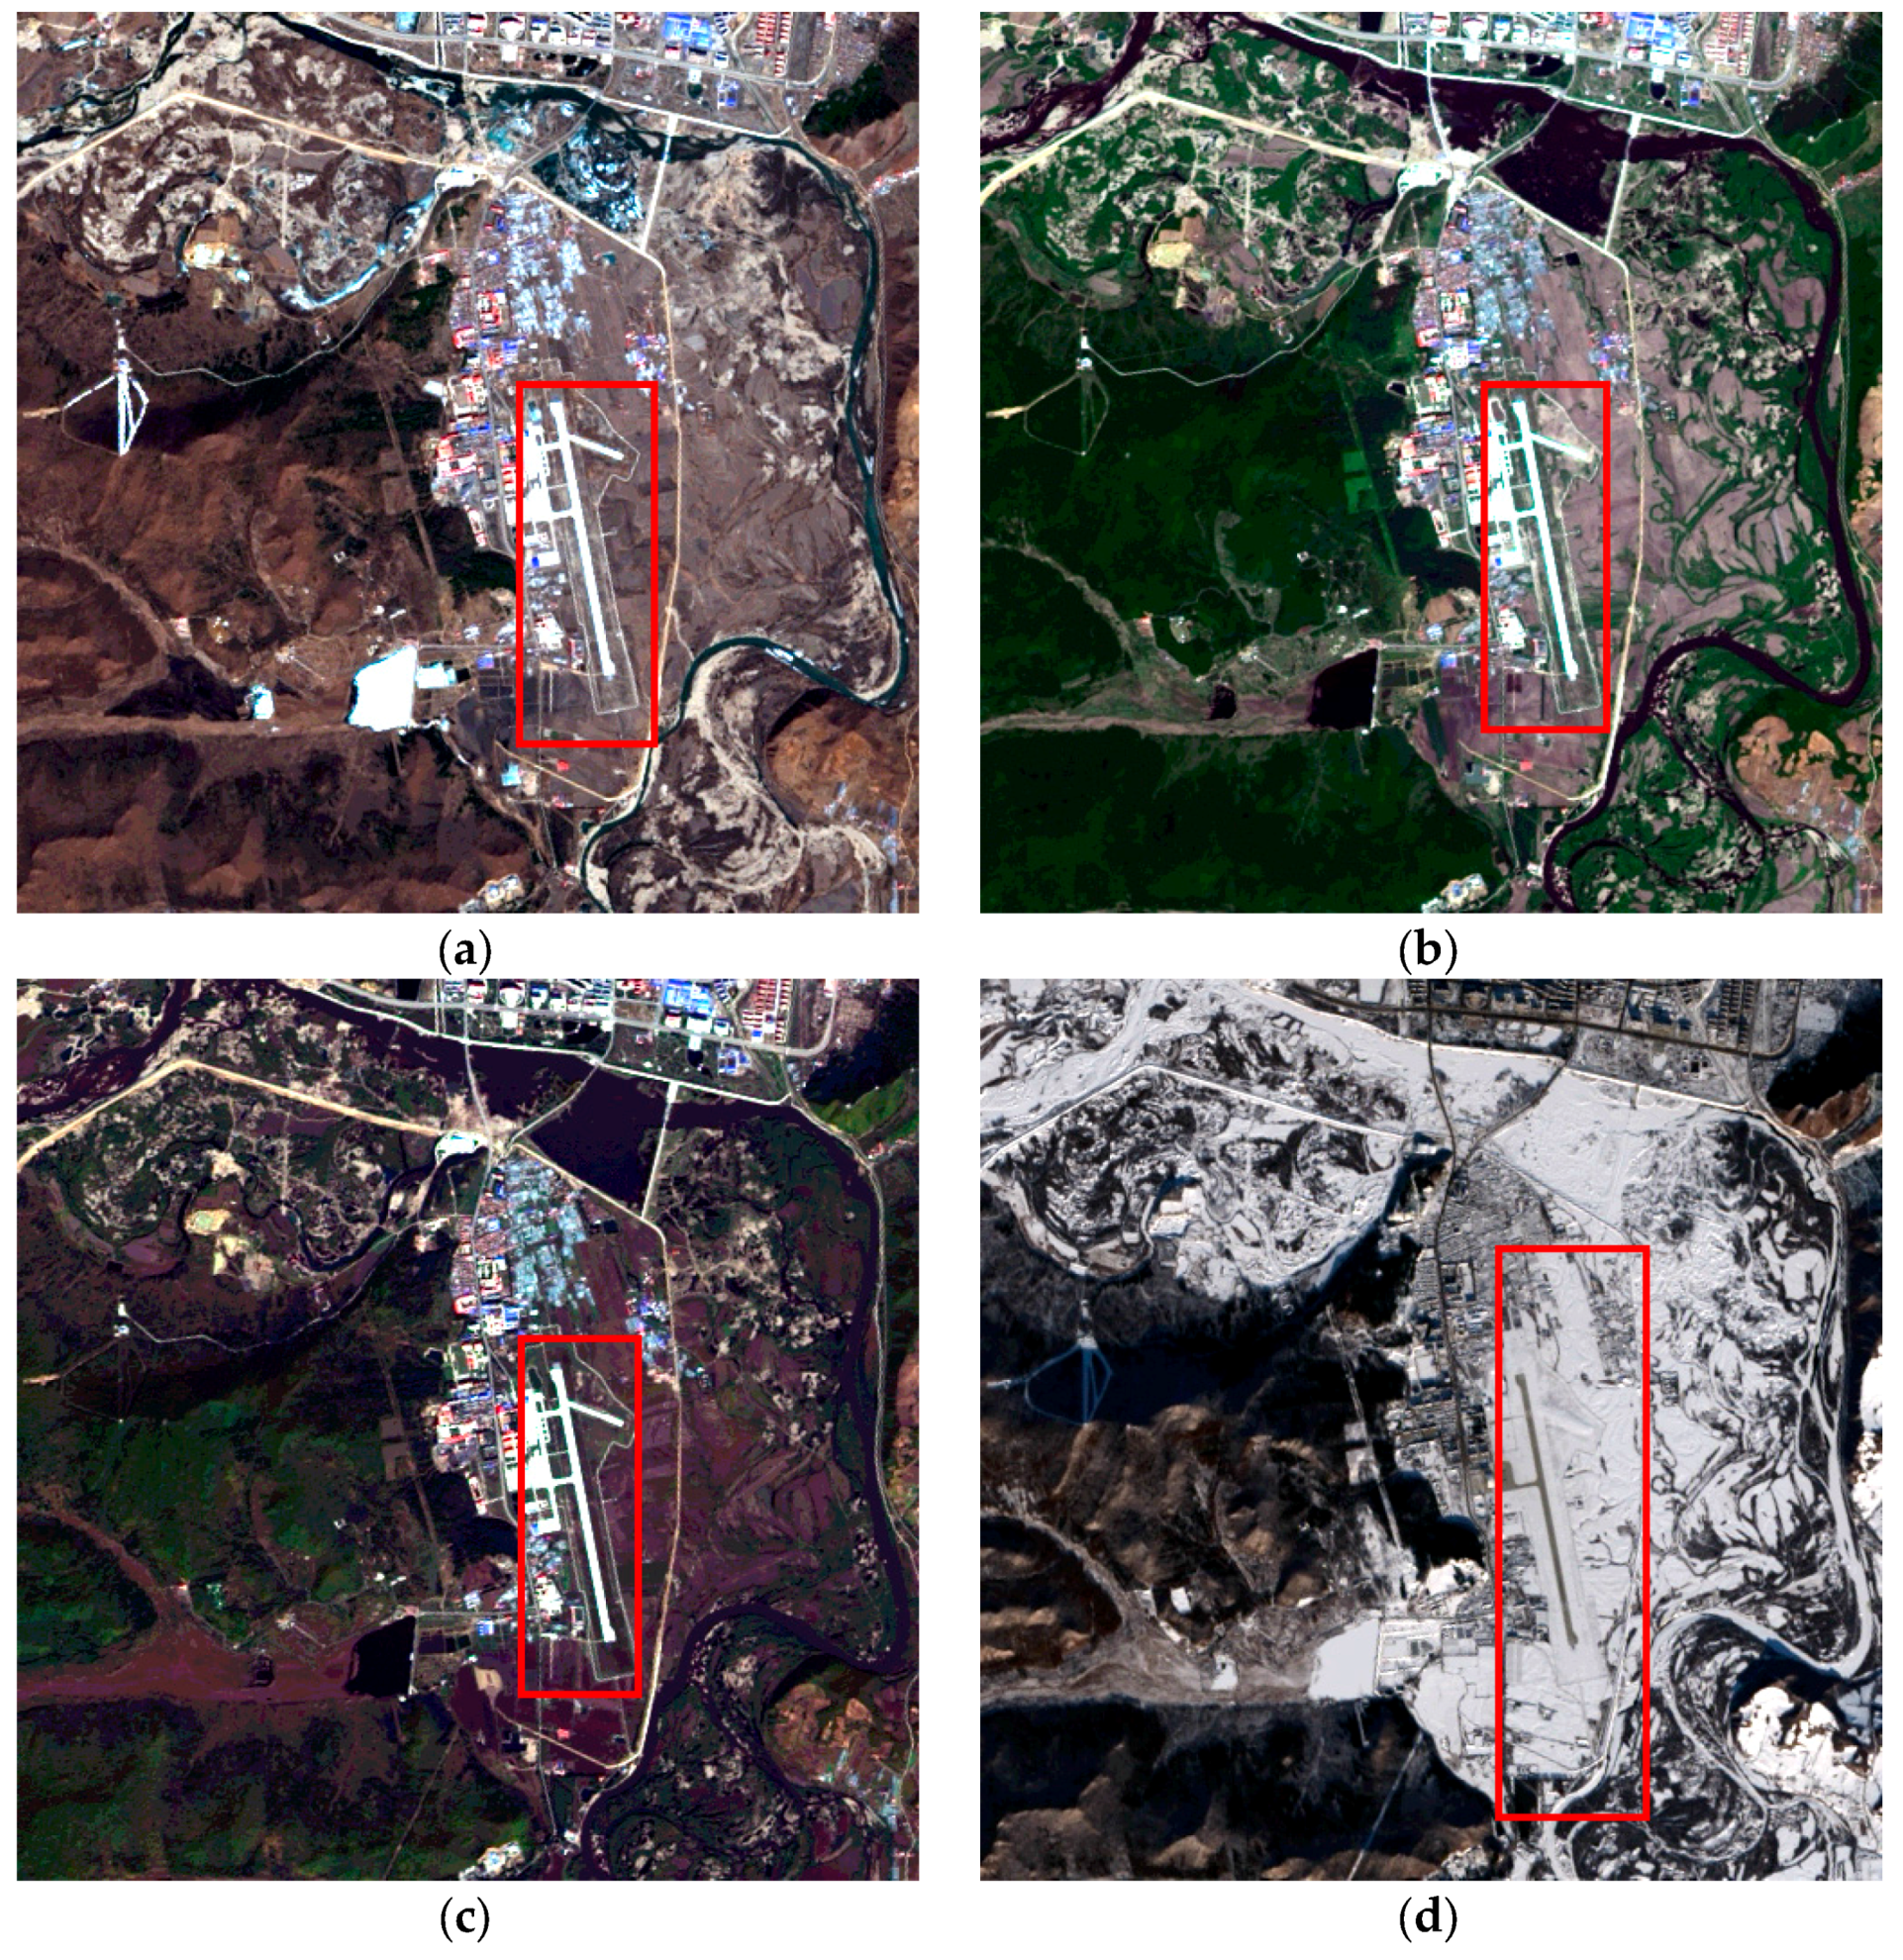
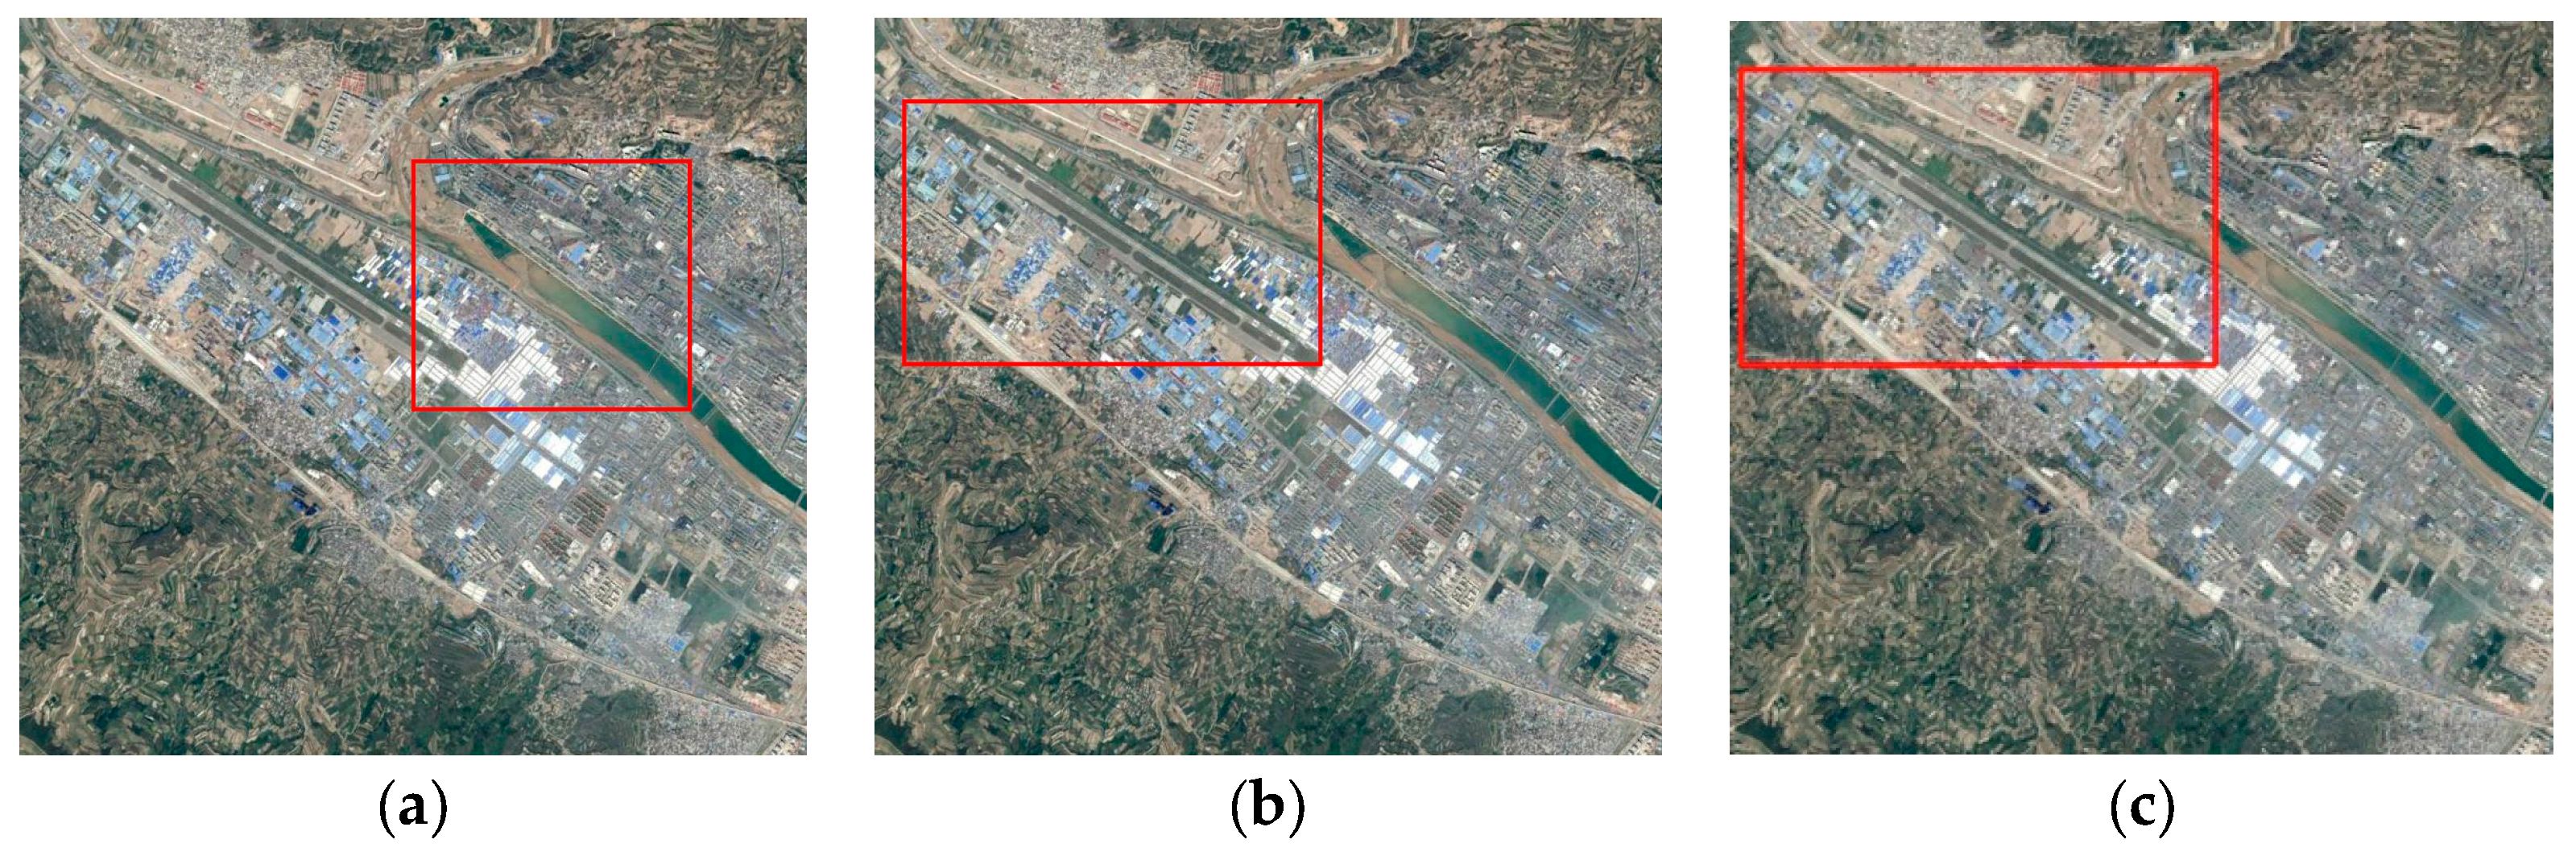
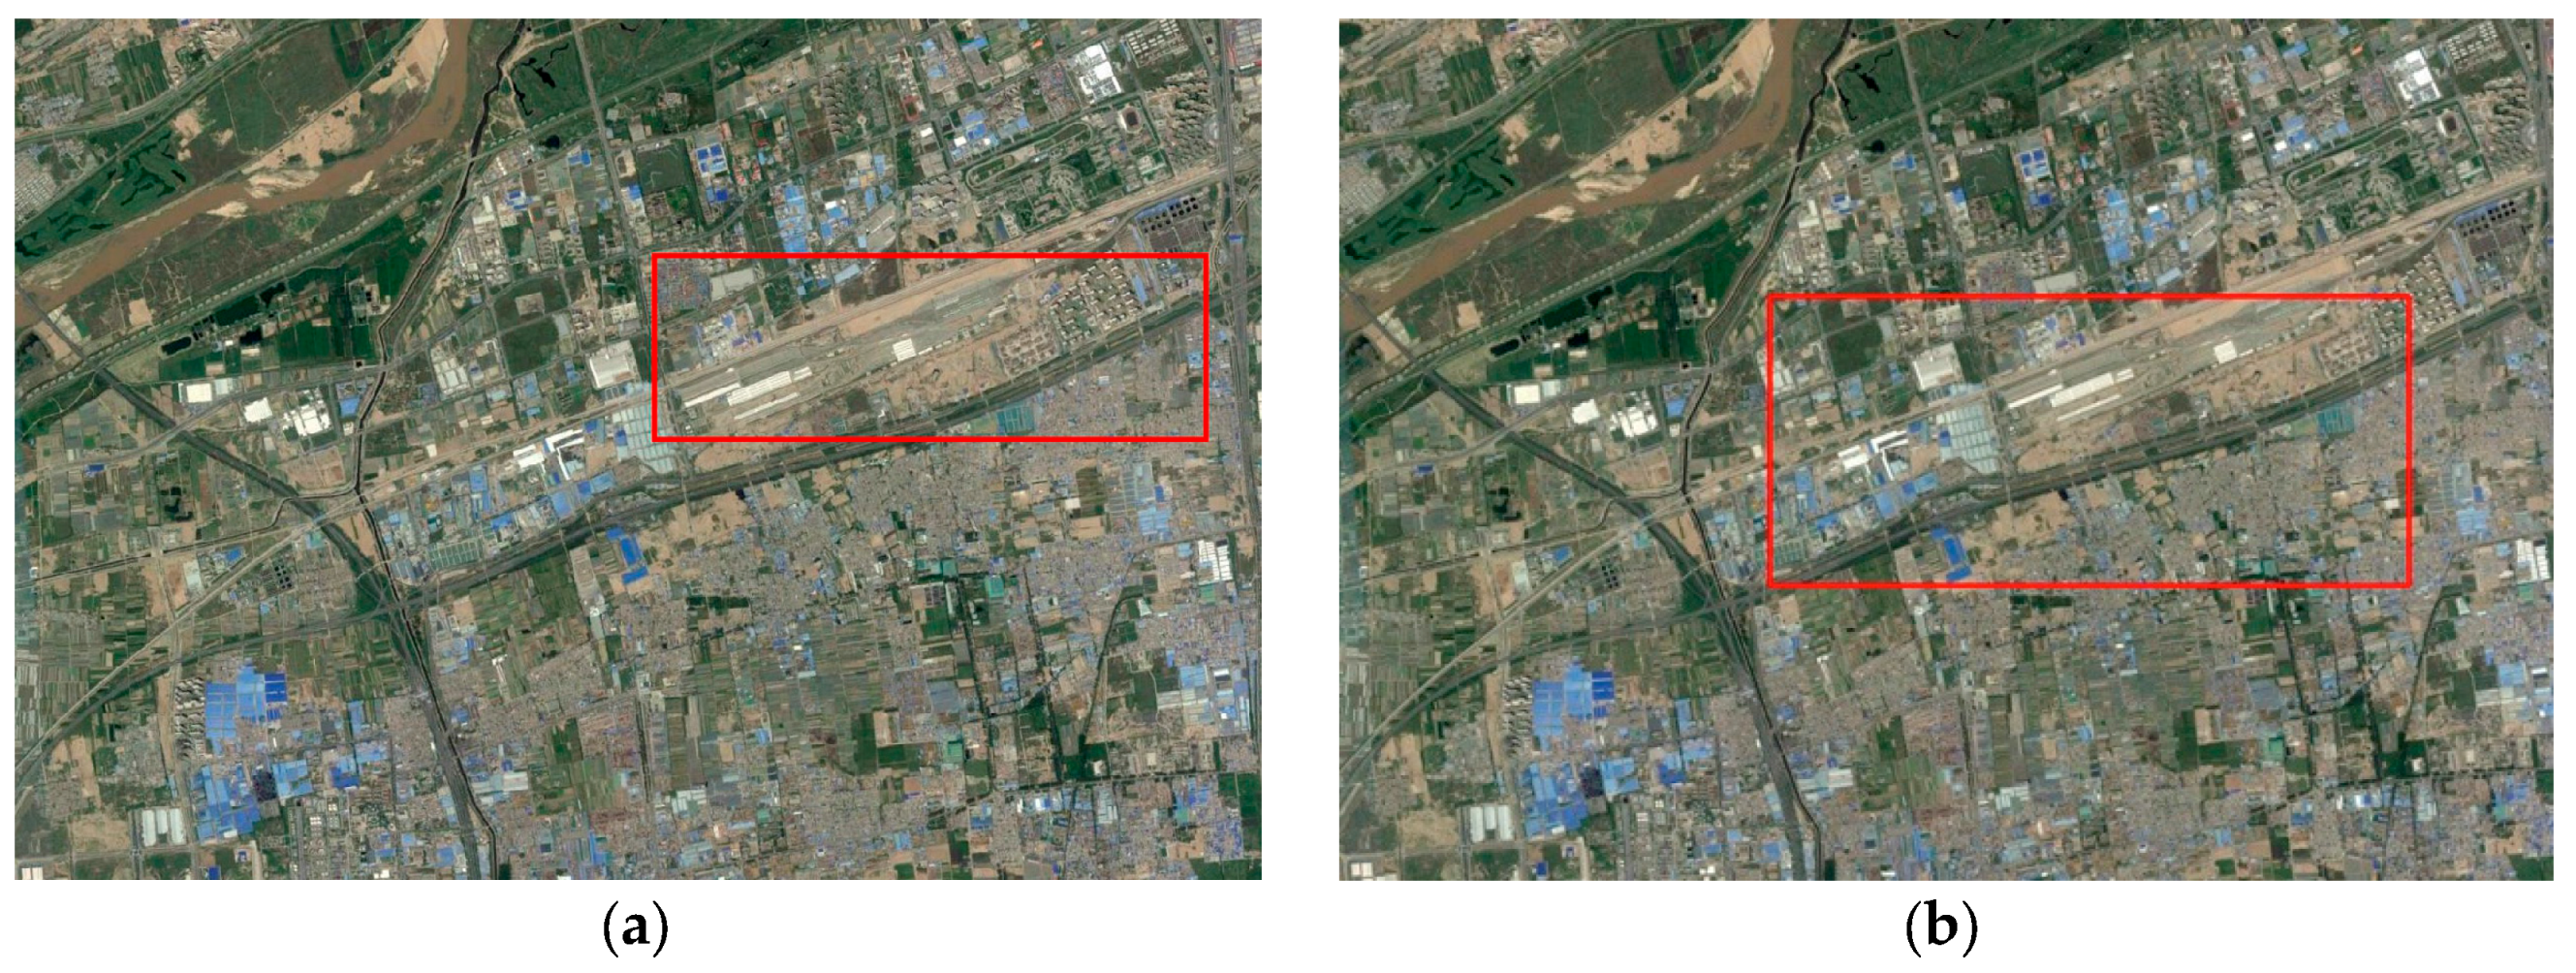
3.3. Results on Landsat 8 Images

We also evaluated how the proposed method performed on airport appearances in different seasons. The CNN model weights, which were obtained using the airport dataset described previously, were also used for this experiment. Figure 15 shows the detection results of the proposed method on Landsat 8 images (in true-color composite of 8-bit quantization) of the Jiagedaqi airport in four seasons. These images, collected in different seasons, were pansharpened to a spatial resolution of 15 m and show differing background colors. In winter, most of the background objects are covered with snow and the cleaned runway still demonstrates the typical elongated linear geometric shape. Our proposed method successfully detected this airport in all seasons, although visually the location accuracy in winter is not as high as in the other three seasons. The results of the original Faster R-CNN algorithm are shown in Figure 16. Although the detection results in spring (Figure 16a), summer (Figure 16b) and autumn (Figure 16c) are similar to the results shown in Figure 15, visually the original Faster R-CNN algorithm has a lower location accuracy on the winter image (Figure 16d) than our proposed method. The detection results on Landsat 8 images in different seasons demonstrates the generalization capability of the CNN-based airport detection methods when applied to images that are recorded by other sensors and in other seasons.

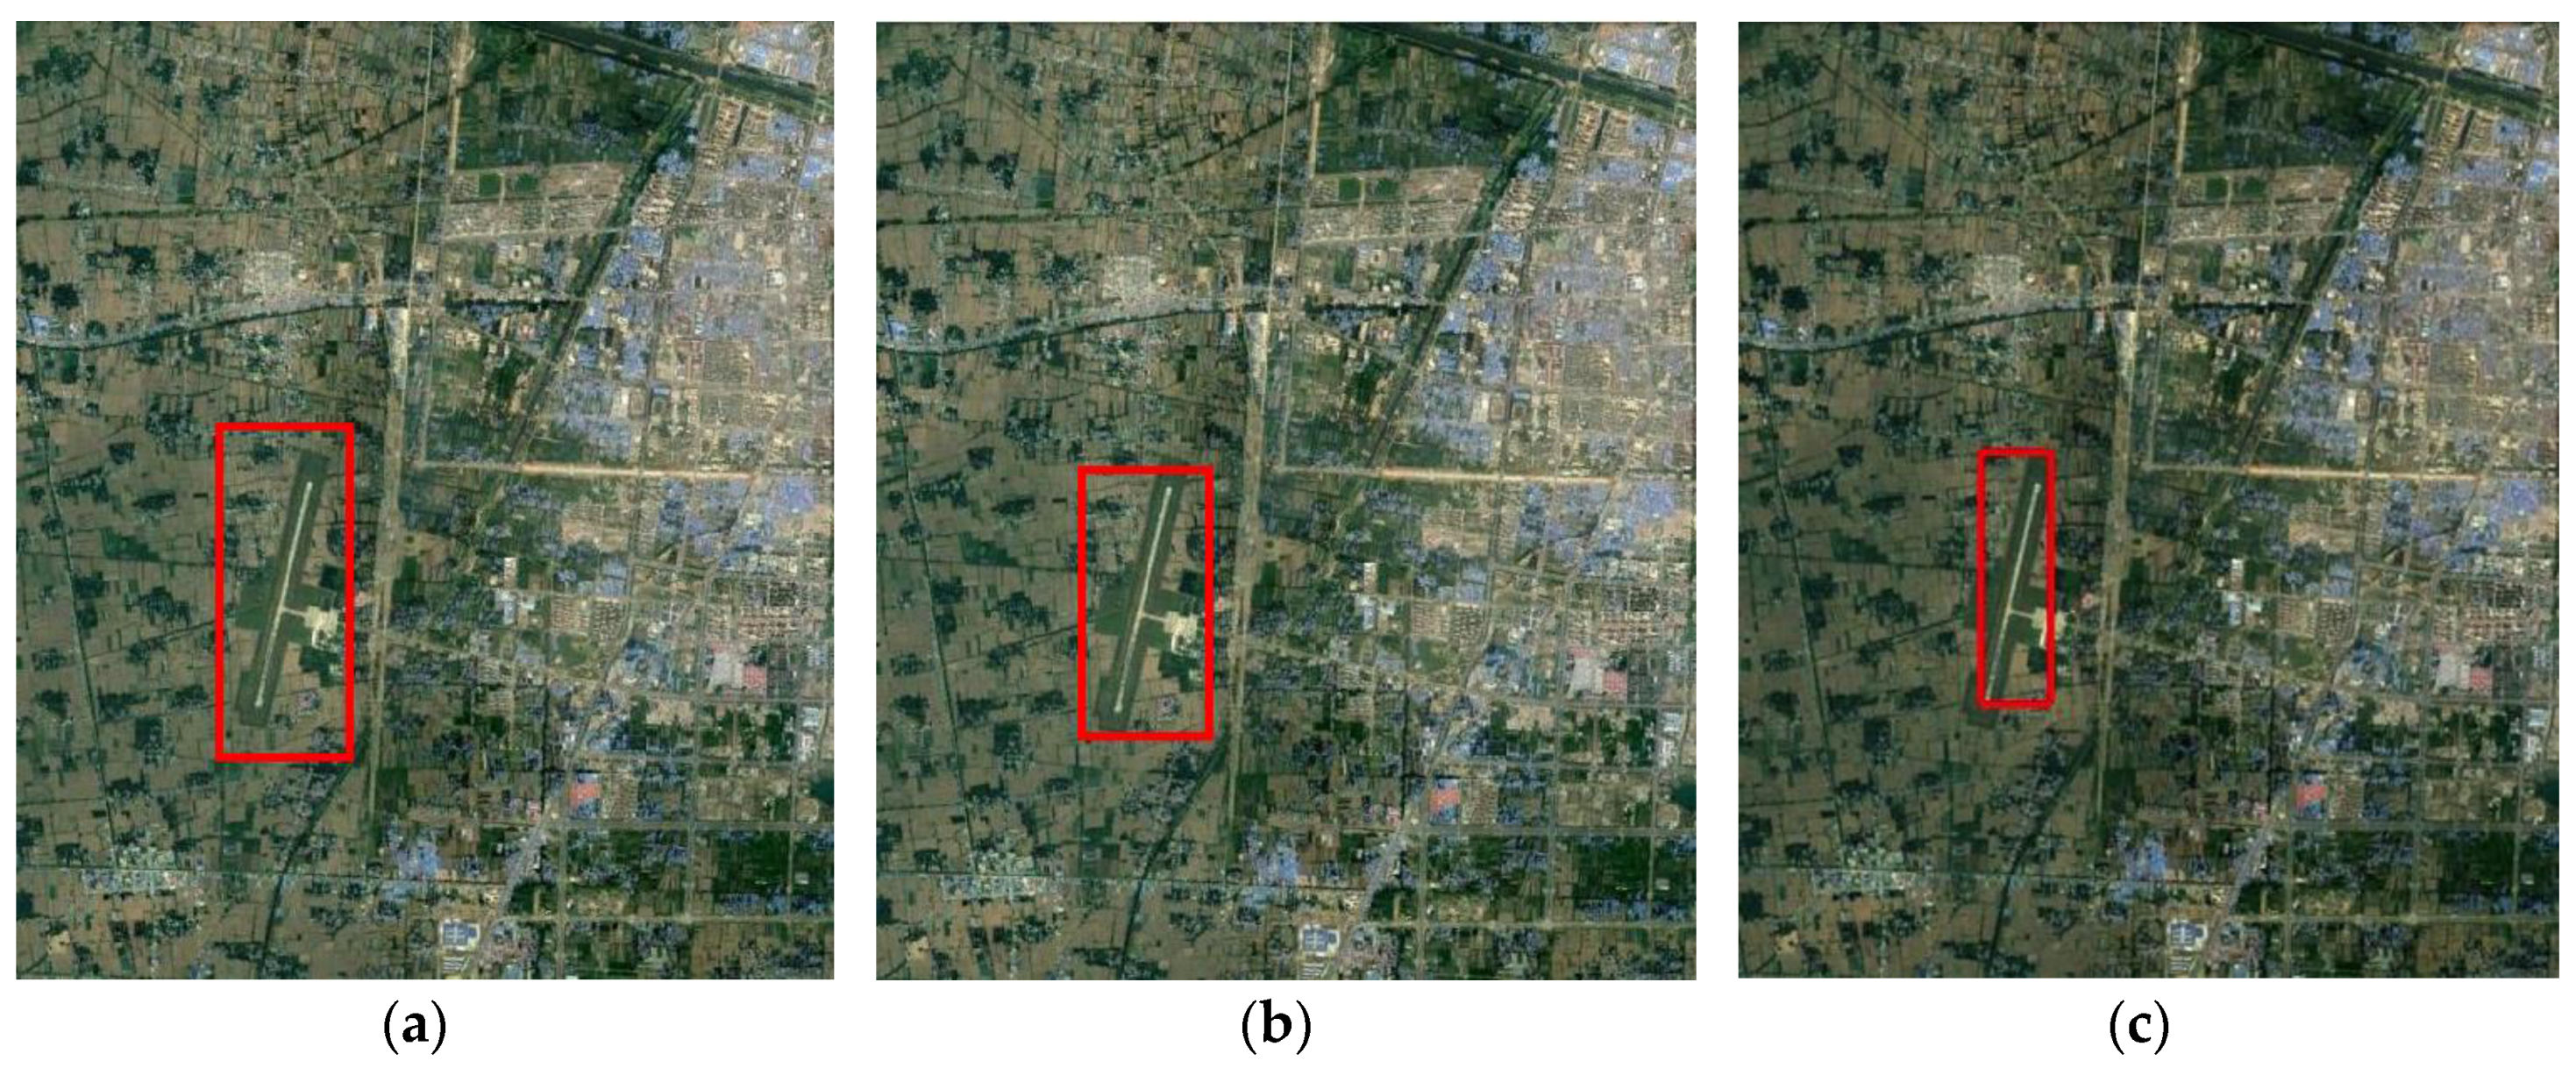
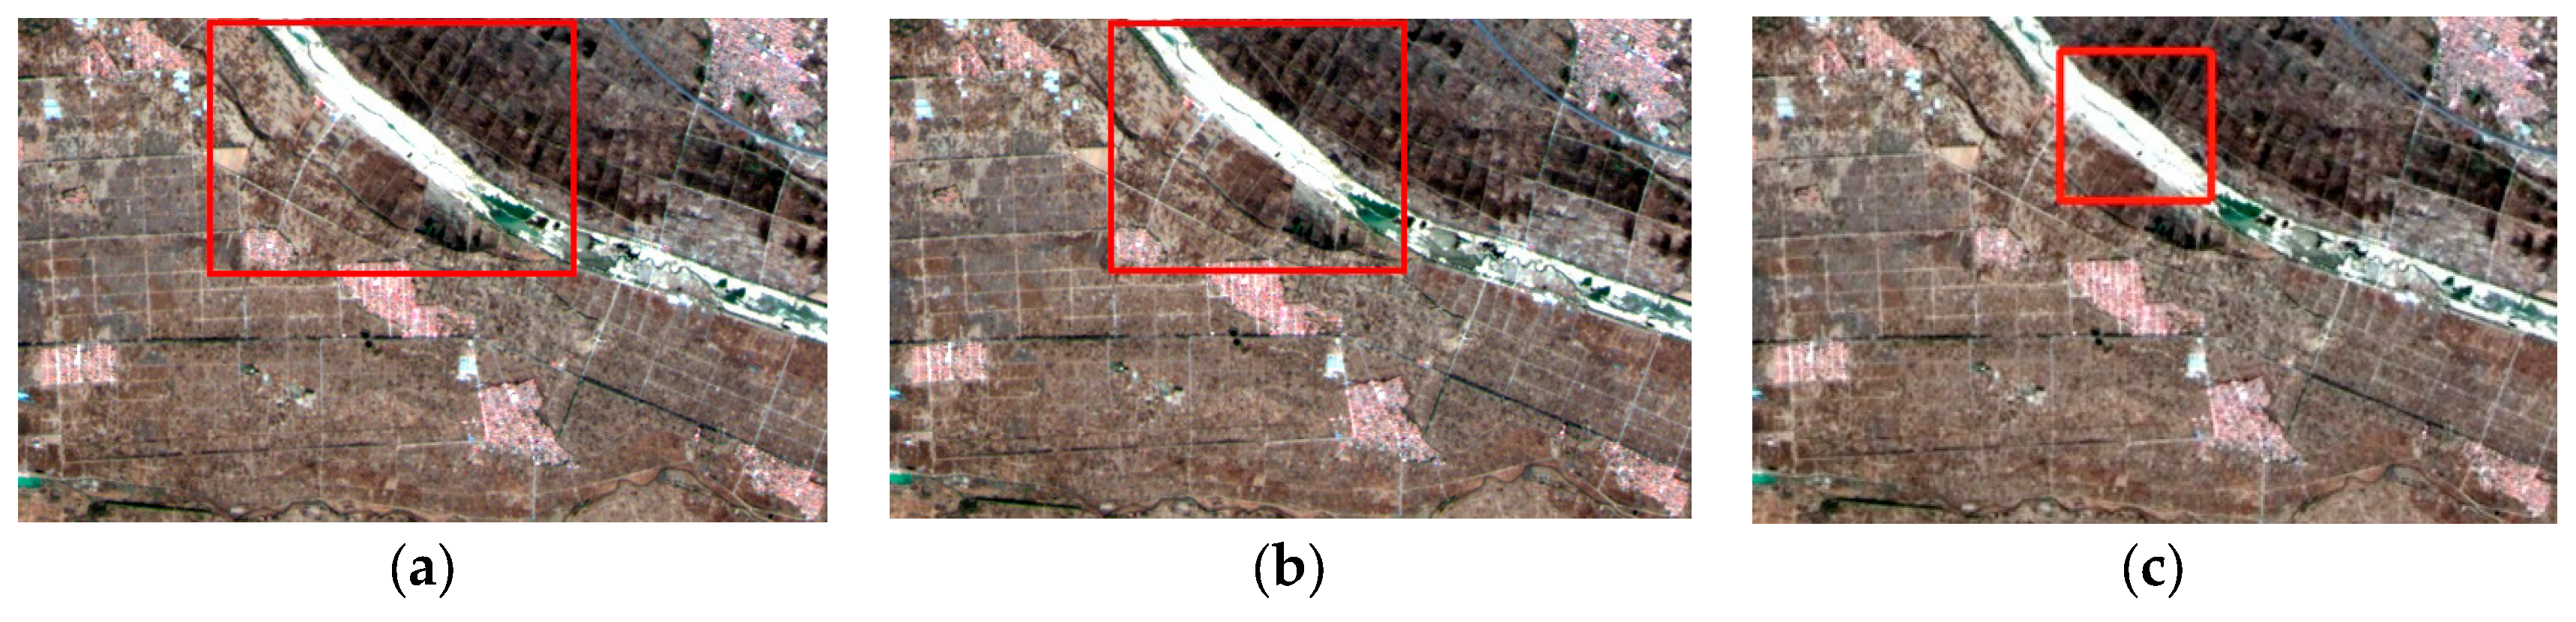
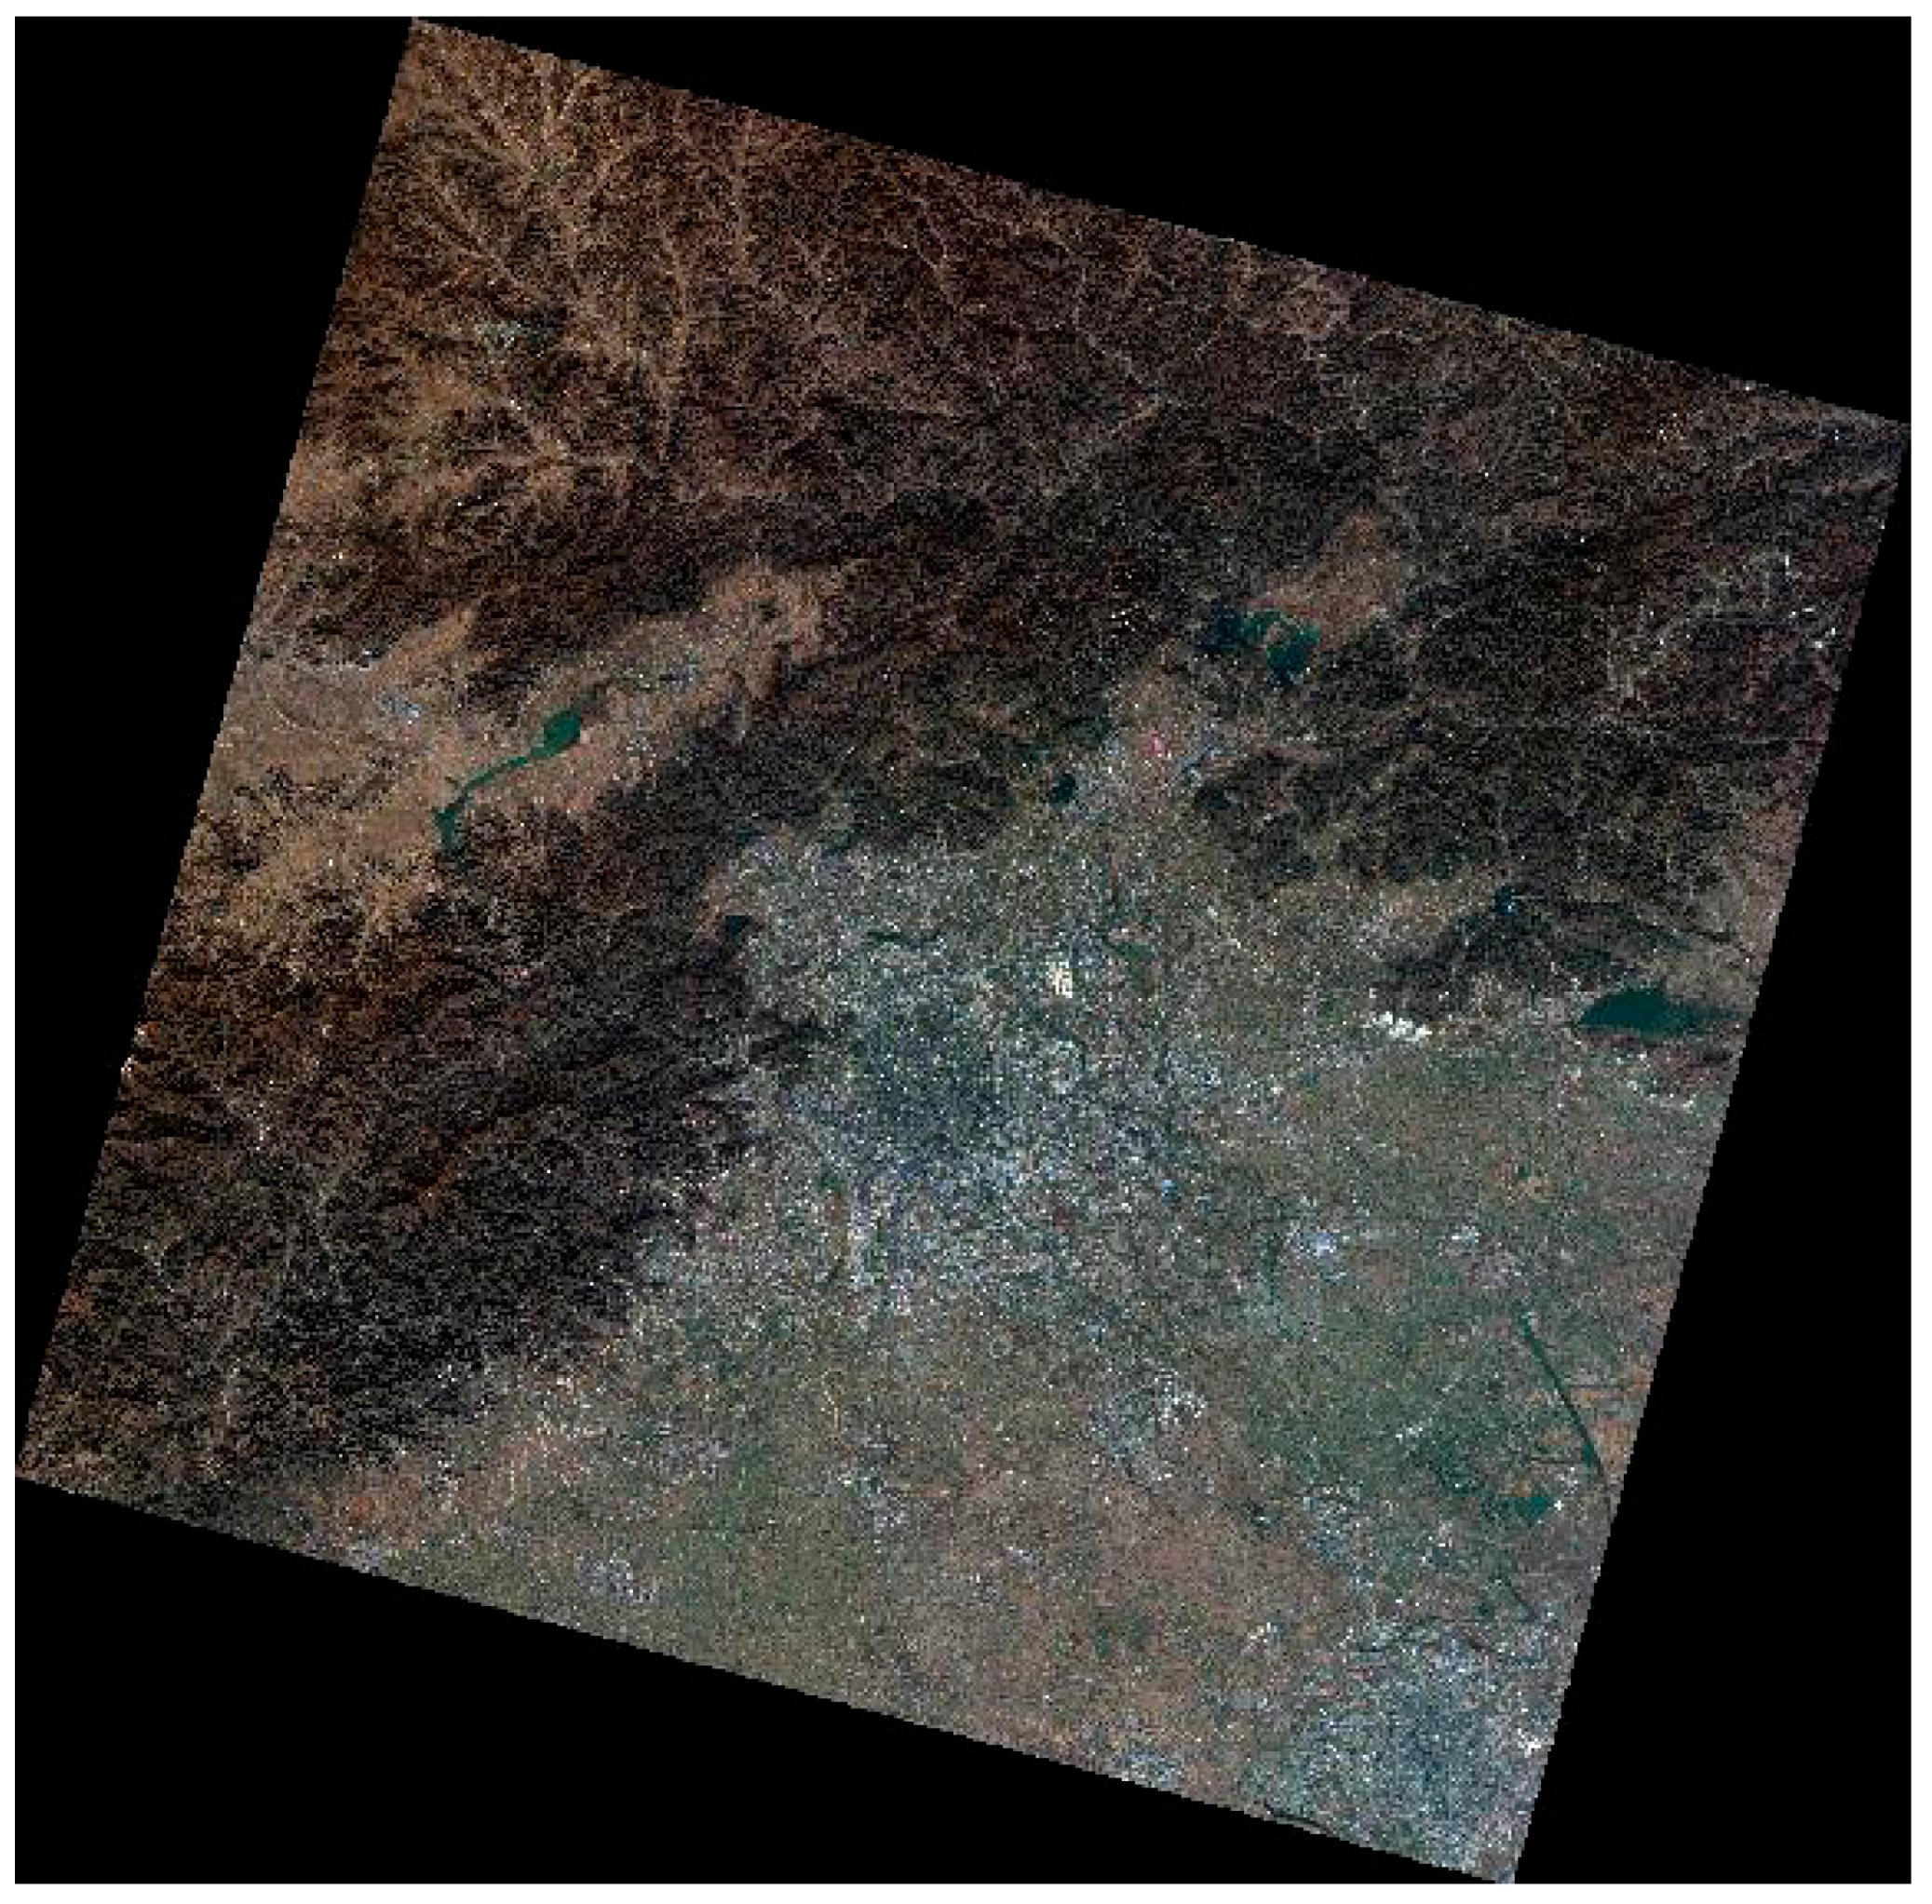
3.4. Results on a Gaofen-1 Scene

A Gaofen-1 satellite scene (Figure 17), which covers the Beijing-Tianjin-Hebei area in China, was also tested in our experiments. The size of the scene is 16,164 × 16,427 pixels in 16 m spatial resolution, and it was recorded on 2 November 2014. It is a winter scene with vegetation in the leaf-off state. The grass fields next to the airport runways are therefore less abundant. As the multispectral Gaofen-1 data has a radiometric resolution of 10 bits while the CNN used for airport detection was trained with 8-bit images, we pre-processed the scene by converting it to 8-bit quantization and we used a true-color composite in our experiment. Of the 10 airports in the scene, the Beijing Capital airport (Figure 18a) and the Tianjing Binhai airport (Figure 18b) are two large international civilian airports while the others are mid-sized or small-sized civilian airports or military airports. Because the image is too large to be processed in its entirety due to memory limitations, we first divided it into several small sub-images of size 600 × 1000. We maintained an overlap distance of 300 pixels between two neighboring sub-images, which is about the length of the runway of the Beijing Capital airport to avoid splitting an airport in two parts over two sub-images. Airport detection was then performed on each of these sub-images. An NMS was performed on the merged result that was combined from the detection results of the sub-images. If the score of a proposal is larger than 0.9, an airport is claimed to be detected.
Our proposed method successfully detected almost all airports in about 95 s by using the pre-trained CNN model, which was trained with the airport dataset introduced in Section 3.1. Nine airports were successfully detected in the scene by applying the proposed method, and no false detection was found (Figure 18). The Faster R-CNN algorithm, on the other hand, made two false positive detections (shown in Figure 19j,k). This demonstrates that, compared to the Faster R-CNN algorithm, our proposed method is better in learning feature representations from the same training dataset, which was obtained from Google Earth remote sensing images. It also has a better generalization capability when applied to other sensors.
There is an airport in the Gaofen-1 scene that was not successfully detected by both methods (shown in Figure 20). This airport has two runways that are separated far from each other and there is no obvious terminal building. Because Gaofen-1 has different spectral characteristics than the remote sensing images from Google Earth, we expect that using specific Gaofen-1 images for CNN training will lead to a better detection performance.

4. Conclusions

In this paper, we proposed a fast and automatic airport detection method using convolutional neural networks. Based on the Faster R-CNN algorithm, we forwarded some specific improvement techniques to handle the typical elongated linear geometric shape of an airport. By using additional scale and aspect ratios to increase the quality of positive samples, and by using a constraint to sieve low quality positive samples, a better airport detection performance was obtained. Note that we used the same parameter setting for both our method and the original Faster R-CNN algorithm to demonstrate that the increase in performance really benefited from the proposed specific improvement techniques. Compared to the reported results on airport detection in literature, this is to our best knowledge the fastest automatic airport detection method that can achieve state-of-the-art performance. Compared to other airport detection algorithms, the proposed method needs relatively little pre-processing, and its independence from the difficult effort of handcrafted feature design is a major advantage over many traditional methods.
Our experimental results demonstrated that although the Faster R-CNN algorithm can obtain good results for ordinary objects, a better detection accuracy can be achieved by using dedicated improvement techniques for domain specific objects (like the elongated linear airport). The CNN model was trained by a limited number of images collected from Google Earth, and our results on several Landsat 8 images acquired in four seasons and a Gaofen-1 scene demonstrated its generalization capability as it was successfully applied to images recorded by other sensors. We believe that by including more airport images, such as images from other sensors and images of high spatial resolution, further improvement on the proposed airport detection method can be expected. This is a topic of our future research work.
In our experiments, the Faster R-CNN algorithm was used due to its state-of-the-art detection accuracy and acceptable computational speed. Other CNN-based object detection algorithms, such as YOLO [19] and YOLO9000 [20], are also valuable to be tested. It is believed that, the proposed specific improvement techniques for airport detection can also be applied to other approaches that are originally proposed for detecting ordinary objects in daily life scenes, and this is under our future research work.

Acknowledgments

This work was supported in part by the National Science and Technology Major Project of China under Grants 30-Y20A07-9003-17/18 and 30-Y20A04-9001-17/18, in part by the National Natural Science Foundation of China under Grants 41671427 and 41371398, and in part by the National Key R & D Program of China under Grant 2016YFB0502300.

Author Contributions

Fen Chen, Ruilong Ren and Wenbo Xu conceived and designed the experiments; Fen Chen and Ruilong Ren performed the experiments; Guiyun Zhou and Yan Zhou contributed the materials and computing resources; Fen Chen, Ruilong Ren and Tim Van de Voorde analyzed the data and wrote the paper.

Conflicts of Interest

The authors declare no conflict of interest.

References

  1. Tao, C.; Tan, Y.; Tian, J. Airport Detection from Large IKONOS Images Using Clustered SIFT Keypoints and Region Information. IEEE Geosci. Remote Sens. Lett. 2011, 8, 128–132. [Google Scholar] [CrossRef]
  2. Tang, G.; Xiao, Z.; Liu, Q.; Liu, H. A Novel Airport Detection Method via Line Segment Classification and Texture Classification. IEEE Geosci. Remote Sens. Lett. 2015, 12, 2408–2412. [Google Scholar] [CrossRef]
  3. Pi, Y.; Fan, L.; Yang, X. Airport Detection and Runway Recognition in SAR Images. In Proceedings of the IEEE International Geoscience and Remote Sensing Symposium, Toulouse, France, 21–25 July 2003; pp. 4007–4009. [Google Scholar]
  4. Huertas, A.; Cole, W.; Nevatia, R. Detect Runways in Complex Airport Scenes. Comput. Vis., Graph. Image Process. 1990, 51, 107–145. [Google Scholar] [CrossRef]
  5. Sun, K.; Li, D.; Chen, Y.; Sui, H. Edge-preserve Image Smoothing Algorithm Based on Convexity Model and Its Application in The Airport Extraction. In Proceedings of the SPIE Remotely Sensed Data Information, Nanjing, China, 26 July 2007; pp. 67520M-1–67520M-11. [Google Scholar]
  6. Chen, Y.; Sun, K.; Zhang, J. Automatic Recognition of Airport in Remote Sensing Images Based on Improved Methods. In Proceedings of the SPIE International Symposium on Multispectral Image Processing and Pattern Recognition: Automatic Target Recognition and Image Analysis; and Multispectral Image Acquisition, Wuhan, China, 15 November 2007; pp. 678645-1–678645-8. [Google Scholar]
  7. Liu, D.; He, L.; Carin, L. Airport Detection in Large Aerial Optical Imagery. In Proceedings of the IEEE International Conference on Acoustics, Speech and Signal Processing, Montreal, Canada, 17–21 May 2004; pp. 761–764. [Google Scholar]
  8. Qu, Y.; Li, C.; Zheng, N. Airport Detection Base on Support Vector Machine from A Single Image. In Proceedings of the IEEE International Conference on Information, Communications and Signal Processing, Bangkok, Thailand, 6–9 December 2005; pp. 546–549. [Google Scholar]
  9. Bhagavathy, S.; Manjunath, B.S. Modeling and Detection of Geospatial Objects Using Texture Motifs. IEEE Trans. Geosci. Remote Sens. 2006, 44, 3706–3715. [Google Scholar] [CrossRef]
  10. Aytekin, O.; Zongur, U.; Halici, U. Texture-based Airport Runway Detection. IEEE Geosci. Remote Sens. Lett. 2013, 10, 471–475. [Google Scholar] [CrossRef]
  11. Zhu, D.; Wang, B.; Zhang, L. Airport Target Detection in Remote Sensing Images: A New Method Based on Two-Way Saliency. IEEE Geosci. Remote Sens. Lett. 2015, 12, 1096–1100. [Google Scholar]
  12. Budak, Ü.; Halici, U.; Şengür, A.; Karabatak, M.; Xiao, Y. Efficient Airport Detection Using Line Segment Detector and Fisher Vector Representation. IEEE Geosci. Remote Sens. Lett. 2016, 13, 1079–1083. [Google Scholar] [CrossRef]
  13. Zhang, P.; Niu, X.; Dou, Y.; Xia, F. Airport Detection on Optical Satellite Images Using Deep Convolutional Neural Networks. IEEE Geosci. Remote Sens. Lett. 2017, 14, 1183–1187. [Google Scholar] [CrossRef]
  14. Girshick, R.; Donahue, J.; Darrell, T.; Malik, J. Rich Feature Hierarchies for Accurate Object Detection and Semantic Segmentation. In Proceedings of the IEEE Conference on Computer Vision and Pattern Recognition, Columbus, OH, USA, 23–28 June 2014; pp. 580–587. [Google Scholar]
  15. Uijlings, J.; Van de Sande, K.; Gevers, T.; Smeulders, A. Selective Search for Object Recognition. Int. J. Comput. Vis. 2013, 104, 154–171. [Google Scholar] [CrossRef]
  16. He, K.; Zhang, X.; Ren, S.; Sun, J. Spatial Pyramid Pooling in Deep Convolutional Networks for Visual Recognition. In Proceedings of the European Conference on Computer Vision, Zurich, Switzerland, 6–12 September 2014; pp. 346–361. [Google Scholar]
  17. Girshick, R. Fast R-CNN. In Proceedings of the IEEE International Conference on Computer Vision, Santiago, Chile, 13–16 December 2015; pp. 1440–1448. [Google Scholar]
  18. Ren, S.; He, K.; Girshick, R.; Sun, J. Faster R-CNN: Towards Real-Time Object Detection with Region Proposal Networks. In Proceedings of the Advances in Neural Information Processing Systems, Montreal, Canada, 7–12 December 2015; pp. 91–99. [Google Scholar]
  19. Redmon, J.; Divvala, S.; Girshick, R.; Farhadi, A. You Only Look Once: Unified, Real-Time Object Detection. In Proceedings of the IEEE Conference on Computer Vision and Pattern Recognition, Seattle, WA, USA, 27–30 June 2016; pp. 580–587. [Google Scholar]
  20. Redmon, J.; Farhadi, A. YOLO9000: Better, Faster, Stronger. In Proceedings of the IEEE Conference on Computer Vision and Pattern Recognition, Honolulu, HI, USA, 21–26 July 2017; pp. 7263–7271. [Google Scholar]
  21. Krizhevsky, A.; Sutskever, I.; Hinton, G.E. Imagenet Classification with Deep Convolutional Neural Networks. In Proceedings of the Advances in Neural Information Processing Systems, Lake Tahoe, NV, USA, 3–6 December 2012; pp. 1097–1105. [Google Scholar]
  22. Simonyan, K.; Zisserman, A. Very Deep Convolutional Networks for Large-Scale Image Recognition. arXiv, 2015; arXiv:1409.1556v6. [Google Scholar]
  23. Nair, V.; Hinton, G.E. Rectified Linear Units Improve Restricted Boltzmann Machines. In Proceedings of the International Conference on Machine Learning, Haifa, Israel, 21–24 June 2010; pp. 807–814. [Google Scholar]
  24. Srivastava, N.; Hinton, G.; Krizhevsky, A. Dropout: A Simple Way to Prevent Neural Networks from Overfitting. J. Mach. Learn. Res. 2014, 15, 1929–1958. [Google Scholar]
  25. LeCun, Y.; Boser, B.; Denker, J.S.; Henderson, D.; Howard, R. E.; Hubbard, W.; Jackel, L.D. Back Propagation Applied to Handwritten Zip Code Recognition. Neural comput. 1989, 1, 541–551. [Google Scholar] [CrossRef]
  26. Jia, Y.; Shelhamer, E.; Donahue, J.; Karayev, S.; Long, J.; Girshick, R.; Guadarrama, S.; Darrell, T. Caffe: Convolutional Architecture for Fast Feature Embedding. arXiv, 2014; arXiv:1408.5093. [Google Scholar]
  27. Everingham, M.; Gool, L.V.; Williams, C.K.I.; Winn, J.; Zisserman, A. The PASCAL Visual Object Classes (VOC) Challenge. Int. J. Comput. Vis. 2010, 88, 303–338. [Google Scholar] [CrossRef]
  28. Fawcett, T. Roc Graphs: Notes and Practical Considerations for Researchers; HP Laboratories: Palo Alto, CA, USA, 2006. [Google Scholar]
  29. Senthilnath, J.; Sindhu, S.; Omkar, S.N. GPU-based Normalized Cuts for Road Extraction Using Satellite Imagery. J. Earth Syst. Sci. 2014, 123, 1759–1769. [Google Scholar] [CrossRef]
Figure 1. The airport detection network architecture is shown in the blue frame, and the region proposal network architecture is shown in the green frame.
Remotesensing 10 00443 g001
Figure 2. Positive samples at different scales: (a) scale of 1282; (b) scale of 642. The bounding box of the airport is shown by the blue rectangle, and the positive sample is shown by the red rectangle. [Image courtesy of Google Earth].
Remotesensing 10 00443 g002
Figure 3. Positive samples at different aspect ratios: (a) aspect ratio of 1:2; (b) aspect ratio of 1:3. The bounding box of the airport is shown by the blue rectangle, and the positive sample is shown by the red rectangle. [Image courtesy of Google Earth].
Remotesensing 10 00443 g003
Figure 4. Low quality positive samples: (a) Zhangjiakou Ningyuan airport; (b) Yangzhou Taizhou airport. The bounding box of the airport is shown by the blue rectangle, and the low quality positive sample is shown by the red rectangle. [Image courtesy of Google Earth].
Remotesensing 10 00443 g004
Figure 5. Some of the training airport images. [Image courtesy of Google Earth].
Remotesensing 10 00443 g005
Figure 6. True detection results of different methods. (a) Faster R-CNN; (b) proposed method; (c) LSD + AlexNet. [Image courtesy of Google Earth].
Remotesensing 10 00443 g006
Figure 7. True detection results of different methods. (a) Faster R-CNN; (b) proposed method; (c) LSD + AlexNet. [Image courtesy of Google Earth].
Remotesensing 10 00443 g007
Figure 8. True detection results of different methods. (a) Faster R-CNN; (b) proposed method; (c) LSD + AlexNet. [Image courtesy of Google Earth].
Remotesensing 10 00443 g008
Figure 9. True detection results of different methods. (a) Faster R-CNN; (b) proposed method; (c) LSD + AlexNet. [Image courtesy of Google Earth].
Remotesensing 10 00443 g009
Figure 10. False detection result in an image with no airport in it. (a) Faster R-CNN; (b) LSD + AlexNet. [Image courtesy of Google Earth].
Remotesensing 10 00443 g010
Figure 11. False detection result in an image with no airport in it. (a) Faster R-CNN; (b) proposed method; (c) LSD + AlexNet. [Image courtesy of Google Earth].
Remotesensing 10 00443 g011
Figure 12. ROC graphs.
Remotesensing 10 00443 g012
Figure 13. Precision-recall curves.
Remotesensing 10 00443 g013
Figure 14. Performance of the proposed method with different number of training images.
Remotesensing 10 00443 g014
Figure 15. Detection results of the proposed method in different seasons at Jiagedaqi airport. (a) 15 April 2014; (b) 14 June 2015; (c) 20 September 2016; (d) 16 December 2016.
Remotesensing 10 00443 g015
Figure 16. Detection results of the original Faster R-CNNalgorithm in different seasons at Jiagedaqi airport. (a) 15 April 2014; (b) 14 June 2015; (c) 20 September 2016; (d) 16 December 2016.
Remotesensing 10 00443 g016
Figure 17. A scene of Gaofen-1 satellite that covers the Beijing area (true color composite).
Remotesensing 10 00443 g017
Figure 18. Detection results in the Gaofen-1 satellite scene by the proposed method. (ai) Nine true detection results. All images have been zoomed to the same image height for a clear presentation.
Remotesensing 10 00443 g018
Figure 19. Detection results in the Gaofen-1 satellite scene by the Faster R-CNN algorithm. (ai) Nine true detection results. (j,k) Two false detection results. All images have been zoomed to the same image height for a clear presentation.
Remotesensing 10 00443 g019
Figure 20. The airport that was not detected by both methods.
Remotesensing 10 00443 g020
Table 1. Numerical performance. T1 denotes adding additional scale and aspect ratios, and T2 denotes sieving low quality positive samples. “Faster R-CNN+T1+T2” is the proposed method.
AlgorithmAverage IoUAPRecallPrecisionAccuracyFAR
Faster R-CNN0.6640.7940.8380.7780.8350.090
Faster R-CNN + T10.7080.7950.8330.8260.8540.069
Faster R-CNN + T1 + T20.7150.8000.8370.8410.8590.066
LSD + AlexNet0.3660.5570.6550.5970.6370.203

