Article

Quantitative Evaluations and Error Source Analysis of Fengyun-2-Based and GPM-Based Precipitation Products over Mainland China in Summer, 2018

1
Institute of Agricultural Remote Sensing and Information Technology Application, College of Environmental and Resource Sciences, Zhejiang University, Hangzhou 310058, China
2
Institute of Remote Sensing and Geographical Information Systems, School of Earth and Space Sciences, Peking University, Beijing 100871, China
3
State Key Laboratory of Resources and Environmental Information System, Institute of Geographical Sciences and Natural Resources Research, Chinese Academy of Sciences, Beijing 100101, China
4
University of Saskatchewan Coldwater Lab, Canmore, AB T1W 3G1, Canada
5
Centre for Hydrology, University of Saskatchewan, Saskatoon, SK S7N 1K2, Canada
*
Author to whom correspondence should be addressed.
Remote Sens. 2019, 11(24), 2992; https://doi.org/10.3390/rs11242992
Submission received: 13 November 2019 / Revised: 7 December 2019 / Accepted: 10 December 2019 / Published: 12 December 2019
(This article belongs to the Special Issue Remote Sensing of the Terrestrial Hydrologic Cycle)

Abstract

:
Satellite-based quantitative precipitation estimates (QPE) with a fine quality are of great importance to global water cycle and matter and energy exchange research. In this study, we firstly apply various statistical indicators to evaluate and compare the main current satellite-based precipitation products from Chinese Fengyun (FY)-2 and the Global Precipitation Measurement (GPM), respectively, over mainland China in summer, 2018. We find that (1) FY-2G QPE and Integrated Multi-satellitE Retrievals for GPM (IMERG) perform significantly better than FY-2E QPE, using rain gauge data, with correlation coefficients (CC) varying from 0.65 to 0.90, 0.80 to 0.90, and 0.40 to 0.53, respectively; (2) IMERG agrees well with rain gauge data at monthly scale, while it performs worse than FY-2G QPE at hourly and daily scales, which may be caused by its algorithms; (3) FY-2G QPE underestimates the precipitation in summer, while FY-2E QPE and IMERG generally overestimate the precipitation; (4) there is an interesting error phenomenon in that both FY-based and GPM-based precipitation products perform more poorly during the period from 06:00 to 10:00 UTC than other periods at diurnal scale; and (5) FY-2G QPE agrees well with IMERG in terms of spatial patterns and consistency (CC of ~0.81). These findings can provide valuable preliminary references for improving next generation satellite-based QPE retrieval algorithms and instructions for applying these data in various practical fields.

Graphical Abstract

1. Introduction

As one of the most active variables in atmospheric circulation, precipitation is a critical linkage between global water and energy cycles. Obtaining spatiotemporal information on precipitation is of great importance for water resource management, climatological modeling, and many other applications [1,2,3]. Therefore, reliable precipitation datasets gathered from different sources, including ground stations, ground-based weather radars, and satellites, are essential [4,5].
Collecting precipitation information from ground rain gauge stations is the traditional and common method of measurement. However, the limitations are obvious due to the uneven spatial distribution of the stations. The measurements of ground stations are usually very sparse over some regions of the earth (e.g., the Tibetan plateau), which are meteorologically important [6,7]. As for ground-based weather radars, they have certain superiorities when observing precipitation in local areas. Nevertheless, due to the limitations of the scope of observation and the huge cost of equipment acquisition and maintenance, ground-based weather radars are not the first choice for large-scale precipitation observations.
However, precipitation information obtained from satellites does not meet such limitations. Satellite-based precipitation datasets can depict the spatial and temporal variability of precipitation with a considerable accuracy over regions that have few ground stations [5,8]. Over the last four decades, the progress of meteorological satellites has made it possible for scientists to acquire reliable and cost-effective precipitation datasets through a variety of sensors and inversion algorithms [9,10,11,12,13]. Therefore, obtaining high-resolution and accurate precipitation estimates derived from sensors on satellites at a regional or global scale has become a highly-efficient research method at present [4,14,15].
Satellite-based precipitation products provided by several institutions and organizations from all over the world are different in terms of their spatial and temporal resolution, data coverage, data continuity, and latency [16]. The products mentioned above can only be used for practical applications if there is a consistency in terms of both the spatial and temporal scales with ground-based measurements. Therefore, the validation of satellite-based precipitation products is necessary to ensure the reliability of the products. In addition, in order to provide product users with a reliable error structure and instructions for satellite precipitation products, as well as a reasonable advancement of retrieval algorithms, validation is indispensable for satellite-based data applications [17].
There have been numerous studies evaluating the performance of satellite-based precipitation products. Datasets such as Tropical Rainfall Measuring Mission (TRMM) Multisatellite Precipitation Analysis (TMPA), Integrated Multi-satellitE Retrievals for Global Precipitation Measurement (IMERG), Climate Hazards Group InfraRed Precipitation with Stations (CHIRPS), the Climate Prediction Center (CPC) MORPHing technique (CMORPH), Precipitation Estimation from Remotely Sensed Information using Artificial Neural Networks–Climate Data Record (PERSIANN-CDR), Multi-Source Weighted-Ensemble Precipitation (MSWEP), H-SAF (EUMETSAT Satellite Application Facility on Support to Operational Hydrology and Water Management) have been validated in various regions of the world [18,19,20,21,22,23]. Chen et al. [24] analyzed the similarities and differences between TMPA V6 and V7 over China, and determined that 3B42 RT V7 overestimated precipitation over the Qinghai–Tibet Plateau by approximately 139.5%. Teng et al. [25] identified overestimates outside the 95% prediction interval in TMPA data for the Xin’anjiang Reservoir, which is the largest artificial water body in southeast China. Prakash et al. [26] evaluated the accuracy of IMERG data with TMPA and Global Satellite Mapping of Precipitation (GSMaP) data in southeast India. The results showed that IMERG represented large-scale monsoon rainfall features and their variability more realistically. Tang et al. [22] evaluated IMERG from April to December 2014 at hourly scale over mainland China and found that IMERG performed with a small correlation coefficient (CC) of ~0.40 and slight overestimates by an average of ~9%. Katiraie-Boroujerdy et al. [27] found that PERSIANN-CDR agreed well with gauge-based datasets at monthly scales over Iran, with a CC of ~0.88. Rivera et al. [18] demonstrated the systematic errors that could be attributed to the varying performance of CHIRPS in different seasons over Argentina, such as the significant bias of ~65.8% over the north Patagonia region.
Although there are a large number of evaluation studies on satellite-based precipitation products, few investigations have been conducted to assess the quality of the precipitation products from Chinese Fengyun (FY) series satellites. FY series satellites are the major operational meteorological satellites of China. Currently, there are eight on-orbit FY satellites in operation, including three polar orbit satellites and five geostationary satellites, in order to provide global meteorological observation services. With the increasing influences of FY series satellites, evaluating the performance and usability of their precipitation products has become increasingly necessary.
Compared with the data obtained from polar orbit satellites, precipitation information from geostationary satellites has a fixed observation area and stable observation intervals, which can better reflect the spatial distribution of precipitation and its changes at hourly and other temporal scales in the study areas. In other words, geostationary satellites have not only the spatial continuity of most other satellites, but also the temporal continuity of ground stations. Therefore, we selected two of the main current satellite-based precipitation products from two geostationary satellites in different batches of the FY-2 series to evaluate their quality in this study. The main objects of this study are as follows: (1) To firstly evaluate and compare the precipitation products from FY-2 and GPM at meteorological scales (hourly, daily) and a climatological scale (monthly), respectively, and (2) to analyze the potential error sources of the main current satellite-based precipitation products over mainland China in summer, 2018.

2. Study Area and Datasets
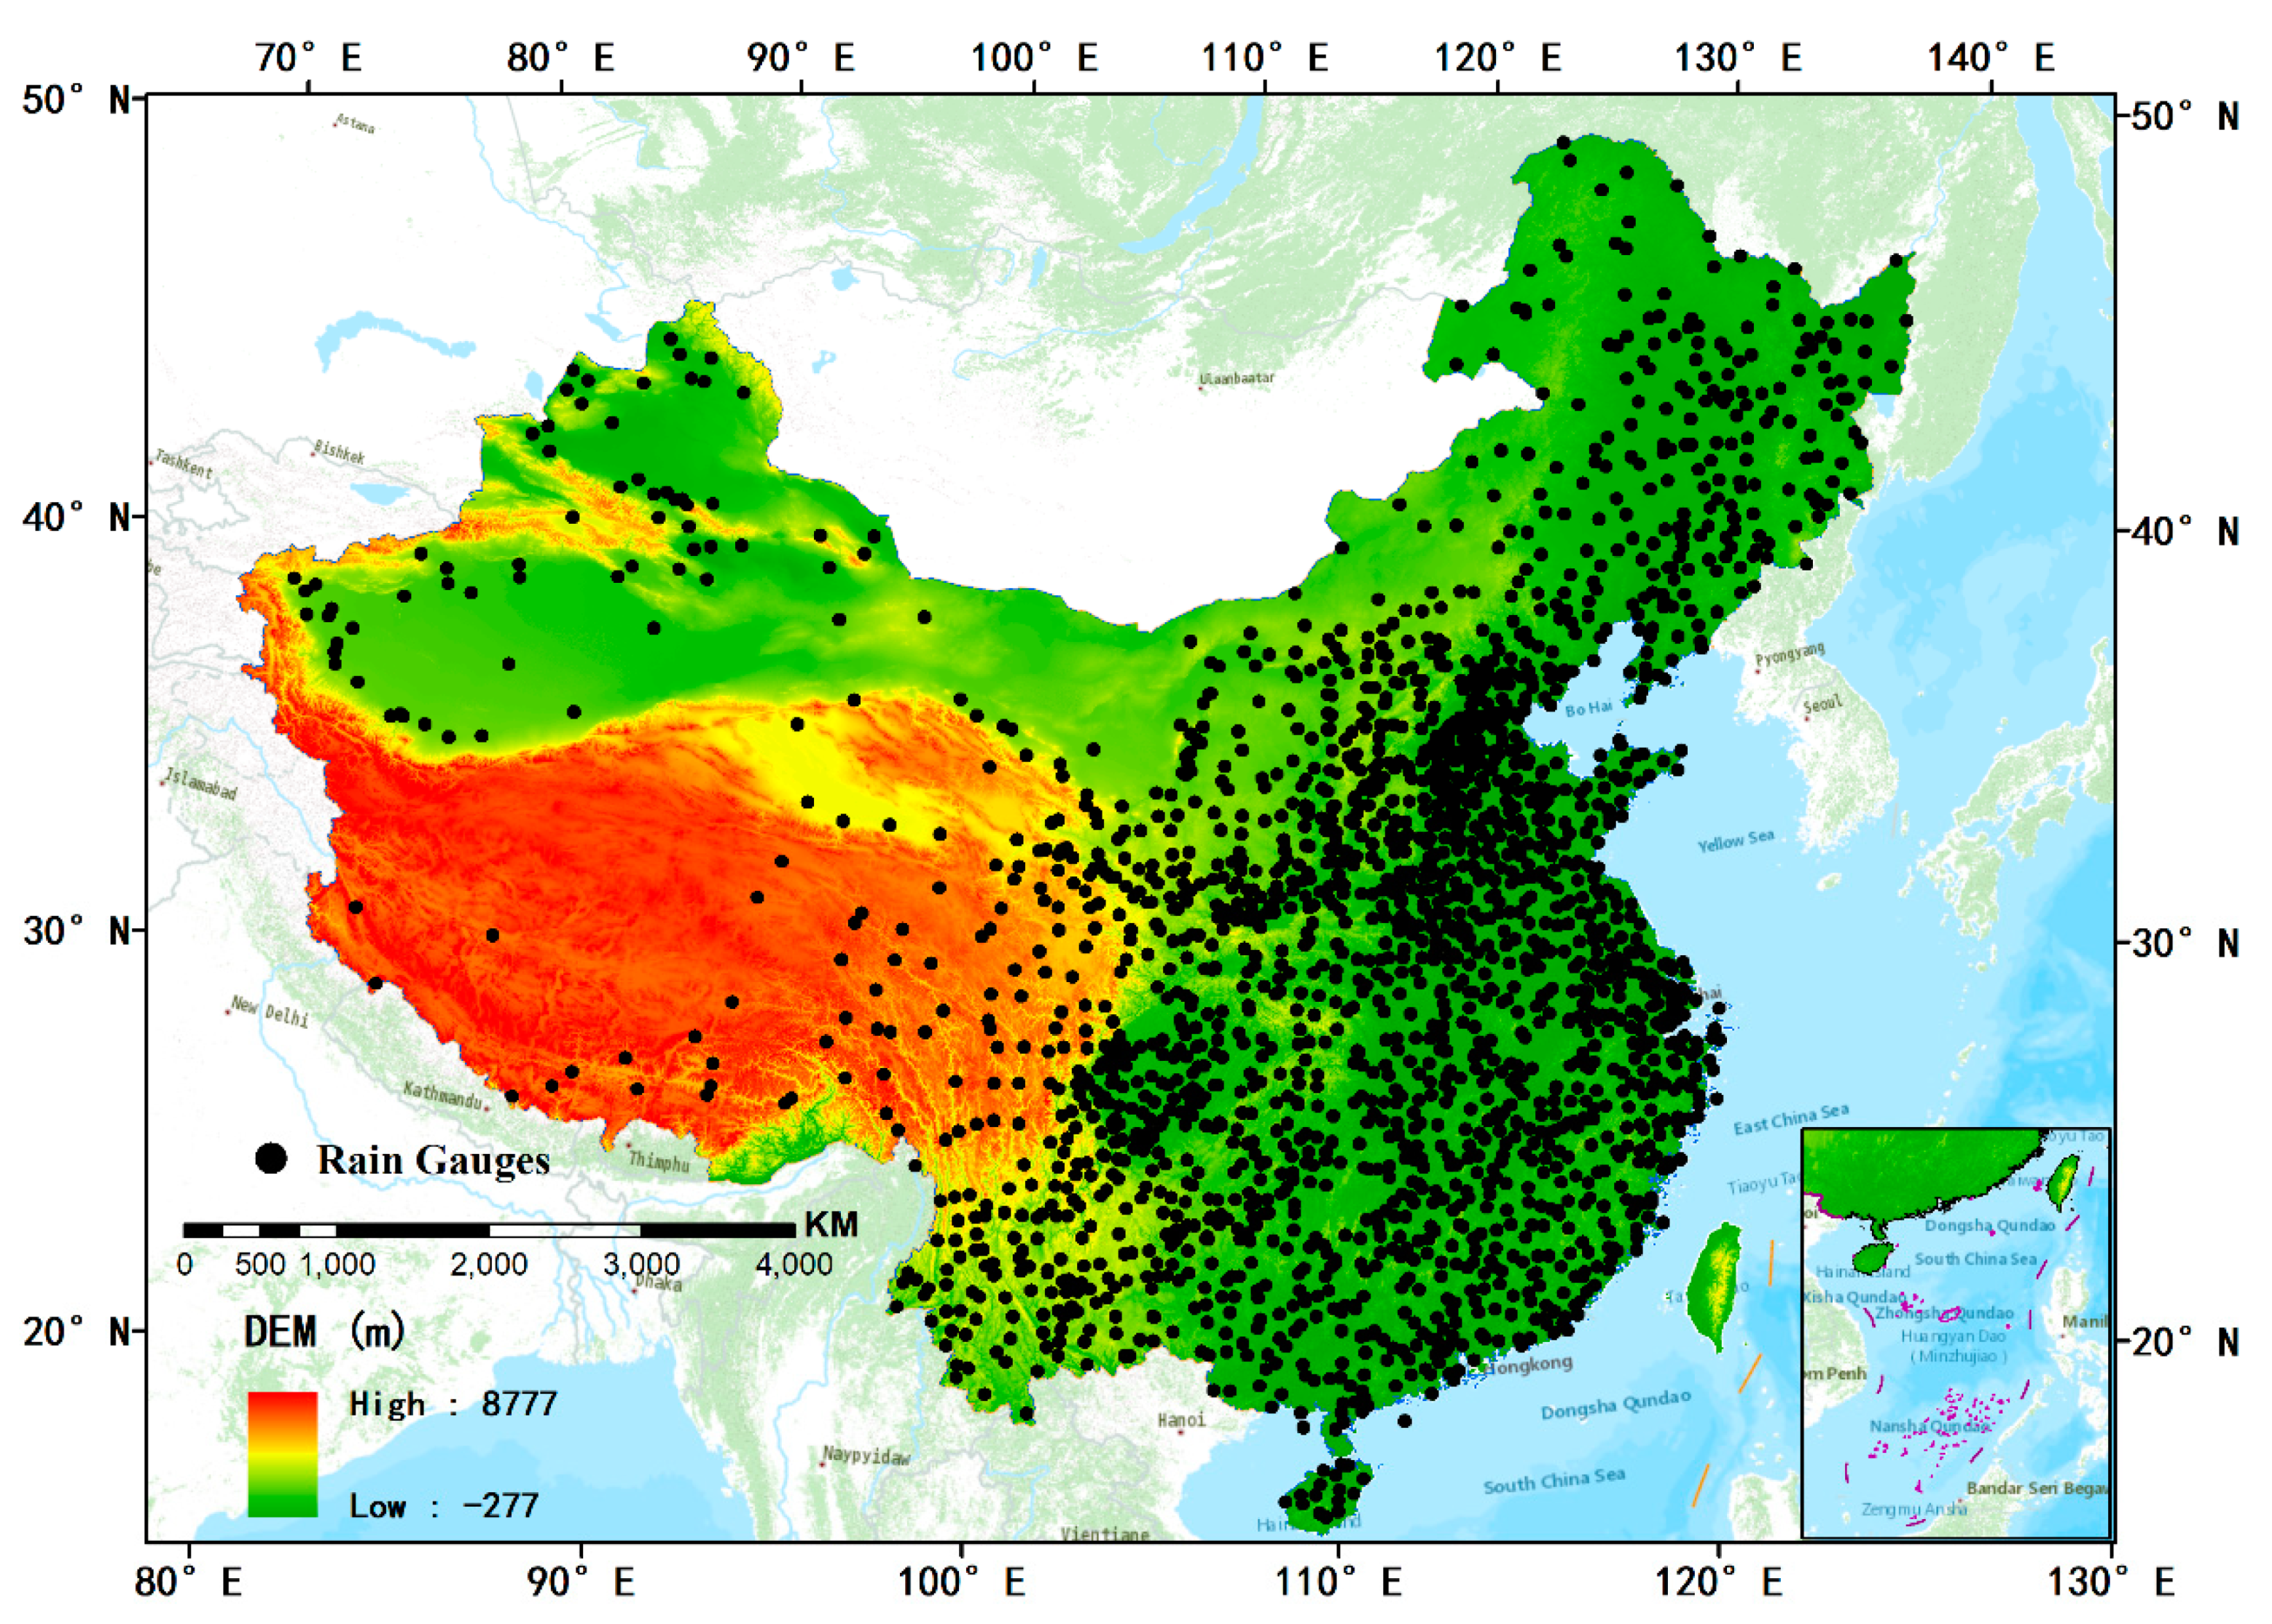
2.1. Study Area

The study area is the region of mainland China with the longitude and latitude range between 73–135°E and 18–53°N, respectively (Figure 1). The spatial distribution of the Digital Elevation Model (DEM) in mainland China is also shown in Figure 1, which demonstrates that the terrain of mainland China is low in the southeast and high in the northwest, forming a three-ladder pattern. Due to the dramatic changes in terrain, the climate in mainland China is of great complexity and is mainly regulated by the monsoon system [28]. The precipitation in China shows conspicuous variability at both temporal and spatial scales.
In this study, we chose the northern hemisphere summer (from June to August) of 2018 as the research period. The China Climate Bulletin in 2018 published by the China Meteorological Administration (CMA) shows that the annual average precipitation in China was 673.8 mm/year, which was 7% more than in other years. In particular, the average precipitation in summer was 356.4 mm/year, which was 10% above that of previous summers. Intensive typhoons and heavy rain occurred frequently in the summer of 2018. The East Asian subtropical summer monsoon was significantly stronger than usual in 2018, being the strongest since 1951.

2.2. Gauge Precipitation Measurements

The hourly rain gauge datasets from 2163 national ground stations used in this study were collected from the National Meteorological Information Center (NMIC) of CMA (http://data.cma.cn). The spatial distribution of ground stations in mainland China is shown in Figure 1. Hourly datasets from national ground stations usually include observations of air temperature, air pressure, precipitation, relative humidity, water vapor pressure, wind, and precipitation, etc. Meanwhile, the ground station datasets are quality controlled with the actual rate of each factor over 99.9%, and the accuracy of the datasets was close to 100% [29].

2.3. Satellite Precipitation Estimates

2.3.1. FY-2E Quantitative Precipitation Estimates (QPE)

The FY-2 series satellites are the principle observational platforms for covering dynamic weather events and the near-earth space environments in China. FY-2E is the third operational stationary satellite in the FY series, and was launched on 23 December 2008. Its sub-satellite point was 105°E before 1 July 2015 and has been 86.5°E over the equator to date. FY-2E is the last satellite in the first generation of Chinese operational meteorological satellites. The satellite is equipped with a five-channel (one visible channel and four infrared channels) scanning radiometer named the Visible and Infrared Spin Scan Radiometer (VISSR). The FY-2E satellite performs much better in terms of the accuracy of the inversion results of geophysical parameters, for example, precipitation, due to technical improvements, such as a reduction of the overlap of infrared spectral channels, compared with previous satellites of the FY-2 series.
FY-2E QPE data, generated by the fusion of FY-2E satellite estimate results and precipitation measurements from rain gauges, was used in this study. The QPE products have four categories at different temporal scales—hourly, three-hourly, six-hourly, and daily—with a spatial resolution of 0.1° × 0.1°. The latency of QPE products yielded by FY-2 series satellites is approximately one hour.

2.3.2. FY-2G QPE

FY-2G is one of the third batches of operational geostationary satellites in the FY-2 series, and was launched on 31 December 2014. The sub-satellite point of FY-2G changed from 99.5°E to 105°E, and finally became 99.2°E over the equator in April, 2018. FY-2G is the latest satellite to have Level 2 and Level 3 products since 2015. FY-2G has carried the radiometer with the best performance in operational satellites in the FY-2 series to date. Compared with satellites in the second batch, such as FY-2E, FY-2G has the ability to scan specific areas with a more flexible and higher temporal resolution. It plays a significant role in China’s meteorological disaster monitoring, early warning, prevention, and reduction.
The QPE products in FY-2E and FY-2G have the same temporal scale and spatial resolution. However, the differences in the onboard sensors and fusion algorithms of FY-2E and FY-2G satellites lead to differences not only in the accuracy of precipitation estimates, but also in the numerical range and distribution. The QPE products can be downloaded from the National Satellite Meteorological Centre (NSMC, www.nsmc.org.cn).

2.3.3. IMERG

GPM is an international satellite mission. Its core observatory was launched by the National Aeronautics and Space Administration (NASA) and the Japanese Aerospace Exploration Agency (JAXA) on 27 February 2014. The first space-borne Ku/Ka-band Dual-frequency Precipitation Radar (DPR) was carried on the GPM Core Observatory, making it more sensitive to light rain rates and snowfall. IMERG is designed to intercalibrate, merge, and interpolate “all” data from satellites in the GPM constellation at fine temporal and special scales over the entire globe [11]. The version 06 IMERG Final run products were used in this study. The spatial resolution of IMERG is 0.1° × 0.1°, which is the same as FY-2 QPE products. The temporal resolution is half an hour, and the hourly data used in this study was obtained by averaging the two datafiles in the same hour.
Considering the fact that FY-2 QPE datasets merge precipitation information from ground observations, we applied the IMERG Final run dataset (V06B), which is calibrated with ground station data with a latency of about 3.5 months, as another precipitation estimate product, in this study. IMERG data could be downloaded from the Precipitation Measurement Mission’s (PMM) website (https://pmm.nasa.gov/data-access/downloads/gpm).

3. Methods

3.1. Contingency Statistical Indices

Four indices are used to assess the contingency of satellite precipitation estimates. The probability of detection (POD) represents the proportion of correctly detected precipitation occurrences to the total number of events detected by satellites. The false alarm ratio (FAR) indicates the ratio of rainfall events that are falsely alarmed among the total number of satellite-detected precipitation occurrences. The frequency bias index (FBI) shows the degree of precipitation occurrence estimates from satellites. In other words, it indicates the overestimated or underestimated tendency in satellite-detected precipitation occurrences. The critical success index (CSI) denotes the fraction of rainfall events detected by satellites correctly to the total number of observed or detected rainfall events [30]. The indices mentioned above have no consideration of random assignments [31]. The equations of these indicators are given in Table 1. To discriminate between wet and dry samples, the thresholds of 1 mm day-1 for daily rain events and 0.1 mm hour-1 for hourly ones were used. [6].

3.2. Statistical Indices

Four commonly used diagnostic statistics, including the correlation coefficient (CC), root mean square error (RMSE), relative bias (bias), and mean absolute error (MAE), were applied in this study to quantify the consistency between satellite precipitation products and rain gauge measurements. The four indices were also used to cross-evaluate satellite precipitation products without rain gauge measurements. The equations of these four statistical indices are shown in Table 2.

4. Results

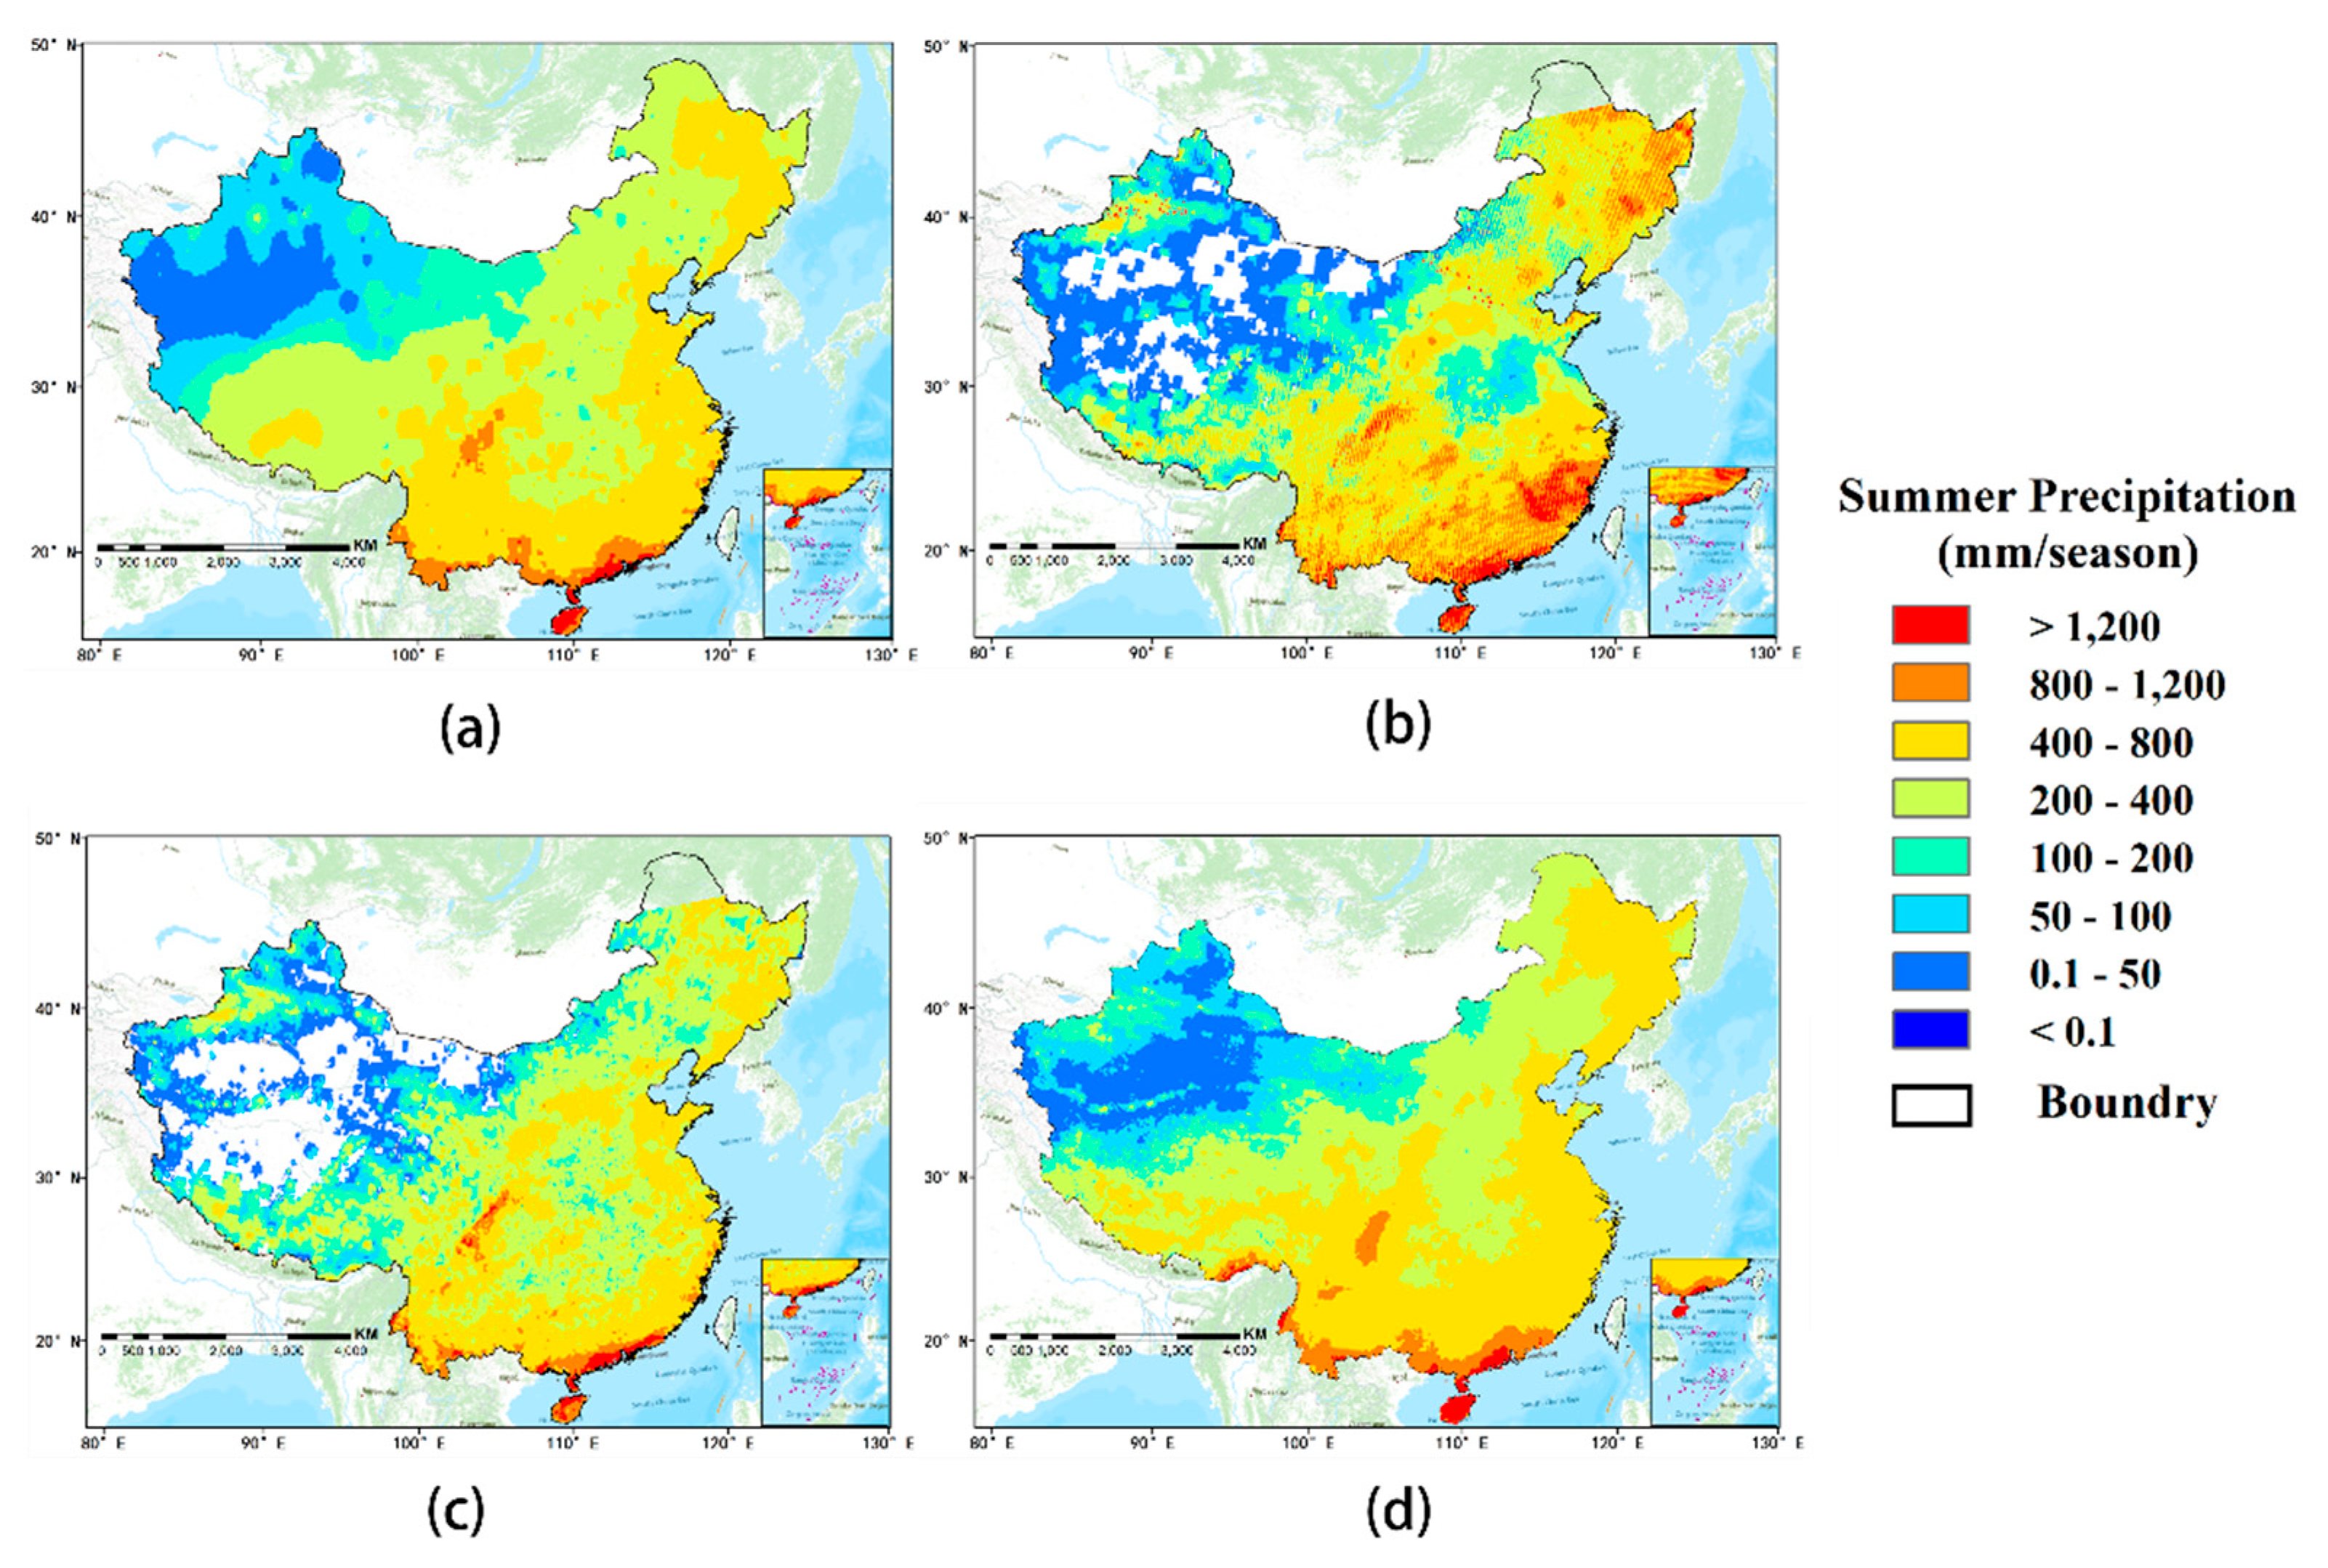
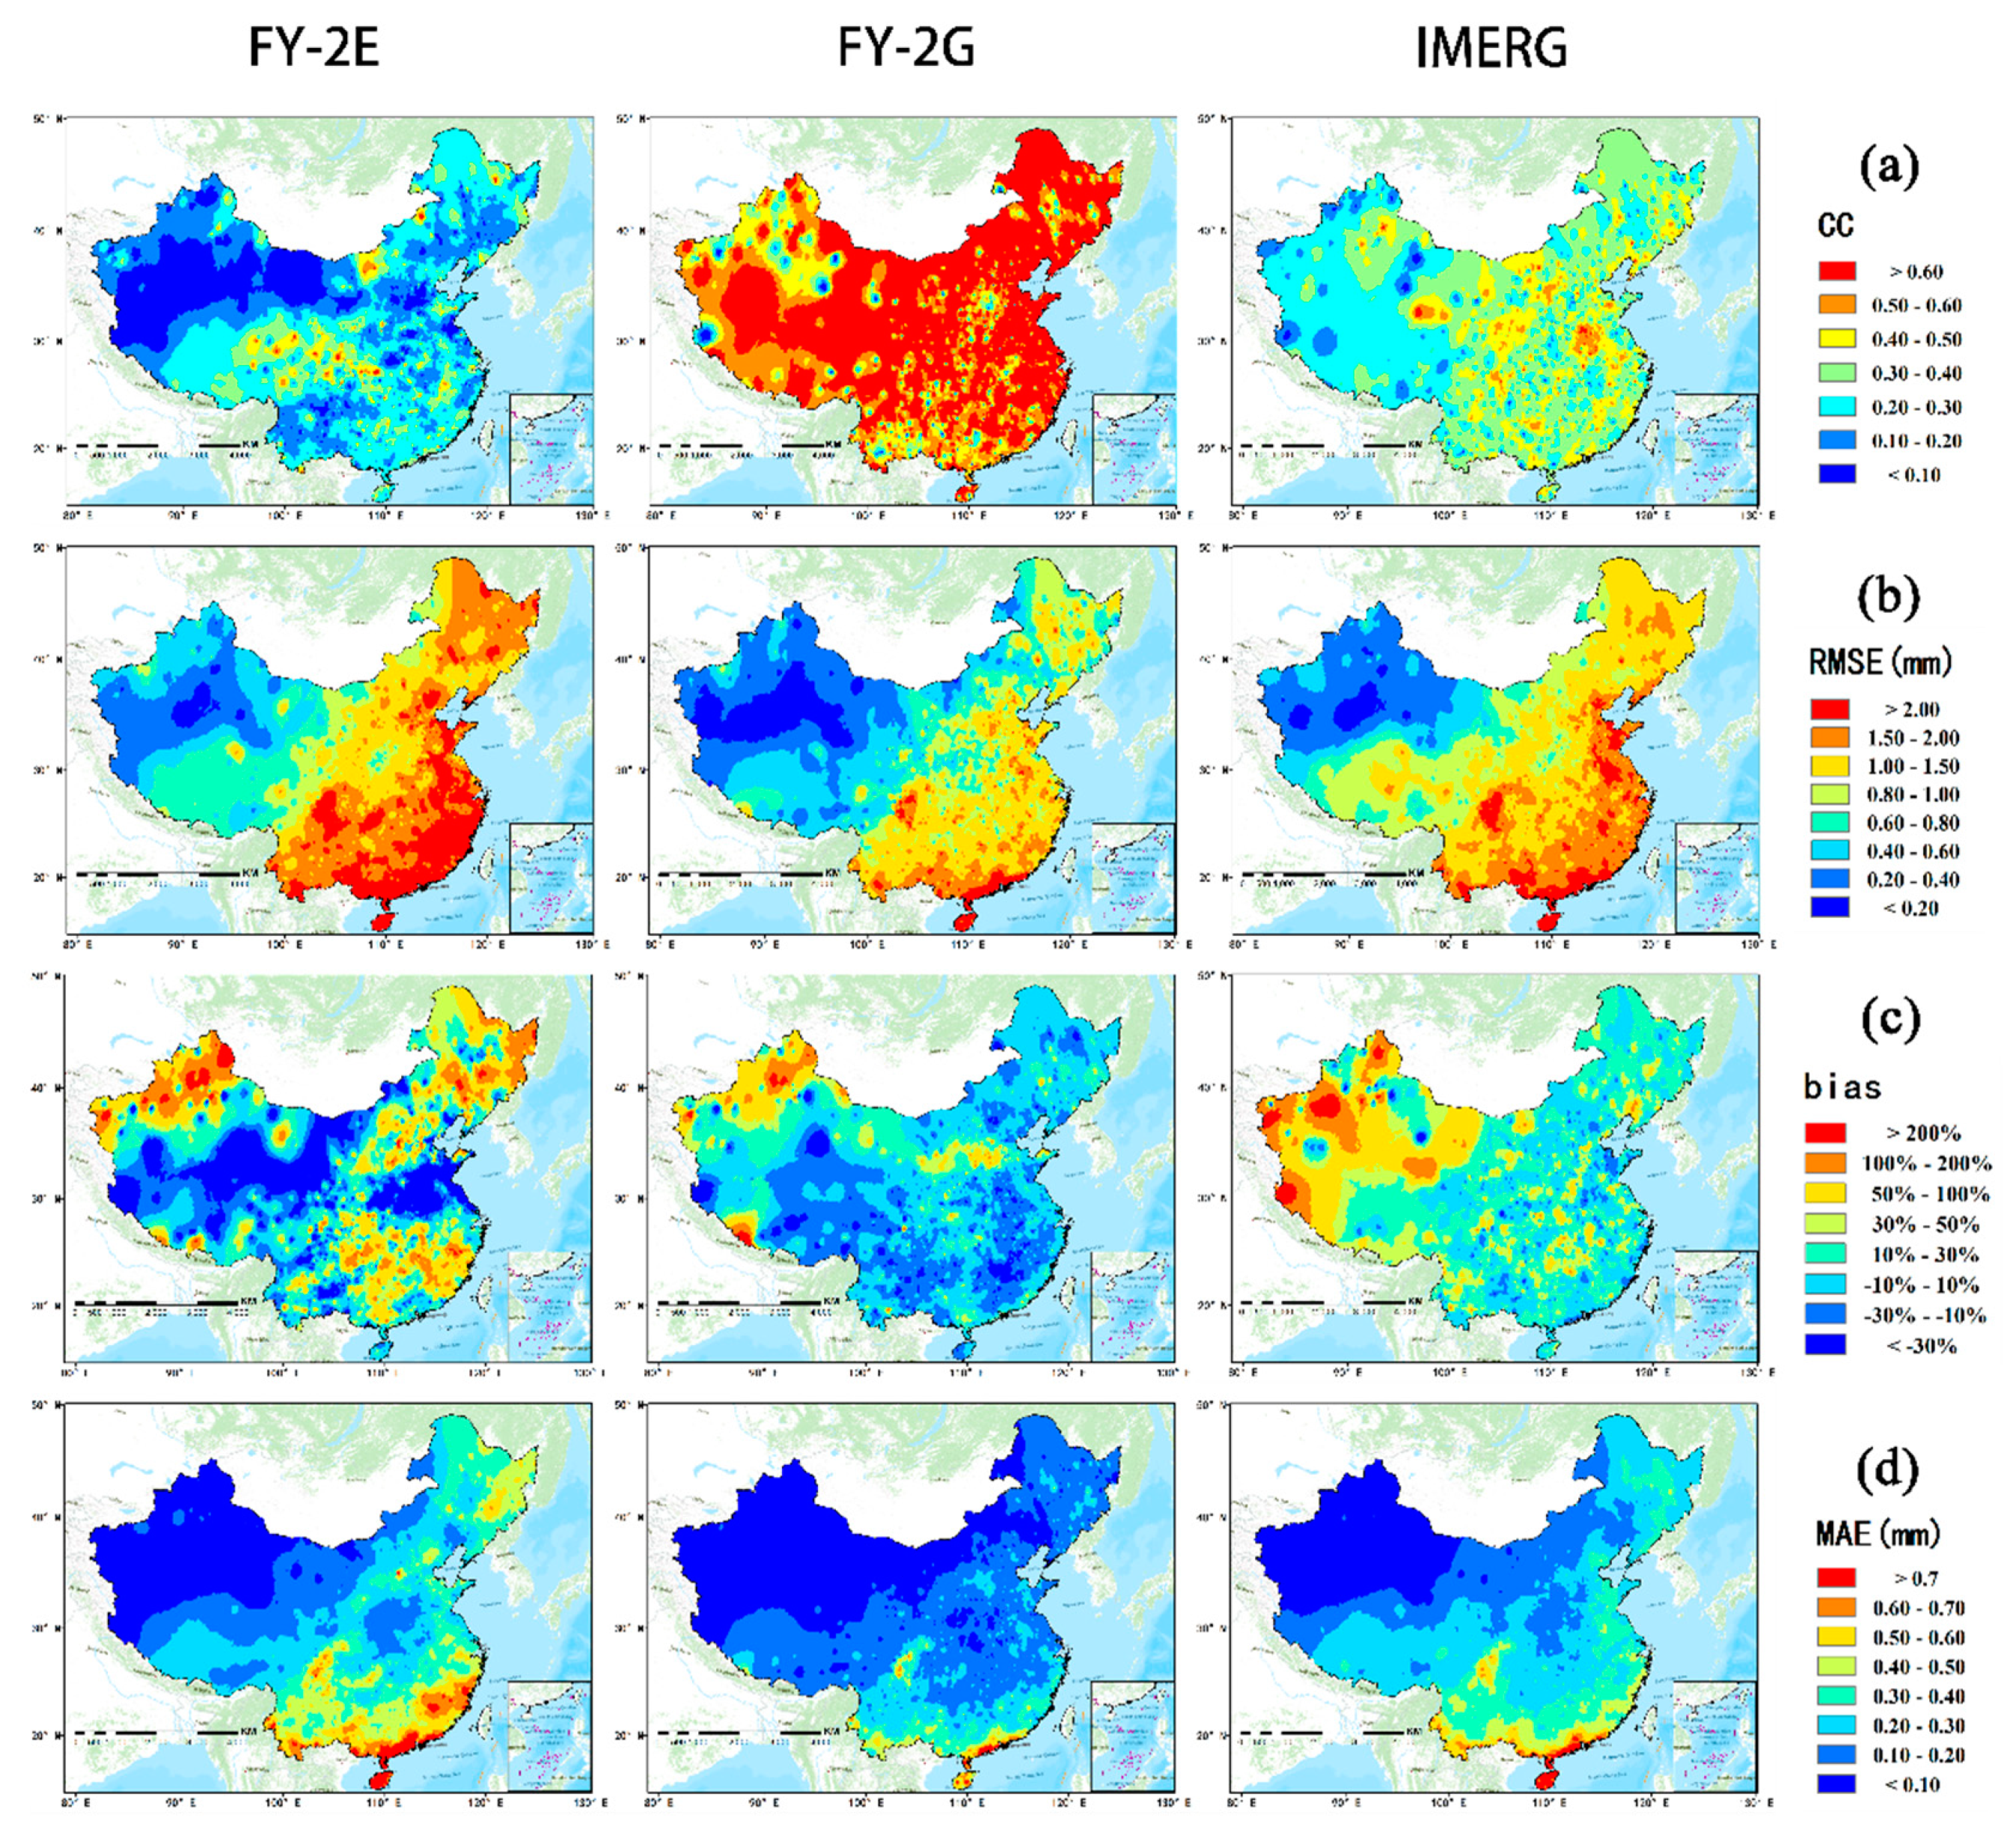
4.1. Spatial Distributions of Precipitation Estimates from FY-2E, FY-2G, and IMERG

The spatial distributions of FY-2E QPE, FY-2G QPE, and IMERG data in the summer of 2018 over mainland China are shown in Figure 2b–d, respectively, while Figure 2a displays the spatial distribution of precipitation obtained by inverse distance weighted (IDW) interpolation based on ground observations. All three satellite-based precipitation products present a distinct decreasing spatial variation of precipitation from the southeast to the northwest, which is consistent with that presented by ground observations. The spatial patterns of FY-2G QPE and IMERG are consistent with the patterns of interpolated results based on rain gauge data. However, both FY-2E and FY-2G products show an absence of data over the Tibetan Plateau and Qaidam Basin in northwest China. Moreover, both products do not provide precipitation estimates over northern parts of Heilongjiang Province, China, which exceed the extent of 50°N. Conversely, IMERG products provide full coverage precipitation estimates over mainland China.

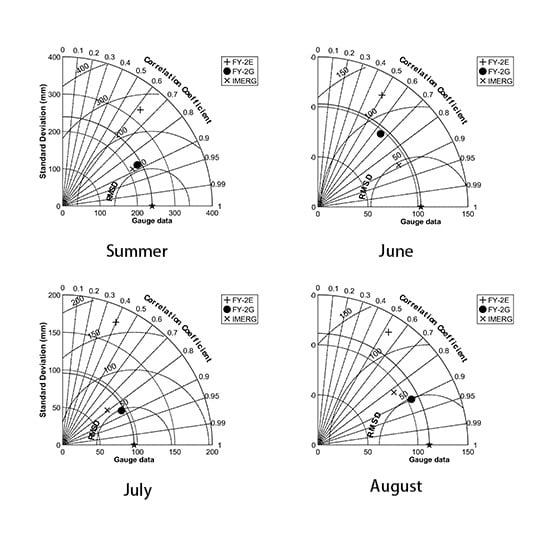
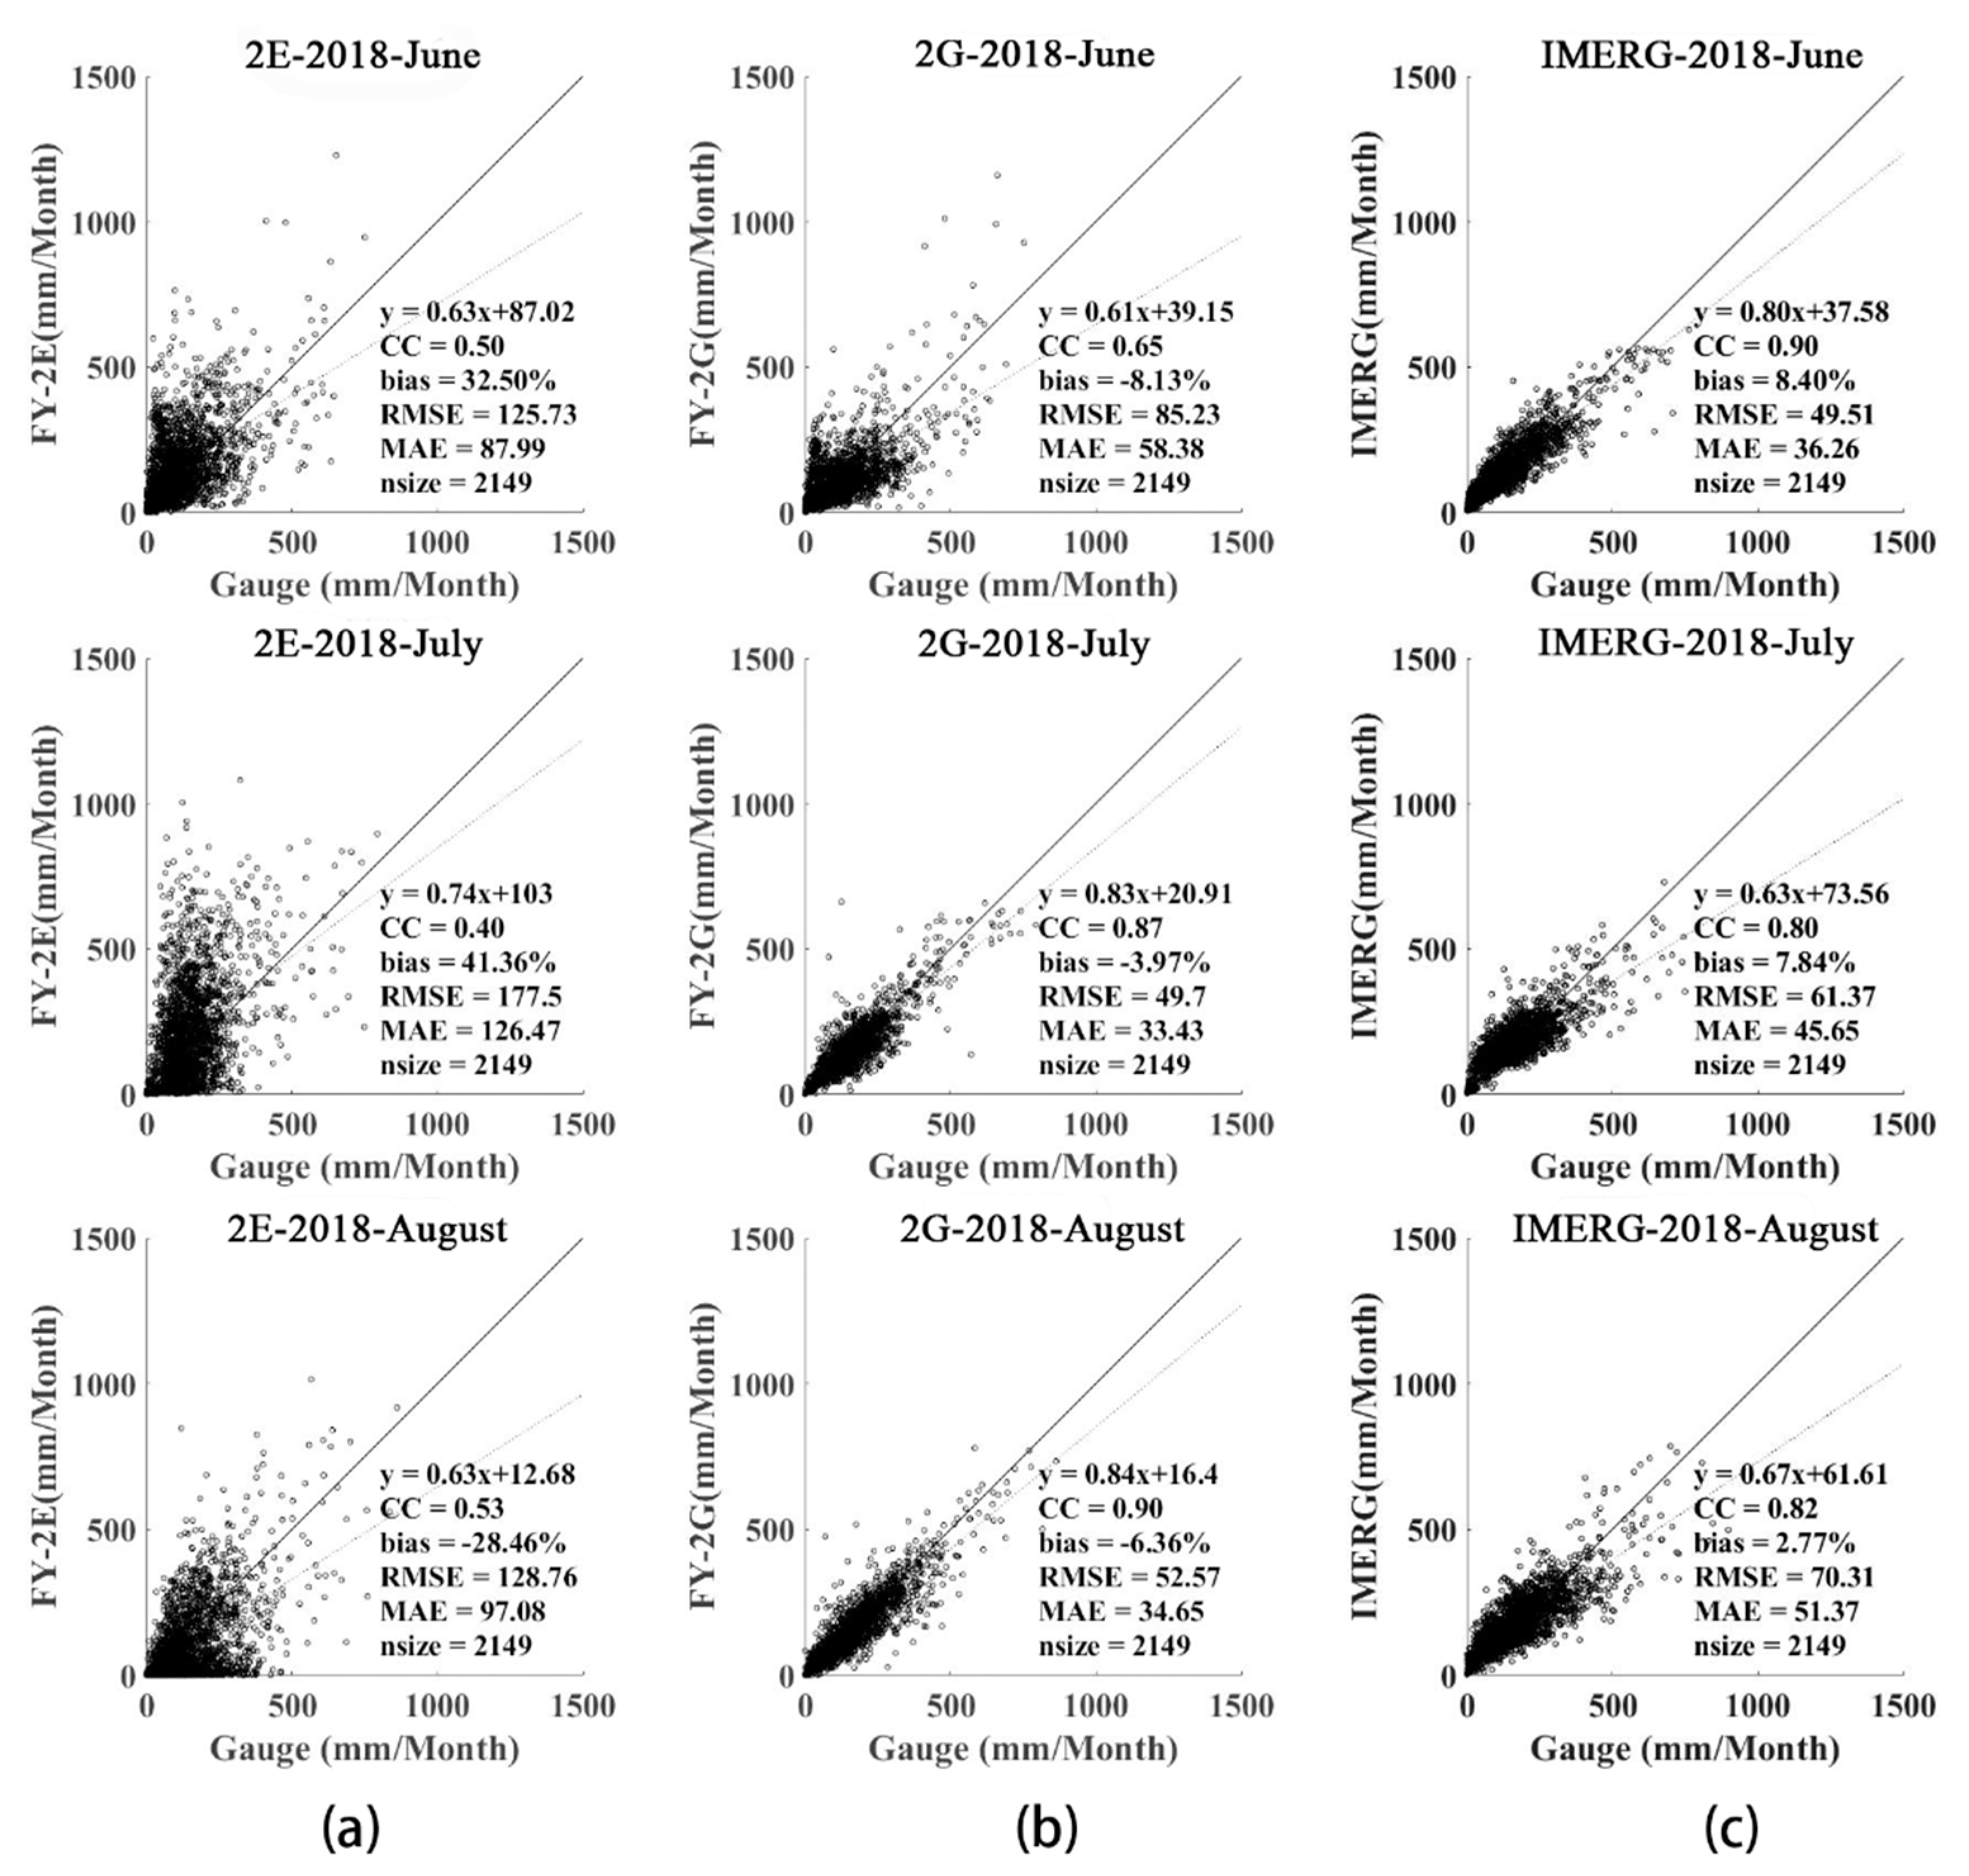
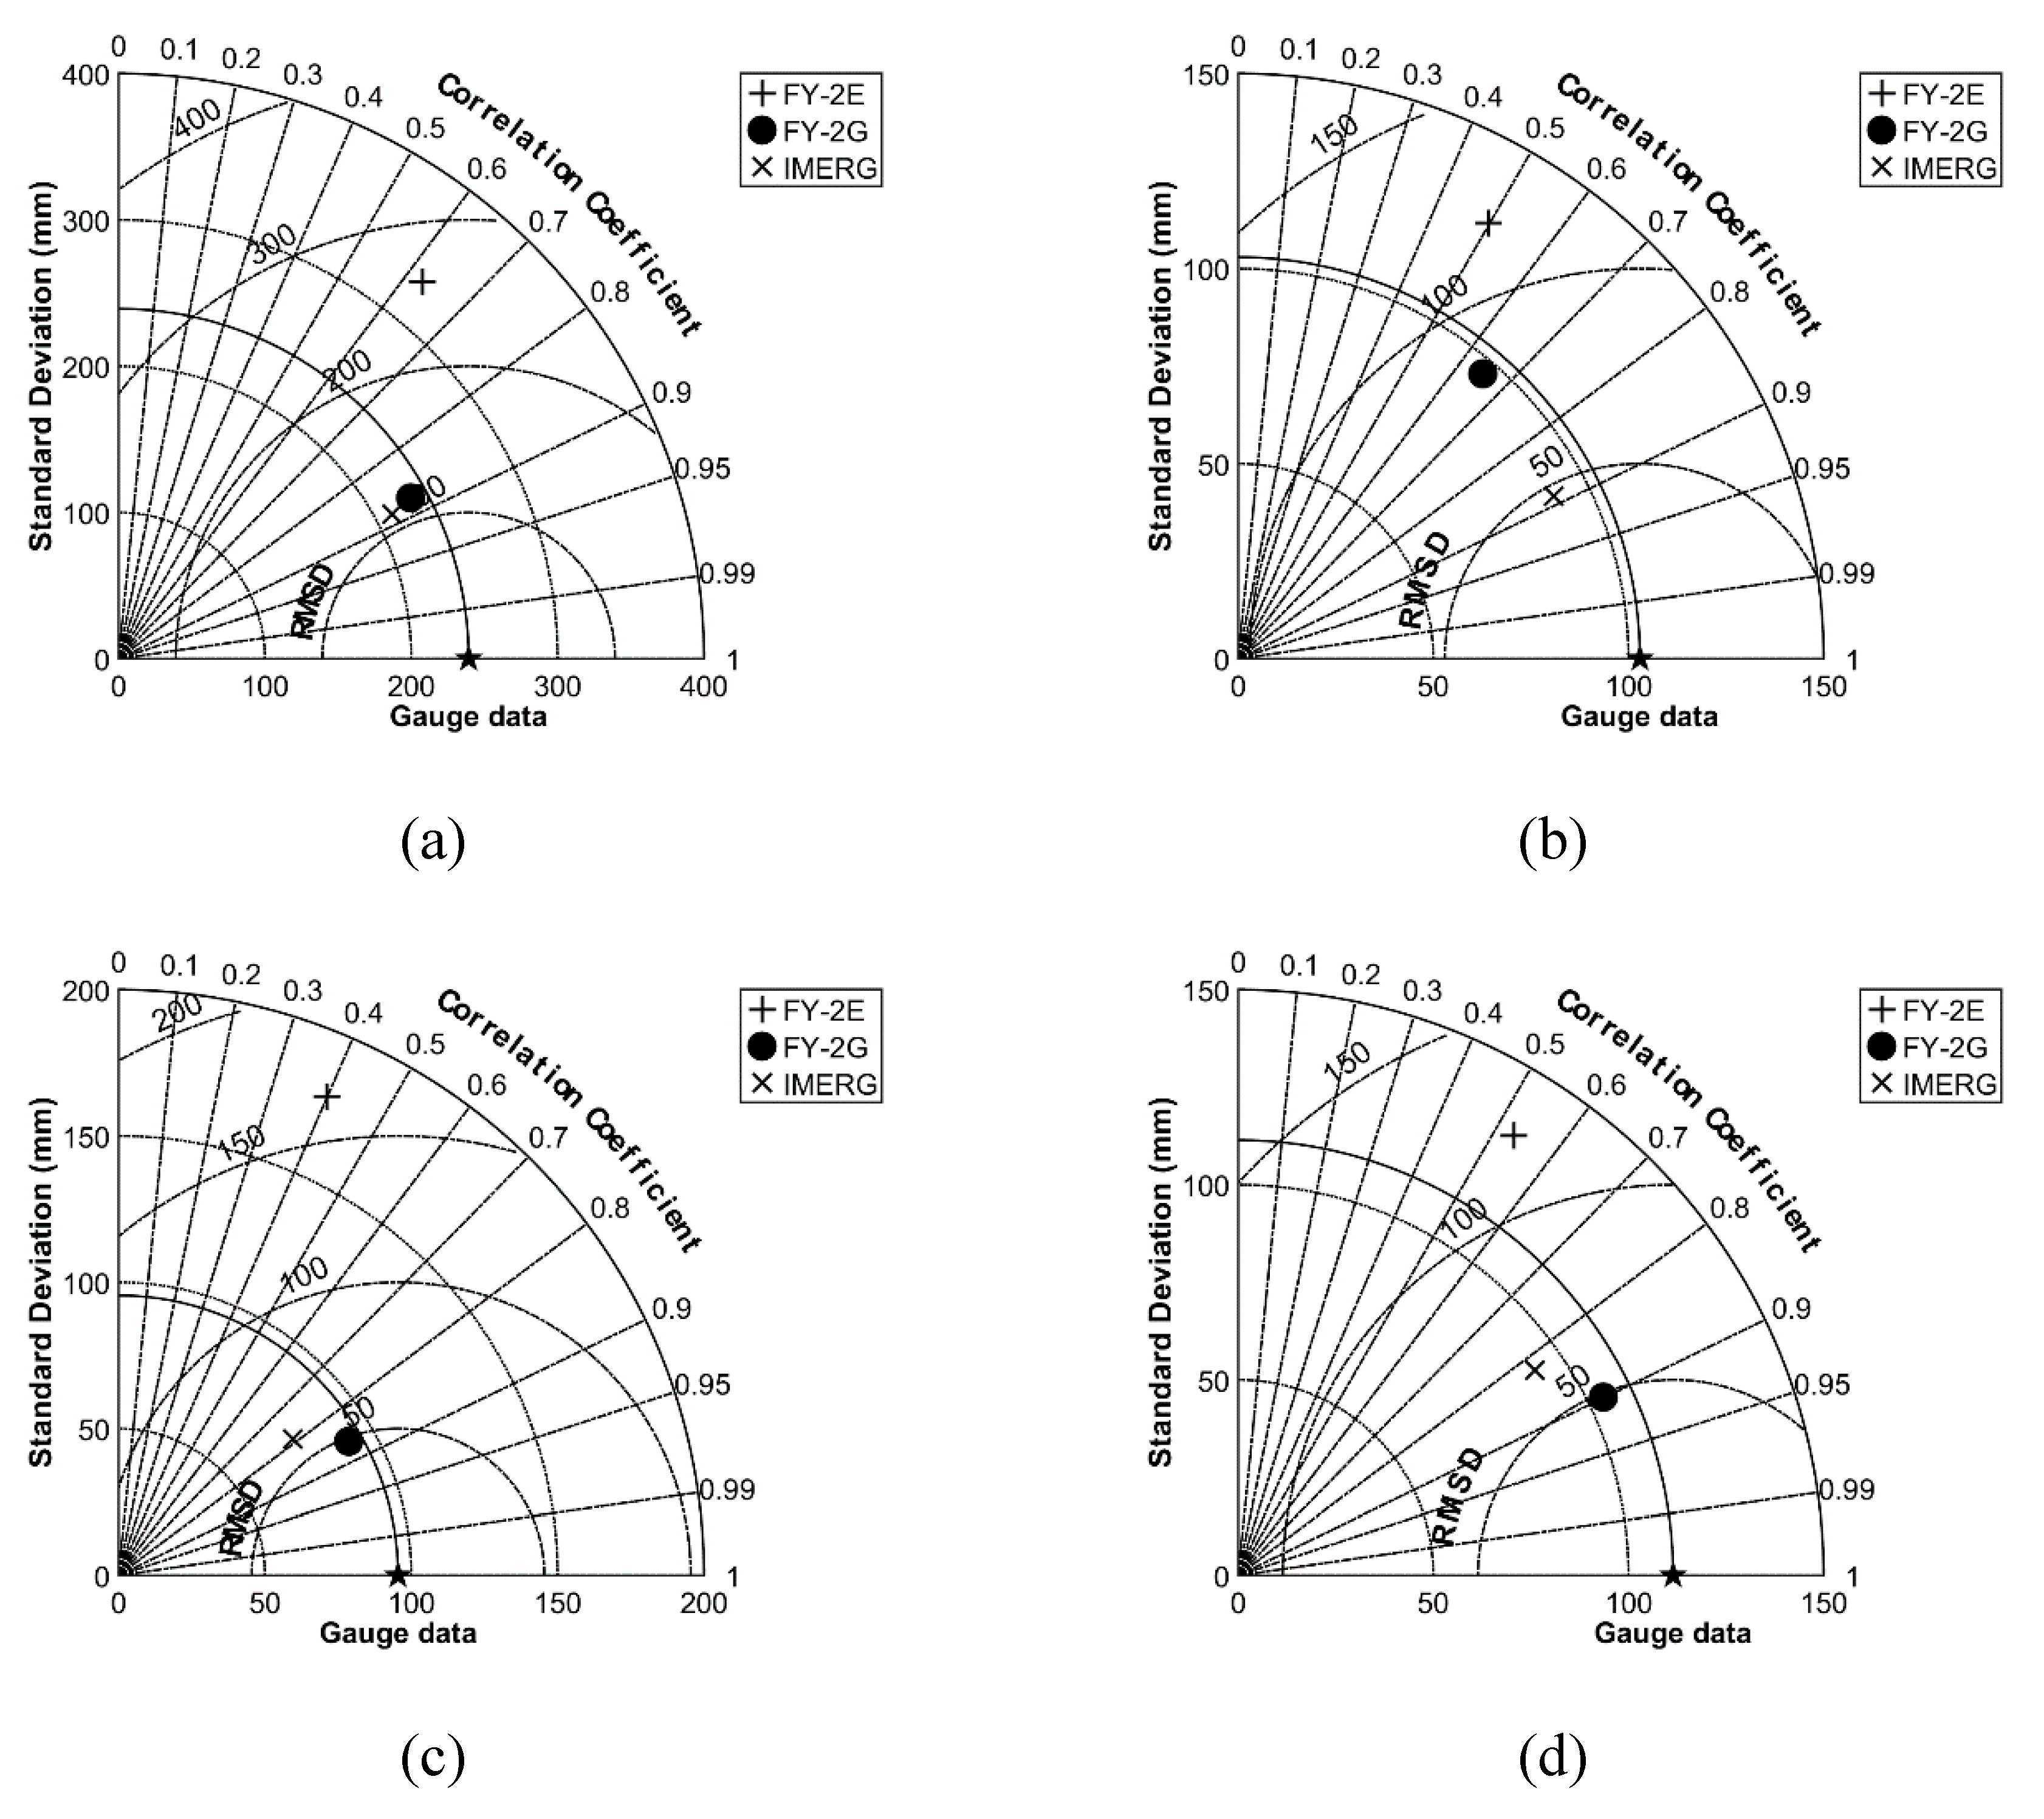
4.2. Validations of the Three Precipitation Products in the Summer, 2018

To evaluate the performances of FY-2E, FY-2G, and IMERG products, the three satellite-based precipitation products were validated separately against rain gauge data. Figure 3a–c show the validation results of FY-2E, FY-2G, and IMERG against ground observations in June (first row), July (second row), and August (third row) 2018, respectively. In general, according to the validation results, FY-2G QPE and IMERG outperform FY-2E QPE at monthly scale, with a CC of 0.65, 0.87, and 0.90 (0.90, 0.80, and 0.82) and bias of −8.13%, −3.97%, and −6.36% (8.40%, 7.84%, and 2.77%), in June, July, and August, respectively. In terms of RMSE and MAE, the results of FY-2G QPE are also lower than those of FY-2E QPE and IMERG for the entire summer of 2018, except for the worse performance compared with IMERG in June. In addition, IMERG shows small degrees of overestimation (bias of less than 10%). On the contrary, FY-2E QPE shows significant overestimation compared with ground observations, with bias of more than 30% in June and July, while FY-2G QPE also underestimated precipitation, but to a lesser degree (bias of more than −10%), for the entire summer of 2018.
Figure 4a–d show Taylor diagrams of the performances of FY-2E QPE, FY-2G QPE, and IMERG against gauge precipitation measurements, in summer, June, July, and August, respectively. Taylor diagrams provide a graphical way to comprehensively evaluate the similarities between sets of patterns and observations [32]. Three classical indicators, namely, the CC, centered root-mean-square difference (CRMSD), and standard deviation (STD), are presented in a single 2D diagram, which reflect how closely the various patterns in satellite-based precipitation products match those in ground observations. If the estimated pattern is closer to the observations than other patterns in the diagram, then it means that the accuracy of the estimates is better than those of others. Taylor diagrams can convey more information more clearly than an ordinary table. They are useful because the strengths and weaknesses of the three statistical indexes are shown in the same diagram, and are thus less ambiguous [33,34].
We can conclude from the Taylor diagrams that the precipitation patterns of FY-2G QPE are the most similar to those of ground observations, since FY-2G QPE exhibits the best performances, with an RMSD value of around 48.63 mm and CC value of around 0.87 in July (Figure 4c), and an RMSD value of around 48.94 mm and CC value of around 0.90 in August (Figure 4d). In June, IMERG has the best similarity to ground observations, with RMSD and CC values of around 48.12 mm and 0.89, respectively (Figure 4b). Meanwhile, FY-2E QPE displays the largest values of RMSD, meaning that it has the lowest similarity to ground observations in all the four periods.

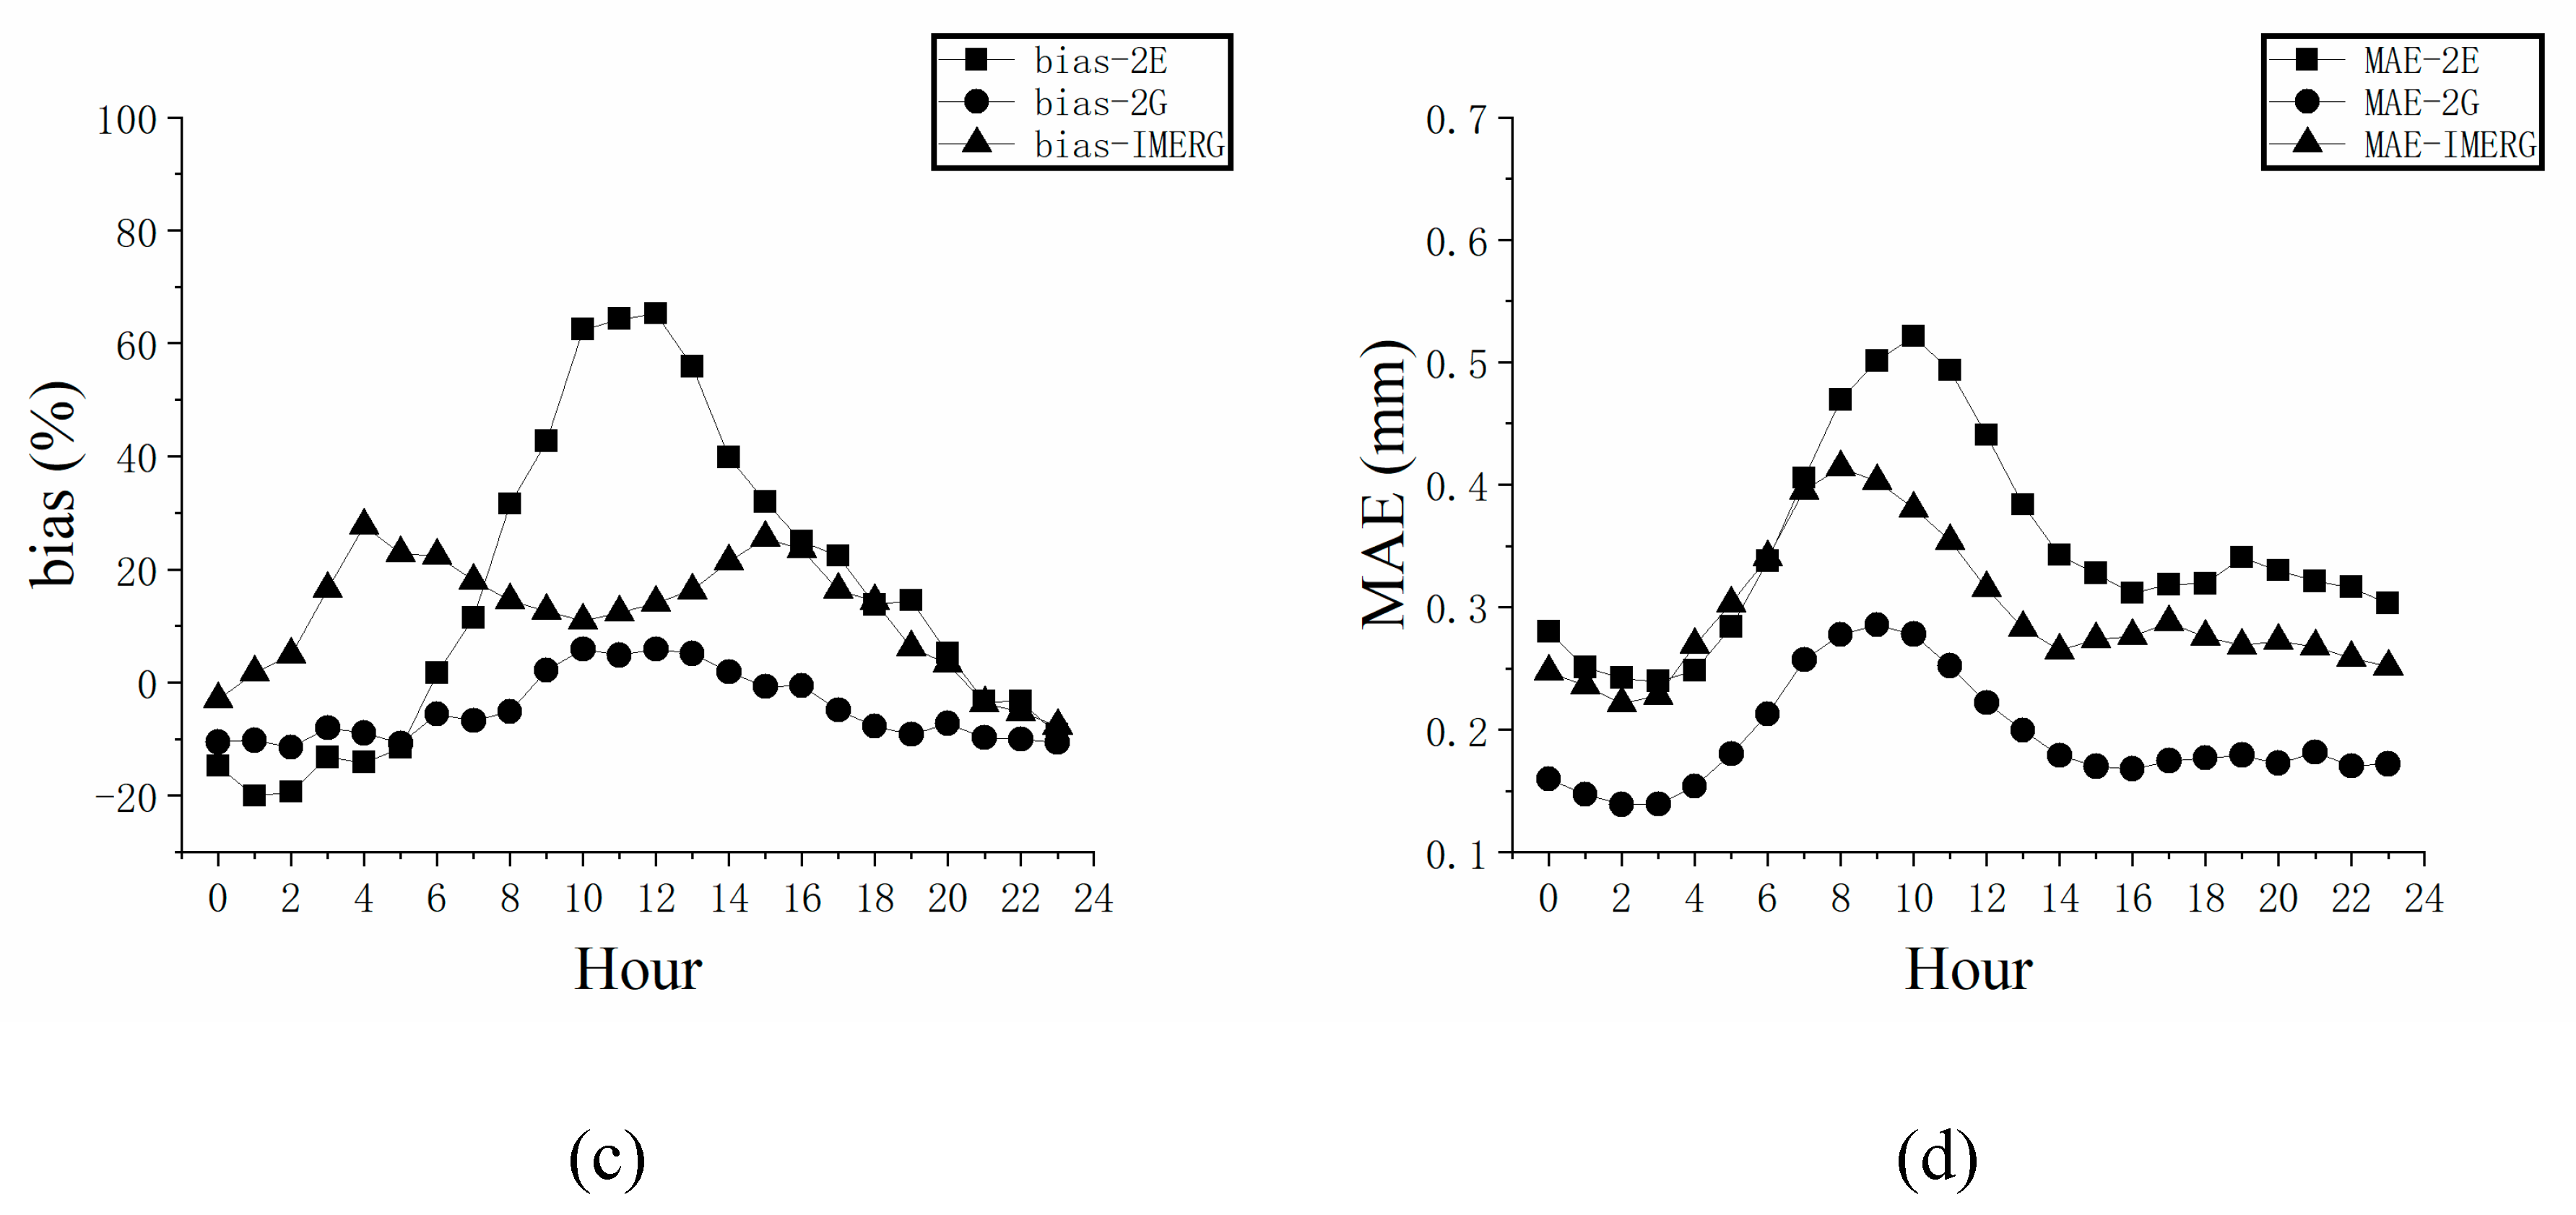
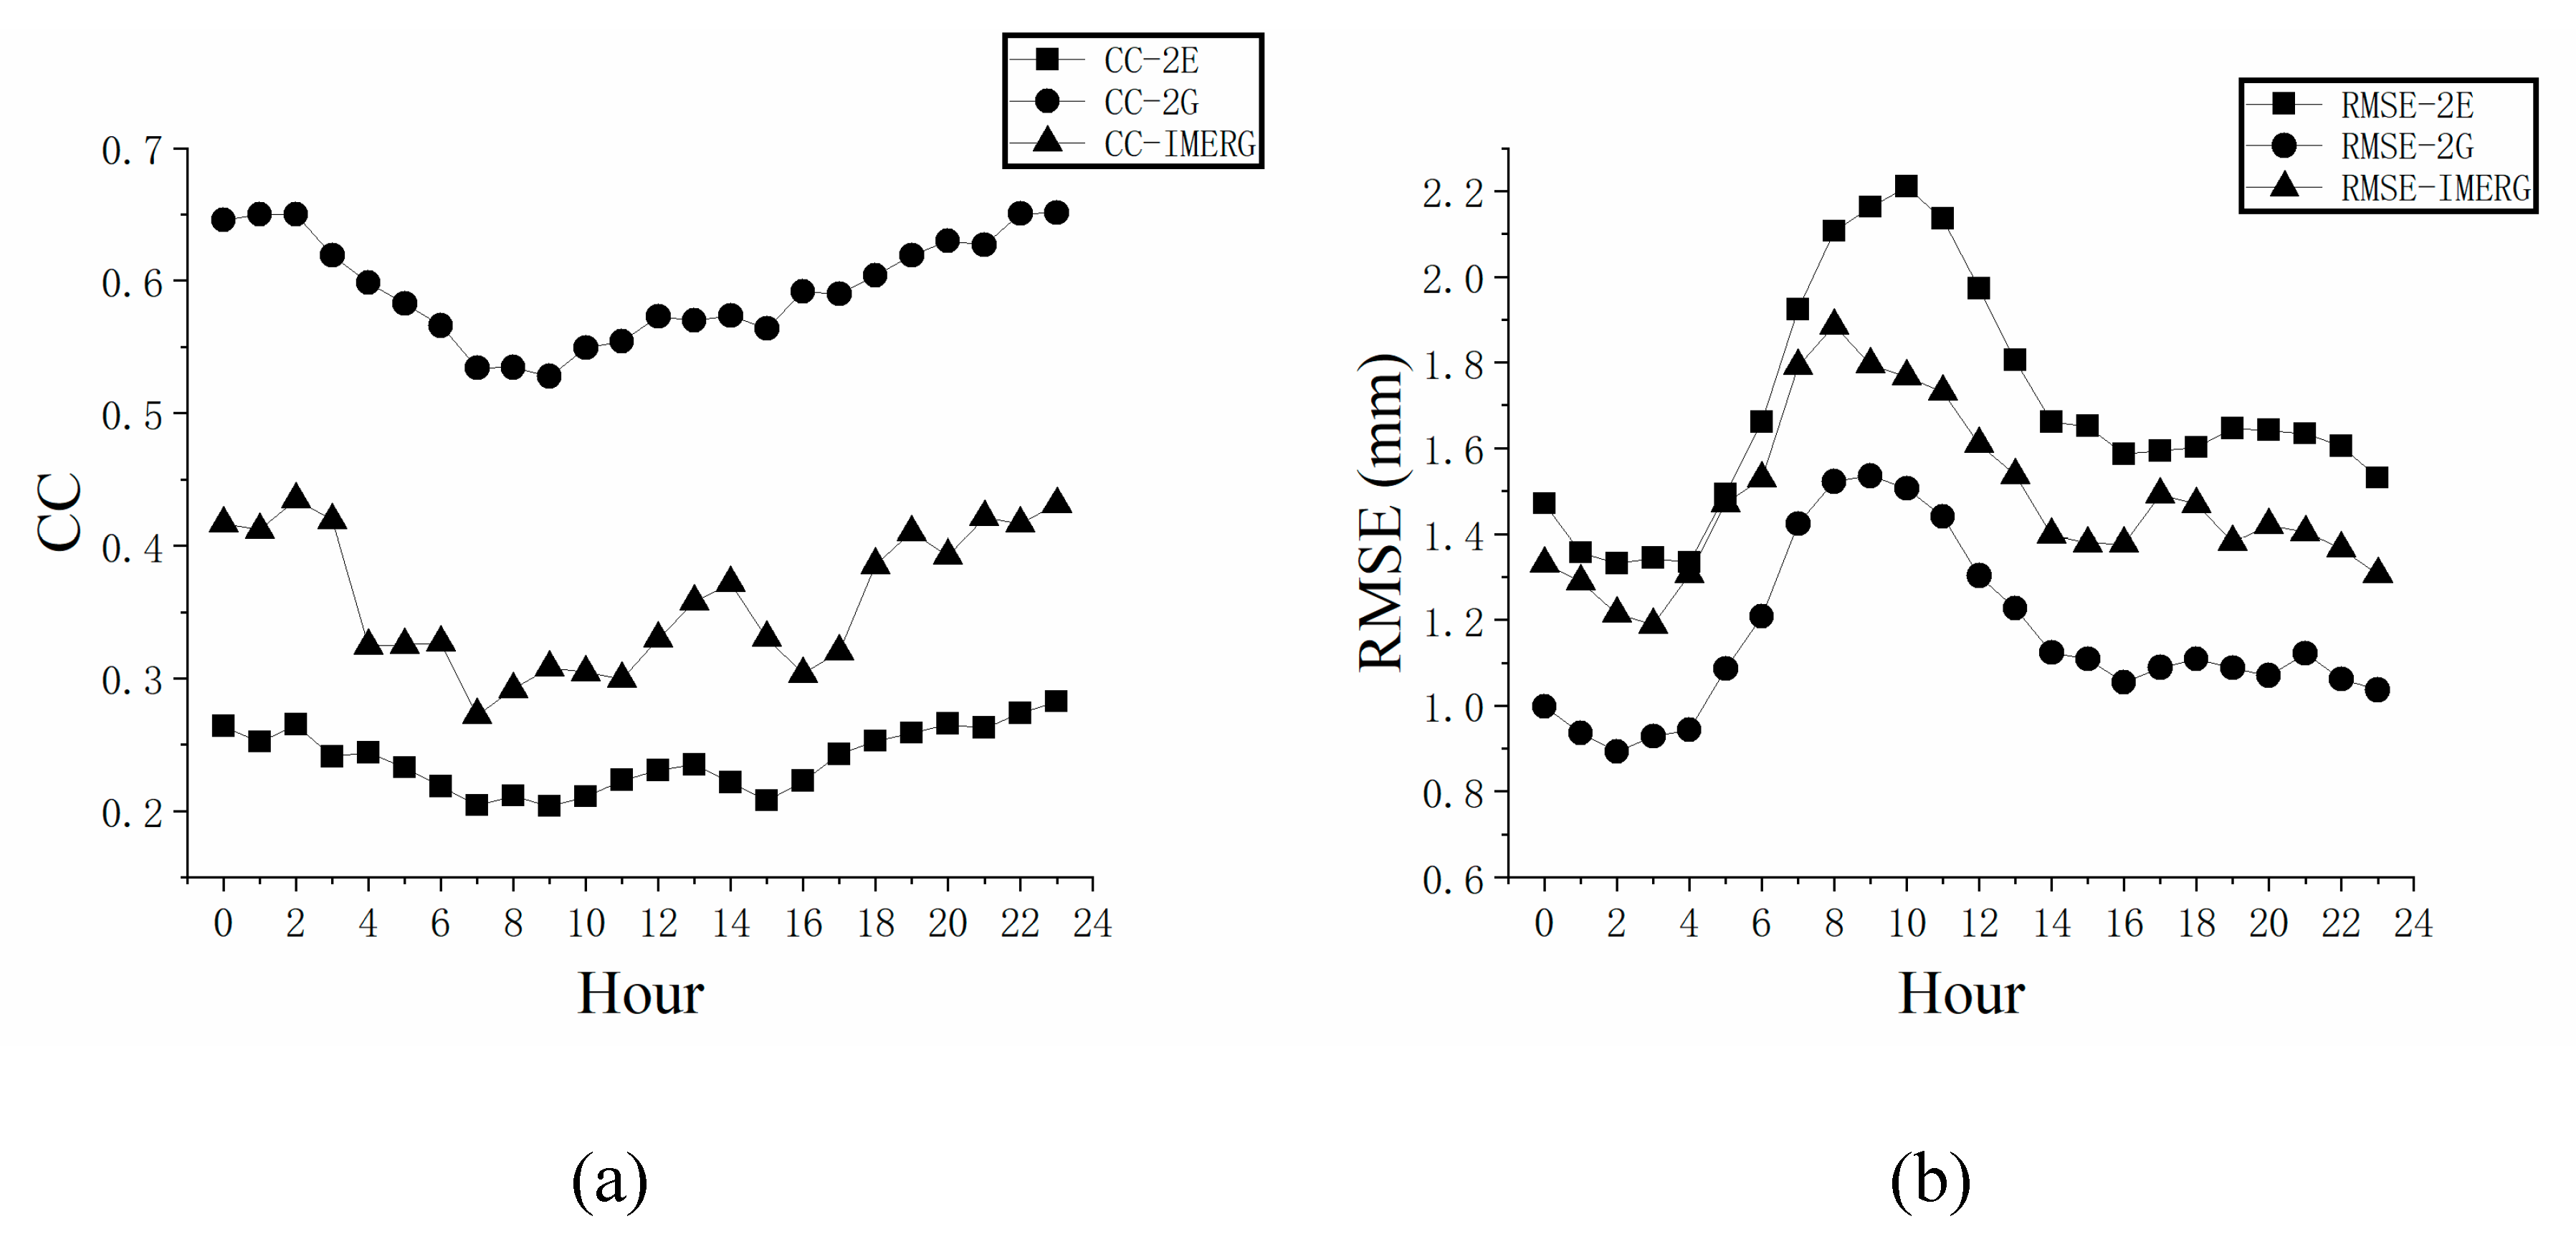
4.3. Validations of the Three Precipitation Products Based on Statistical Indices at Hourly Scale

Figure 5a–d illustrate the spatial patterns of CC, RMSE, bias, and MAE of FY-2E QPE (first column), FY-2G QPE (second column), and IMERG (third column), respectively, against ground observations at hourly scale, over mainland China in summer, 2018. It is obvious that FY-2G QPE outperforms FY-2E QPE and IMERG, with the best spatial patterns and numerical ranges of all the four indices, while IMERG performs better than FY-2E QPE. The CC of FY-2E QPE in mainland China is generally lower than 0.3, while the CC values of IMERG vary from 0 to 0.5, and are rarely larger than 0.5. Among the IMERG data, the best performing CC values are mainly distributed in the middle part of mainland China. As for FY-2G QPE, the CC values are larger than 0.6 over more than half of the area of China, especially in the eastern and central parts of mainland China. All three satellite-based precipitation products perform poorly in the southern and northwestern provinces of China. In terms of bias, FY-2G QPE also has the best performance, with the lowest bias over the majority of mainland China. The bias values of IMERG are greater than 10% over half of mainland China, especially in northwestern China, where the bias values are generally more than 50%.
Averaged values of the four statistical indices of the three products at hourly scale in June, July, August, and summer are displayed in Table 3. FY-2G QPE has the largest values of CC of 0.45, 0.66, 0.66, and 0.59 in June, July, August, and summer, respectively. The averaged RMSE and MAE values of all the three products are nearly smaller than 1.80 and 0.40 mm, respectively. IMERG shows overestimation in June (14.59%), July (11.34%), and August (10.07%), while FY-2G QPE underestimates the precipitation in all three months (−7.45% in June, −2.28% in July, and −4.34% in August, respectively). The averaged bias values of FY-2E QPE show significant variation. FY-2E QPE greatly overestimates precipitation in June (35.35%) and July (36.07%), while underestimates precipitation in August (−25.42%).
Figure 6 displays the temporal patterns of performances at hourly scale for the three types of products compared to ground measurements. The statistical indices were calculated by the following steps: firstly, the gauge-based data and satellite-based data were extracted for 24 h; secondly, the statistical indices were calculated for each hour; and finally, the results from all stations across the country were averaged. Generally, both the performances of FY-based and GPM-based precipitation products are poorer during the period from 06:00 to 10:00 Coordinated Universal Time (UTC) than other periods in one day. Specifically, in Figure 6a, CC reaches its highest value during the periods of 00:00–3:00 and 18:00–24:00, and obtains its lowest value at about 09:00 (meant 9:00–10:00 UTC, which is the same as below), during the entire day. At about 15:00–17:00, the CC values of IMERG exhibit a decreasing trend, which does not appear in either FY-2E or FY-2G products. The variation of RMSE is contrary to that of CC, which means that a higher CC value always indicates a lower RMSE value (Figure 6b). It is clear that the RMSE of IMERG at 03:00 is the lowest in the 24-h period, at which time the curves of RMSE for FY-2E QPE and FY-2G QPE are smoother. As for the variations of bias (Figure 6c), FY-2E QPE and IMERG show overestimates (i.e., bias greater than 0%) in most of the periods, while FY-2G QPE generally underestimates precipitation for the entire day. Regarding the variations in MAE (Figure 6d), all three precipitation products show similar trends.

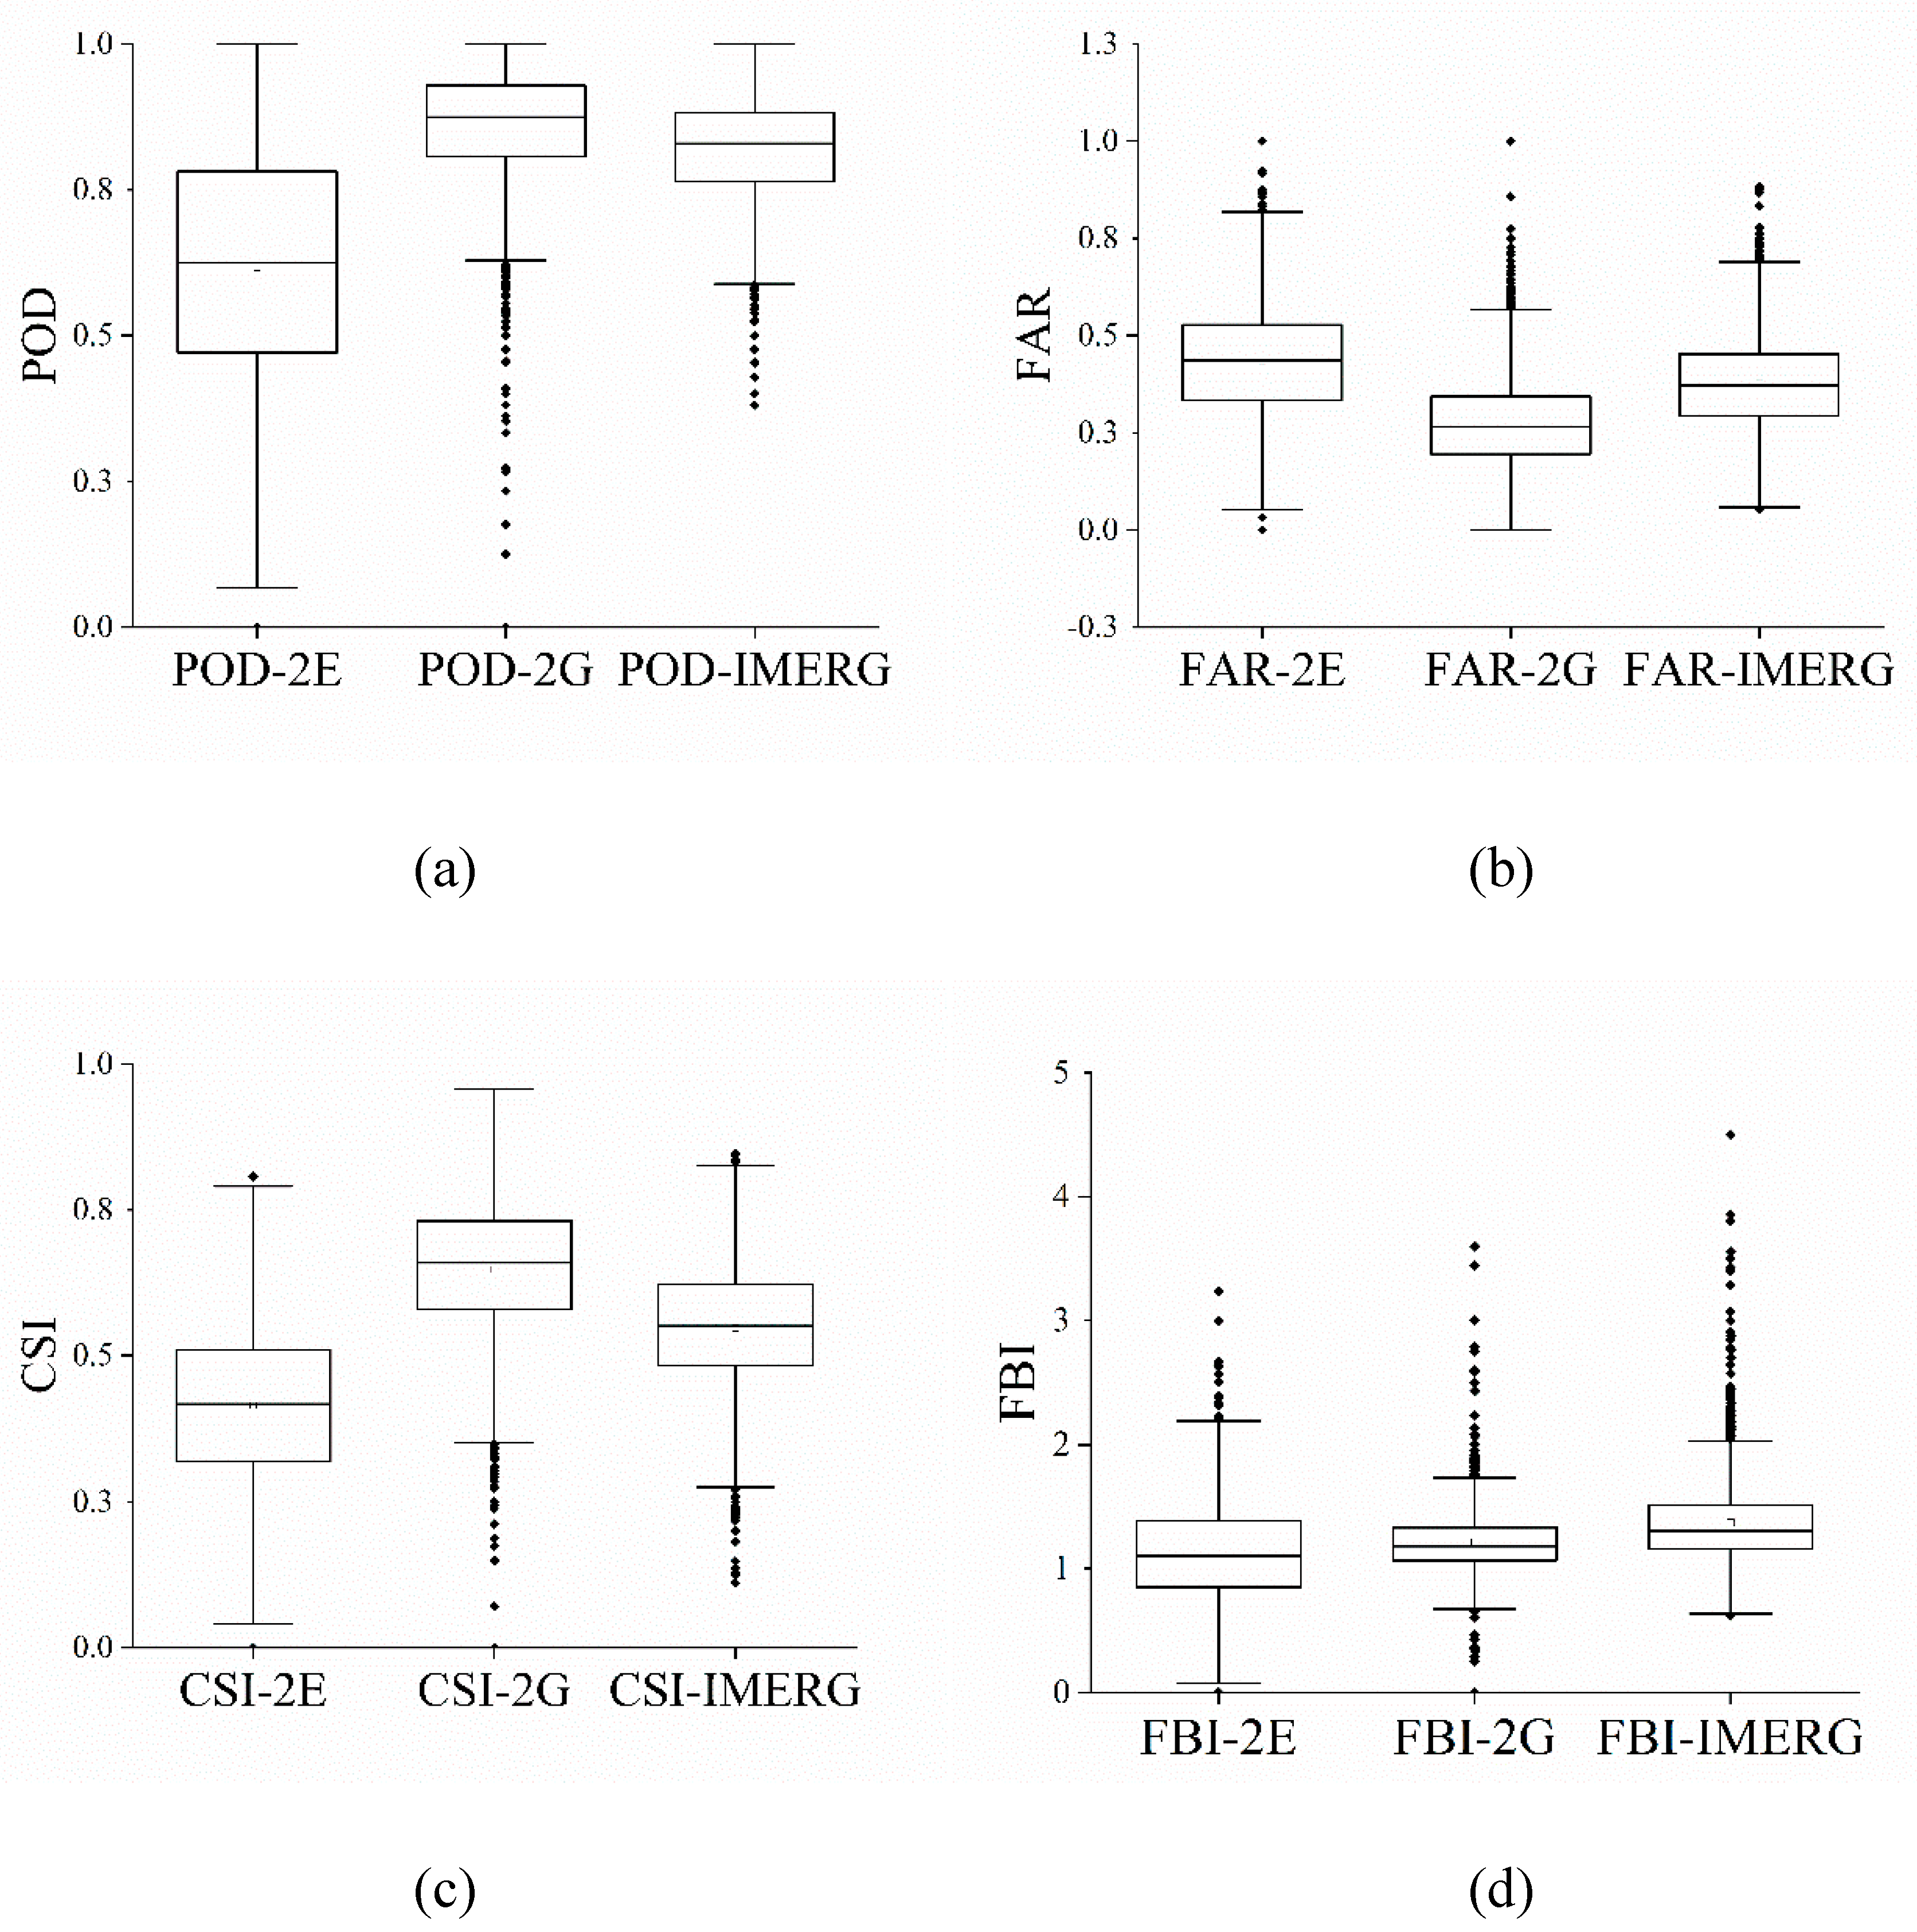
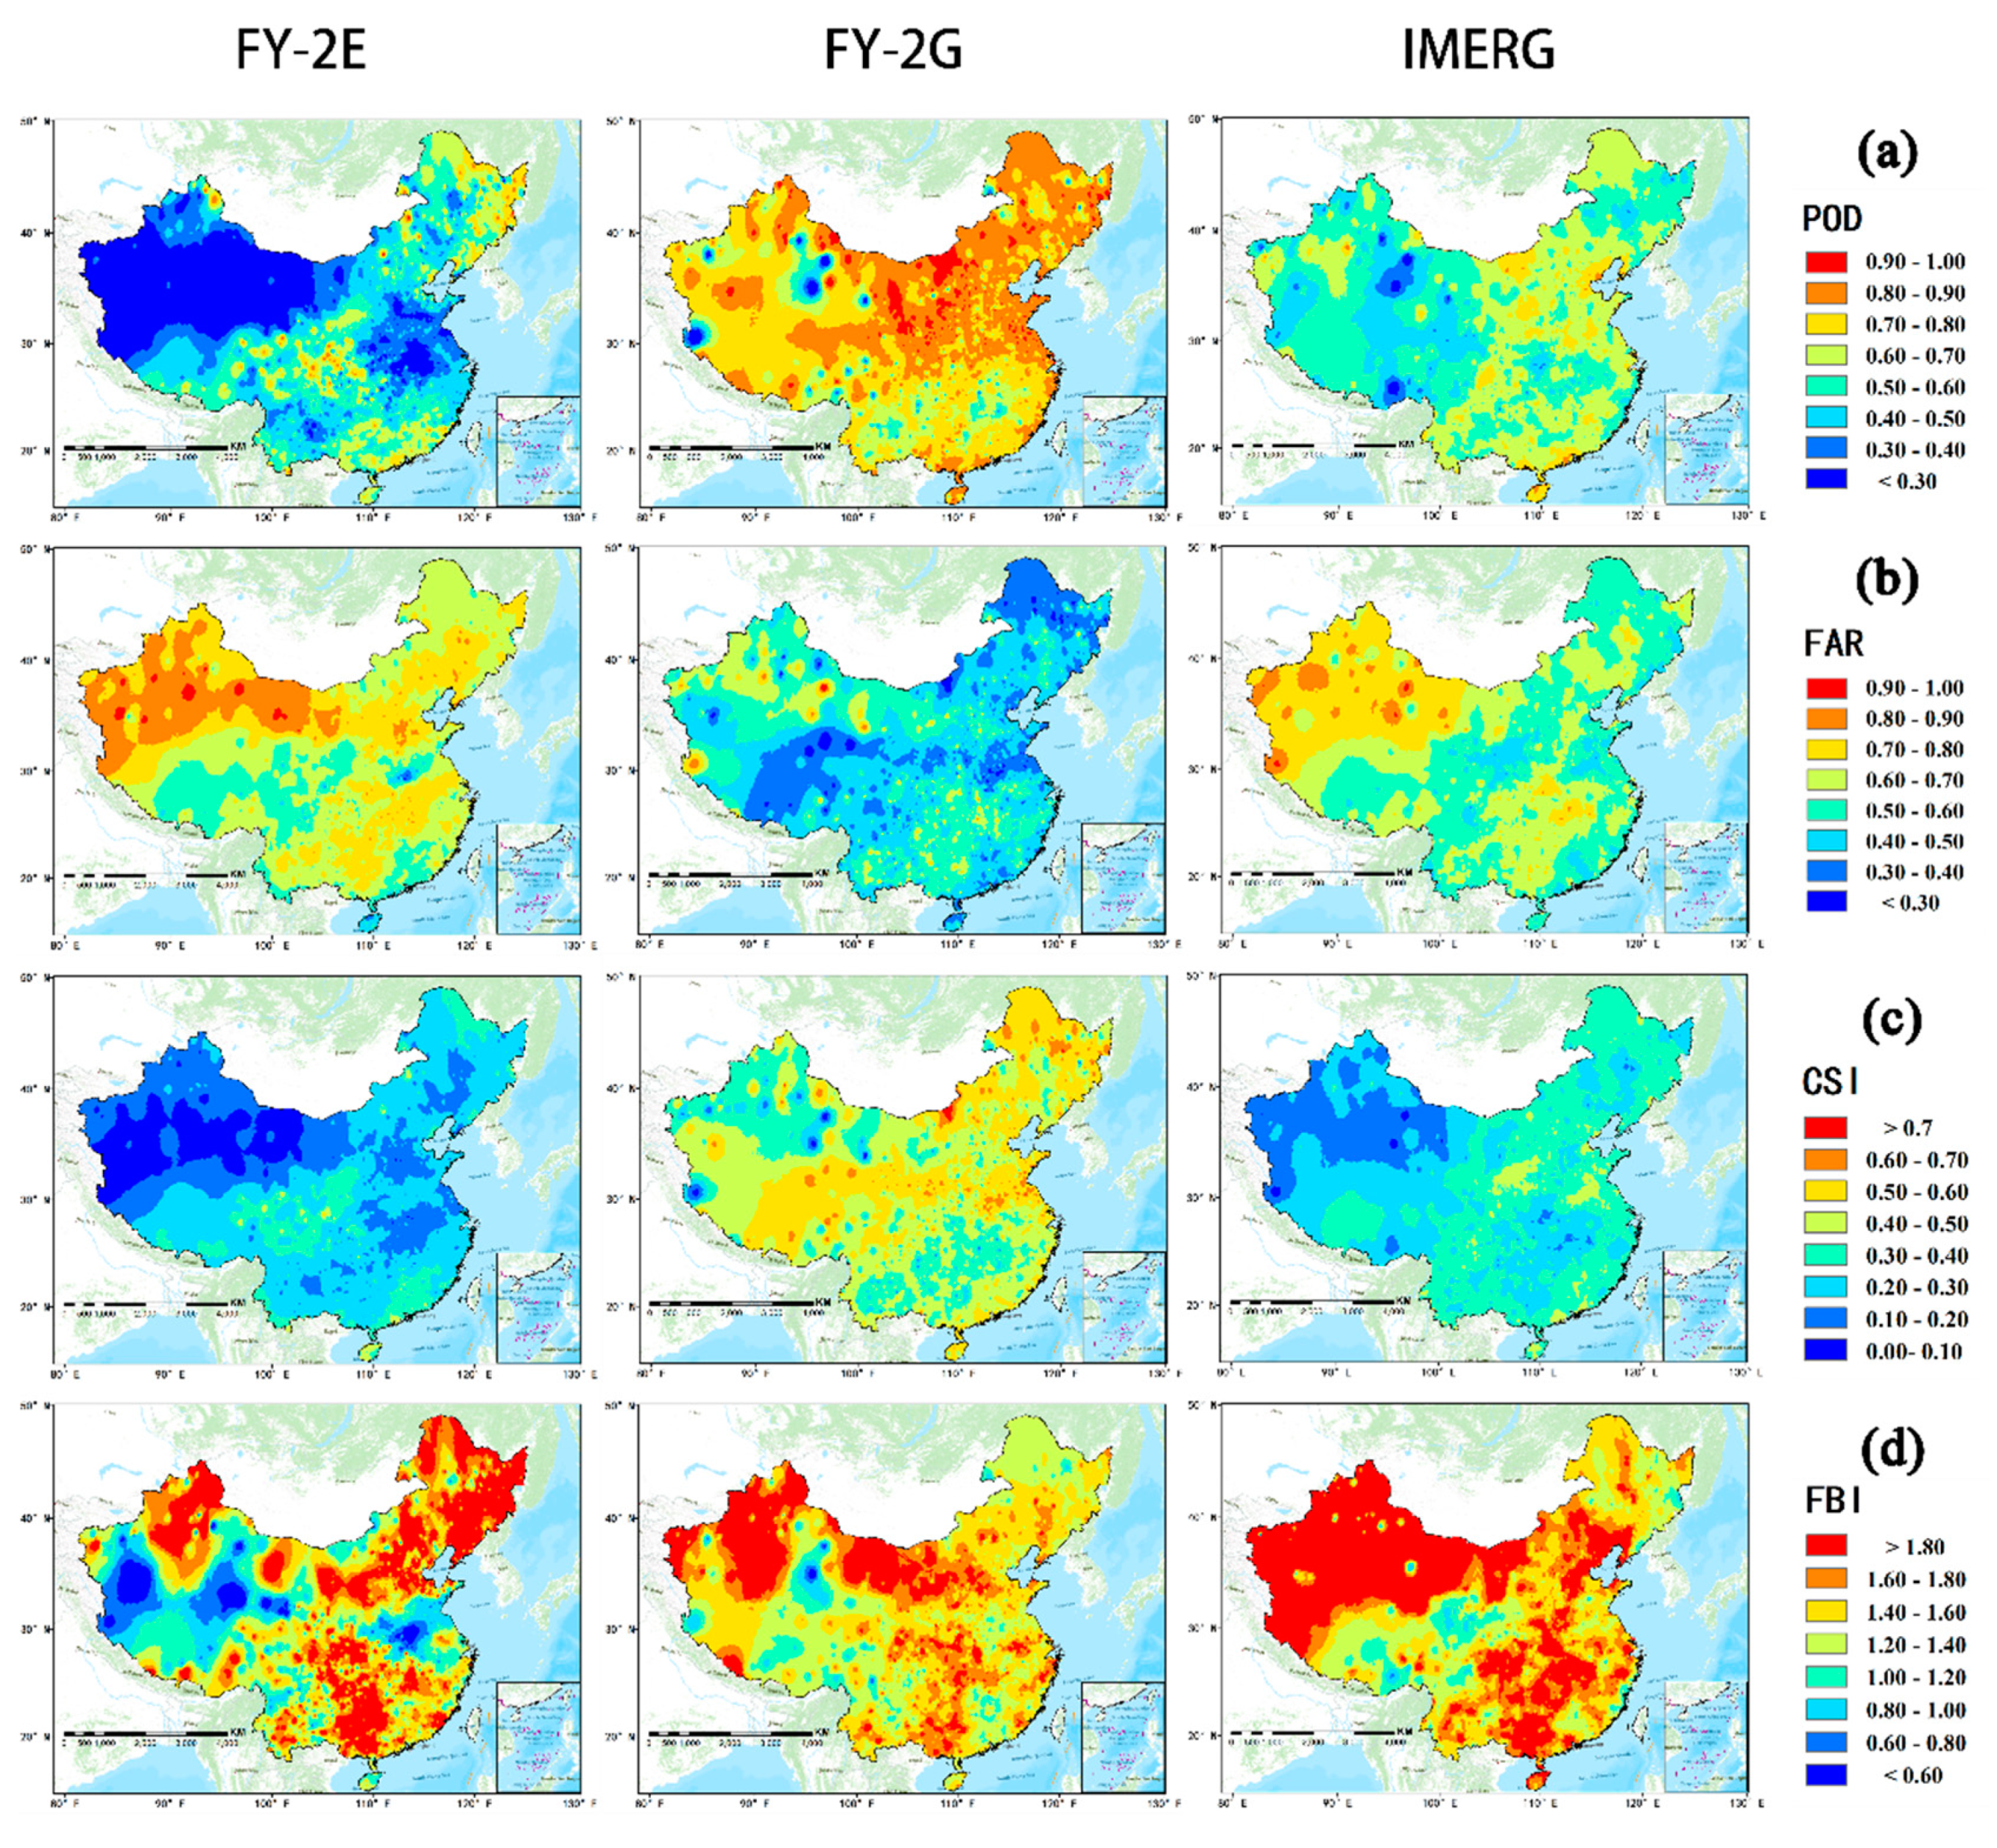
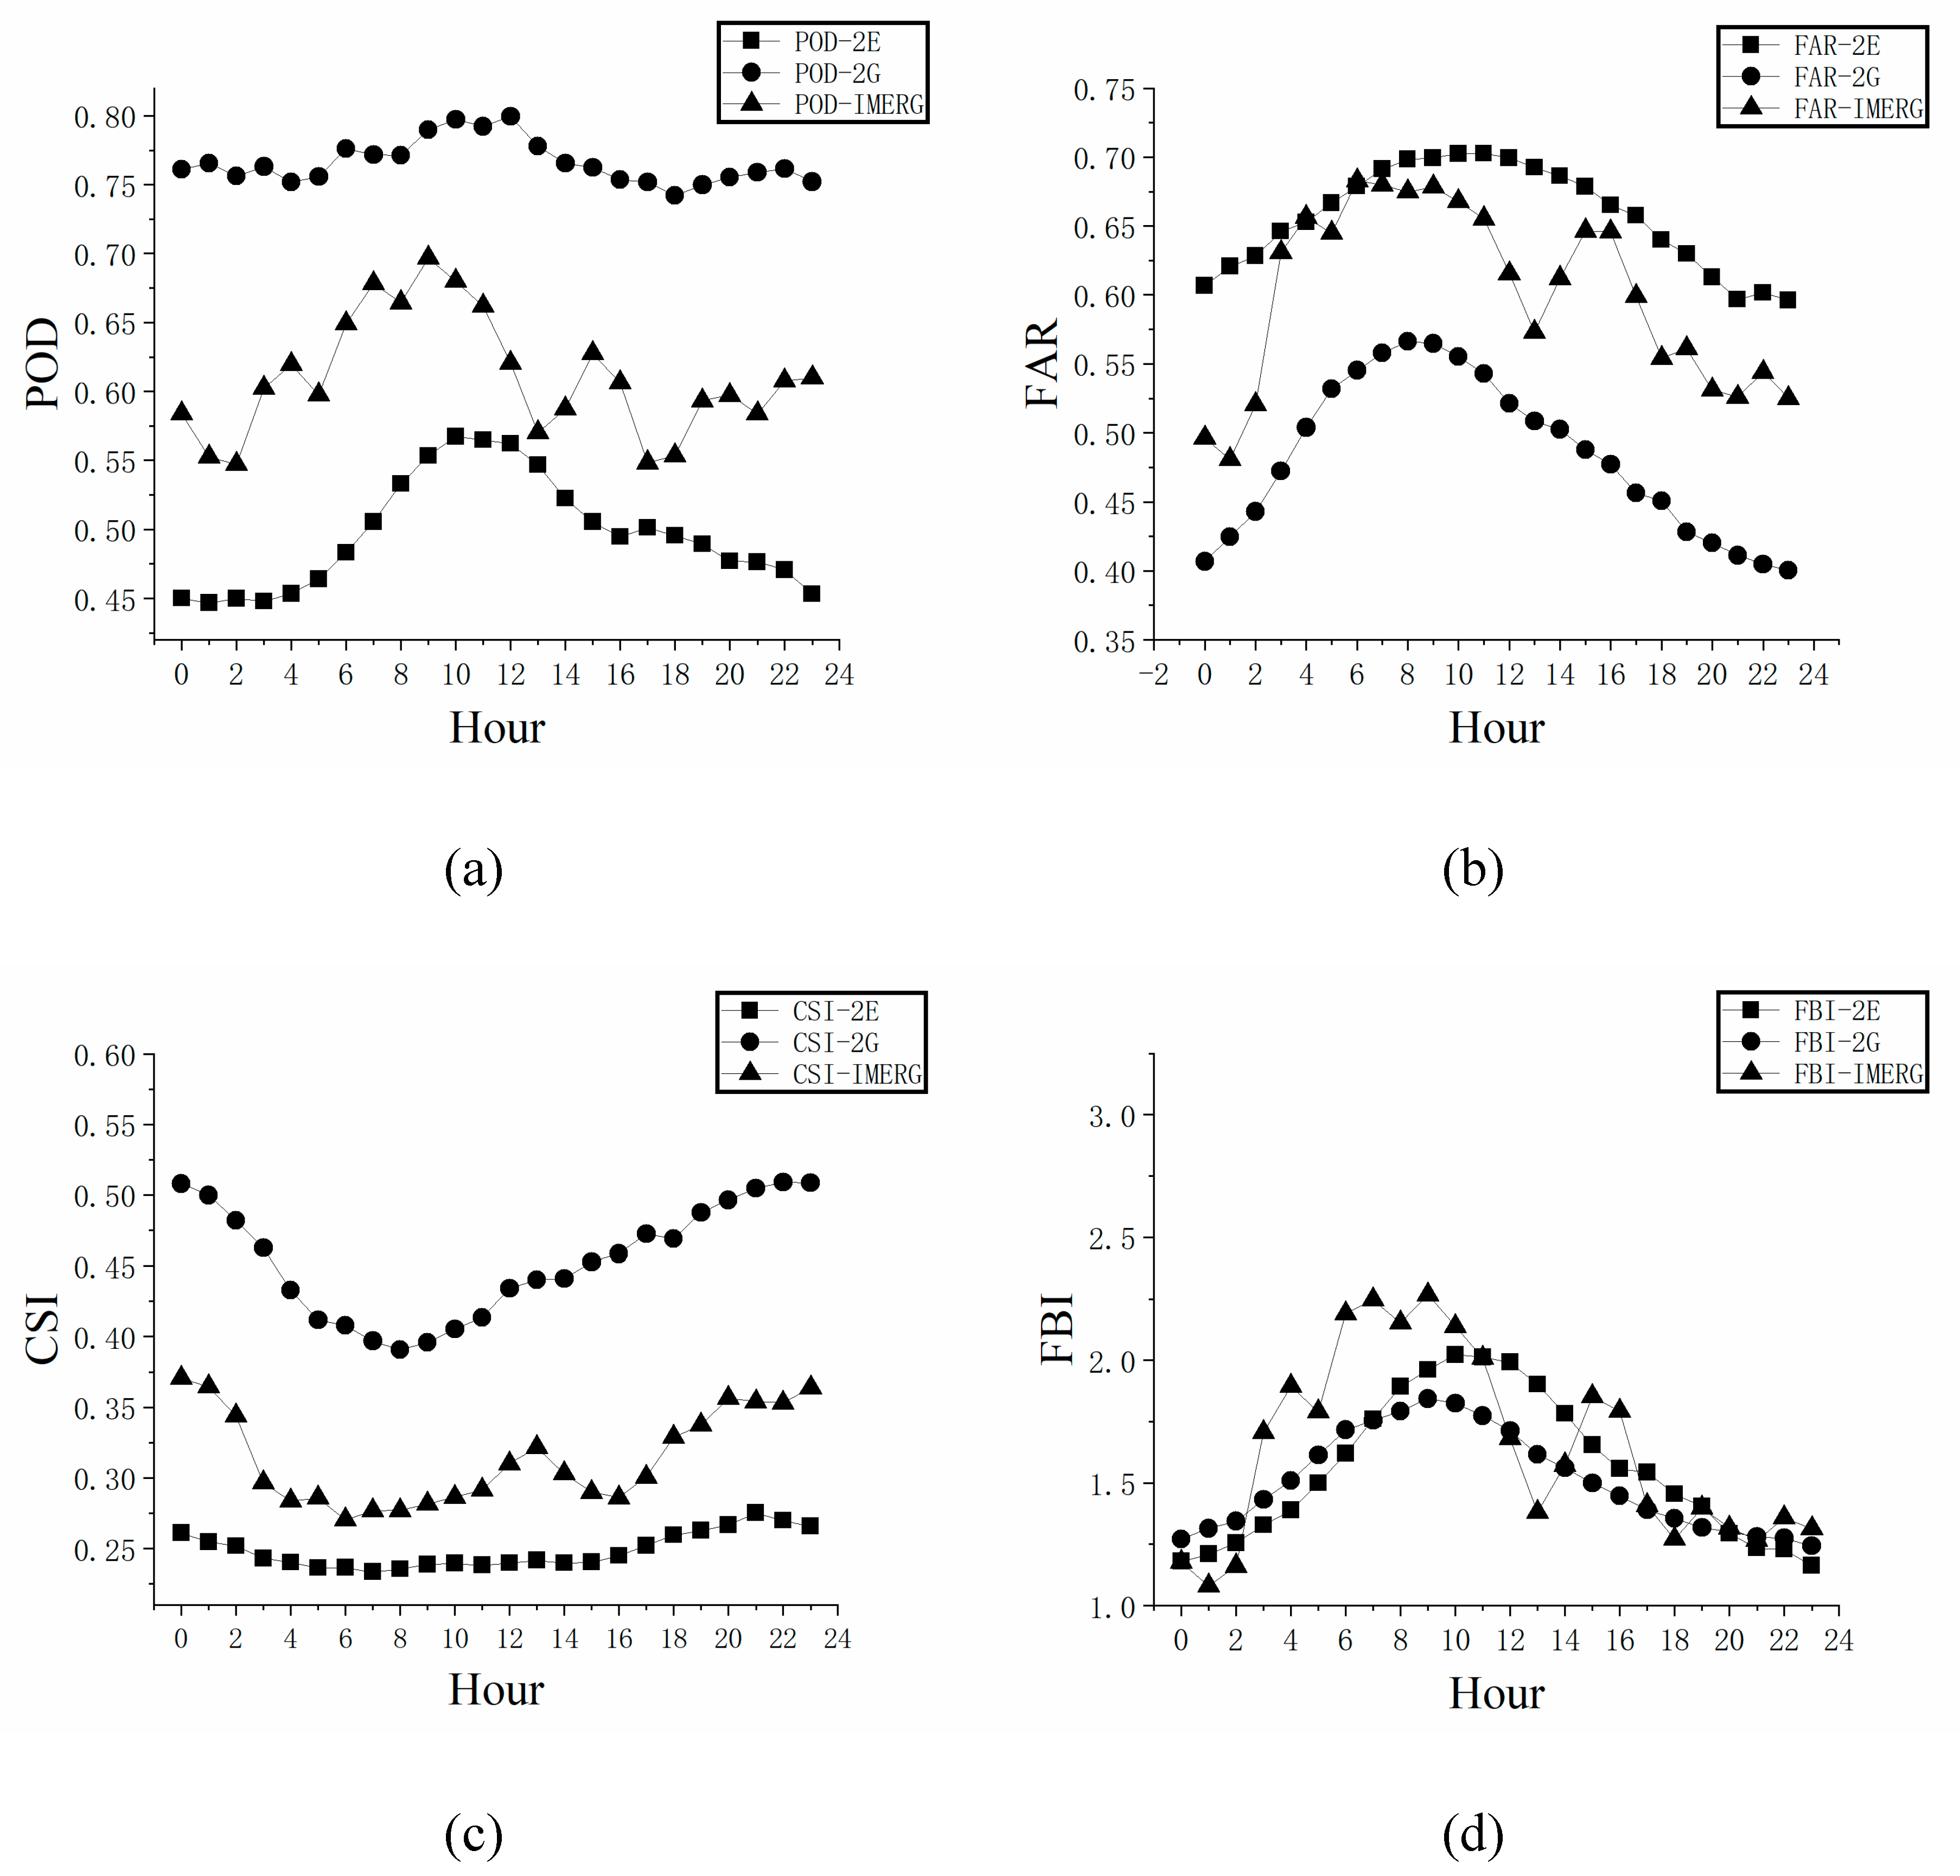
4.4. Contingency Indices of the Three Precipitation Products at Hourly and Daily Scales

Figure 7a–d display the spatial distributions of the contingency indices (POD, FAR, CSI, and FBI, respectively), generated by IDW interpolation based on validation results of corresponding rain gauge data, over mainland China during summer, 2018. Generally, the POD values of FY-2G QPE (>0.70) are much better than those of FY-2E QPE and IMERG, across mainland China. The POD values of IMERG are around 0.4 to 0.7 over most areas, while the POD values of FY-2E QPE are the smallest in most parts of mainland China (<0.5), especially in the northwest (<0.3) (Figure 7a). The FAR values of FY-2E QPE are above 0.5 over most regions and are larger than 0.8 in northwestern China, which is similar to the case of the IMERG products. As for FY-2G QPE, the FAR values (<0.6) are smaller than both values of FY-2E QPE and IMERG. Regarding the distributions of CSI (Figure 7c), FY-2G QPE shows a better performance than FY-2E QPE and IMERG, with values of around 0.4 to 0.7 over mainland China. The CSI values of FY-2E QPE and IMERG show similar spatial distributions. Both CSI values of FY-2E QPE and IMERG are lower than 0.4 overall, and lower than 0.2 in northwestern China. The FBI values of IMERG are higher than 1.8 in more than half of the areas, which indicates high overestimates in precipitation over such regions. The FBI values of FY-2G QPE are also greater than 1.2 over most parts of mainland China, reflecting overestimates in these areas, but to a lower degree compared with estimates of IMERG data. FY-2E QPE tends to overestimate precipitation in south, northeast, and northwest China, with FBI values larger than 1.6, and underestimate precipitation in the west and east coast regions of China, with values smaller than 1.
Averaged values of contingency indicators of the three products at hourly scale in June, July, August, and summer are exhibited in Table 4. FY-2G QPE shows the best values of POD in all the four periods compared with the other two products (around 0.61 in June, 0.84 in July, 0.84 in August, and 0.77 in summer). FY-2E QPE and IMERG have higher averaged values of FAR than those of FY-2G QPE, which are relevant to the lower values of CSI of both FY-2E QPE and IMERG. The values of CSI of FY-2E QPE are the lowest in each month, as well as for the entire summer. The averaged FBI values of all three precipitation products are much greater than one, which indicates that each of the three products show a larger proportion of false alarms than false negatives.
Figure 8a displays the temporal variations of POD of FY-2E QPE, FY-2G QPE, and IMERG. The values of POD of FY-2G QPE are the largest during the entire day, with values ranging from 0.75 to 0.80. The values of POD of IMERG are smaller than those of FY-2G QPE at each hour, with values varying from 0.55 to 0.70. The temporal variations of POD of IMERG are not smooth. IMERG shows a peak around 09:00 and valleys at 02:00, 13:00, and 17:00. FY-2E QPE shows the smallest values of POD (<0.57) compared with those of FY-2G QPE and IMERG, which suggests that FY-2E QPE could not detect rainfall events reasonably and effectively during the summer. Figure 8b shows the temporal variations of FAR. In general, FY-2G QPE shows the lowest FAR values at each time during the entire day, while the FAR values of IMERG are smaller than those of FY-2E QPE overall. As for the performances of FY-2G QPE, the FAR values exceed 0.50 from 05:00 to 14:00. Generally, the variations of CSI (Figure 8c) still demonstrate that FY-2G QPE outperforms IMERG and FY-2E QPE, with the largest CSI values during the entire day, while the CSI values of FY-2E QPE are the smallest. All of the three satellite-based precipitation products have values of FBI larger than one (Figure 8d), which indicates that all products tend to overestimate precipitation occurrences over the study area.
Figure 9 illustrates the numerical distributions of contingency statistical indices for FY-2E QPE, FY-2G QPE, and IMERG, at daily scale. In terms of POD (Figure 9a), the performance of FY-2G QPE is close to that of IMERG, with mean values of around 0.87 and 0.82, respectively, while the mean value of POD for FY-2E QPE is around 0.62. For the distributions of FAR (Figure 9b), the mean value of FY-2G QPE is the smallest (around 0.25), while the mean values of IMERG and FY-2E QPE are both around 0.4. In spite of the well-performing median, FY-2E QPE shows the worst POD and FAR distributions, since the range of whiskers is too large compared with that of the other two products. Regarding CSI (Figure 9c), it shows similar distributions and numerical characteristics to those of POD, which indicates that FY-2G QPE outperforms IMERG and FY-2E QPE, with the largest mean value of around 0.6. For FBI (Figure 9d), the mean values of all three precipitation products are larger than 1, which indicates that each of the three products shows a tendency to overestimate precipitation occurrences at diurnal scale. The mean values of FBI of the FY-2 series satellite precipitation products are closer to one than IMERG, indicating a smaller degree of overestimation. Note that some FBI values of FY-2G QPE are smaller than one, which indicates that FY-2G QPE underestimates precipitation occurrences in some areas.

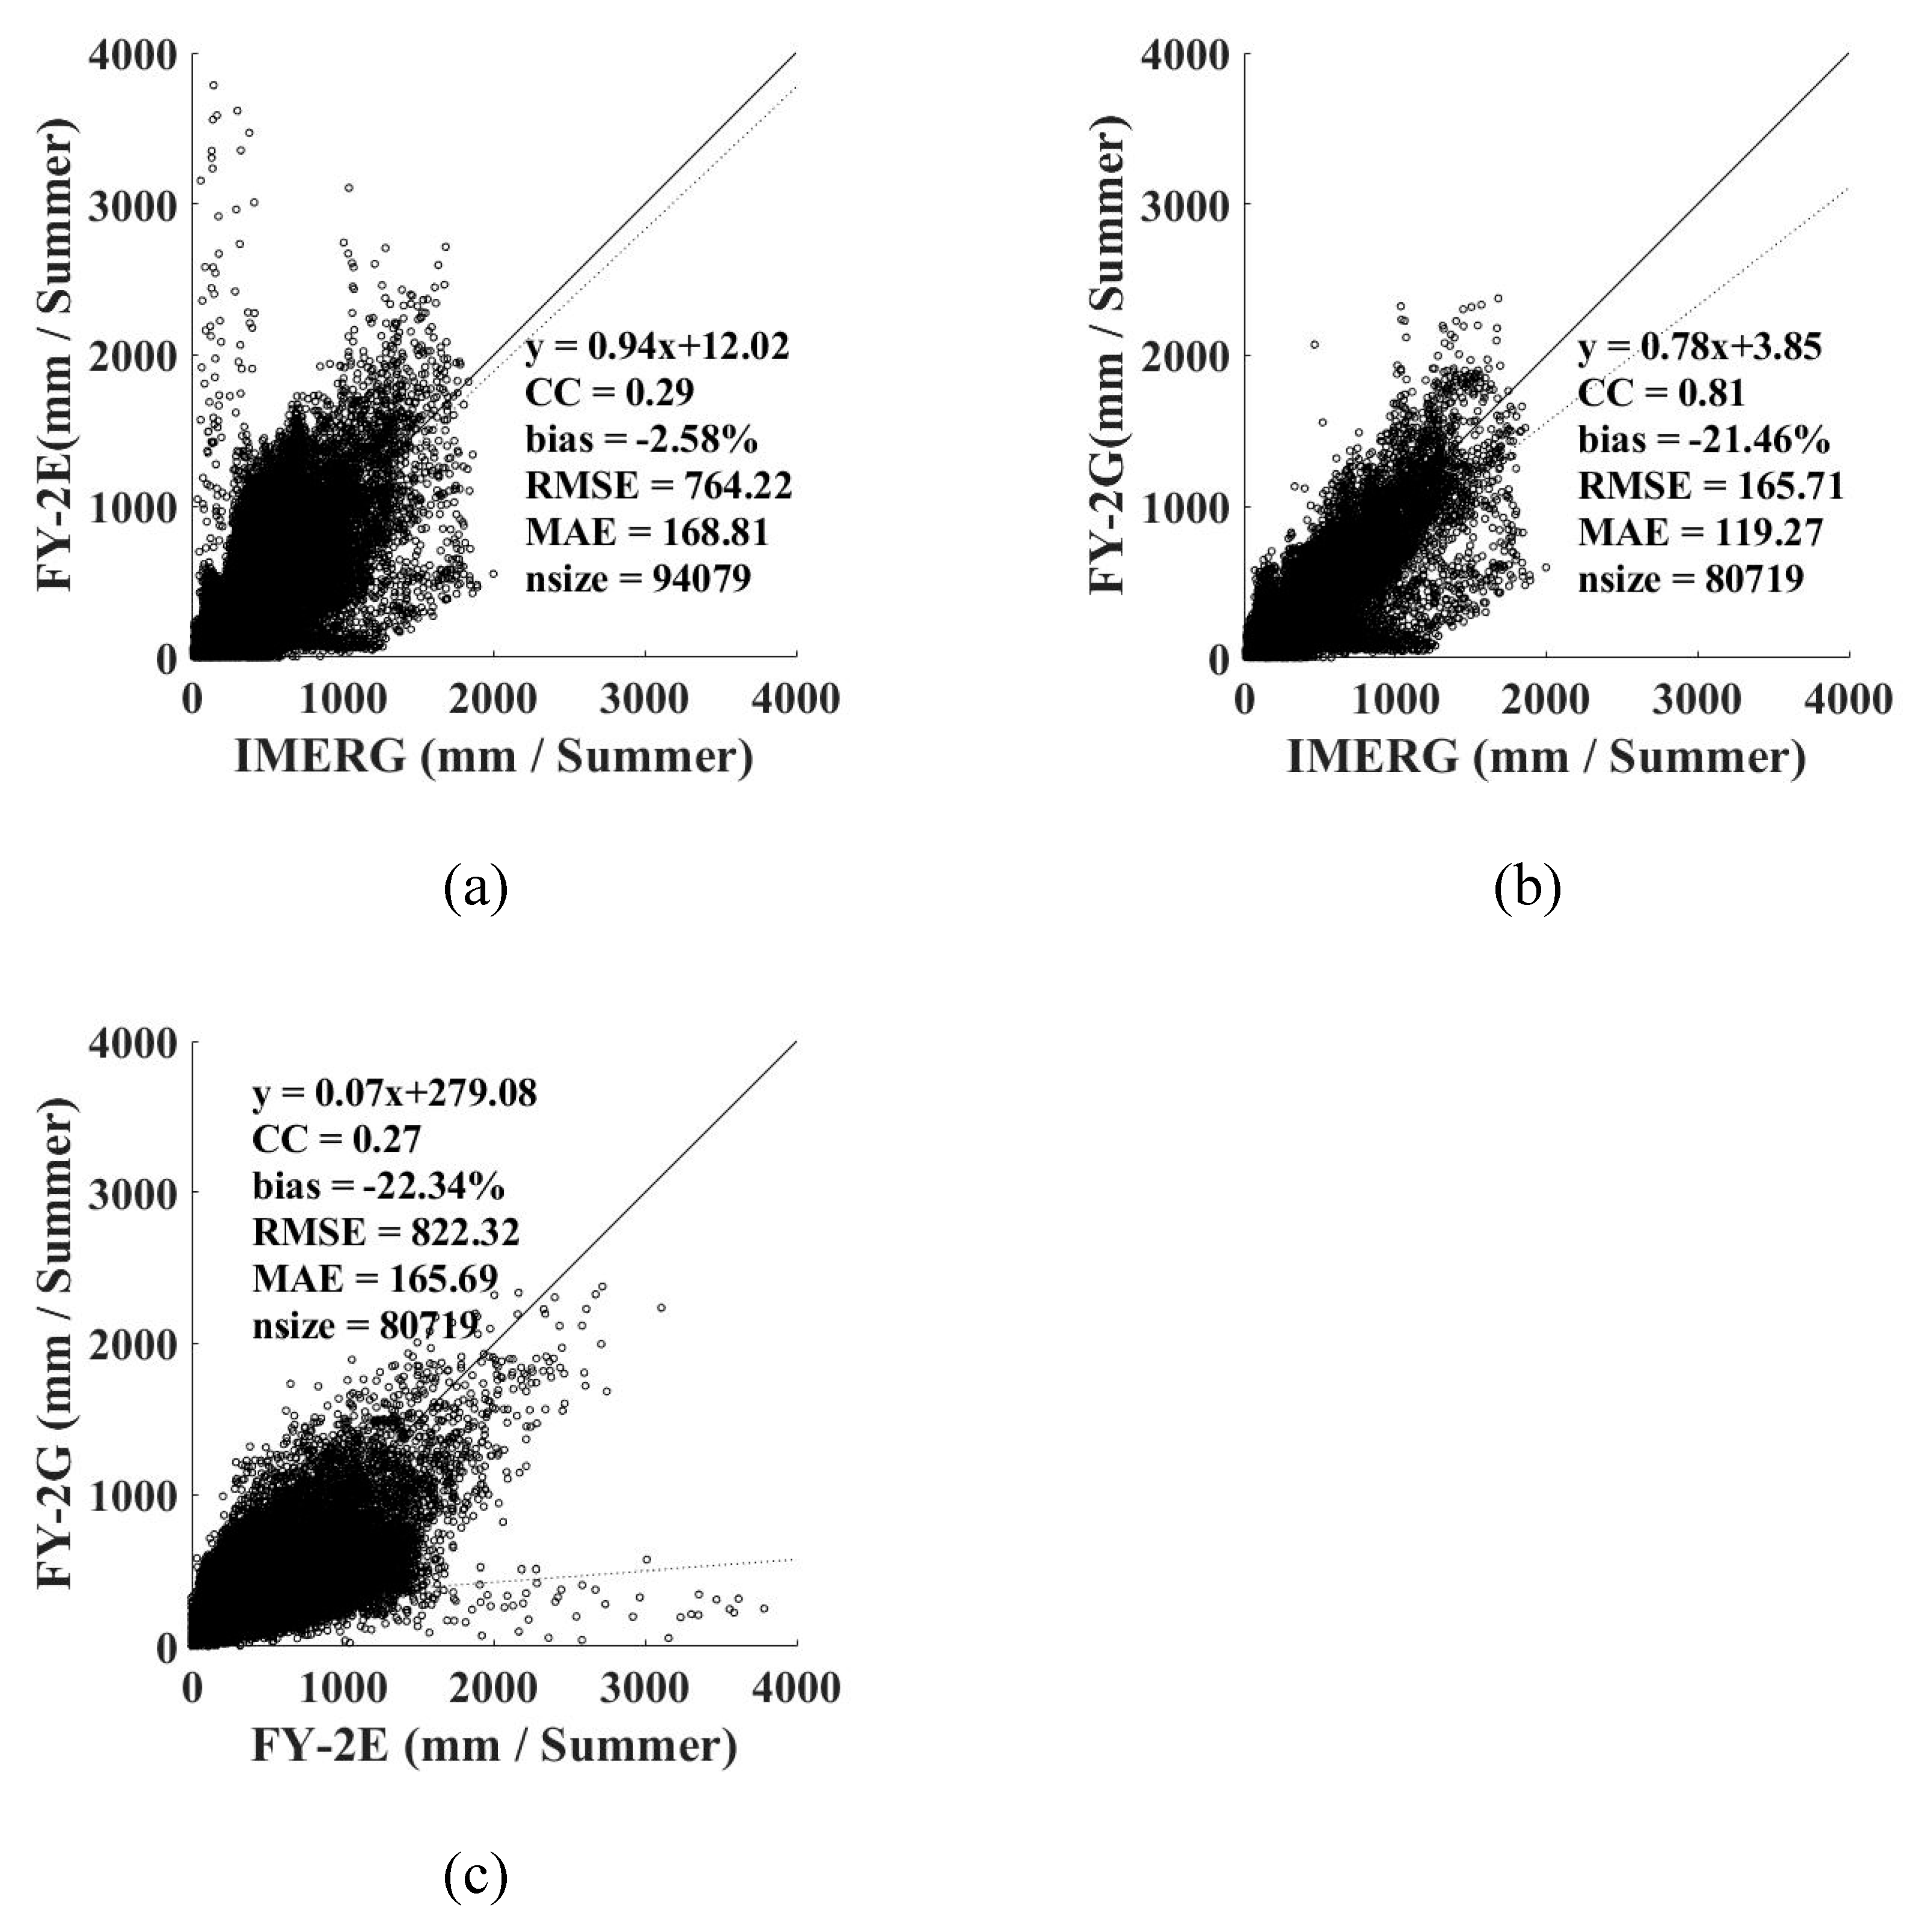
4.5. Cross-Evaluation of FY-2 Precipitation Products Based on IMERG

Figure 10a–c demonstrate the inter-comparison results for FY-2E, FY-2G precipitation products, and IMERG, in terms of the total precipitation in summer, 2018. The number of pixels involved in cross evaluation between FY-2E QPE and IMERG is different from the number between FY-2G QPE and IMERG, which is mainly caused by the different ratios of data absence of FY-2E QPE and FY-2G QPE in northwestern mainland China. It is obvious that the correlations between FY-2G QPE and IMERG (CC of ~0.81) are much larger than those between FY-2E QPE and IMERG (CC of ~0.29), which is mainly caused by some significant overestimates of FY-2E QPE for the total precipitation in summer, when the precipitation is relatively small, compared with IMERG data. Additionally, the values of CC and other indicators between FY-2E QPE and FY-2G QPE are relatively poor, which indicates that the estimates of FY-2E are somewhat unreliable. Overall, according to the inter-comparisons displayed in Figure 10, FY-2G QPE agreed better with IMERG than FY-2E QPE in terms of spatial patterns and consistency.

5. Discussion

5.1. The Advantages and Disadvantages of FY-2E QPE, FY-2G QPE, and IMERG

As mentioned above, we found that FY-2G QPE generally outperformed IMERG in terms of the statistical metrics over mainland China in summer, 2018. One of the possible reasons for this could be the different correction strategies; for example, the fusion method of FY-2 QPE considers not only the intensity, but also the directionality, of precipitation in the estimate fields. The FY-2 QPE fusion methods assume that the error field of the satellite-based precipitation estimate is related to not only the distance to the ground stations, but also the directionality of precipitation.
The unsatisfying performances of FY-2E QPE are significant, and may be related to the service life designed for FY-2E. FY-2E was launched in 2008 and was discontinued in early 2019, with a running time of about 11 years [35]. Therefore, the summer of 2018 coincides with the late stage of its operation. This could also explain the fact that there are some striped textures of precipitation spatial distributions derived from FY-2E in southern China in Figure 2b, which shows the spatial discontinuity of the satellite-based precipitation products. With the inevitable degradation of the sensors aboard the satellite, performance degradation is understandable.
According to the results demonstrated above, we found that FY-2 series satellites QPE and IMERG have advantages and disadvantages across the study area (Table 5). In mainland China, FY-2G QPE is more suitable in operational applications than IMERG, not only in terms of data accuracy, but also for the latency of the products (1 h for FY, 4 h for IMERG Early-run, 14 h for IMERG Late-run, and 3.5 months for IMERG Final-run), although there is no data coverage in the northern part of Heilongjiang Province (>50°N), while the time span of FY-2 series satellites is not long enough. In contrast, the IMERG Final-run precipitation product has been calculated back to 2000. Therefore, it is appropriate for IMERG to be used for long-term studies related to precipitation with fine spatiotemporal resolutions. Regarding the spatial coverage of these precipitation products, IMERG is more applicable for global-scale research due to the wide coverage of its products. Nonetheless, users should still pay great attention to the not so satisfying performance of IMERG at hourly and diurnal scales. Furthermore, some algorithms and methods, such as downscaling and retrospective studies, could be applied to yield long-term precipitation estimates with finer spatiotemporal resolutions in the future [36,37,38,39].

5.2. Possible Error Source Analysis of the GPM IMERG Product

For decades, numerous researchers have focused on the errors of satellite-based precipitation products at multiple scales all over the world, leading to the continuous improvement of these products to [40,41,42,43,44,45]. In this study, we have proposed some possible error sources of the GPM IMERG product, hoping to provide preliminary references for improving satellite-based QPE for the next generation. As can be seen from Figure 5 and Figure 7, the large FAR (>0.7) of IMERG is mainly distributed in northwestern China, where the values of CC are relatively small compared with the other regions over mainland China. Additionally, the bias is generally greater than 50%. The dominant arid and semi-arid climate means that the area exhibits little precipitation over the entire year. The small amount of rainfall in summer makes it difficult to obtain correct detections [46,47]. Moreover, the ground observations obtained from meteorological stations for calibrating the satellite-based precipitation estimates are limited. These two issues may lead to a high false alarm ratio and significant overestimates over northwestern China.
In spite of the good performance compared with ground observations at monthly scale, the hourly and daily performance of IMERG shown by various indicators is not so satisfying. The characteristics of IMERG algorithms, including calibration algorithms and retrieval algorithms, might be related to this phenomenon. We know from the Algorithm Theoretical Basis Document (V06) of IMERG that the calibration strategy of IMERG Final-run products still has much room to improve [12]. The half-hourly precipitation estimates are simply multiplied by the monthly calibration ratios against monthly ground observations to yield half-hourly Final-run products. Although this will result in monthly estimates matching the gauge values more closely, IMERG Final-run datasets show an unsatisfying performance at meteorological scales (e.g., hourly or daily scale). We could assume that by using gauge calibrations at finer temporal resolutions, such as a daily scale, IMERG would likely yield satisfying performances at meteorological scales in terms of diagnostic indicators, with decreasing proportions of false negatives and false alarms. As for the retrieval algorithms of IMERG, the databases, including the a-priori database of cloud and precipitation profiles for inverting the passive microwave-based satellite precipitation estimates and the cloud feature database for inverting the infrared-based satellite precipitation estimates, might not be robust enough in China, considering the complex terrains and climatic factors [12,48,49,50,51]. In Figure 9, the POD patterns of IMERG are similar to those of FY-2G QPE, while the performances of its FAR and CSI patterns are not good. The phenomenon is caused by the larger proportion of false alarms of IMERG than those of FY-2G QPE. The high probability of false alarm occurrence indicated that the ability of IMERG in detecting the precipitation clouds at meteorological scales is comparatively weak, which may be related to the not well-matched feature database for precipitation retrieval algorithms over mainland China. In addition, significant overestimates and false alarms of IMERG in some areas may also result in large surrounding values for IMERG products. Meanwhile, the inconsistency between IMERG and FY-2G QPE would be significantly aggravated, as shown in Figure 10b.

6. Conclusions

Evaluations of satellite-based quantitative precipitation estimates are of great importance when applying these datasets in related fields, such as hydrology, meteorology, and agriculture. In this study, we firstly evaluated and compared the main current satellite-based precipitation products from Chinese Fengyun (FY)-2 and the Global Precipitation Mission (GPM), respectively, over mainland China in summer, 2018. The main conclusions are as follows:
(1) The three products (FY-2E QPE, FY-2G QPE, and IMERG) demonstrate similar spatial precipitation patterns; for example, a general decreasing trend from the southeast to northwest over mainland China;
(2) Compared with rain gauge measurements, FY-2G QPE and IMERG perform better among the three products, with the CC varying from 0.65 to 0.90 and 0.80 to 0.90 in summer, 2018, followed by FY-2E QPE (CC of ~0.40 to 0.53);
(3) IMERG agrees well with rain gauge data at monthly scale, while it performs worse than FY-2G QPE at hourly and daily scales, which might be caused by the algorithm characteristics of IMERG Final-run products;
(4) Compared with ground observations, FY-2G QPE exhibits underestimates in capturing the precipitation at both a monthly and hourly scale, while FY-2E QPE and IMERG generally tend to overestimate the precipitation in summer, 2018;
(5) The performances of both FY-based and GPM-based precipitation products are poorer during the period from 06:00 to 10:00 UTC than other periods at diurnal scale, which might have resulted from the satellite-based precipitation retrieval algorithms and the impact of regional meteorological and climatological influences. Further study is required to investigate the underlying reasons for this phenomenon;
(6) FY-2G QPE agrees well with IMERG in terms of spatial patterns and consistency (CC of ~0.81), which means that these two products have similar capacities to capture the spatial patterns of precipitation events.
The findings presented in this study could provide valuable preliminary references for improving the current satellite-based QPE retrieval algorithms for the next generation.

Author Contributions

Conceptualization, J.X., Z.M., and Z.S.; methodology, J.X., Z.M., and G.T.; software, X.M., W.W., and Q.J.; validation, J.X., G.T., and Q.J.; formal analysis, J.X., Q.J., and X.M.; investigation, J.X., Z.M., G.T., and Q.J.; resources, J.X., X.M., and W.W.; data curation, J.X. and W.W.; writing—original draft preparation, J.X. and Z.M.; writing—review and editing, J.X. and Z.M.; visualization, J.X., Q.J., X.M., and W.W.; supervision, Z.M., G.T., and Z.S.; project administration, Z.M. and Z.S.; funding acquisition, Z.M. and Z.S.

Funding

This research is financially supported by the National Key Research and Development Program (2017YFD0700501); the State Key Laboratory of Resources and Environmental Information System, National Natural Science Foundation of China (41571339, 41901343); the Open Fund of the State Key Laboratory of Remote Sensing Science (OFSLRSS201909), the Key R&D Program of Ministry of Science and Technology (2018YFC1506500); and the China Postdoctoral Science Foundation (2018M630037 and 2019T120021).

Acknowledgments

The authors’ great gratitude is extended to the NSMC for providing FY-2 QPE and to the CMA for providing ground observations. We also appreciate the NASA/Goddard Space Flight Center’s Mesoscale Atmospheric Processes Laboratory for providing the IMERG data.

Conflicts of Interest

The authors declare no conflicts of interest.

References

  1. Kidd, C.; Huffman, G. Global Precipitation Measurement. Meteorol. Appl. 2011, 18, 334–353. [Google Scholar] [CrossRef]
  2. Hegerl, G.; Black, E.; Allan, R.; Ingram, W.J.; Polson, D.; Trenberth, K.E.; Chadwick, R.; Arkin, P.A.; Sarojini, B.; Becker, A.; et al. Challenges in Quantifying Changes in the Global Water Cycle. Bull. Am. Meteorol. Soc. 2014, 96, 1097–1115. [Google Scholar] [CrossRef] [Green Version]
  3. Ruhi, A.; Messager, M.L.; Olden, J.D. Tracking the Pulse of the Earth’s Fresh Waters. Nat. Sustain. 2018, 1, 198–203. [Google Scholar] [CrossRef]
  4. Hirpa, F.A.; Gebremichael, M.; Hopson, T. Evaluation of High-Resolution Satellite Precipitation Products over Very Complex Terrain in Ethiopia. J. Appl. Meteorol. Clim. 2010, 49, 1044–1051. [Google Scholar] [CrossRef]
  5. Jongjin, B.; Jongmin, P.; Dongryeol, R.; Minha, C. Geospatial Blending to Improve Spatial Mapping of Precipitation with High Spatial Resolution by Merging Satellite-based and Ground-based data. Hydrol. Process. 2016, 30, 2789–2803. [Google Scholar] [CrossRef]
  6. Ebert, E.E.; Janowiak, J.E.; Kidd, C. Comparison of Near-Real-Time Precipitation Estimates from Satellite Observations and Numerical Models. Bull. Am. Meteorol. Soc. 2007, 88, 47–64. [Google Scholar] [CrossRef] [Green Version]
  7. Ma, Z.; Xu, Y.; Peng, J.; Chen, Q.; Wan, D.; He, K.; Shi, Z.; Li, H. Spatial and Temporal Precipitation Patterns Characterized by TRMM TMPA over the Qinghai-Tibetan Plateau and Surroundings. Int. J. Remote Sens. 2018, 39, 3891–3907. [Google Scholar] [CrossRef]
  8. Li, X.; Zhang, Q.; Xu, C.-Y. Assessing the Performance of Satellite-based Precipitation Products and its Dependence on Topography over Poyang Lake Basin. Theor. Appl. Climatol. 2014, 115, 713–729. [Google Scholar] [CrossRef]
  9. Levizzani, V.; Bauer, P.; Joseph Turk, F. Measuring Precipitation from Space—EURAINSAT and the Future; Springer: Dordrecht, The Netherlands, 2007; pp. 49–58. [Google Scholar]
  10. Kucera, P.A.; Ebert, E.E.; Turk, F.J.; Levizzani, V.; Kirschbaum, D.; Tapiador, F.J.; Loew, A.; Borsche, M. Precipitation from Space: Advancing Earth System Science. Bull. Am. Meteorol. Soc. 2013, 94, 365–375. [Google Scholar] [CrossRef]
  11. Hou, A.Y.; Kakar, R.K.; Neeck, S.; Azarbarzin, A.A.; Kummerow, C.D.; Kojima, M.; Oki, R.; Nakamura, K.; Iguchi, T. The Global Precipitation Measurement Mission. Bull. Am. Meteorol. Soc. 2014, 95, 701–722. [Google Scholar] [CrossRef]
  12. Huffman, G.J.; Bolvin, D.T.; Braithwaite, D.; Hsu, K.; Joyce, R.; Kidd, C.; Nelkin, E.J.; Sorooshian, S.; Tan, J.; Xie, P. Algorithm Theoretical Basis Document (ATBD) Version 06: NASA Global Precipitation Measurement (GPM) Integrated Multi-SatellitE Retrievals for GPM (IMERG); NASA: Greenbelt, MD, USA, 2018. Available online: https://pmm.nasa.gov/sites/default/files/document_files/IMERG_ATBD_V06.pdf (accessed on 11 December 2019).
  13. Shukla, S.; McNally, A.; Husak, G.; Funk, C. A Seasonal Agricultural Drought Forecast System for Food-insecure Regions of East Africa. Hydrol. Earth Syst. Sci. 2014, 18, 3907–3921. [Google Scholar] [CrossRef] [Green Version]
  14. Anjum, M.N.; Ding, Y.; Shangguan, D.; Ijaz, M.W.; Zhang, S. Evaluation of High-Resolution Satellite-Based Real-Time and Post-Real-Time Precipitation Estimates during 2010 Extreme Flood Event in Swat River Basin, Hindukush Region. Adv. Meteorol. 2016, 2016, 2604980. [Google Scholar] [CrossRef]
  15. Derin, Y.; Yilmaz, K.K. Evaluation of Multiple Satellite-Based Precipitation Products over Complex Topography. J. Hydrometeorol. 2014, 15, 1498–1516. [Google Scholar] [CrossRef] [Green Version]
  16. Beck, H.E.; Vergopolan, N.; Pan, M.; Levizzani, V.; Van Dijk, A.I.J.M.; Weedon, G.P.; Brocca, L.; Pappenberger, F.; Huffman, G.J.; Wood, E.F. Global-scale Evaluation of 22 Precipitation Datasets Using Gauge Observations and Hydrological Modeling. Hydrol. Earth Syst. Sci. 2017, 21, 6201–6217. [Google Scholar] [CrossRef] [Green Version]
  17. Porcù, F.; Milani, L.; Petracca, M. On the Uncertainties in Validating Satellite Instantaneous Rainfall Estimates with Raingauge Operational Network. Atmos. Res. 2014, 144, 73–81. [Google Scholar] [CrossRef]
  18. Rivera, J.A.; Marianetti, G.; Hinrichs, S. Validation of CHIRPS precipitation dataset along the Central Andes of Argentina. Atmos. Res. 2018, 213, 437–449. [Google Scholar] [CrossRef]
  19. Darand, M.; Amanollahi, J.; Zandkarimi, S. Evaluation of the Performance of TRMM Multi-satellite Precipitation Analysis (TMPA) Estimation over Iran. Atmos. Res. 2017, 190, 121–127. [Google Scholar] [CrossRef]
  20. Gadelha, A.N.; Coelho, V.H.R.; Xavier, A.C.; Barbosa, L.R.; Melo, D.C.D.; Xuan, Y.; Huffman, G.J.; Petersen, W.A.; Almeida, C.D.N. Grid Box-level Evaluation of IMERG over Brazil at Various Space and Time Scales. Atmos. Res. 2019, 218, 231–244. [Google Scholar] [CrossRef] [Green Version]
  21. Sun, R.; Yuan, H.; Liu, X.; Jiang, X. Evaluation of the Latest Satellite–gauge Precipitation Products and their Hydrologic Applications over the Huaihe River basin. J. Hydrol. 2016, 536, 302–319. [Google Scholar] [CrossRef]
  22. Tang, G.; Ma, Y.; Long, D.; Zhong, L.; Hong, Y. Evaluation of GPM Day-1 IMERG and TMPA Version-7 Legacy Products over Mainland China at Multiple Spatiotemporal Scales. J. Hydrol. 2015, 533, 152–167. [Google Scholar] [CrossRef]
  23. Feidas, H.; Porcu, F.; Puca, S.; Rinollo, A.; Lagouvardos, C.; Kotroni, V. Validation of the H-SAF Precipitation Product H03 over Greece Using Rain Gauge Data. Theor. Appl. Climatol. 2018, 131, 377–398. [Google Scholar] [CrossRef]
  24. Chen, S.; Hong, Y.; Cao, Q.; Gourley, J.J.; Kirstetter, P.E.; Yong, B.; Tian, Y.D.; Zhang, Z.X.; Shen, Y.; Hu, J.J.; et al. Similarity and Difference of the Two Successive V6 and V7 TRMM Multisatellite Precipitation Analysis Performance over China. J. Geophys. Res. Atmos. 2013, 118, 13060–13074. [Google Scholar] [CrossRef]
  25. Teng, H.; Shi, Z.; Ma, Z.; Li, Y. Estimating Spatially Downscaled Rainfall by Regression Kriging using TRMM Precipitation and Elevation in Zhejiang Province, Southeast China. Int. J. Remote Sens. 2014, 35, 7775–7794. [Google Scholar] [CrossRef]
  26. Prakash, S.; Mitra, A.K.; AghaKouchak, A.; Liu, Z.; Norouzi, H.; Pai, D.S. A Preliminary Assessment of GPM-based Multi-satellite Precipitation Estimates over a Monsoon Dominated Region. J. Hydrol. 2018, 556, 865–876. [Google Scholar] [CrossRef] [Green Version]
  27. Katiraie-Boroujerdy, P.-S.; Akbari Asanjan, A.; Hsu, K.-L.; Sorooshian, S. Intercomparison of PERSIANN-CDR and TRMM-3B42V7 Precipitation Estimates at Monthly and Aaily Time Scales. Atmos. Res. 2017, 193, 36–49. [Google Scholar] [CrossRef] [Green Version]
  28. Ma, S.; Zhou, T.; Dai, A.; Han, Z. Observed Changes in the Distributions of Daily Precipitation Frequency and Amount over China from 1960 to 2013. J. Clim. 2015, 28, 6960–6978. [Google Scholar] [CrossRef]
  29. Shen, Y.; Xiong, A.; Wang, Y.; Xie, P. Performance of High Resolution Satellite Precipitation Products over China. J. Geophys. Res. Atmos. 2010, 115. [Google Scholar] [CrossRef]
  30. Wilks, D.S. Statistical Methods in the Atmospheric Sciences; Academic Press: Oxford, UK, 2011. [Google Scholar]
  31. Nurmi, P. Recommendations on the Verification of Local Weather Forecasts; ECMWF Technical Memorandum. No. 430; ECMWF: Reading, UK, 2003. [Google Scholar]
  32. Taylor, K.E. Summarizing Multiple Aspects of Model Performance in a Single Diagram. J. Geophys. Res. Atmos. 2001, 106, 7183–7192. [Google Scholar] [CrossRef]
  33. Guo, H.; Chen, S.; Bao, A.; Behrangi, A.; Hong, Y.; Ndayisaba, F.; Hu, J.; Stepanian, P.M. Early assessment of Integrated Multi-satellite Retrievals for Global Precipitation Measurement over China. Atmos. Res. 2016, 176–177, 121–133. [Google Scholar] [CrossRef]
  34. Ning, S.; Wang, J.; Jin, J.; Ishidaira, H. Assessment of the Latest GPM-Era High-Resolution Satellite Precipitation Products by Comparison with Observation Gauge Data over the Chinese Mainland. Water 2016, 8, 481. [Google Scholar] [CrossRef]
  35. National Satellite Meteorological Centre (China). Announcement on the Discontinued Operations of FY-2E. 2019. Available online: http://www.nsmc.org.cn/NSMC/Contents/103440.html (accessed on 5 December 2019). (in Chinese).
  36. Ma, Z.; Shi, Z.; Zhou, Y.; Xu, J.; Yu, W.; Yang, Y. A Spatial Data Mining Algorithm for Downscaling TMPA 3B43 V7 Data over the Qinghai–Tibet Plateau With the Effects of Systematic Anomalies Removed. Remote Sens. Environ. 2017, 200, 378–395. [Google Scholar] [CrossRef]
  37. He, K.; Ma, Z.; Zhao, R.; Biswas, A.; Teng, H.; Xu, J.; Yu, W.; Shi, Z. A Methodological Framework to Retrospectively Obtain Downscaled Precipitation Estimates over the Tibetan Plateau. Remote Sens. 2018, 10, 1974. [Google Scholar] [CrossRef] [Green Version]
  38. Ma, Z.Q.; Zhou, L.Q.; Yu, W.; Yang, Y.Y.; Teng, H.F.; Shi, Z. Improving TMPA 3B43 V7 Data Sets Using Land-Surface Characteristics and Ground Observations on the Qinghai–Tibet Plateau. IEEE Geosci. Remote Sens. Lett. 2018, 15, 178–182. [Google Scholar] [CrossRef]
  39. Ma, Z.; He, K.; Tan, X.; Xu, J.; Fang, W.; He, Y.; Hong, Y. Comparisons of Spatially Downscaling TMPA and IMERG over the Tibetan Plateau. Remote Sens. 2018, 10, 1883. [Google Scholar] [CrossRef] [Green Version]
  40. Tian, Y.; Peters-Lidard, C.D.; Choudhury, B.J.; Garcia, M. Multitemporal Analysis of TRMM-based Satellite Precipitation Products for Land Data Assimilation Applications. J. Hydrometeorol. 2007, 8, 1165–1183. [Google Scholar] [CrossRef]
  41. Pfeifroth, U.; Mueller, R.; Ahrens, B. Evaluation of Satellite-based and Reanalysis Precipitation Data in the Tropical Pacific. J. Appl. Meteorol. Clim. 2013, 52, 634–644. [Google Scholar] [CrossRef]
  42. Gehne, M.; Hamill, T.M.; Kiladis, G.N.; Trenberth, K.E. Comparison of Global Precipitation Estimates across a Range of Temporal and Spatial Scales. J. Clim. 2016, 29, 7773–7795. [Google Scholar] [CrossRef]
  43. Herold, N.; Behrangi, A.; Alexander, L.V. Large Uncertainties in Observed Daily Precipitation Extremes over Land. J. Geophys. Res. Atmos. 2017, 22, 668–681. [Google Scholar] [CrossRef]
  44. Sun, Q.H.; Miao, C.Y.; Duan, Q.Y.; Ashouri, H.; Sorooshian, S.; Hsu, K.L. A Review of Global Precipitation Data Sets: Data Sources, Estimation, and Intercomparisons. Rev. Geophys. 2018, 56, 79–107. [Google Scholar] [CrossRef] [Green Version]
  45. Chen, H.; Yong, B.; Gourley, J.J.; Liu, J.; Ren, L.; Wang, W.; Hong, Y.; Zhang, J. Impact of the Crucial Geographic and Climatic Factors on the Input Source Errors of GPM-based Global Satellite Precipitation Estimates. J. Hydrol. 2019, 575, 1–16. [Google Scholar] [CrossRef]
  46. Gao, F.; Zhang, Y.; Chen, Q.; Wang, P.; Yang, H.; Yao, Y.; Cai, W. Comparison of Two Long-term and High-resolution Satellite Precipitation Datasets in Xinjiang, China. Atmos. Res. 2018, 212, 150–157. [Google Scholar] [CrossRef]
  47. Marra, F.; Morin, E. Autocorrelation Structure of Convective Rainfall in Semiarid-arid Climate Derived from High-resolution X-Band Radar Estimates. Atmos. Res. 2018, 200, 126–138. [Google Scholar] [CrossRef]
  48. Hong, Y.; Hsu, K.-L.; Sorooshian, S.; Gao, X. Precipitation Estimation from Remotely Sensed Imagery Using an Artificial Neural Network Cloud Classification System. J. Appl. Meteorol. Clim. 2004, 43, 1834–1853. [Google Scholar] [CrossRef] [Green Version]
  49. Bitew, M.M.; Gebremichael, M. Evaluation through independent measurements: Complex terrain and humid tropical region in Ethiopia. In Satellite Rainfall Applications for Surface Hydrology; Springer: Dordrecht, The Netherlands, 2010; pp. 205–214. [Google Scholar]
  50. Maggioni, V.; Meyers, P.; Robinson, M. A Review of Merged High Resolution Satellite Precipitation Product Accuracy during the Tropical Rainfall Measuring Mission (TRMM)-Era. J. Hydrometeorol. 2016, 17, 1101–1117. [Google Scholar] [CrossRef]
  51. Passive Microwave Algorithm Team Facility. Global Precipitation Measurement (GPM) Mission Algorithm Theoretical Basis Document GPROF2017 Version 1. 2017. Available online: https://pmm.nasa.gov/sites/default/files/document_files/ATBD_GPM_GPROF_June1_2017.pdf (accessed on 15 October 2019).
Figure 1. Spatial distributions of DEM and ground-based rain gauges used in this study across mainland China.
Remotesensing 11 02992 g001
Figure 2. Spatial patterns of precipitation products estimated by (a) interpolated results based on rain gauge data, (b) Fengyun (FY)-2E quantitative precipitation estimates (QPE), (c) FY-2G QPE, and (d) Integrated Multi-satellitE Retrievals for GPM (IMERG) over mainland China in summer, 2018.
Remotesensing 11 02992 g002
Figure 3. Validations of (a) FY-2E QPE, (b) FY-2G QPE, and (c) IMERG data against ground observations at monthly scale over mainland China in summer, 2018.
Remotesensing 11 02992 g003
Figure 4. Taylor diagrams of performances of FY-2E QPE, FY-2G QPE, and IMERG against ground observations in terms of the centered root-mean-square difference, correlation coefficient, and standard deviation in (a) summer, (b) June, (c) July, and (d) August, 2018.
Remotesensing 11 02992 g004
Figure 5. Spatial patterns of performances for FY-2E QPE, FY-2G QPE, and IMERG in terms of (a) the correlation coefficient (CC), (b) root mean square error (RMSE), (c) bias, and (d) mean absolute error (MAE) against ground observations at hourly scale, respectively.
Remotesensing 11 02992 g005
Figure 6. Temporal patterns of performances of FY-2E QPE, FY-2G QPE, and IMERG in terms of (a) the CC, (b) RMSE, (c) bias, and (d) MAE against ground observations, respectively.
Remotesensing 11 02992 g006aRemotesensing 11 02992 g006b
Figure 7. Spatial patterns of the performance of FY-2E QPE, FY-2G QPE, and IMERG in terms of the (a) probability of detection (POD), (b) (false alarm ratio) FAR, (c) critical success index (CSI), and (d) frequency bias index (FBI) compared to ground observations at hourly scale, respectively.
Remotesensing 11 02992 g007
Figure 8. Temporal patterns of performances of FY-2E QPE, FY-2G QPE, and IMERG in terms of (a) POD, (b) FAR, (c) CSI, and (d) FBI against ground observations, respectively.
Remotesensing 11 02992 g008
Figure 9. The numerical distributions of contingency statistics for FY-2E QPE, FY-2G QPE, and IMERG in terms of (a) POD, (b) FAR, (c) CSI, and (d) FBI, respectively.
Remotesensing 11 02992 g009
Figure 10. The inter-comparisons of (a) FY-2E QPE and IMERG, (b) FY-2G QPE and IMERG, and (c) FY-2G QPE and FY-2E QPE in terms of total precipitation in summer, 2018.
Remotesensing 11 02992 g010
Table 1. Equations and the best values of four contingency statistical indices.
IndexEquation 1Best Value
POD H H + M 1
FAR F H + F 0
CSI H H + M + F 1
FBI H + F H + M 1
1 H(Hit) means that the precipitation occurrence is observed by a ground station as well as a satellite; M(Miss) denotes that the ground station observes the occurrence, while the satellite dose not detect it; F(False) indicates that the unobserved precipitation event is falsely detected by the satellite.
Table 2. Equations and the best values of four statistical indices.
IndexEquation 1Best Value
CC i = 1 n ( G i G ¯ ) 2 ( P i P ¯ ) 2 i = 1 n ( G i G ¯ ) 2 i = 1 n ( P i P ¯ ) 2 1
RMSE 1 n i = 1 n ( P i G i ) 2 0
bias i = 1 n ( P i G i ) i = 1 n G i × 100 % 0
MAE 1 n i = 1 n | P i G i | 0
1 n means the number of precipitation pairs in the analysis; G i means ground-based precipitation measurements; G ¯ means the average ground-based precipitation measurements; P i and P ¯ represent satellite precipitation products and their average, respectively.
Table 3. Averaged statistical indices for FY-2E QPE, FY-2G QPE, and IMERG at hourly scale over mainland China in summer, 2018.
Data TypeIndexJuneJulyAugustSummer
FY-2E QPECC0.23 0.25 0.23 0.24
RMSE (mm)1.51 1.84 1.70 1.69
bias (%)35.35 36.07 −25.42 15.76
MAE (mm)0.33 0.40 0.31 0.35
FY-2G QPECC0.45 0.66 0.66 0.59
RMSE (mm)1.14 1.13 1.21 1.16
bias (%)−7.45−2.28−4.34−4.66
MAE (mm)0.20 0.18 0.19 0.19
IMERGCC0.36 0.36 0.37 0.36
RMSE (mm)1.26 1.54 1.62 1.48
bias (%)14.5911.3410.0712.00
MAE (mm)0.25 0.31 0.32 0.29
Table 4. Averaged contingency indices for the FY-2E QPE, FY-2G QPE, and IMERG at hourly scale over mainland China in summer, 2018.
Data TypeIndexJuneJulyAugustSummer
FY-2E QPEPOD0.49 0.53 0.47 0.50
FAR0.70 0.65 0.62 0.66
CSI0.23 0.26 0.26 0.25
FBI1.79 1.61 1.28 1.56
FY-2G QPEPOD0.61 0.84 0.84 0.77
FAR0.56 0.46 0.44 0.48
CSI0.36 0.49 0.51 0.45
FBI1.39 1.59 1.54 1.51
IMERGPOD0.59 0.63 0.61 0.61
FAR0.60 0.61 0.59 0.60
CSI0.31 0.31 0.32 0.31
FBI1.60 1.70 1.64 1.64
Table 5. Summary of advances and weaknesses of the three products over mainland China.
Data TypeAdvancesWeaknesses
FY-2E QPELow latencyPoor data quality
Short time span
Limited coverage
FY-2G QPEBest data quality
Low latency
Short time span
Limited coverage
IMERG Final-runFine data quality
High temporal resolution
Long time span
Wide coverage
High latency
Not so satisfying performance at hourly and diurnal scales

