A Mapping Framework to Characterize Land Use in the Sudan-Sahel Region from Dense Stacks of Landsat Data

1
Department of Geographical Sciences, University of Maryland, College Park, MD 207040, USA
2
World Bank, 7 Rue Larbi Ben Abdellah, Rabat 10001, Morocco
3
World Bank, Plot 102 Yakubu Gowon Crescent Asokoro Abuja, Nigeria
*
Author to whom correspondence should be addressed.
Remote Sens. 2019, 11(6), 648; https://doi.org/10.3390/rs11060648
Submission received: 31 January 2019
/
Revised: 25 February 2019
/
Accepted: 12 March 2019
/
Published: 16 March 2019
(This article belongs to the Special Issue Remote Sensing in Dryland Assessment and Monitoring)
Abstract
:We developed a land cover and land use mapping framework specifically designed for agricultural systems of the Sudan-Sahel region. The mapping approach extracts information from inter- and intra-annual vegetation dynamics from dense stacks of Landsat 8 images. We applied this framework to create a 30 m spatial resolution land use map with a focus on agricultural landscapes of northern Nigeria for 2015. This map provides up-to-date information with a higher level of spatial and thematic detail resulting in a more precise characterization of agriculture in the region. The map reveals that agriculture is the main land use in the region. Arable land represents on average 52.5% of the area, higher than the reported national average for Nigeria (38.4%). Irrigated agriculture covers nearly 2.2% of the total area, reaching nearly 20% of the cultivated land when traditional floodplain agriculture systems are included, above the reported national average (0.63%). There is significant variability in land use within the region. Cultivated land in the northern section can reach values higher than 75%, most land suitable for agriculture is already under cultivation and there is limited land for future agricultural expansion. Marginal lands, not suitable for permanent agriculture, can reach 30% of the land at lower altitudes in the northeast and northwest. In contrast, the southern section presents lower land use intensity that results in a complex landscape that intertwines areas farms and larger patches of natural vegetation. This map improves the spatial detail of existing sources of LCLU information for the region and provides updated information of the current status of its agricultural landscapes. This study demonstrates the feasibility of multi temporal medium resolution remote sensing data to provide detailed and up-to-date information about agricultural systems in arid and sub arid landscapes of the Sahel region.

1. Introduction
In the last 30 years, the importance of earth observation remote sensing for monitoring land use and agricultural development over large areas has steadily grown. Remote sensing-based cropland monitoring is rapidly becoming operational [1,2,3,4], and a number of agricultural monitoring systems already forecasts yields and production for the main global regions [5,6,7]. Yet these advances have been geographically uneven and, while there has been remarkable progress in some regions, others have received considerably less attention. The Sudan-Sahel region in sub-Saharan Africa is a paradigmatic example. Beginning with [8], there have been a number of initiatives have studied land cover and land use trends in the region using Earth observation data [9,10,11,12,13,14]. Yet, the relatively limited weight at global scale of its agricultural production and the technical challenges posed by its dynamic agricultural systems dominated by small-scale agriculture have slowed down the adoption of remote sensing monitoring systems and limited the amount and quality of available land use information
Despite its relevance for human development and poverty alleviation, there is a lack of basic information on the distribution of cultivated land and the main land processes in the Sudan-Sahel region. The region is expected to experience major changes in the near future and land use information remains crucial in a region where agriculture represents the main livelihood strategy. Fertility rates among the highest in the developing world [15], and the increase in the rural population will accelerate the expansion of cultivated land for subsistence farming. The steady growth of urban population will fuel the demand for agricultural products, a major driver of land use change [16]. The consequences of climate change will likely disrupt agricultural practices and agricultural production in the region. Expected temperature increases by 2050 will shorten crop-growing cycles, leading to severe yield reduction and threatening food production systems [17,18,19]. Coping strategies to the changing conditions imposed by these two processes may lead to progressive land degradation, further compromising rural livelihoods and increasing their vulnerability to future internal and external shocks [20]. For instance, forced by climate change-related productivity decreases, farmers may overexploit soils or expand cultivated lands into more marginal lands.
Several global RS-based LCLUC products include coarse resolution land use information for the Sudan-Sahel region (e.g., MODIS MCS12Q1 and Globcover 2005 and 2009). These products have been integrated with national statistics to generate a more robust outcome [21]. However, while coarse spatial resolution data meet the observational requirements for the large agricultural regions of the world, they are not well suited for monitoring crops in regions with highly heterogeneous agricultural landscapes dominated by smaller farms such as those in the Sudan-Sahel region. Furthermore, the static nature of these products fails to capture the changes over time of agricultural systems in the region [22,23]. The opening of the Landsat archive in 2008–2009 [24] and more recently the launch of new medium resolution sensors (Landsat-8, Sentinel-2 DMC, etc.) offers unprecedented opportunities to study land-cover/land-use change (LCLUC) at higher spatial resolution. Several initiatives are already exploiting this new data with increasing processing capabilities to map agricultural landscapes with higher spatial detail, at scales more relevant to African agricultural processes. [25] global LCLU map at 30 m spatial resolutions included a cropland class [26] produced a nominal 30 m cropland extent map of continental Africa by using Sentinel-2 and Landsat-8 data (GFSAD30AFCE). This product represents a major improvement for food and water security assessments in an African context and a first step towards exploring, not only cropland extent but also crop type, intensity, and change. The European Space Agency released a prototype land cover 20 m map of Africa for 2016 with cropland as one of its classes (http://2016africalandcover20m.esrin.esa.int).
However, these products still present some limitations that hamper the extraction of information on land use dynamics for specific regions of Africa. Cropland systems across the continent are highly diverse and often adapted to very specific environmental conditions. The phenological signatures of the different land use types in a region can be very similar [26]. As a consequence, mapping croplands at continental level requires large and up to date training and validating datasets [26]. While high-resolution imagery and crowdsourcing [27] are gaining ground as a source of training and validating data, training and validating field data in remote regions remain scarce, constraining the precision of supervised learning algorithms. Consequently, continental and global medium resolution products that implement a single mapping approach cannot always offer the flexibility to provide an accurate characterization of land use processes in specific regions of the continent.
Northern Nigeria presents a paradigmatic and concrete example of a data-poor region where land use information is crucial for human development. Poverty indicators of Nigeria over the last decade show a growing north–south divide [15]. While poverty rates are only 16% in the south of the country, an estimated 50.2% of the population lives below the poverty line in the north, where up to seventy percent of households rely primarily on agriculture [15]. Ongoing land cover change and land use processes compromise the main livelihood strategies of these households, reduce their adaptation alternatives and thus, increase their vulnerability. Yet, the lack of consistent and reliable land use information hinders the accurate characterization of the agricultural sector in northern Nigeria. As the linkages between climate change, crop failures, poverty, migration, and conflict become more explicit in the research literature, it becomes urgent to monitor land use processes in the region as a first step to inform decision makers and design and implement efficient policy interventions in agricultural development and poverty alleviation.
This work proposes a mapping approach specifically designed for agricultural systems of the Sudan-Sahel region aiming to overcome some of these limitations of global and continental scale remote sensing products in the region. This mapping approach makes extensive use of expert knowledge of vegetation dynamics and exploits dense stacks of Landsat 8 imagery to capture inter and intra annual vegetation dynamics and improve the characterization of the main land use types in the study region. The proposed mapping framework is flexible and robust to operate with limited imagery, and can be easily and rapidly updated in successive years. We have applied this approach to produce a 30 m spatial resolution land cover land use map with emphasis on agricultural classes. This work aims to fill a gap of information and provide a precise and up-to-date assessment of agricultural systems in northern Nigeria.
2. Materials and Methods
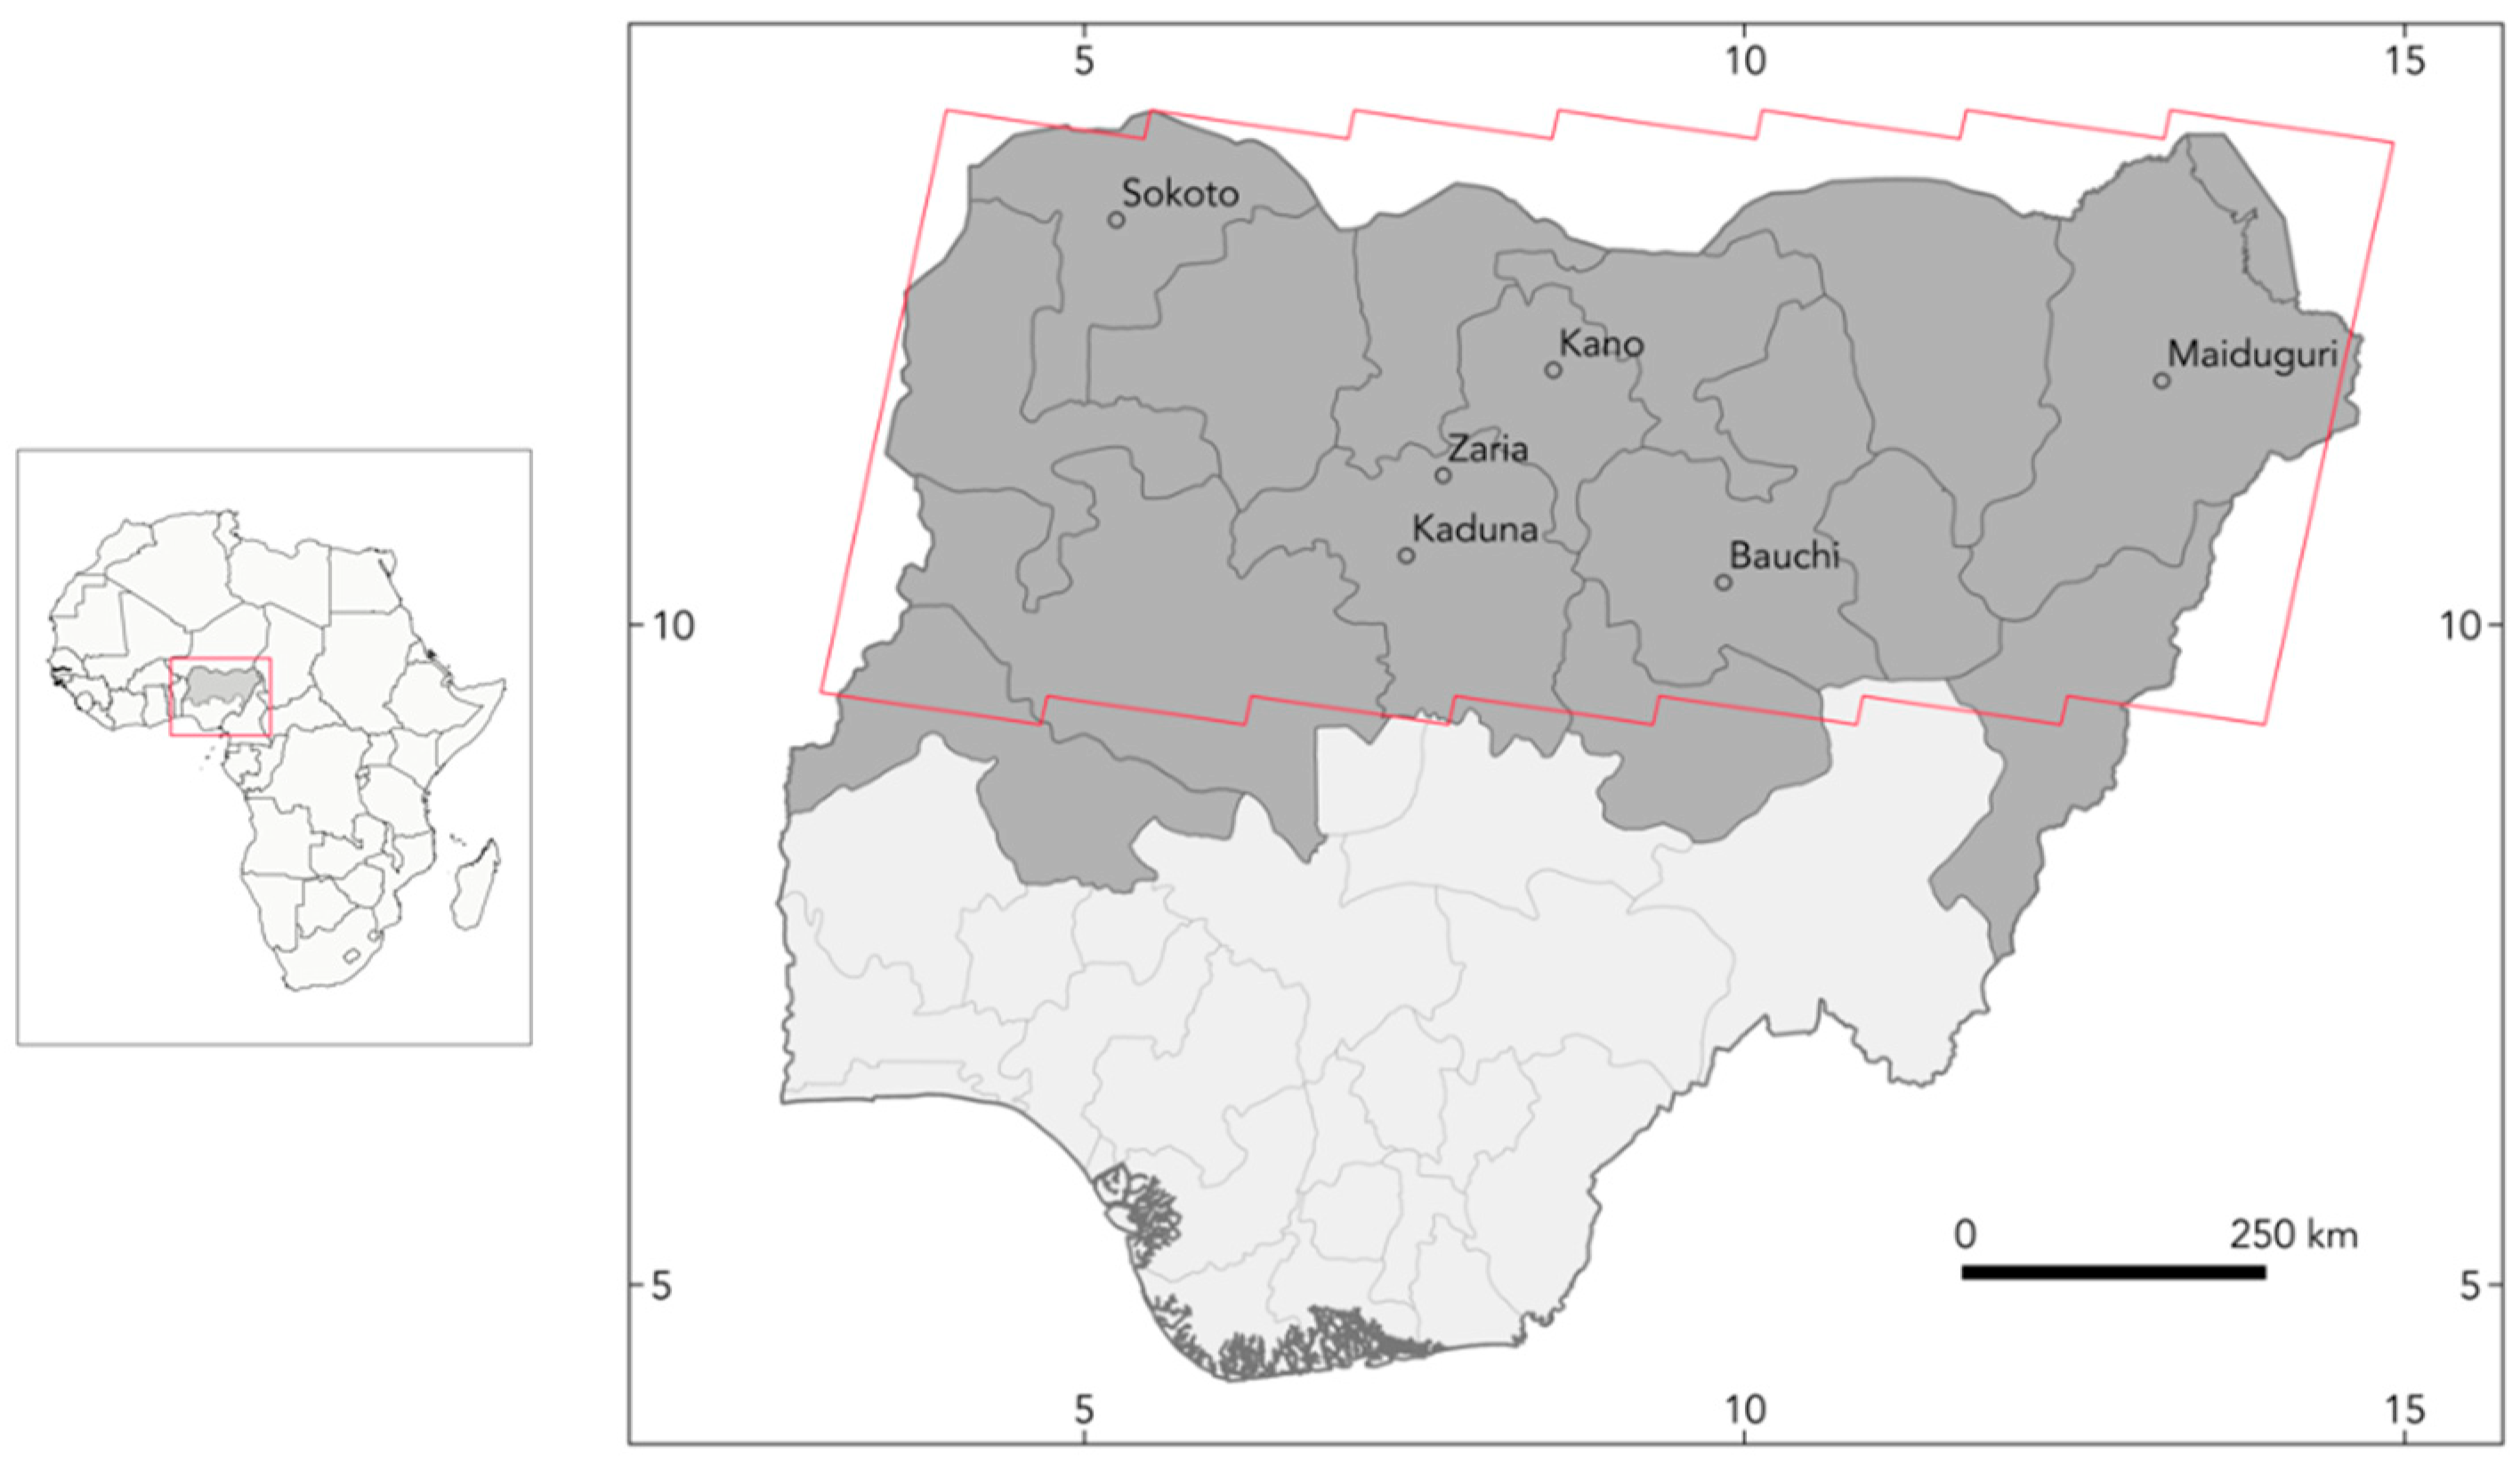
The area of study is northern Nigeria, defined as the region lies on the 9.3 degrees latitude line and borders Niger to the north, Cameroon and Chad to the east and Benin and Niger to the west. This region covers an area of 494,000 km2 and includes the states of Bauchi, Borno, Gombe, Jigawa, Kano, Katsina, Kebbi, Sokoto, Yobe, and Zamfara, and parts of Adamawa, Kaduna, Kwara, Niger, and Plateau. Northern Nigeria is part of the Sudan and Sahel savannas agro-ecological zones (Figure 1). These warm tropical arid and semiarid zones are characterized by clearly defined dry and rainy seasons following a strong rainfall latitudinal gradient. Annual precipitations in the region range from below 400 mm in the northeast to 1500 mm per year in the higher elevations of the south. The elevation in the study area ranges between 100 and 1300 m above sea level. Lower elevations are found in the Benue River valley to the west and the Gongola river valley and the Chad Lake depression to the east. From these regions, there is a gradual transition to higher elevation areas in the central part of the study area in the Kaduna, Bauchi, Gombe, Kano, and Katsina states. The highest elevations are found in the south, in the Jos plateau.
The study area was covered by 21 Landsat scenes (Paths: 185 to 191; Rows: 51 to 52). The analysis included close to 1450 Landsat 8 Collection 1 Tier 1 calibrated top-of-atmosphere reflectance (TOA) acquired between 2014 and 2016 [28]. The inclusion of images for a three-year period served to capture interannual dynamics required to characterize some land surfaces in the study area. For each Landsat scene approximately 69 images were stacked during this period. TOA images were chosen over top of canopy images given the difficulties of accurately estimating aerosol properties and its spatial distribution [29]. Dust loaded airmass from the Sahara Desert (harmattan winds) can occur up to 100 days per year during the dry season in the Sudan-Sahel region. This dust modifies the spectral signatures of land surfaces and results in lower vegetation index values.
Images were not discarded based on cloud coverage, since cloud free pixels in densely cloudy images could still provide valuable information within the proposed mapping framework. Digital elevation data from the Shuttle Radar Topography Mission (SRTM), [30] at 30 m spatial resolution was used to define floodplains. Given its focus on agricultural landscapes, urban areas were not directly mapped. Instead, urban pixels were extracted from the Global Human Built-up and Settlement Extent (HBASE) Dataset from Landsat product [31]. This product provides global 30 m spatial resolution information on settlement extent for year 2010.
We developed a land cover land use (LCLU) mapping framework adapted to agricultural landscapes of the Sudan-Sahel ecological region. This approach was applied to produce a 30 m resolution map of northern Nigeria for baseline year 2015. The mapping framework implemented a knowledge-based expert system (KBES) that relied on dense stacks of Landsat 8 images and exploits inter and intra annual vegetation dynamics and contextual information to map the main components of land surfaces in the study region [32]. Recent research highlights the role of expert knowledge to advance remote sensing-based agricultural monitoring [33]. KBES enable the inclusion of knowledge from experts in the field of the analysis even if they do not have remote sensing experience (e.g., field extension agents). These systems constitute a useful alternative when the lack of consistent training and validation data limits the use of supervised learning systems. Expert knowledge is commonly stored as a set of rules in a knowledge base. Subsequently, the information in the knowledge base is passed to an inference mechanism interprets that assigns class memberships to pixels. KBES have been successfully implemented in a number of applications such as protected areas conservation [34], crop classification [35,36,37,38], or urban mapping [39].
We built a knowledge base that established production rules using spectral, temporal, and spatial constraints to identify the main agricultural systems and natural vegetation types in the study area [35]. The production rules were not necessarily conclusive but provided a degree of evidence in favor of some class label [40]. These rules were defined from the analysis of the spectral profiles during the vegetative cycles of the different land use types. Specific temporal windows were selected to maximize the separability between classes using expert knowledge in the seasonal dynamics of land surfaces in the study area (Figure 2). Similar strategies have been previously used for land cover and land use in tropical environments [41,42]. The numerical values in the spectral rules were provided as thresholds empirically generated from observed data [43]. These spectral thresholds were defined based on a training dataset of 1750 points of known land use types randomly searched using visual interpretation of a combination of Landsat and very high-resolution imagery (Google Earth) for the period of study. The thresholds for each land use class were calculated from the statistical distribution of pixel values in the training dataset. The spectral rules were built based on normalized difference vegetation index (NDVI) images [8] calculated from each image in the original dataset. This vegetation index was chosen because, besides data compression, it facilitates the interpretation of land surface dynamics over time and the definition of spectral thresholds. The presence of burned areas in natural vegetation surfaces within the three-year imagery epoch was interpreted as a sing of land cover transition, supporting the labeling as non-stable natural vegetation pixels.
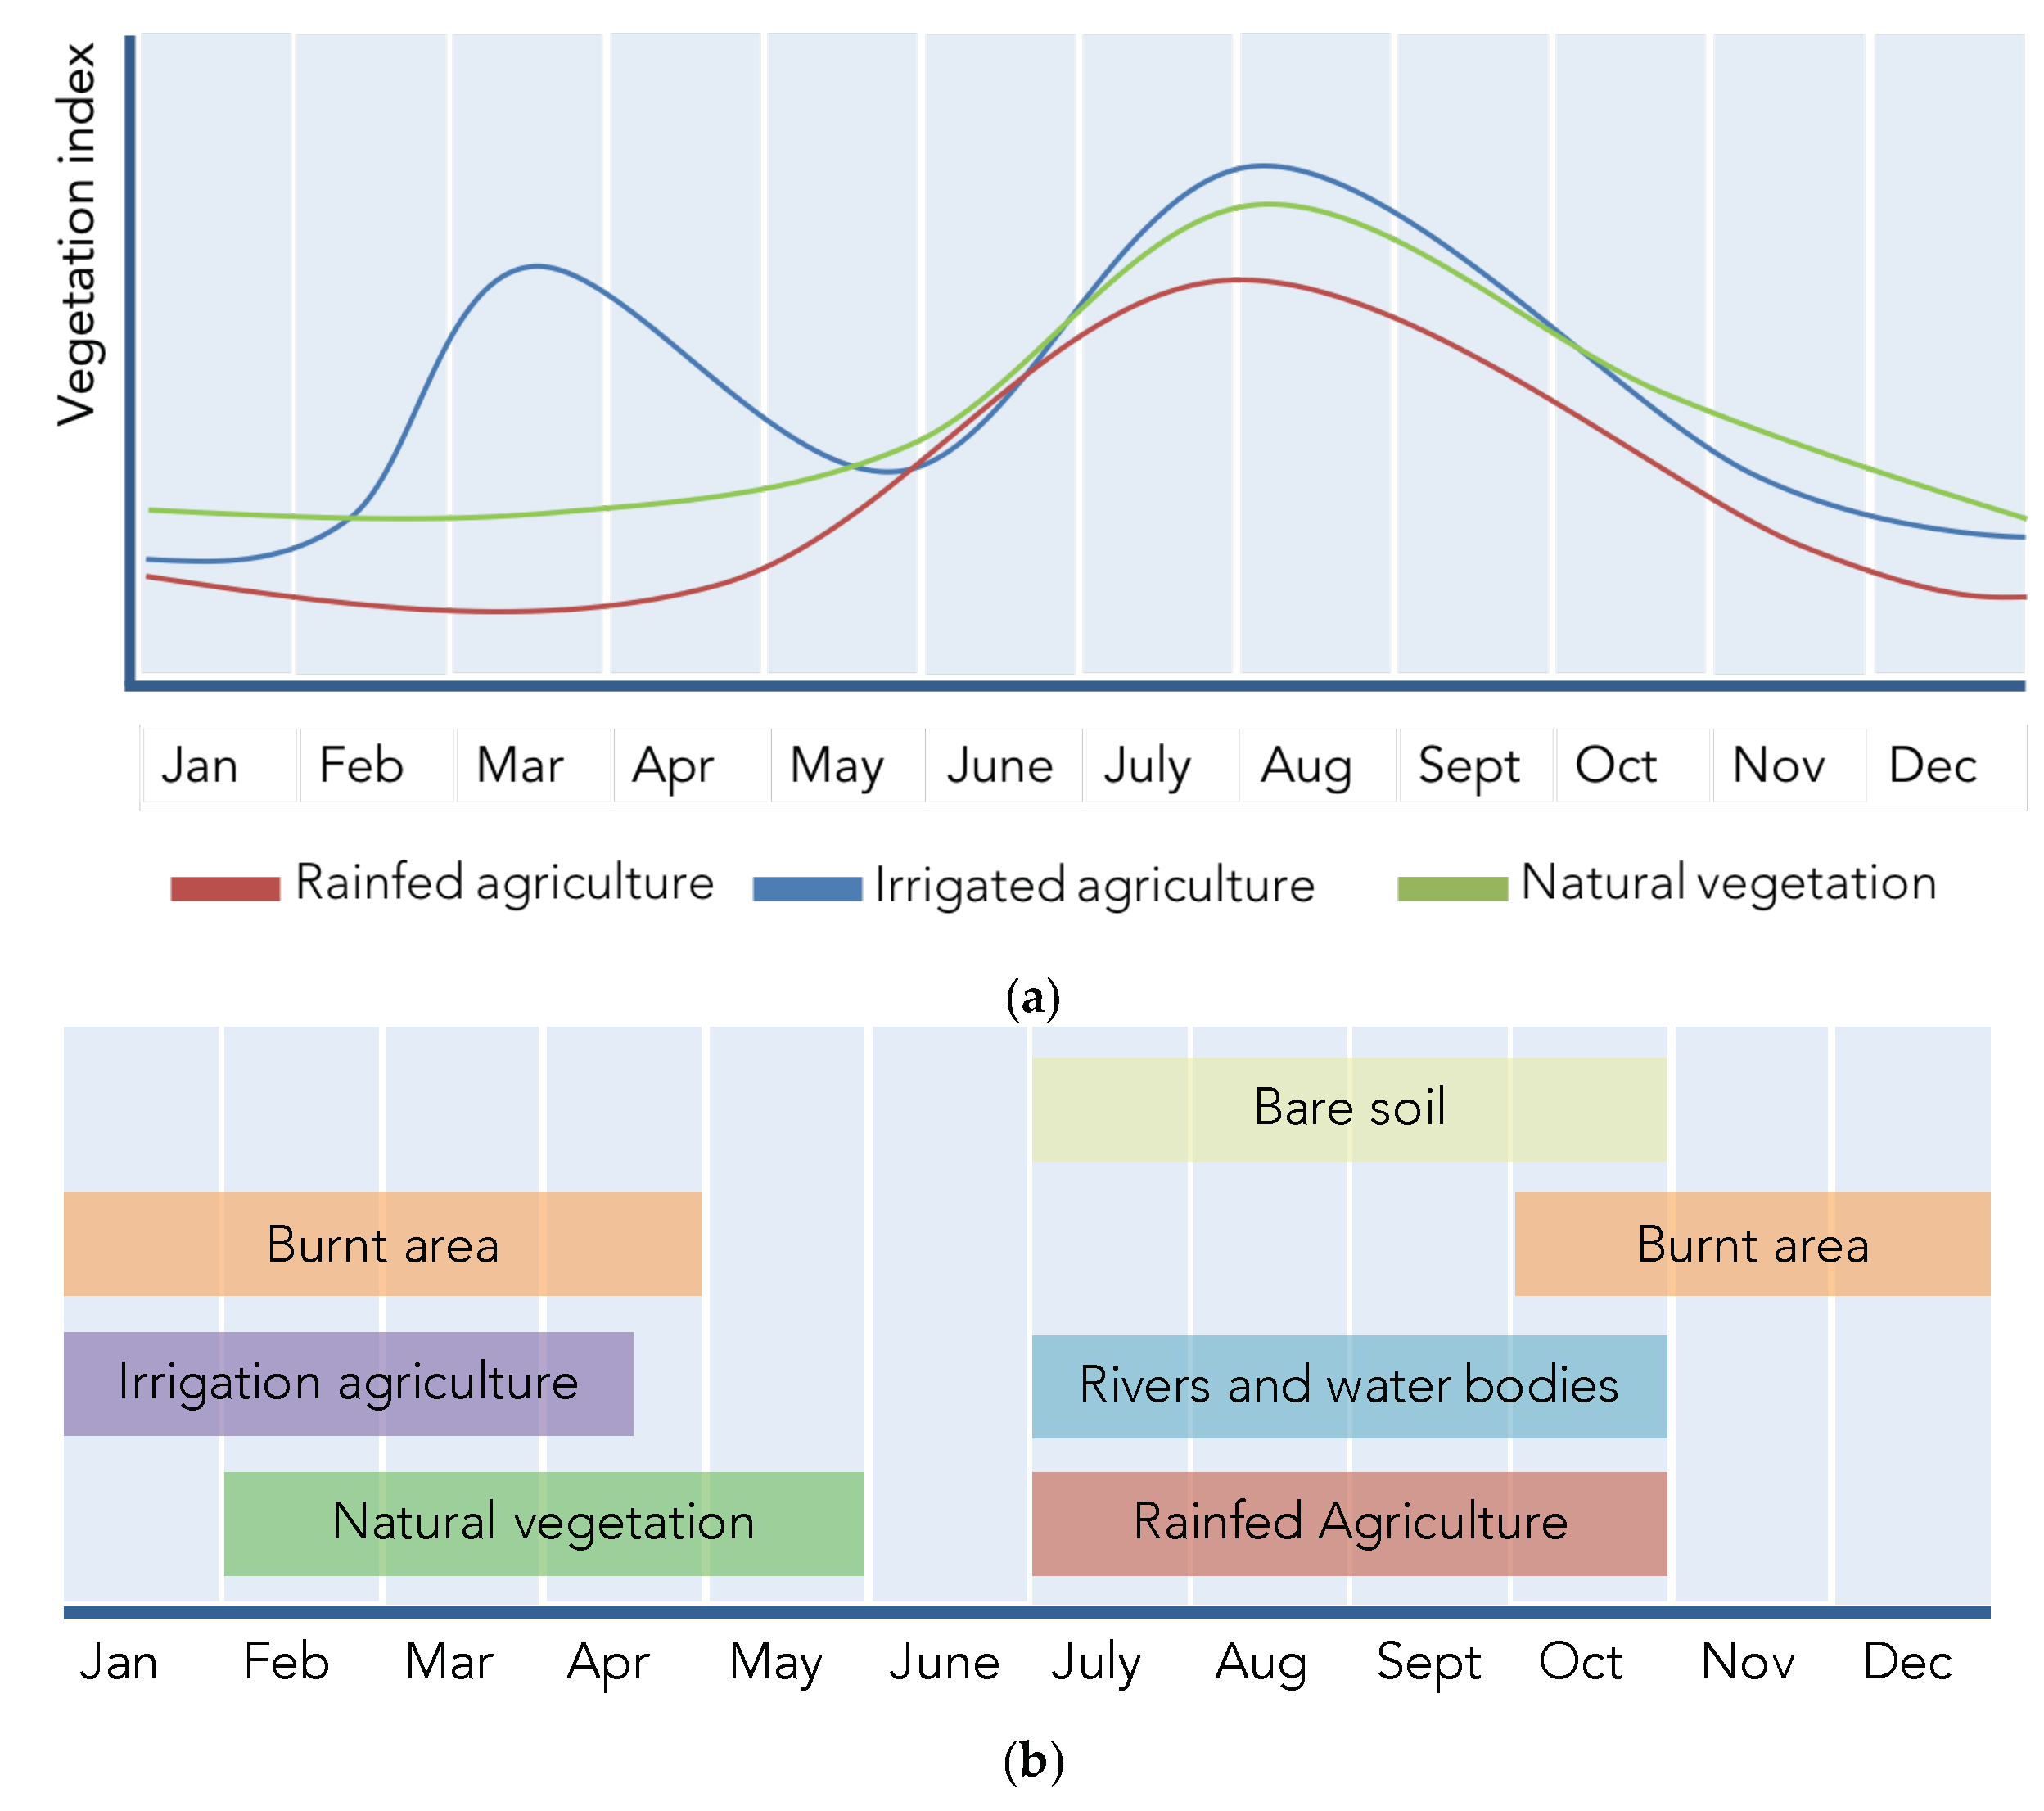
The rules in the knowledge base were designed to identify the following agricultural systems and natural vegetation types: (1) stable natural vegetation; (2) non-stable natural vegetation; (3) rain-fed agriculture; (4) irrigation agriculture; (5) bare soil; and (6) rivers and water bodies (Table 1). Each of these components presents distinct seasonal dynamics (Figure 2). For instance, the vegetative cycle of natural vegetation and rain-fed agriculture follows closely rain patterns, with higher NDVI [41] values during the rainy season (July–October) and low values during the dry season. However, there are distinct differences between them. Rainy season NDVI values of rain-fed agriculture are comparatively lower than those of natural vegetation because planting densities do not commonly cover the ground completely. Equally, during the dry season, the exposed soils of cultivated lands result in lower NDVI values than natural vegetation, where dormant and dry vegetation covers the ground resulting in higher NDVI values. Irrigation agriculture relies on groundwater aquifers and irrigation systems that can result in extended growing seasons and several vegetative cycles within a year. Because of its higher planting densities, NDVI are commonly higher than those of rain-fed agriculture. Bare soils present very low NDVI values all year around and water bodies and rivers have negative NDVI values during the rainy season. Irrigation agriculture was mapped through a combination of spectral and contextual constraints as cultivated areas within floodplains whose vegetative cycle did not follow annual precipitation. Floodplains were identified areas of low slope extracted from a digital elevation model (SRTM) within the neighborhood of rivers and water bodies. A detailed description of the rules in the knowledge base can be found in the Supplementary Materials.
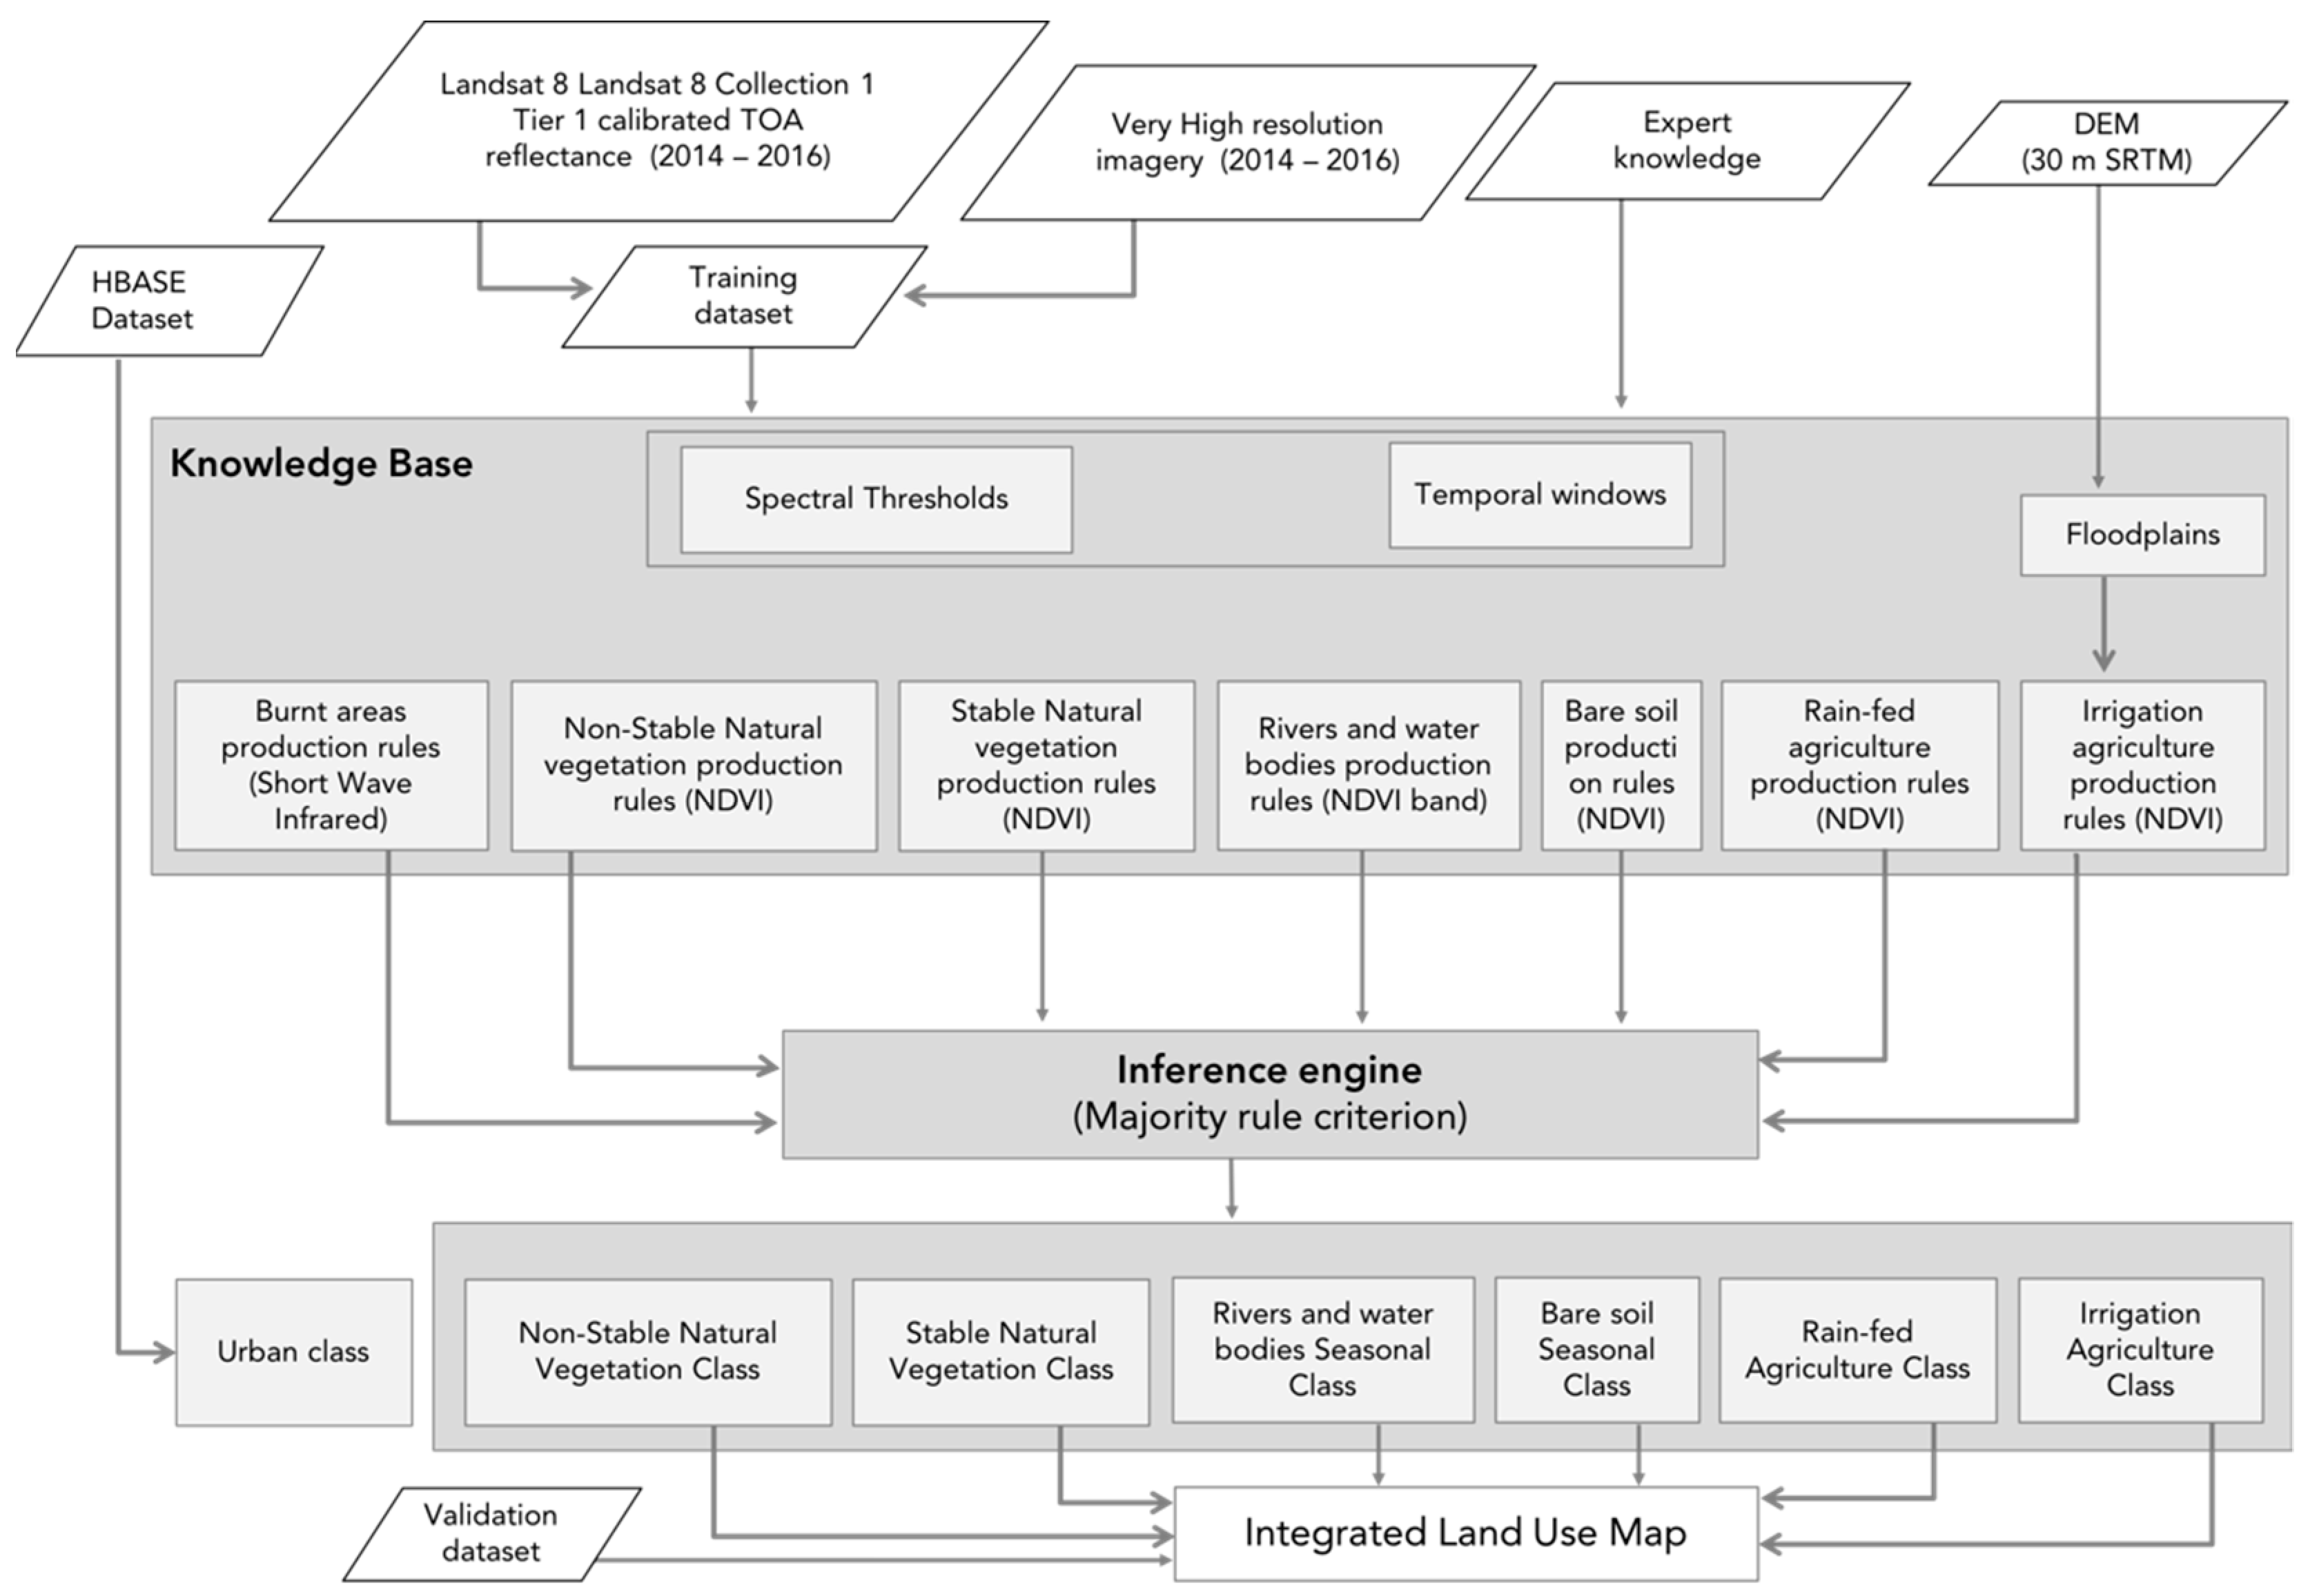
The rules were applied to all available images during the defined temporal windows and imposed initial preconditions for class membership. The KBES inference mechanism analyzed the set of rules, resolved potential redundancies, and inconsistencies and made decisions about class membership using a majority rule criterion [32] (Figure 3). This approach reduced the potential impact of individual aerosol contaminated images in the mapping process.
An uncertainty flag was risen when the number of available observations during the temporal window was below a pre-established number due to cloud coverage (n = 5). This was often the case for rain-fed agriculture based on observations during the rainy season temporal window. In these cases, alternative approach and applied the rules of the knowledge base to a NDVI maximum value composite from all images available during the temporal window.
The map was validated against an independent dataset of 754 ground points spread over the study region. Validation points were identified through a combination of visual interpretation of very high-resolution images for year 2015 (Google Earth) and known locations in true color Landsat 8 images.
The analysis was carried out on per-scene basis. Outputs from individual scenes were subsequently mosaicked in a final map at 30 m resolution covering the whole study area. The implementation of the KBES and data processing was carried out in Google Earth Engine cloud-based platform.
3. Results
We created a 30 m spatial resolution LCLU map with a focus on agricultural landscapes in northern Nigeria for year 2015 (Figure 4 and Figure 5). The validation of the map against an independent dataset of ground points resulted in an overall accuracy of 0.91 and kappa coefficient of 0.89. Accuracies were consistent throughout the classes with individual user and producer accuracies above 0.82 and 0.85, respectively (Table 2).
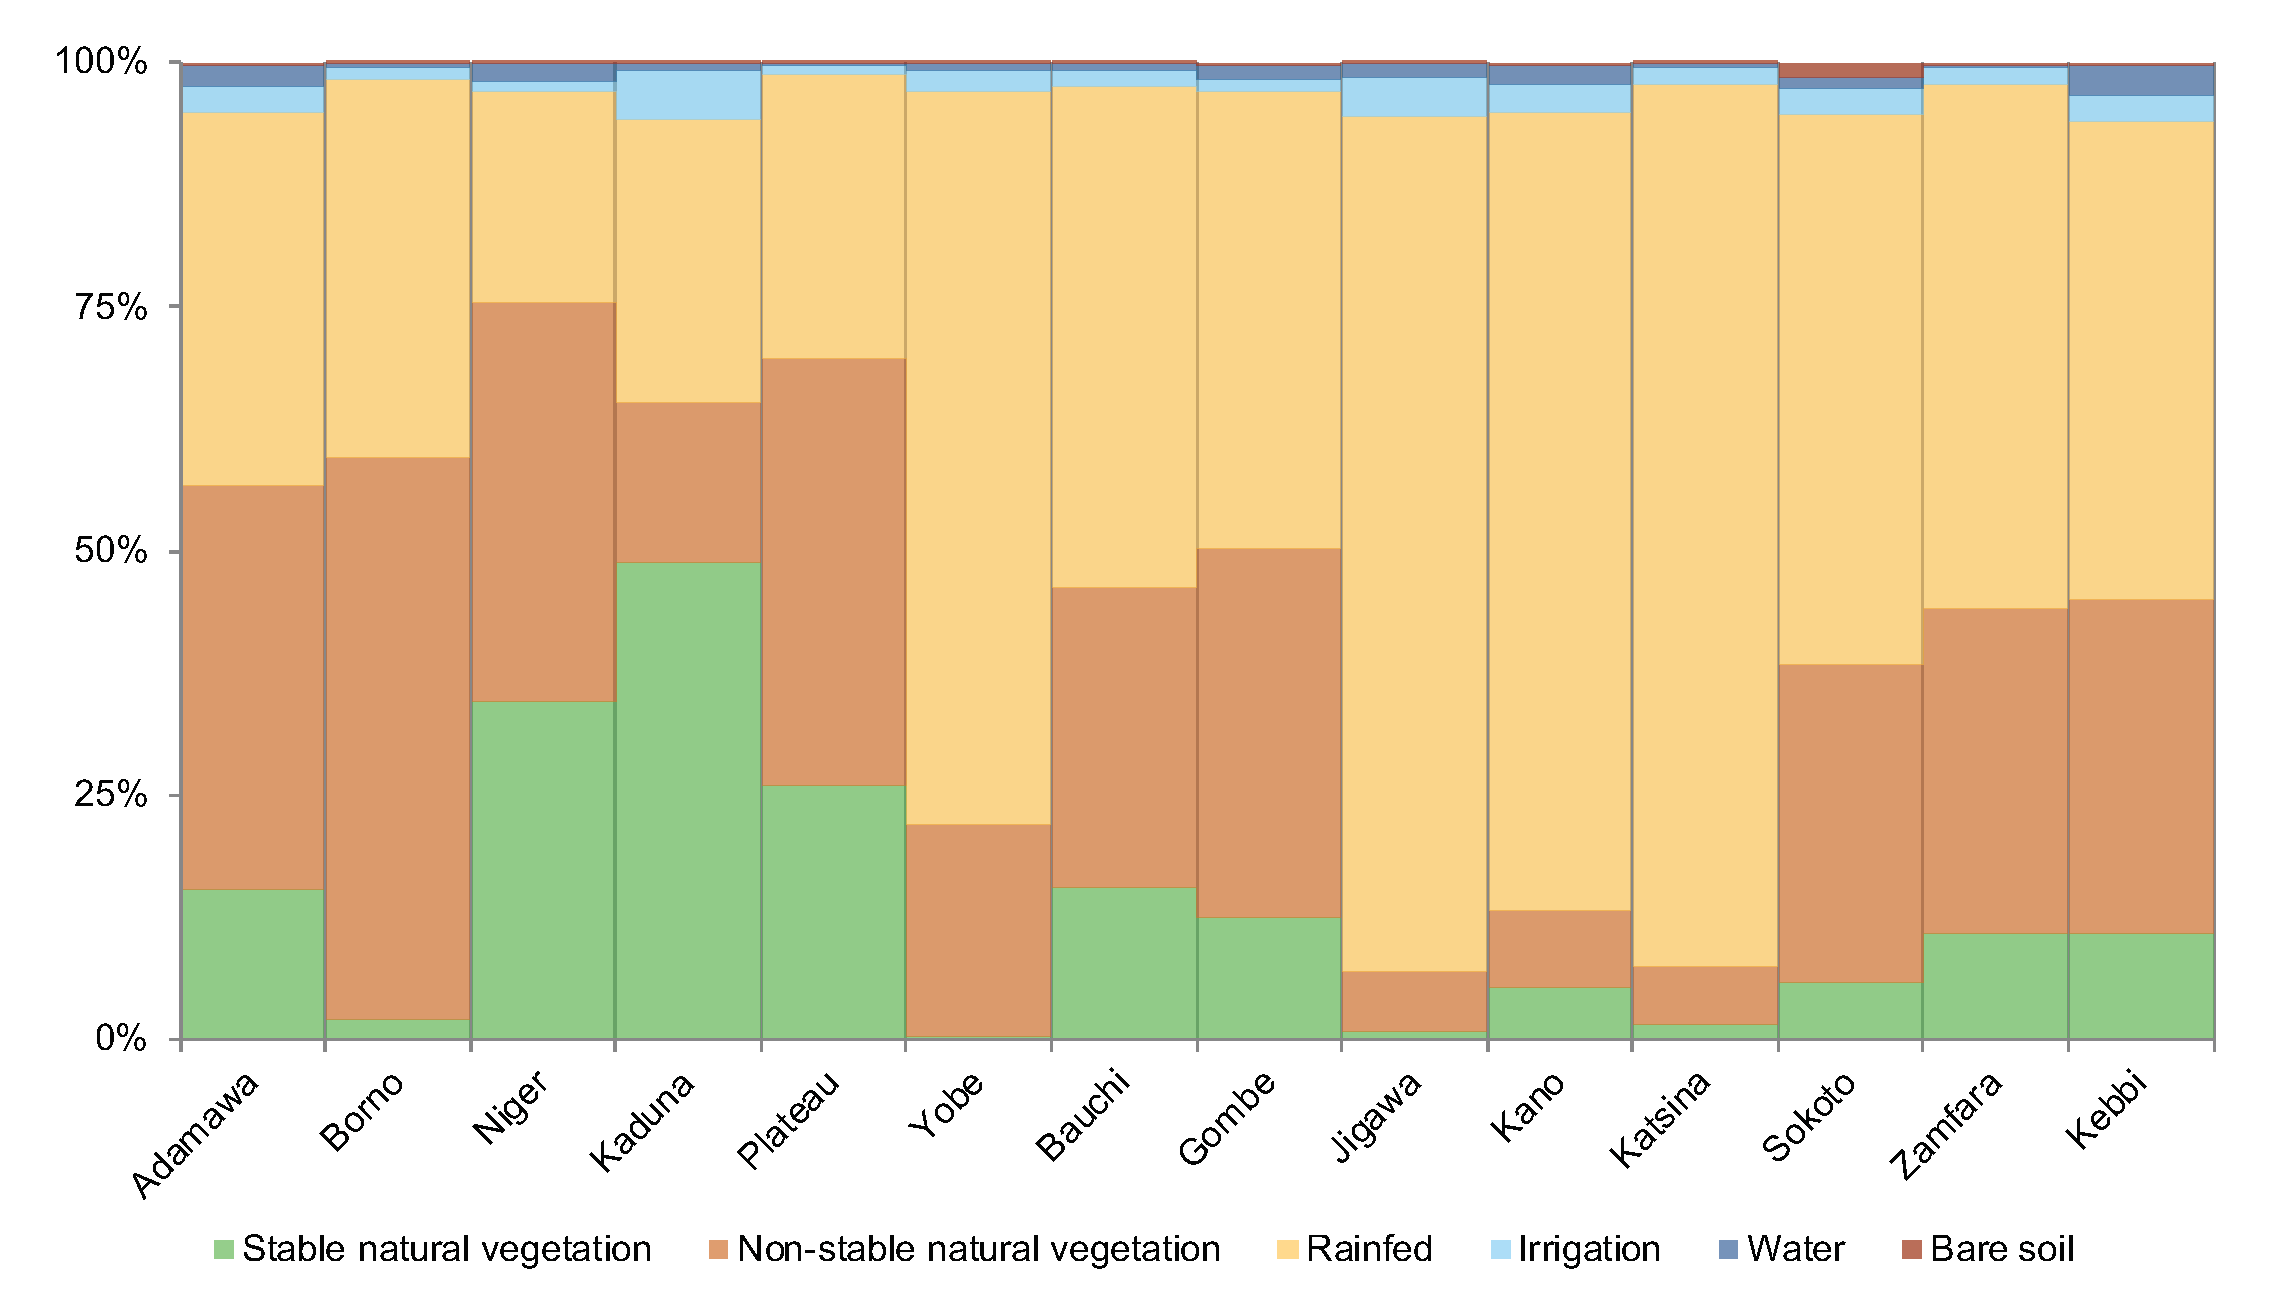
The map shows that agriculture is the dominant land use in northern Nigeria with more than 52% of the land under cultivation. The largest proportion corresponds to rain-fed agriculture (50%) and irrigation agriculture covers about 2% of the land. Natural vegetation occupies 46% of the land from which 14% corresponds to stable natural vegetation cover and 24% to areas of non-stable vegetation cover. From the latter, 7.2% corresponds to land burnt at least once over the 2014–2016 period and suggests an ongoing land transformation process. The remaining 16.8% corresponds to land that, while covered by natural vegetation, was cultivated at some point during the period of study and is likely to be associated to fallow fields. Other surfaces such as bare soil and water occupy less than 2% of the land on total (Figure 6).
The spatial distribution of land use in the map illustrates the geographical variability of land uses within the region, closely related to precipitation and controlled by latitudinal and elevation gradients. The northern section of the study region presents larger extents of croplands, where cultivated fields dominate the landscape in which patches of trees, shrub and fallow land cover no more than 10 and 20% of the land. Natural vegetation is restricted to isolated remnants in marginal agricultural lands. In contrast, the southern section includes larger proportions of natural vegetation. Cropland is less dominant and often part of a mosaic of cultivated fields and natural vegetation. While the proportion of land under cultivation in the southern states is below 50% it can exceed 80% in some of the north states (Jigawa, Kano, and Katsina).
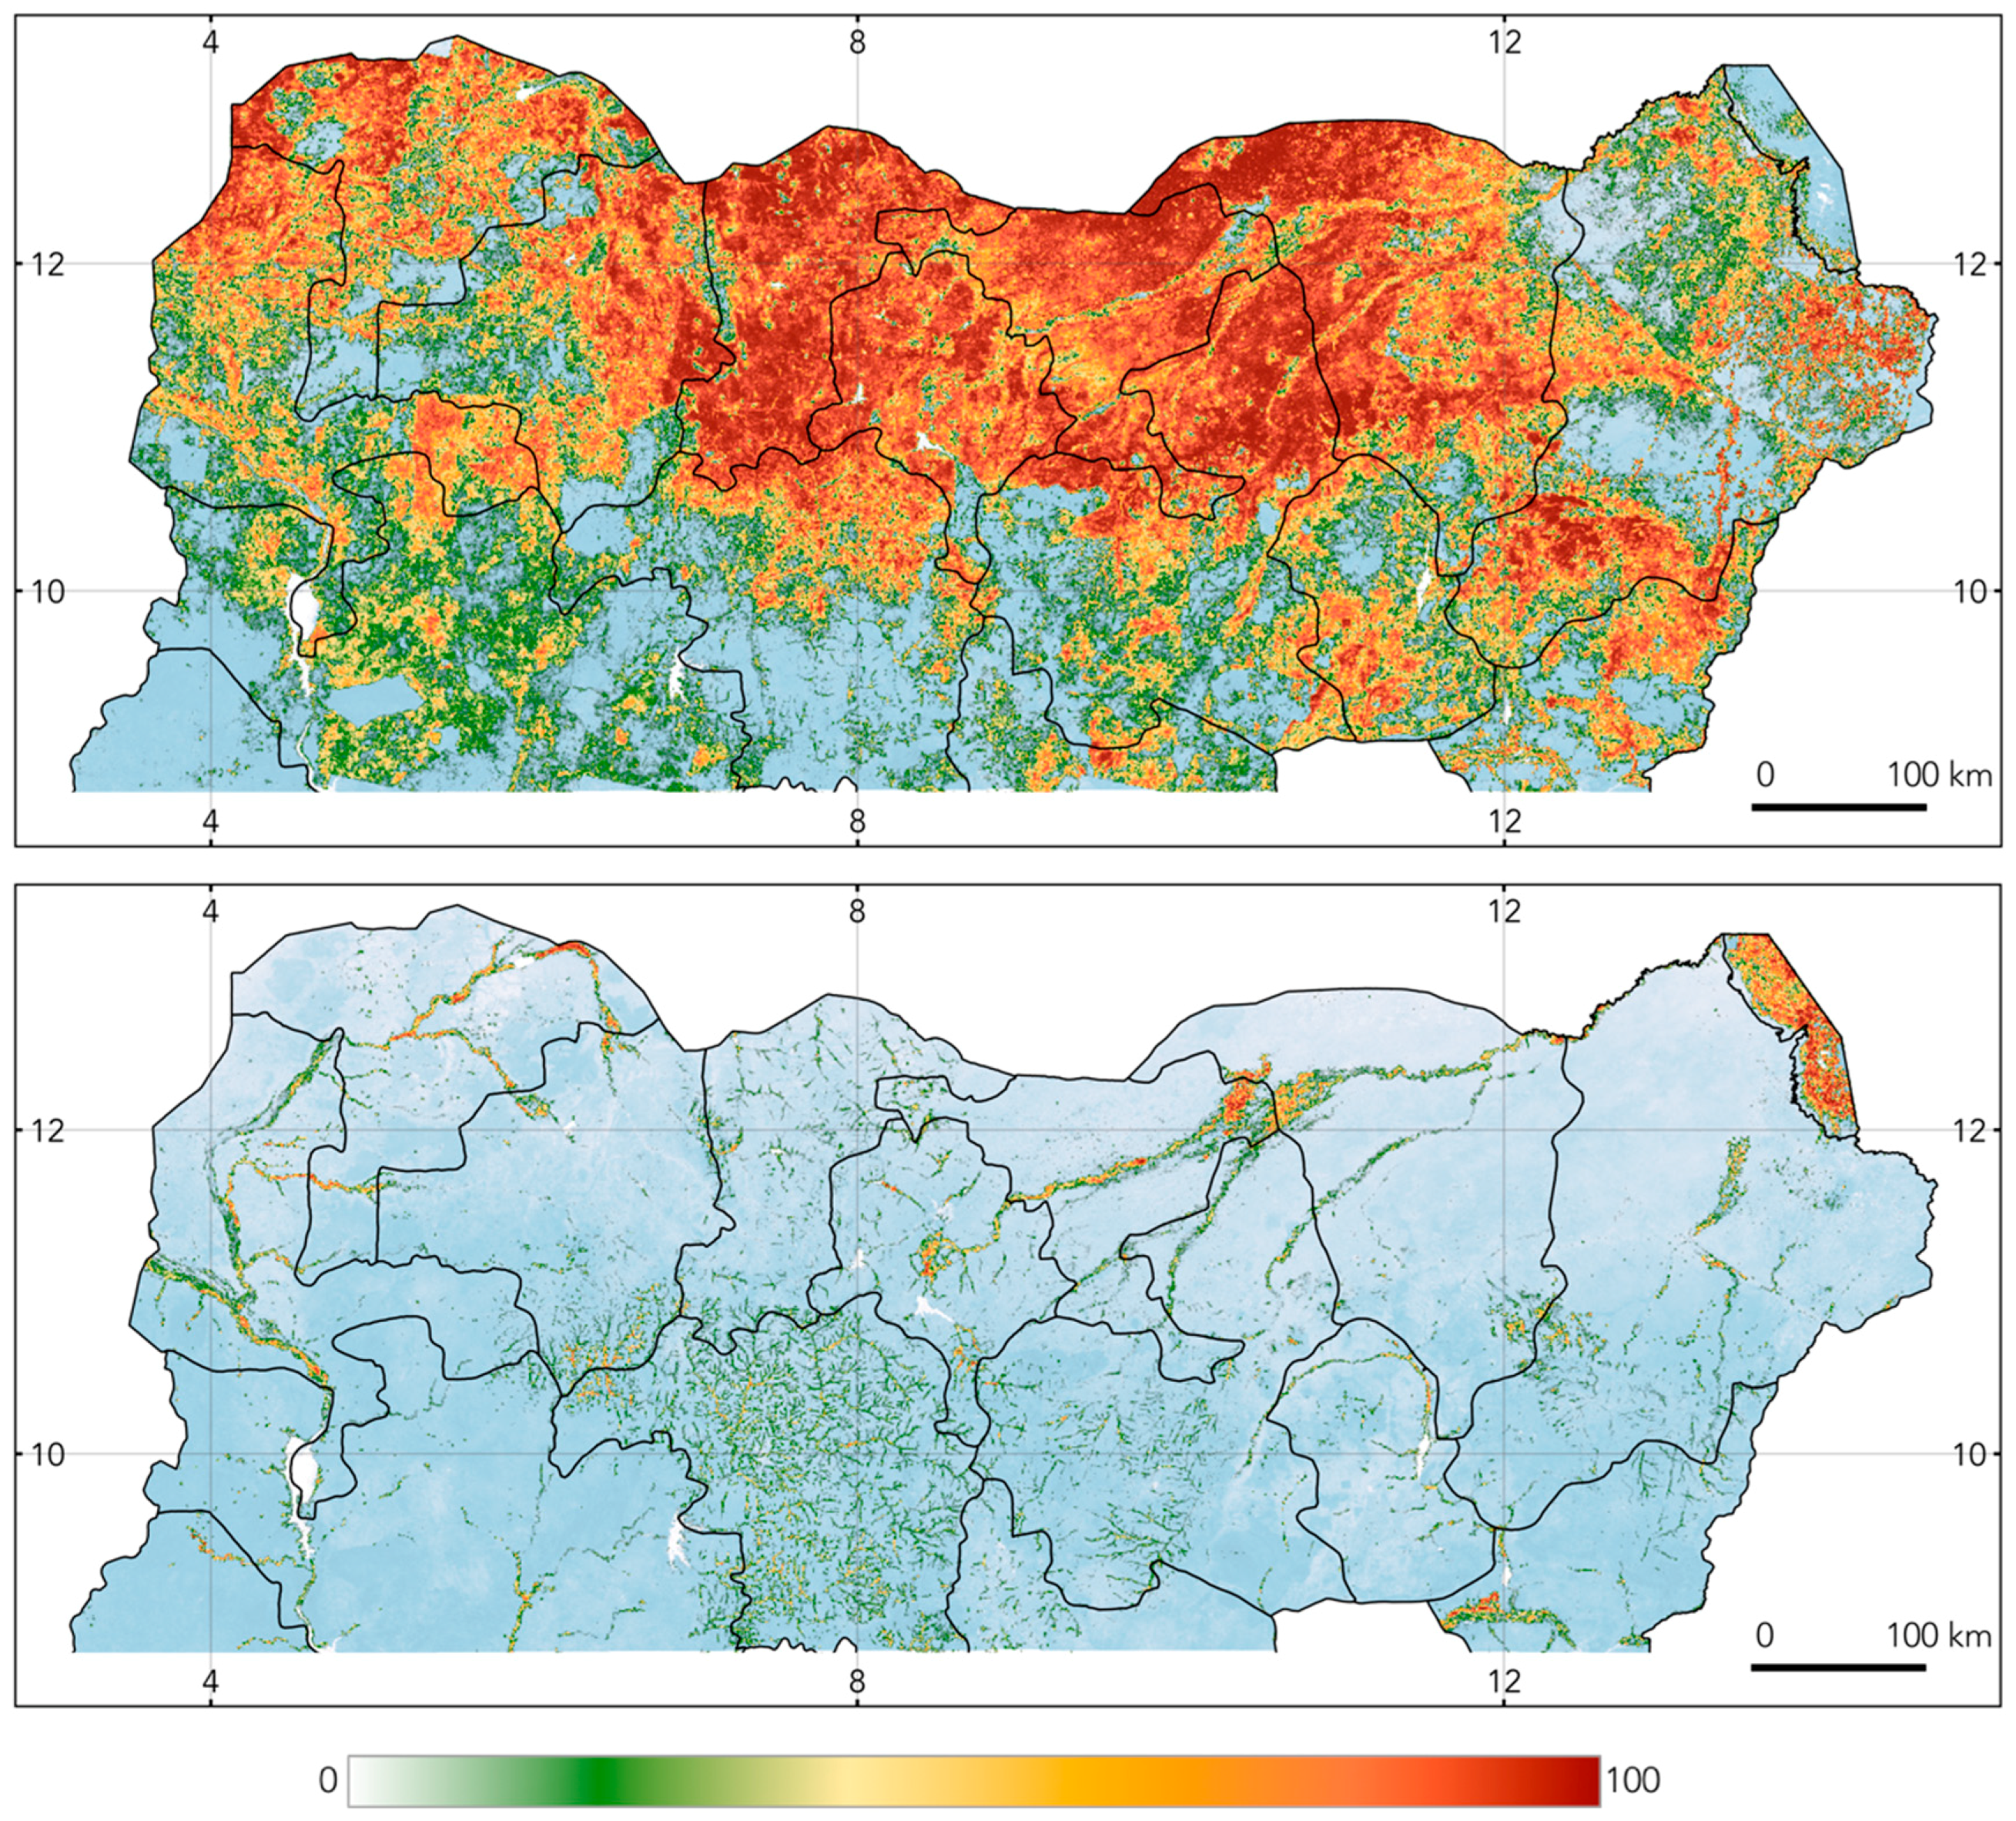
Floodplains represent the most fertile agricultural land in arid and sub-arid ecosystems. Irrigated agriculture in the region is confined to river floodplains. Up to 74% of these floodplains are cultivated, from which 19 percent is associated with major irrigation schemes, and the remaining 55% applies traditional forms of water management. States with complex hydrographic networks or large floodplains associated to the main rivers of the region have significantly higher irrigated areas than the regional average. Thus, while on average irrigation agriculture covers 2.2% of the land, it reaches up to 5% of the total area in Kaduna state.
The spatial aggregation of the original 30 m product provides additional information about the structure of the landscapes in the study region and shows that areas dominated by croplands can still contain a significant share of natural vegetation (Figure 7 and Figure 8). In the south of the study area this landscape fragmentation is associated with a mosaic structure while in the north it is related to agroforestry systems, where cultivated fields and low-density trees share the land.
4. Discussion
We have developed a land cover—land use mapping framework specifically designed for the Sudan-Sahel region. The approach relies on dense stacks of Landsat 8 imagery and seasonal metrics to address the peculiarities of the region and it is flexible and robust to operate with limited number of observations as a consequence of cloud and dust contamination. To overcome the scarcity of reliable in situ data in the region, this mapping framework uses extensive knowledge on phenological cycles and ecosystem processes in the Sudan-Sahel region and extracts information from temporal windows that maximize the spectral separability of the relevant land surfaces [18]. Finally, it applies an acquisition window of several years to allow a solid characterization of dynamic land use types that involve a multiyear cycle. This mapping framework has been applied to produce a 30 m spatial resolution map for northern Nigeria. Northern Nigeria lacks a comprehensive land survey scheme to collect agricultural data. As a consequence, LCLU information in the region is scarce and outdated. Without specific and up to date information on the state of agriculture, preexisting and misguided narratives based on limited and uncertain data shape the discussion in the development community. The resulting map provides information about spatial distribution of land use in northern Nigeria with higher spatial resolution and thematic detail than existing remote sensing-based products. By mapping features more closely linked with the livelihood of rural population, this map provides valuable information for the design and implementation of effective rural development and poverty alleviation interventions. The framework can potentially be expanded to other areas within the Sudan-Sahel ecozone and replicated in successive years to monitor the evolution of agricultural systems over time, setting the basis for an agricultural monitoring.
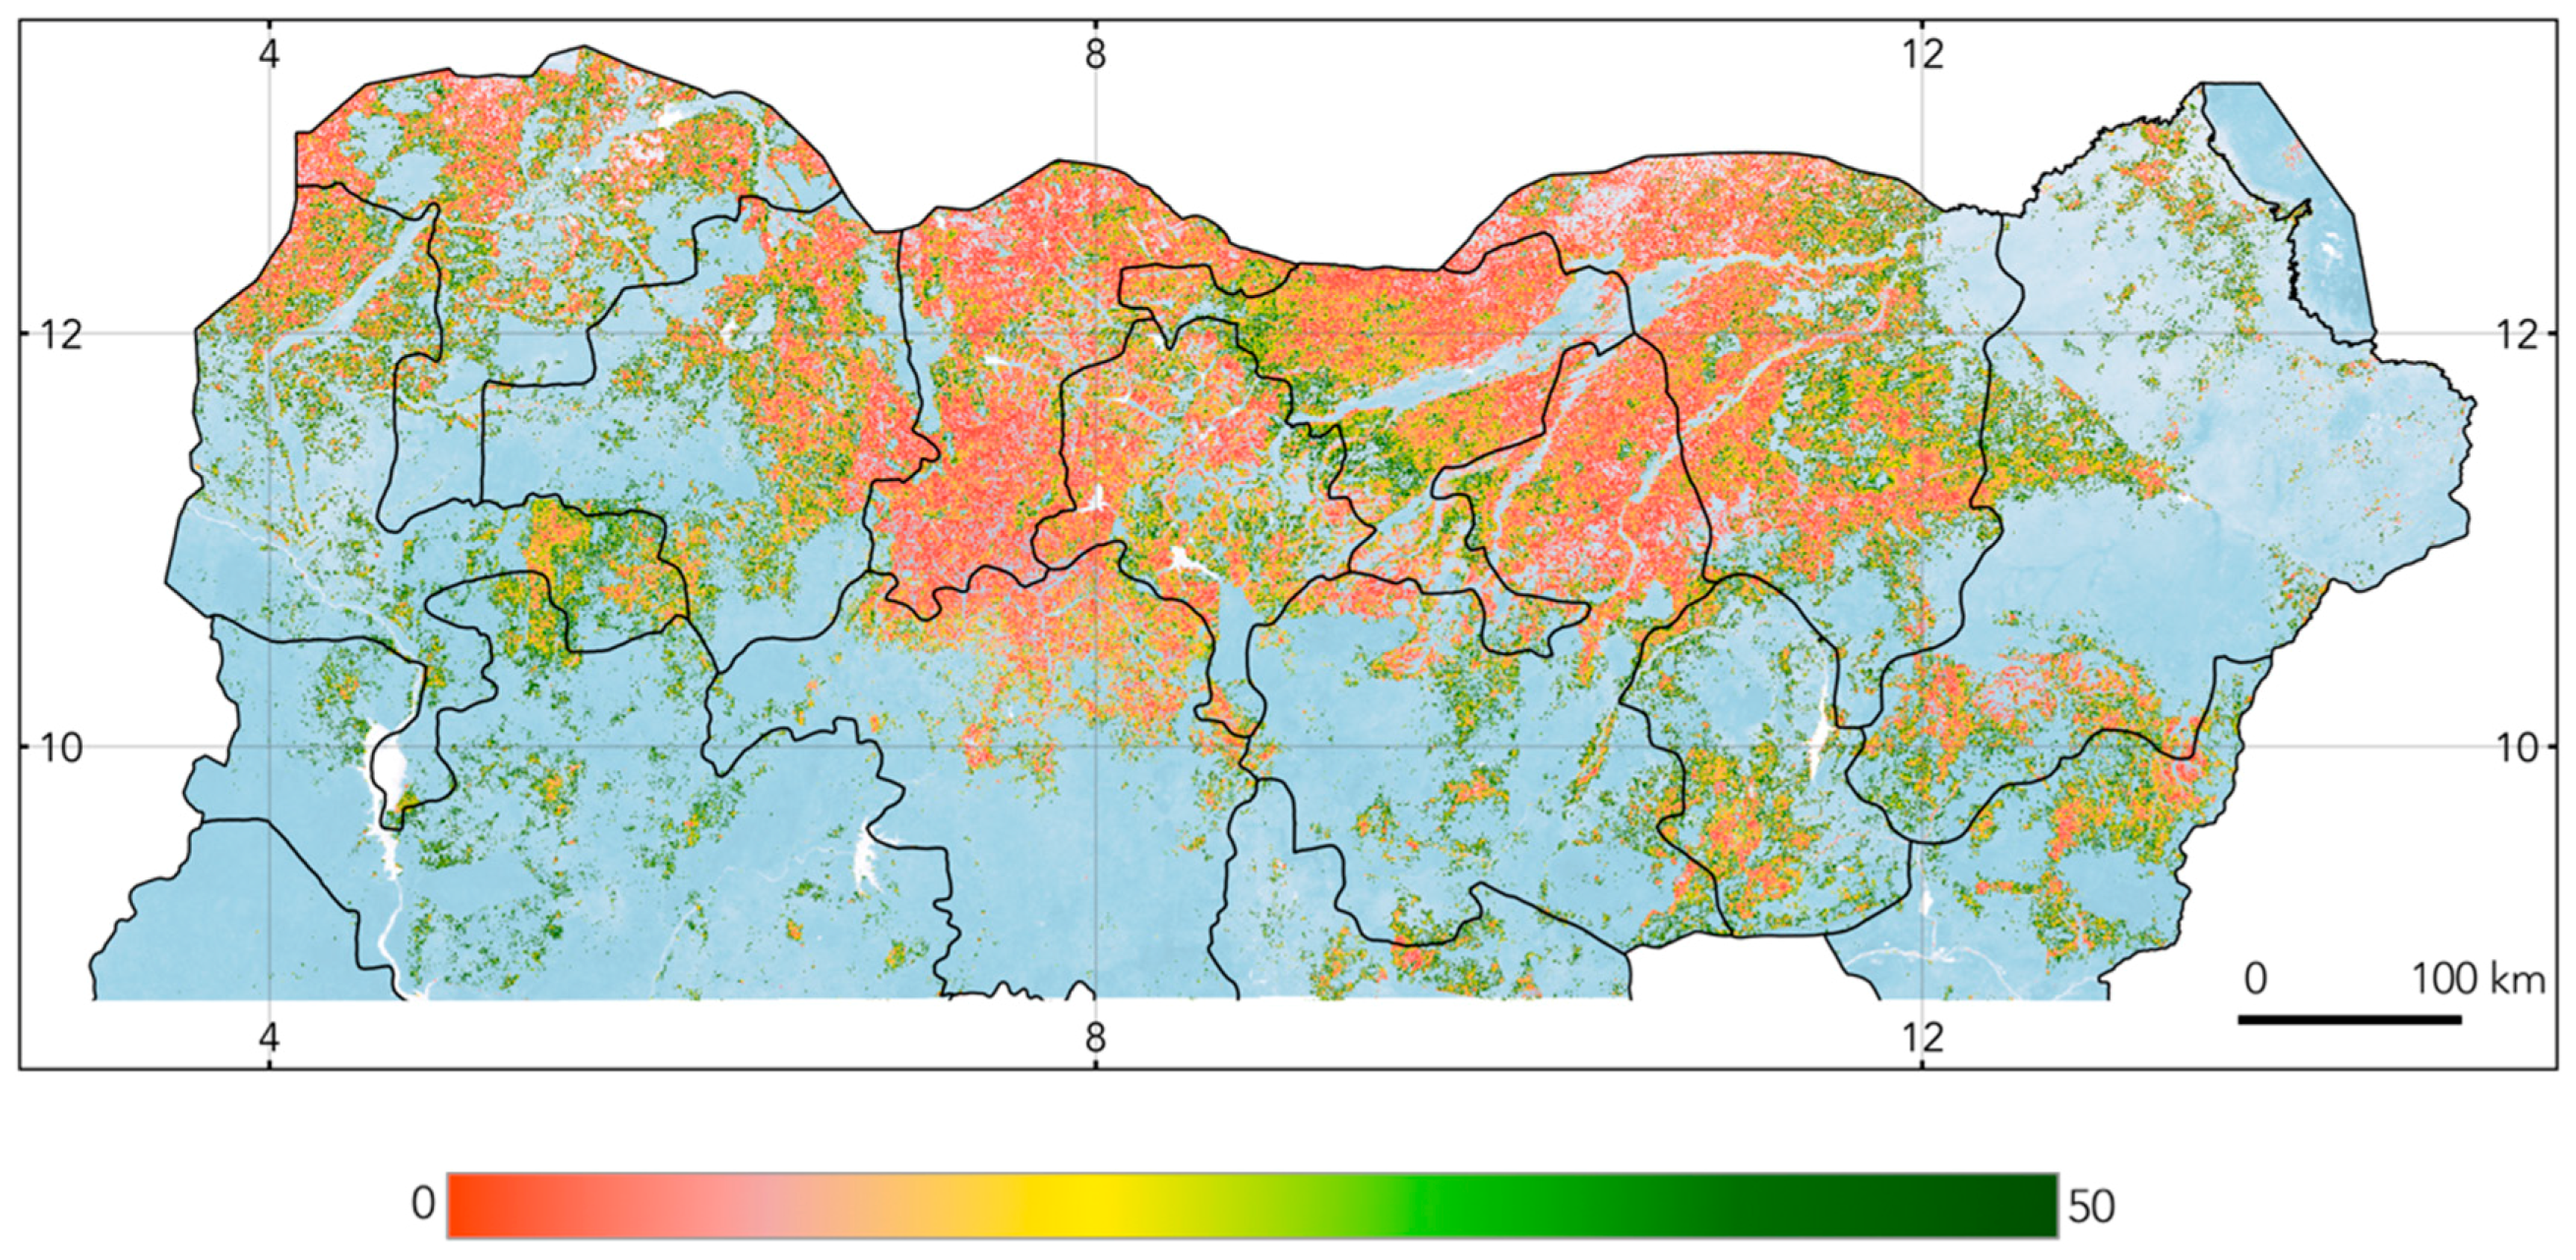
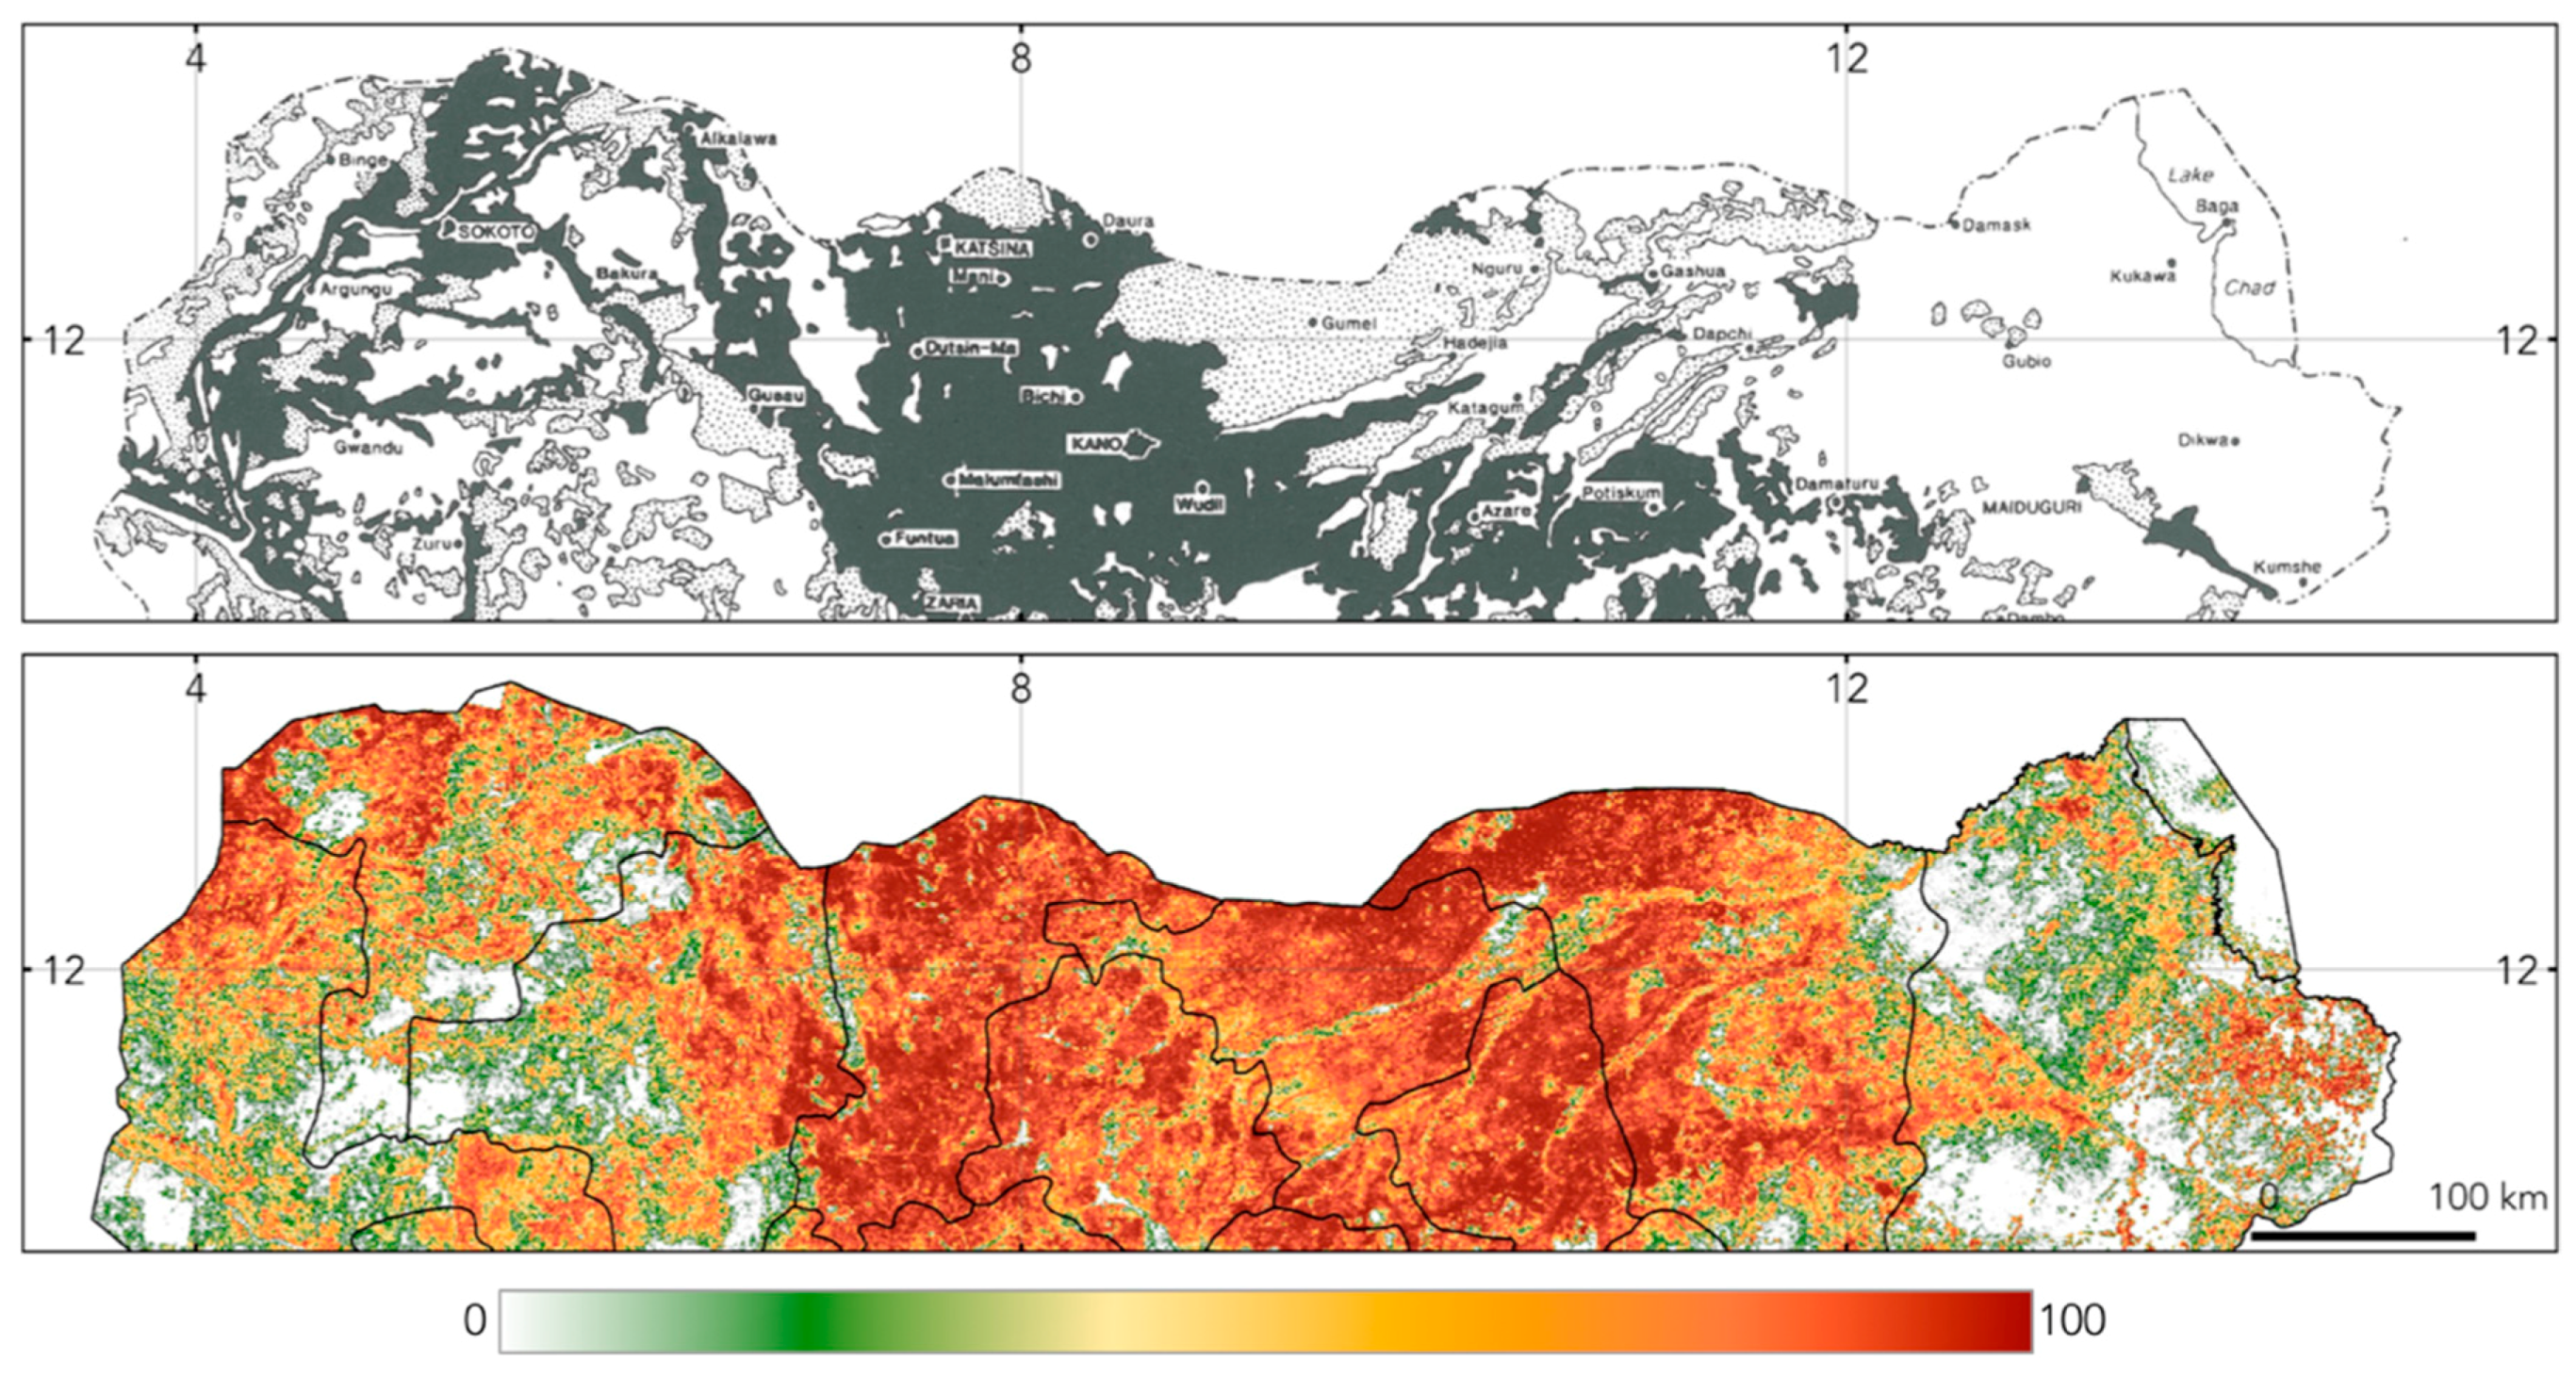
The map describes a region of intense agricultural use in which most land suitable for agriculture is already under cultivation. Historical evidence [44] reveals that, large areas of the drylands of Nigeria presented high farming intensities already in the late 1970s. A cautious visual comparison between historical cropping density map and the 1-km spatial aggregation of the rain-fed agriculture class (Figure 9) shows that farming area has increased and areas of high farming intensity have expanded considerably in the last 30 years. The present spatial distribution of farming intensity underscores a limited potential for further agricultural expansion into new lands and suggests that further increases in farming intensities are likely to take place in current agricultural landscapes.
The map shows that production systems adapted to arid conditions in marginal and less productive areas (e.g., mosaics of cultivated fields and scattered trees) can reach 30% of the land at lower elevations. It also highlights the distinct characteristics of land use dynamics in the north when compared with the rest of the country. For instance, cropland represents on average 52.5% of the land in the north, reaching 80% in some states, while the reported national average for Nigeria is 38.4%. From these figures we estimate that the cultivated land per person in the North is 0.31 person-hectare while the national average remains at 0.193 ha-person [45]. The map also questions existing assessments of irrigated agriculture, covering nearly 2.2% of the land and 4.4% of the cultivated land in northern Nigeria (Figure 10), sensibly higher than the national average (0.63%) [45]. These intranational differences highlight the need to establish monitoring systems to provide region specific, reliable, and up-to-date information to guide the design and implementation of interventions.
The current map improves the spatial detail of LCLU information extracted from coarser resolution remote sensing products. The higher spatial detail of this map allows a more realistic characterization of complex landscapes. Coarse resolution pixels are the result of a mixing of spectral signatures from different features. LCLU products from moderate sensors cannot accurately map heterogeneous landscapes and complex land use types of arid and semi-arid African regions. The spatial aggregation from a 30 m resolution map charts landscape features with consistent spectral signatures and allows flexible spatial aggregations to answer specific questions and the definition of classes with additional value.
This map also improves the thematic detail of existing medium resolution remote sensing-based products with cropland information for northern Nigeria. Continental and global LCLU remote sensing products commonly apply a uniform mapping framework that aim to retrieve consistent products and maximize overall accuracies over large regions. The application of empirical models to large regions implies a lack of flexibility to adapt to specific features and dynamics of sub regions. By restricting the geographical extent of the mapping area, we adapt the mapping framework to chart relevant land uses specific to the ecoregion and thus, improve thematic detail.
The advancement of cloud storage and computing capabilities and the increase in imagery from medium resolution sensors have led to the recent emergence of global-scale analysis and global medium spatial resolution products. Yet there are significant advantages of using cloud storage and computing capabilities for the study of smaller and coherent ecoregions, since it can enable the development of regional-based products that identify relevant key land use classes and land use processes, targeting specific questions and bringing analysis closer to managers and decision makers.
5. Conclusions
This work presents a mapping approach specifically designed for agricultural systems of the Sudan-Sahel region. This approach has the potential to be replicable in successive years and expanded to other locations within the Sudan-Sahel ecozone. The present work underscores the relevance of incorporating expert knowledge in the design mapping strategies in regions where other data sources are scarce. This work also highlights the importance of interannual land surface dynamic to achieve a robust characterization of land use in the study area, and it demonstrates the potential of dense stacks of medium resolution imagery to capture these dynamics.
The mapping framework was applied to produce a 30 m spatial resolution LCLU map with a focus on agricultural landscapes for northern Nigeria for year 2015. The map provides up-to-date information at higher spatial resolution, and an improved characterization of agriculture in a region with limited land use information where agriculture is the main livelihood strategy.
The map shows high farming intensity throughout the region and a cropland area significantly higher than in the rest of the country. Rain-fed cultivation systems already occupy most of the landscapes at the expense of natural vegetation and the majority of floodplains suitable for irrigation agriculture are already under use. The map also identifies the landscape variations associated with well-defined north–south gradients in the region.
In a region under increasing environmental and demographic stress, this work highlights the potential of multi temporal medium resolution satellite data to generate detailed and up-to-date land use information in the Sudan-Sahel region. This type of information is essential to design efficient policy interventions, improve famine-related early warning and response systems, and understand the links between land use and agricultural development, migration and conflict.
Supplementary Materials
The Supplementary Materials are available online at https://www.mdpi.com/2072-4292/11/6/648/s1.
Author Contributions
Conceptualization, F.S., V.M., and M.A.K.A.; Methodology, F.S.; Software, F.S..; Validation, F.S.; Formal analysis, F.S.; Resources, V.M. and M.A.K.A.; Writing—original draft preparation, F.S., V.M., and M.A.K.A.; Writing—review and editing, F.S., V.M., and M.A.K.A.; Supervision, V.M. and M.A.K.A.; Project administration, V.M.; Funding acquisition, V.M.
Funding
This research was funded by the Research Support Budget (RSB) of the World Bank, project number P160999.
Conflicts of Interest
The authors declare no conflict of interest.
Disclaimer
The findings, interpretations, and conclusions expressed in this paper are entirely those of the authors. They do not necessarily represent the views of the International Bank for Reconstruction and Development/World Bank and its affiliated organizations, or those of the Executive Directors of the World Bank or the governments they represent. This research is part of the World Bank project “Poverty and conflict analysis in Northern Nigeria”.
References
- Ozdogan, M.; Gutman, G. A new methodology to map irrigated areas using multi-temporal MODIS and ancillary data: An application example in the continental US. Remote Sens. Environ. 2008, 112, 3520–3537. [Google Scholar] [CrossRef] [Green Version]
- Ozdogan, M. The spatial distribution of crop types from MODIS data: Temporal unmixing using Independent Component Analysis. Remote Sens. Environ. 2010, 114, 1190–1204. [Google Scholar] [CrossRef]
- Thenkabail, P.S.; Wu, Z. An Automated Cropland Classification Algorithm (ACCA) for Tajikistan by Combining Landsat, MODIS, and Secondary Data. Remote Sens. 2012, 4, 2890–2918. [Google Scholar] [CrossRef] [Green Version]
- Gumma, M.K.; Thenkabail, P.S.; Maunahan, A.; Islam, S.; Nelson, A. Mapping seasonal rice cropland extent and area in the high cropping intensity environment of Bangladesh using MODIS 500m data for the year 2010. ISPRS J. Photogramm. Remote Sens. 2014, 91, 98–113. [Google Scholar] [CrossRef]
- Becker-Reshef, I.; Justice, C.; Sullivan, M.; Vermote, E.; Tucker, C.; Anyamba, A.; Doorn, B. Monitoring Global Croplands with Coarse Resolution Earth Observations: The Global Agriculture Monitoring (GLAM) Project. Remote Sens. 2010, 2, 1589–1609. [Google Scholar] [CrossRef] [Green Version]
- Becker-Reshef, I.; Vermote, E.; Lindeman, M.; Justice, C. A generalized regression-based model for forecasting winter wheat yields in Kansas and Ukraine using MODIS data. Remote Sens. Environ. 2010, 114, 1312–1323. [Google Scholar] [CrossRef]
- Jain, M.; Mondal, P.; Defries, R.S.; Small, C.; Galford, G.L. Remote Sensing of Environment Mapping cropping intensity of smallholder farms: A comparison of methods using multiple sensors. Remote Sens. Environ. 2013, 134, 210–223. [Google Scholar] [CrossRef]
- Tucker, C.J.; Vanpraet, C.L.; Sharman, M.J.; Van Ittersum, G. Satellite remote sensing of total herbaceous biomass production in the senegalese sahel: 1980–1984. Remote Sens. Environ. 1985, 17, 233–249. [Google Scholar] [CrossRef]
- Herrmann, S.M.; Anyamba, A.; Tucker, C.J. Recent trends in vegetation dynamics in the African Sahel and their relationship to climate. Glob. Environ. Chang. 2005, 15, 394–404. [Google Scholar] [CrossRef]
- Brink, A.B.; Eva, H.D. Monitoring 25 years of land cover change dynamics in Africa: A sample based remote sensing approach. Appl. Geogr. 2009, 29, 501–512. [Google Scholar] [CrossRef] [Green Version]
- Fensholt, R.; Rasmussen, K.; Kaspersen, P.; Huber, S.; Horion, S.; Swinnen, E. Assessing land degradation/recovery in the African Sahel from long-term earth observation based primary productivity and precipitation relationships. Remote Sens. 2013, 5, 664–686. [Google Scholar] [CrossRef]
- Knauer, K.; Gessner, U.; Dech, S.; Kuenzer, C. Remote sensing of vegetation dynamics in West Africa. Int. J. Remote Sens. 2014, 35, 6357–6396. [Google Scholar] [CrossRef]
- Spiekermann, R.; Brandt, M.; Samimi, C. Woody vegetation and land cover changes in the Sahel of Mali (1967–2011). Int. J. Appl. Earth Obs. Geoinf. 2015, 34, 113–121. [Google Scholar] [CrossRef]
- Comité Permanent Inter-états de Lutte contre la Sécheresse dans le Sahel [CILSS]. Landscapes of West Africa—A Window on a Changing World. CILSS: Ouagadougou, Burkina Faso; 219p, 2016. Available online: https://eros.usgs.gov/westafrica (accessed on 15 March 2019).
- World Bank. Federal Republic of Nigeria Poverty Work Program Poverty Reduction in Nigeria in the Last Decade; World Bank: Washington, DC, USA, 2016. [Google Scholar]
- DeFries, R.S.; Rudel, T.; Uriarte, M.; Hansen, M. Deforestation driven by urban population growth and agricultural trade in the twenty-first century. Nat. Geosci. 2010, 3, 178–181. [Google Scholar] [CrossRef]
- Cervigni, R.; Valentini, R.; Santini, M. (Eds.) Toward Climate-Resilient Development in Nigeria. Directions in Development: Countries and Regions Series; World Bank: Washington, DC, USA, 2013. [Google Scholar]
- Porter, J.R.; Xie, L.; Challinor, A.J.; Cochrane, K.; Howden, S.M.; Iqbal, M.M.; Lobell, D.B.; Travasso, M.I. Food security and food production systems. In Climate Change 2014: Impacts, Adaptation, and Vulnerability. Part A: Global and Sectoral Aspects. Contribution of Working Group II to the Fifth Assessment Report of the Intergovernmental Panel on Climate Change; Field, C.B., Barros, V.R., Dokken, D.J., Mach, K.J., Mastrandrea, M.D., Bilir, T.E., Chatterjee, M., Ebi, K.L., Estrada, Y.O., Genova, R.C., et al., Eds.; Cambridge University Press: Cambridge, UK; New York, NY, USA, 2014; pp. 485–533. [Google Scholar]
- Jones, P.; Thornton, P. The potential impacts of climate change on maize production in Africa and Latin America in 2055. Glob. Environ. Chang. 2003, 13, 51–59. [Google Scholar] [CrossRef]
- Leichenko, R.; O’Brien, K. Environmental Change and Globalization; Oxford University Press: New York, NY, USA, 2008. [Google Scholar]
- Ramankutty, N.; Evan, A.T.; Monfreda, C.; Foley, J.A. Farming the Planet: 1. Geographic Distribution of Global Agricultural Lands in the Year 2000. Glob. Biogeochem. Cycles 2008, 22. [Google Scholar] [CrossRef]
- Pittman, K.; Hansen, M.C.; Becker-Reshef, I.; Potapov, P.V.; Justice, C.O. Estimating Global Cropland Extent with Multi-year MODIS Data. Remote Sens. 2010, 2, 1844–1863. [Google Scholar] [CrossRef] [Green Version]
- Leroux, L.; Jolivot, A.; Bégué, A.; Seen, D.; Zoungrana, B. How Reliable is the MODIS Land Cover Product for Crop Mapping Sub-Saharan Agricultural Landscapes? Remote Sens. 2014, 6, 8541–8564. [Google Scholar] [CrossRef] [Green Version]
- Woodcock, C.E.; Allen, R.; Anderson, M.; Belward, A.; Bindschadler, R.; Cohen, W.; Wynne, R. Free access to Landsat imagery. Science 2008, 320, 1101. [Google Scholar] [CrossRef]
- Gong, P.; Wang, J.; Yu, L.; Zhao, Y.C.; Zhao, Y.Y.; Liang, L.; Niu, Z.G.; Huang, X.M.; Fu, H.H.; Liu, S.; et al. Finer resolution observation and monitoring of global land cover: First mapping results with Landsat TM and ETM+ data. Int. J. Remote Sens. 2013, 34, 2607–2654. [Google Scholar] [CrossRef]
- Xiong, J.; Thenkabail, P.S.; Tilton, J.C.; Gumma, M.K.; Teluguntla, P.; Oliphant, A.; Congalton, R.G.; Yadav, K.; Gorelick, N. Nominal 30 m Cropland Extent Map of Continental Africa by Integrating Pixel-Based and Object-Based Algorithms Using Sentinel-2 and Landsat-8 Data on Google Earth Engine. Remote Sens. 2017, 9, 1065. [Google Scholar] [CrossRef]
- Fritz, S.; See, L.; McCallum, I.; Bun, A.; Moltchanova, E.; Duerauer, M.; Perger, C.; Havlik, P.; Mosnier, A.; Schepaschenko, D.; et al. Mapping global cropland field size. Glob. Chang. Biol. 2015, 21, 1980–1992. [Google Scholar] [CrossRef] [PubMed]
- Chander, G.; Markham, B.L.; Helder, D.L. Summary of current radiometric calibration coefficients for Landsat MSS, TM, ETM+, and EO-1 ALI sensors. Remote Sens. Environ. 2009, 113, 893–903. [Google Scholar] [CrossRef] [Green Version]
- Liang, S. Quantitative Remote Sensing of Land Surfaces, 1st ed.; Wiley-Interscience: New York, NY, USA, 2003; pp. 196–226. [Google Scholar]
- Farr, T.G.; Rosen, P.A.; Caro, E.; Crippen, R.; Duren, R.; Hensley, S.; Kobrick, M.; Paller, M.; Rodriguez, E.; Roth, L.; et al. The shuttle radar topography mission. Rev. Geophys. 2007, 45. [Google Scholar] [CrossRef]
- Wang, P.; Huang, C.; Brown de Colstoun, E.C.; Tilton, J.C.; Tan, B. Global Human Built-up and Settlement Extent (HBASE) Dataset from Landsat; NASA Socioeconomic Data and Applications Center (SEDAC): Palisades, NY, USA, 2017. [Google Scholar] [CrossRef]
- Srinivasan, A.; Richards, J.A. Knowledge-based techniques for multi-source classification. Int. J. Remote Sens. 1990, 11, 505–525. [Google Scholar] [CrossRef]
- Bégué, A.; Arvor, D.; Bellon, B.; Betbeder, J.; De Abelleyra, D.; Ferraz, R.P.D.; Lebourgeois, V.; Lelong, C.; Simões, M.; Verón, S.R. Remote Sensing and Cropping Practices: A Review. Remote Sens. 2018, 10, 99. [Google Scholar] [CrossRef]
- Szantoi, Z.; Brink, A.; Buchanan, G.; Bastin, L.; Lupi, A.; Simonetti, D. A simple remote sensing based information system for monitoring sites of conservation importance. Remote Sens. Ecol. Conserv. 2016, 2, 16–24. [Google Scholar] [CrossRef]
- Cohen, Y.; Shoshany, M. A national knowledge-based crop recognition in Mediterranean environment. Int. J. Appl. Earth Obs. Geoinf. 2002, 4, 75–87. [Google Scholar] [CrossRef]
- Janssen, L.L.F.; Middelkoop, H. Knowledge-based crop classification of a Landsat Thematic Mapper image. Int. J. Remote Sens. 1992, 13, 2827–2837. [Google Scholar] [CrossRef]
- ElHajj, M.; Begue, A.; Guillaume, S.; Martine, J.F. Integrating SPOT-5 time series, crop growth modeling and expert knowledge for monitoring agricultural practices—The case of sugarcane harvest on Reunion island. Remote Sens. Environ. 2009, 113, 2052–2061. [Google Scholar] [CrossRef]
- Choudhury, I.; Chakraborty, M.; Santra, S.C.; Parihar, J.S. Methodology to classify rice cultural types based on water regimes using multi-temporal Radarsat-1 data. Int. J. Remote Sens. 2012, 33, 4135–4160. [Google Scholar] [CrossRef]
- Amarsaikhan, D.; Bat-Erdene, T.; Ganzorig, M.; Nergui, B. Knowledge-based Classification of Quickbird Image of Ulaanbaatar City, Mongolia. Am. J. Signal Process. 2013, 3, 71–77. [Google Scholar] [CrossRef]
- Richards, J.A.; Jia, X. Remote Sensing Digital Image Analysis. An Introduction, 4th ed.; Springer: Berlin/Heidelberg, Germany, 2006; pp. 342–355. [Google Scholar]
- Sedano, F.; Gong, P.; Ferrao, M. Land cover assessment with MODIS imagery in southern African Miombo ecosystems. Remote Sens. Environ. 2005, 98, 429–441. [Google Scholar] [CrossRef]
- Hansen, M.C.; Roy, D.P.; Lindquist, E.; Adusei, B.; Justice, C.O.; Altstatt, A. A method for integrating MODIS and Landsat data for systematic monitoring of forest cover and change in the Congo Basin. Remote Sens. Environ. 2008, 112, 2495–2513. [Google Scholar] [CrossRef]
- Hodgson, M.E.; Jensen, J.R.; Tullis, J.A.; Riordan, K.D.; Archer, C.M. Synergistic use lidar and color aerial photography for mapping urban parcel imperviousness. Photogramm. Eng. Remote Sens. 2003, 69, 973–980. [Google Scholar] [CrossRef]
- Mortimore, M.J. The Causes, Nature and Rate of Soil Degradation in the Northernmost States of Nigeria, and Assessment of the Role of Fertilizer in Counteracting the Processes of Degradation; Working paper 17; Environmental Department, World Bank: Washington, DC, USA, 1989. [Google Scholar]
- World Development Indicators. License: Creative Commons Attribution CC BY 3.0 IGO; World Bank: Washington, DC, USA, 2014. [Google Scholar] [CrossRef]
Figure 1.
States included in this work (dark grey) and of Landsat scenes used in the study (red line).
Figure 1.
States included in this work (dark grey) and of Landsat scenes used in the study (red line).

Figure 2.
(a) Illustration of seasonal dynamics of vegetative activity for main land cover and land use classes. Adapted from temporal profiles at known locations for visualization purposes. (b) Temporal windows for each mapping components.
Figure 2.
(a) Illustration of seasonal dynamics of vegetative activity for main land cover and land use classes. Adapted from temporal profiles at known locations for visualization purposes. (b) Temporal windows for each mapping components.

Figure 3.
Flow chart of mapping framework for land cover land use map based on dense stacks of Landsat 8 imagery.
Figure 3.
Flow chart of mapping framework for land cover land use map based on dense stacks of Landsat 8 imagery.

Figure 4.
Examples of existing medium resolution remote sensing LCLU products providing information for northern Nigeria: (A) False color composition (754) of Landsat 8 image; (B) ESA land cover 20 m map of Africa; (C) GFSAD30AFCE; (D) Tsinghua University 30 m resolution LCLU map. Green: shrub; Light yellow: cropland; (E) Northern Nigeria 30 m resolution Landsat 8-based LCLU map. Green: natural vegetation; Light yellow: cropland.

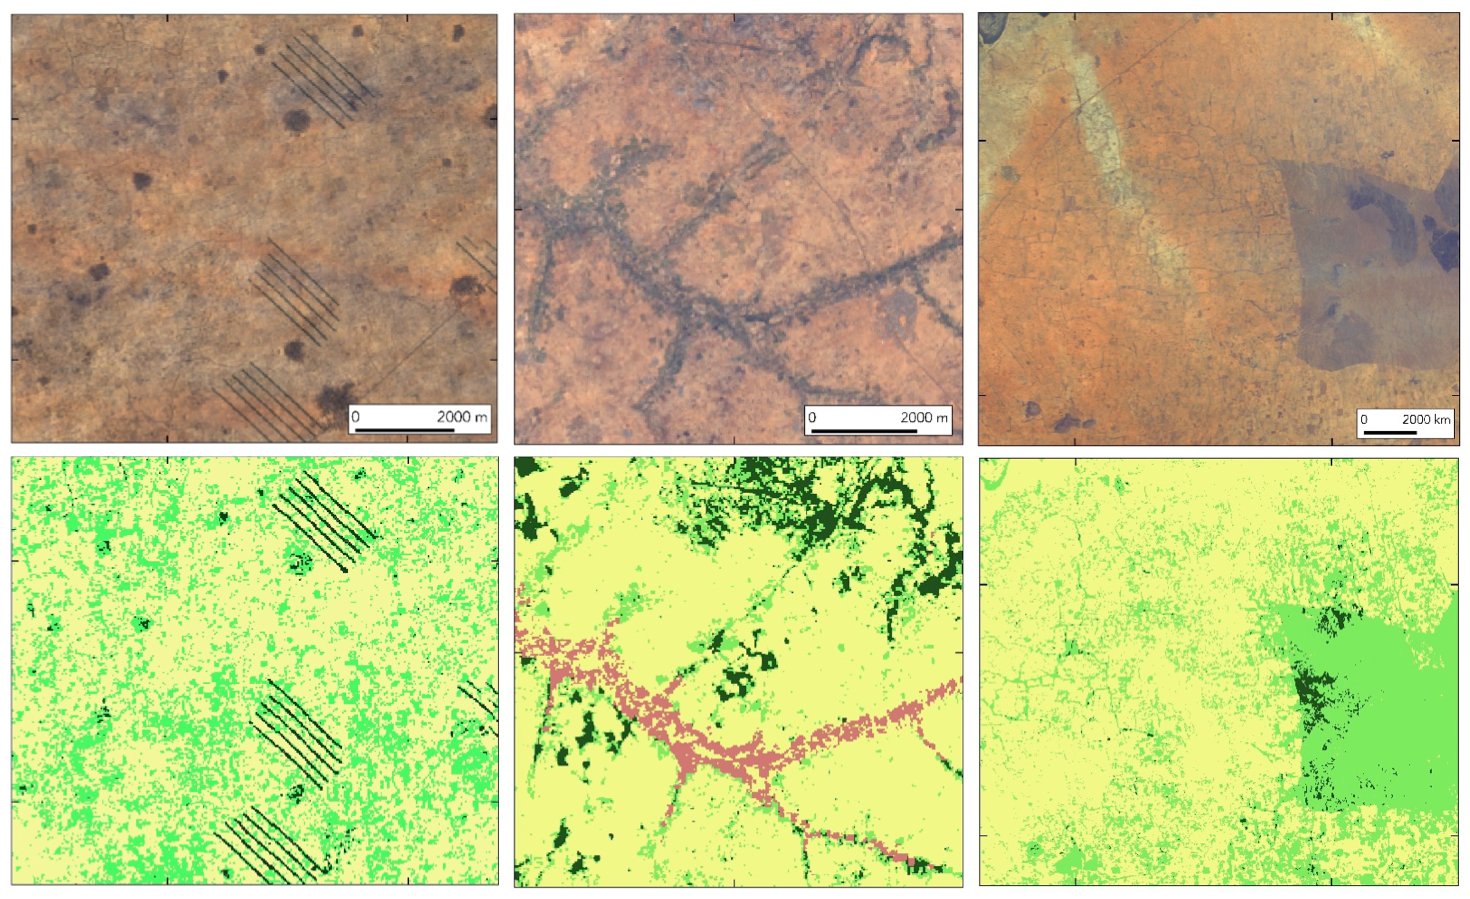
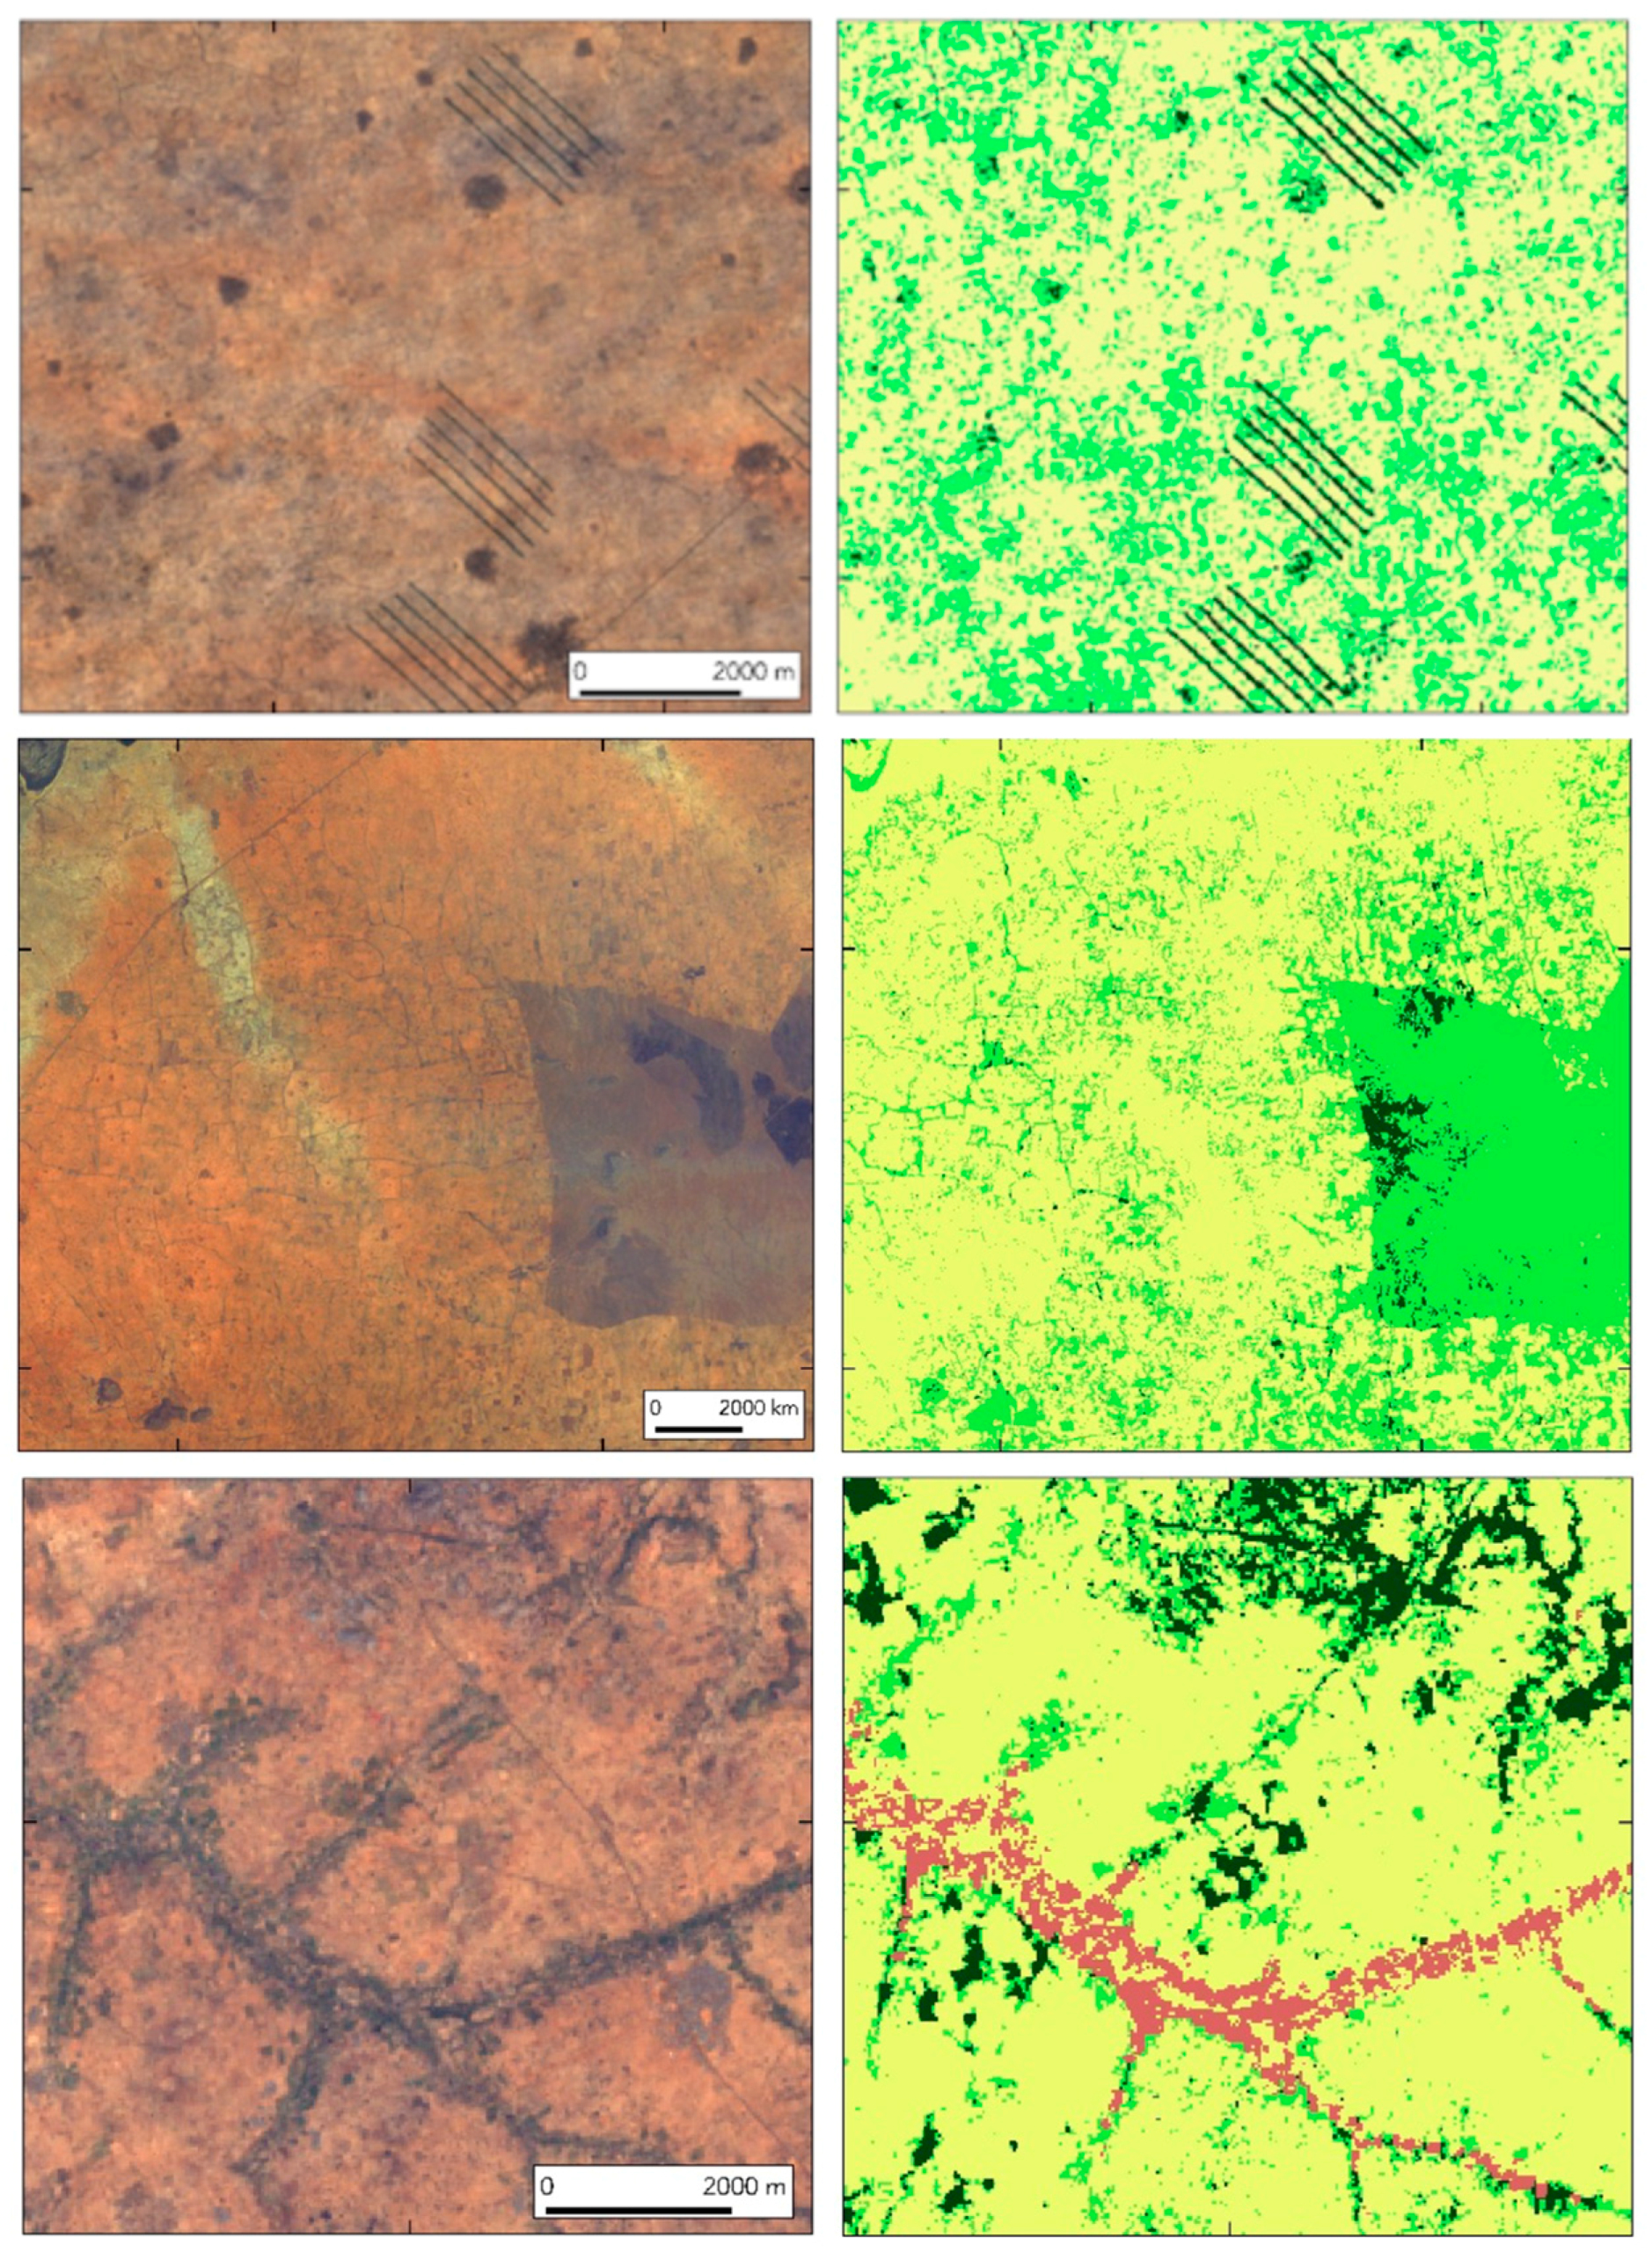
Figure 5.
Examples of Google Earth high resolution imagery (left side) and the corresponding 30 m resolution Landsat 8-based LCLU map for northern Nigeria (right side). Dark green: stable natural vegetation; Light green: non-stable natural vegetation; Light yellow: rain-fed agriculture; Red: Irrigation agriculture.

Figure 6.
Land cover land use distribution in northern Nigeria by state.

Figure 7.
Northern Nigeria LCLU map 1 km spatial aggregation. Percentage of natural vegetation in agriculture dominated areas.
Figure 7.
Northern Nigeria LCLU map 1 km spatial aggregation. Percentage of natural vegetation in agriculture dominated areas.

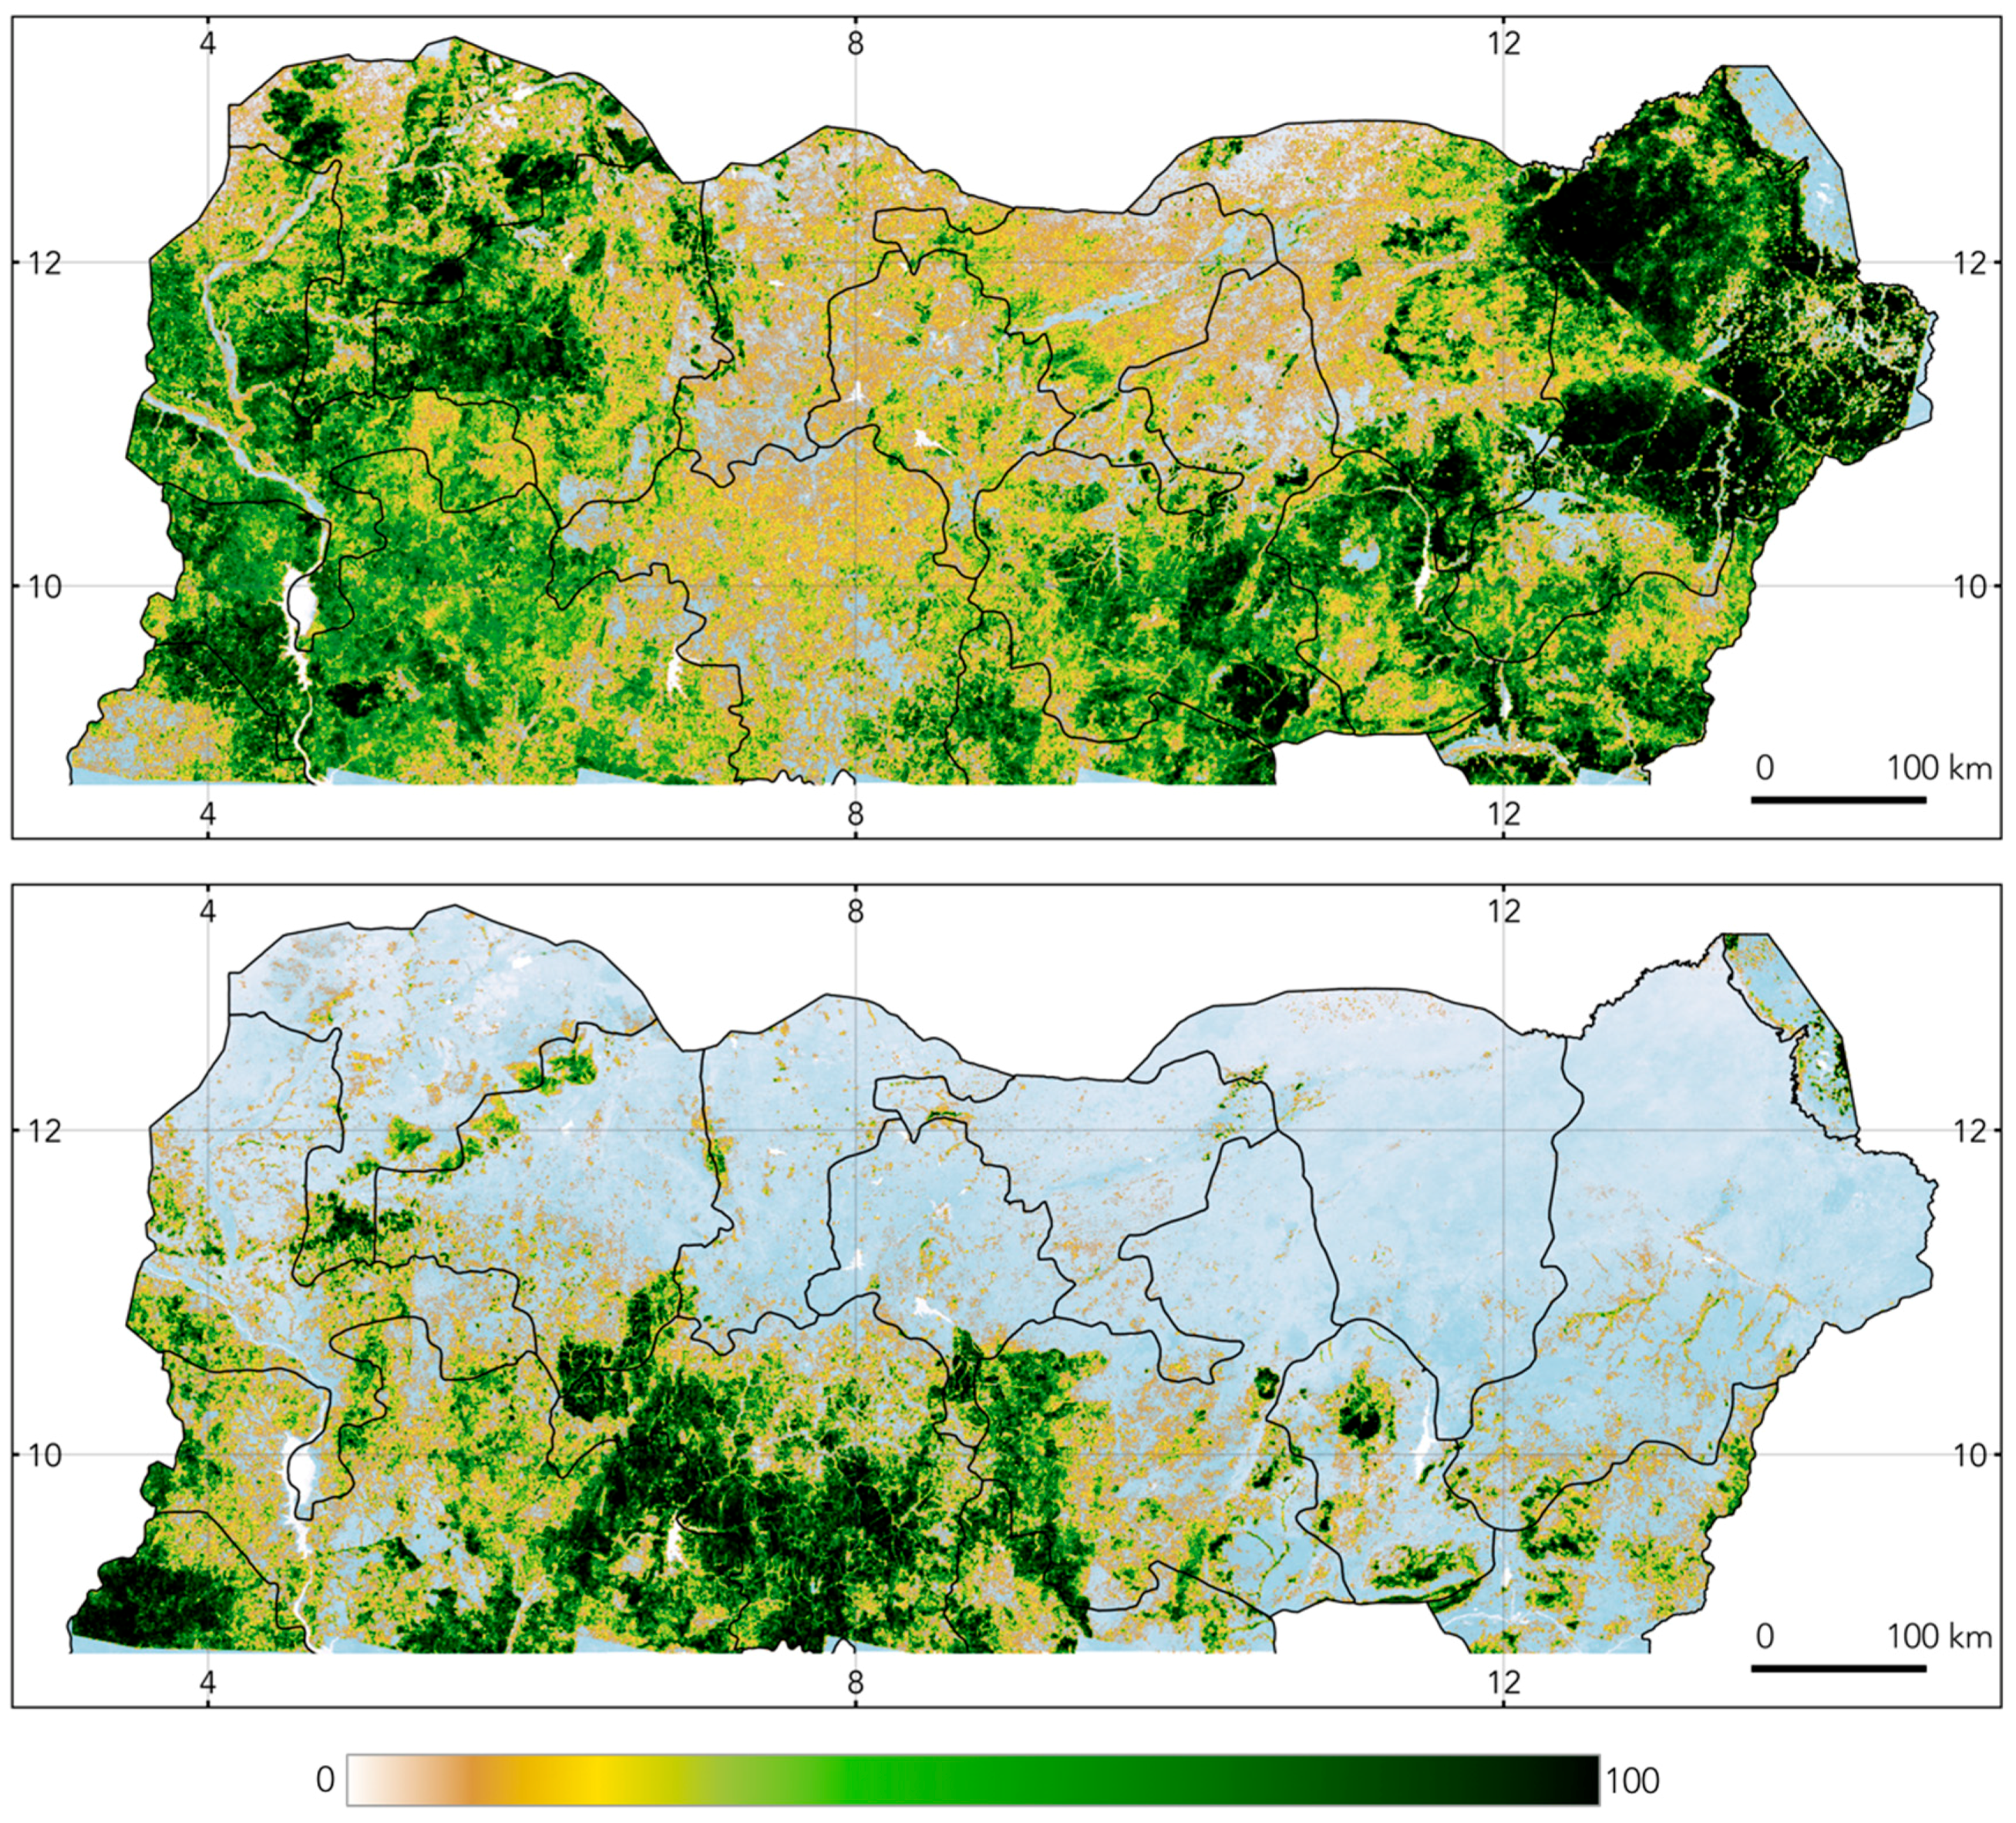
Figure 8.
Northern Nigeria LCLU map 1 km spatial aggregation. Upper plate: distribution of temporary natural vegetation; Lower plate: distribution of permanent vegetation. Color bars represent percentage of natural vegetation.
Figure 8.
Northern Nigeria LCLU map 1 km spatial aggregation. Upper plate: distribution of temporary natural vegetation; Lower plate: distribution of permanent vegetation. Color bars represent percentage of natural vegetation.

Figure 9.
Comparison of farming intensity in drylands Nigeria in the late 1970s [43] and rain-fed agriculture 1 km spatial aggregated map (2015). Color bar represents percentage of land under cultivation.
Figure 9.
Comparison of farming intensity in drylands Nigeria in the late 1970s [43] and rain-fed agriculture 1 km spatial aggregated map (2015). Color bar represents percentage of land under cultivation.

Figure 10.
Northern Nigeria LCLU map, 1 km spatial aggregation. Upper plate: distribution of rain-fed agriculture; Lower plate: distribution of irrigated agriculture. Color bar represents percentage of cultivated land.
Figure 10.
Northern Nigeria LCLU map, 1 km spatial aggregation. Upper plate: distribution of rain-fed agriculture; Lower plate: distribution of irrigated agriculture. Color bar represents percentage of cultivated land.


Table 1.
Description of mapped classes.
| Class Type | Description |
|---|---|
| Stable natural vegetation | Surfaces with natural vegetation and never cultivated during the 2014–2016 period. |
| Non-stable natural vegetation | Surfaces not cultivated in 2015, but likely to have been under cultivation in previous or subsequent years (fallow lands). Also land undergoing cover conversion. This class includes areas of sparse tree cover. |
| Rain-fed agriculture | Cultivated land relying solely on rainfall for water supply. |
| Irrigation agriculture | Cultivated land using mainly irrigation for water supply (groundwater, irrigation channels, etc.). |
| Bare soil | Surfaces without vegetation cover. |
| Rivers and water bodies | Surfaces covered by water during more than 6 months per year in the 2014–2016 period. |
Table 2.
Accuracy matrix.
| Non-Stable Natural Veg. | Stable Natural Veg. | Irrigated Ag. | Rain-fed Ag. | Water | Bare Soil | User’s Accuracy | |
|---|---|---|---|---|---|---|---|
| Non-Stable Natural Veg. | 117 | 13 | 0 | 12 | 0 | 0 | 0.82 |
| Stable Natural Veg. | 13 | 236 | 1 | 0 | 0 | 0 | 0.94 |
| Irrigated Ag. | 0 | 1 | 85 | 0 | 0 | 0 | 0.99 |
| Rain-Fed Ag. | 8 | 3 | 13 | 180 | 0 | 1 | 0.88 |
| Water | 0 | 0 | 0 | 0 | 38 | 0 | 1 |
| Bare soil | 0 | 0 | 0 | 1 | 0 | 32 | 0.97 |
| Producer’s Accuracy | 0.85 | 0.93 | 0.86 | 0.93 | 1.00 | 0.97 |
© 2019 by the authors. Licensee MDPI, Basel, Switzerland. This article is an open access article distributed under the terms and conditions of the Creative Commons Attribution (CC BY) license (http://creativecommons.org/licenses/by/4.0/).
Share and Cite
MDPI and ACS Style
Sedano, F.; Molini, V.; Azad, M.A.K. A Mapping Framework to Characterize Land Use in the Sudan-Sahel Region from Dense Stacks of Landsat Data. Remote Sens. 2019, 11, 648. https://doi.org/10.3390/rs11060648
AMA Style
Sedano F, Molini V, Azad MAK. A Mapping Framework to Characterize Land Use in the Sudan-Sahel Region from Dense Stacks of Landsat Data. Remote Sensing. 2019; 11(6):648. https://doi.org/10.3390/rs11060648
Chicago/Turabian StyleSedano, Fernando, Vasco Molini, and M. Abul Kalam Azad. 2019. "A Mapping Framework to Characterize Land Use in the Sudan-Sahel Region from Dense Stacks of Landsat Data" Remote Sensing 11, no. 6: 648. https://doi.org/10.3390/rs11060648
Note that from the first issue of 2016, this journal uses article numbers instead of page numbers. See further details here.