
Developing a Method to Extract Building 3D Information from GF-7 Data
by
 ,
,
Jingyuan Wang
1,2, 
Xinli Hu
1,2,3,*,
Qingyan Meng
1,2,3,
Linlin Zhang
1,2,3,
Chengyi Wang
1,2, 
Xiangchen Liu
1,2 and
Maofan Zhao
1,2 1
Aerospace Information Research Institute, Chinese Academy of Sciences, Beijing 100094, China
2
University of Chinese Academy of Sciences, Beijing 100049, China
3
Key Laboratory of Earth Observation of Hainan Province, Hainan Research Institute, Aerospace Information Research Institute, Chinese Academy of Sciences, Sanya 572029, China
*
Author to whom correspondence should be addressed.
Remote Sens. 2021, 13(22), 4532; https://doi.org/10.3390/rs13224532
Submission received: 16 September 2021
/
Revised: 31 October 2021
/
Accepted: 1 November 2021
/
Published: 11 November 2021
(This article belongs to the Special Issue Techniques and Applications of UAV-Based Photogrammetric 3D Mapping)
Abstract
:The three-dimensional (3D) information of buildings can describe the horizontal and vertical development of a city. The GaoFen-7 (GF-7) stereo-mapping satellite can provide multi-view and multi-spectral satellite images, which can clearly describe the fine spatial details within urban areas, while the feasibility of extracting building 3D information from GF-7 image remains understudied. This article establishes an automated method for extracting building footprints and height information from GF-7 satellite imagery. First, we propose a multi-stage attention U-Net (MSAU-Net) architecture for building footprint extraction from multi-spectral images. Then, we generate the point cloud from the multi-view image and construct normalized digital surface model (nDSM) to represent the height of off-terrain objects. Finally, the building height is extracted from the nDSM and combined with the results of building footprints to obtain building 3D information. We select Beijing as the study area to test the proposed method, and in order to verify the building extraction ability of MSAU-Net, we choose GF-7 self-annotated building dataset and a public dataset (WuHan University (WHU) Building Dataset) for model testing, while the accuracy is evaluated in detail through comparison with other models. The results are summarized as follows: (1) In terms of building footprint extraction, our method can achieve intersection-over-union indicators of 89.31% and 80.27% for the WHU Dataset and GF-7 self-annotated datasets, respectively; these values are higher than the results of other models. (2) The root mean square between the extracted building height and the reference building height is 5.41 m, and the mean absolute error is 3.39 m. In summary, our method could be useful for accurate and automatic 3D building information extraction from GF-7 satellite images, and have good application potential.
1. Introduction
The structure of urban areas in both two and three dimensions has a significant impact on local and global environments [1]. As the basic element of a city, buildings are the main sites of production and housing. The three-dimensional (3D) information of buildings portrays the horizontal and vertical morphological characteristics of a city, both of which play a crucial role in urban construction and management for sustainable development. Research on the 3D information extraction of urban buildings can serve the research fields of urban climate [2,3,4,5], urban expansion [6,7], pollutant dispersion [8], urban 3D reconstruction [9,10,11,12], urban scene classification [13], energy consumption [14], and population assessment [15,16,17]. Therefore, large-scale and high-precision 3D information extraction of urban buildings is essential for a comprehensive understanding of urban development.
With the development of remote sensing equipment, remote sensing technology provides an effective tool for surveying and mapping buildings at the urban scale. Due to the limited availability of 3D data, most studies on urban building extraction focus on the two-dimensional level [18,19,20,21,22,23,24,25], and only a small number of studies focus on the 3D structure of buildings [26,27,28,29,30,31,32]. Huang et al. [26] used ZY-3 data combined with A-map (a map service provider of China) building height data and proposed a multi-view, multi-spectral, and multi-objective neural network (called M3Net) to extract large-scale building footprints and heights, and verified the applicability of the extraction method in various cities. Wang et al. [27,28] proposed an inversion method of building heights using GLAS data assisted by QuickBird imagery and used satellite-borne LiDAR full waveform data to extract building height within a laser spot footprint. Li et al. [29] realized the extraction of building height with a resolution of 500 m based on Sentinel-1 data, and verified results in most cities of the United States. Qi et al. [30] estimated the height of buildings based on the shadows of buildings from Google Earth images. It is more economical to use shadow information to estimate the height of buildings. However, this method is susceptible to many restrictions, such as building heights, shadow effects, and viewing angles. Liu et al. [31] used a random forest method to extract building footprints from ZY-3 multi-spectral satellite images and combined this approach with the digital surface model (DSM) constructed by ZY-3 multi-view images to estimate building heights. However, the accuracy of building footprint extraction using random forest method is low, and the estimated height of a building is easily affected by the height of the ground’s surface.
In summary, although previous studies have made some progress in building 3D information extraction, there are still the following limitations:
- The GaoFen-7 (GF-7) multi-view satellite image can describe the vertical structure of a ground object well. However, there are few studies on the extraction of building information from GF-7 satellite images, and satellite vertical structure extraction capabilities still require evaluation.
To fill this knowledge gap on urban building 3D information estimation over large areas, we developed a building footprint and height extraction method and assessed the quality of the results from GF-7 imagery.
Our research is divided into three parts. First, we use deep learning methods to extract building footprints from GF-7 multi-spectral images. To solve the problem of accuracy in terms of building footprint extraction, we propose a multi-stage attention U-Net (MSAU-Net). Second, this study used the multi-view images of GF-7 to construct the point cloud of the study area and performed point cloud filtering process to obtain the ground point. The DSM, the digital elevation model (DEM), and the normalized digital surface model (nDSM) of the study area are generated from the point cloud. Afterward, the building footprint extraction results of the study area are superimposed with the nDSM data to generate a 3D product of the building. Finally, this study verified the accuracy of the building footprint extraction and compared our network with other deep learning methods; we then collected actual building height values in the study area as the reference buildings to verify the accuracy of estimated building height information.
2. Data and Study Area
GF-7 was successfully launched in November 2019. It is China’s first civilian sub-meter stereo surveying and mapping satellite equipped with a two-line array scanner. The ground sample distance (GSD) is 0.8 m for the oblique panchromatic cameras viewing in a forward direction (26°), 0.65 m for the oblique panchromatic cameras viewing in a backward direction (−5°), and 2.6 m for the infrared multi-spectral scanner. The GF-7 satellite has many applications, such as natural resource surveys, basic surveying and mapping, and urban 3D building model generation.
Our study area is located in Beijing, China. As the capital of China, Beijing has a complete urban infrastructure and dense, built-up environments. The GF-7 satellite image we selected was captured on 16 October 2020. The scope of the study area we selected is shown in the red box in Figure 1. The study area covers the central area of Beijing, including landmark high-rise buildings, large building groups, middle- and high-rise residential areas, low-rise residential areas, urban green spaces, and other typical features covering an area of 169 square kilometers. For the task of building footprint extraction base with deep learning, we selected the area in the light blue and the yellow box in Figure 1 to make the training and test dataset, which we refer to as the “GF-7 self-annotated building dataset”. The area in the light blue box was used for the training and verification datasets, while the area in the yellow box was used for the test dataset. We chose a field surveying the height data of 213 buildings as the reference building height data for the evaluation of building heights. The reference building location is shown in Figure 1 below.
3. Methodology
3.1. Overview
The 3D information extraction method of the building in this study is shown in Figure 2. First, we fused the GF-7 backward-view multi-spectral image with the backward-view panchromatic image and proposed MSAU-Net to extract the urban building footprint from the pan sharpening result. We modified the traditional decoder–encoder network structure, used ResNet34 as the backbone feature extraction network, and integrated an attention block in the skip connection part of the network. The attention mechanism was used to improve the building extraction ability of the neural network. Second, the point cloud of the study area was constructed from the multi-view images of GF-7, and then the DSM of the study area was constructed based on the point cloud. Then, we used a cloth simulation algorithm (CSF) [34] to filter the point cloud to obtain the ground point and used it to construct the DEM of the study area. Then, the nDSM was constructed to represent the height of off-terrain objects. Finally, the building footprint extraction results were superimposed with the nDSM to generate building height. In the accuracy assessment part of our study, the test dataset and the reference building height value were used to verify the accuracy of the 3D information of the building.
3.2. Building Footprint Extraction
This paper designs the MSAU-Net that can coordinate global and local context information to improve the results of building extraction. This section will describe the proposed network architecture and its components. Our model is based on U-Net [35]. We incorporate spatial attention and channel attention in the skip connection part of the original network. To avoid excessive parameters, our model uses ResNet-34 [36] as the backbone of the feature extraction network. This is because ResNet-34 has suitable feature extraction abilities and its parameter and calculation cost are small. Figure 3 show the structure of the proposed MSAU-Net.
3.2.1. Attention Block
Some studies [37,38,39] showed that making full use of long-range dependencies can improve the performance of a network. However, U-Net only uses convolution and pooling operations, which limits the acquisition of long-range dependencies. Choosing a large convolution kernel can increase the receptive field size of a network, but it can also increase GPU memory occupation. An attention mechanism can effectively refine feature maps to improve the performance of neural networks, and it has become a common method in semantic segmentation problems. However, an attention mechanism will generate computational cost and increase GPU memory usage.
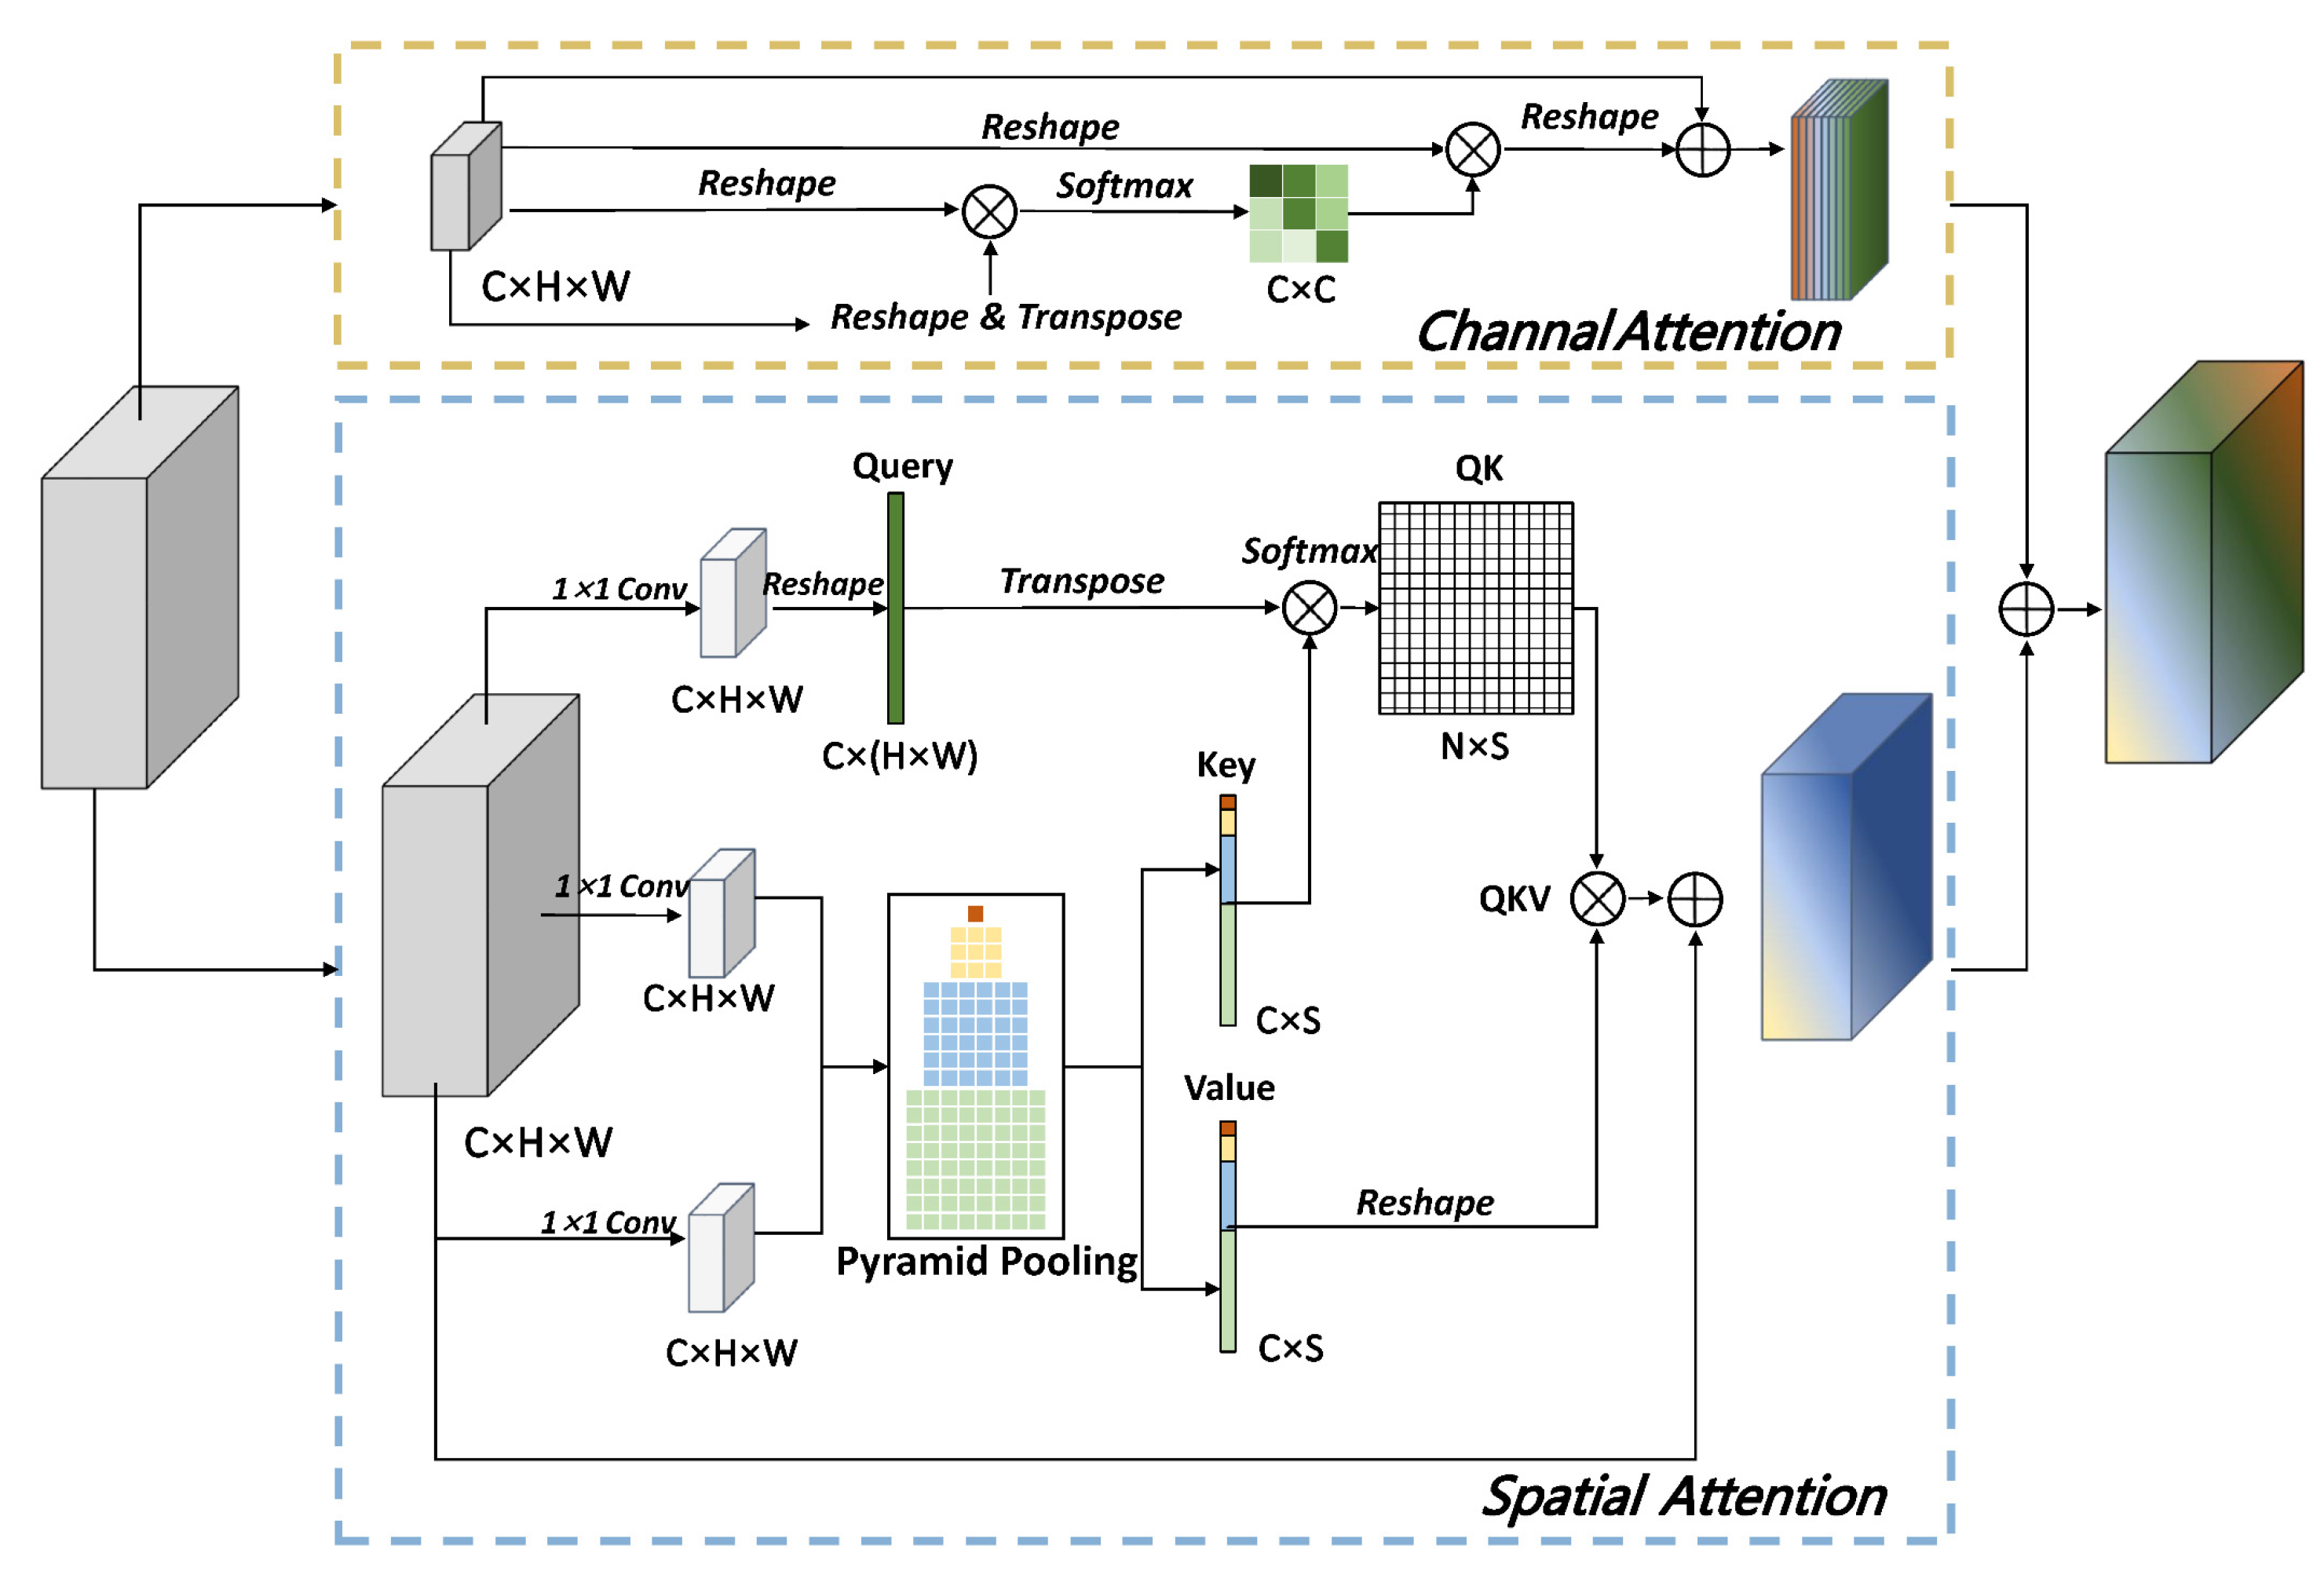
Figure 4 shows the structure of the attention block. The attention block includes the channel attention module and the spatial attention module. The following sections will describe the spatial attention and channel attention modules in detail.
- Spatial Attention Block
Due to the small spectral difference between buildings, roads, sports fields, etc., only using convolution operations is insufficient to obtain long-distance dependencies, as this approach easily causes classification errors. This study introduces the non-local module [40] to obtain the long-distance dependence in spatial dimension of remote sensing images, which makes up for the problem of the small receptive field of convolution operations. The non-local module is an especially useful technique for semantic segmentation. However, it has also been criticized for its prohibitive graphics processing unit (GPU) memory consumption and vast computation cost. Inspired by [41,42,43], to achieve a trade-off between accuracy and extraction efficiency, spatial pyramid pooling was used to reduce the computational complexity and GPU memory consumption of the spatial attention module. Figure 4 shows the structure of the spatial attention module.
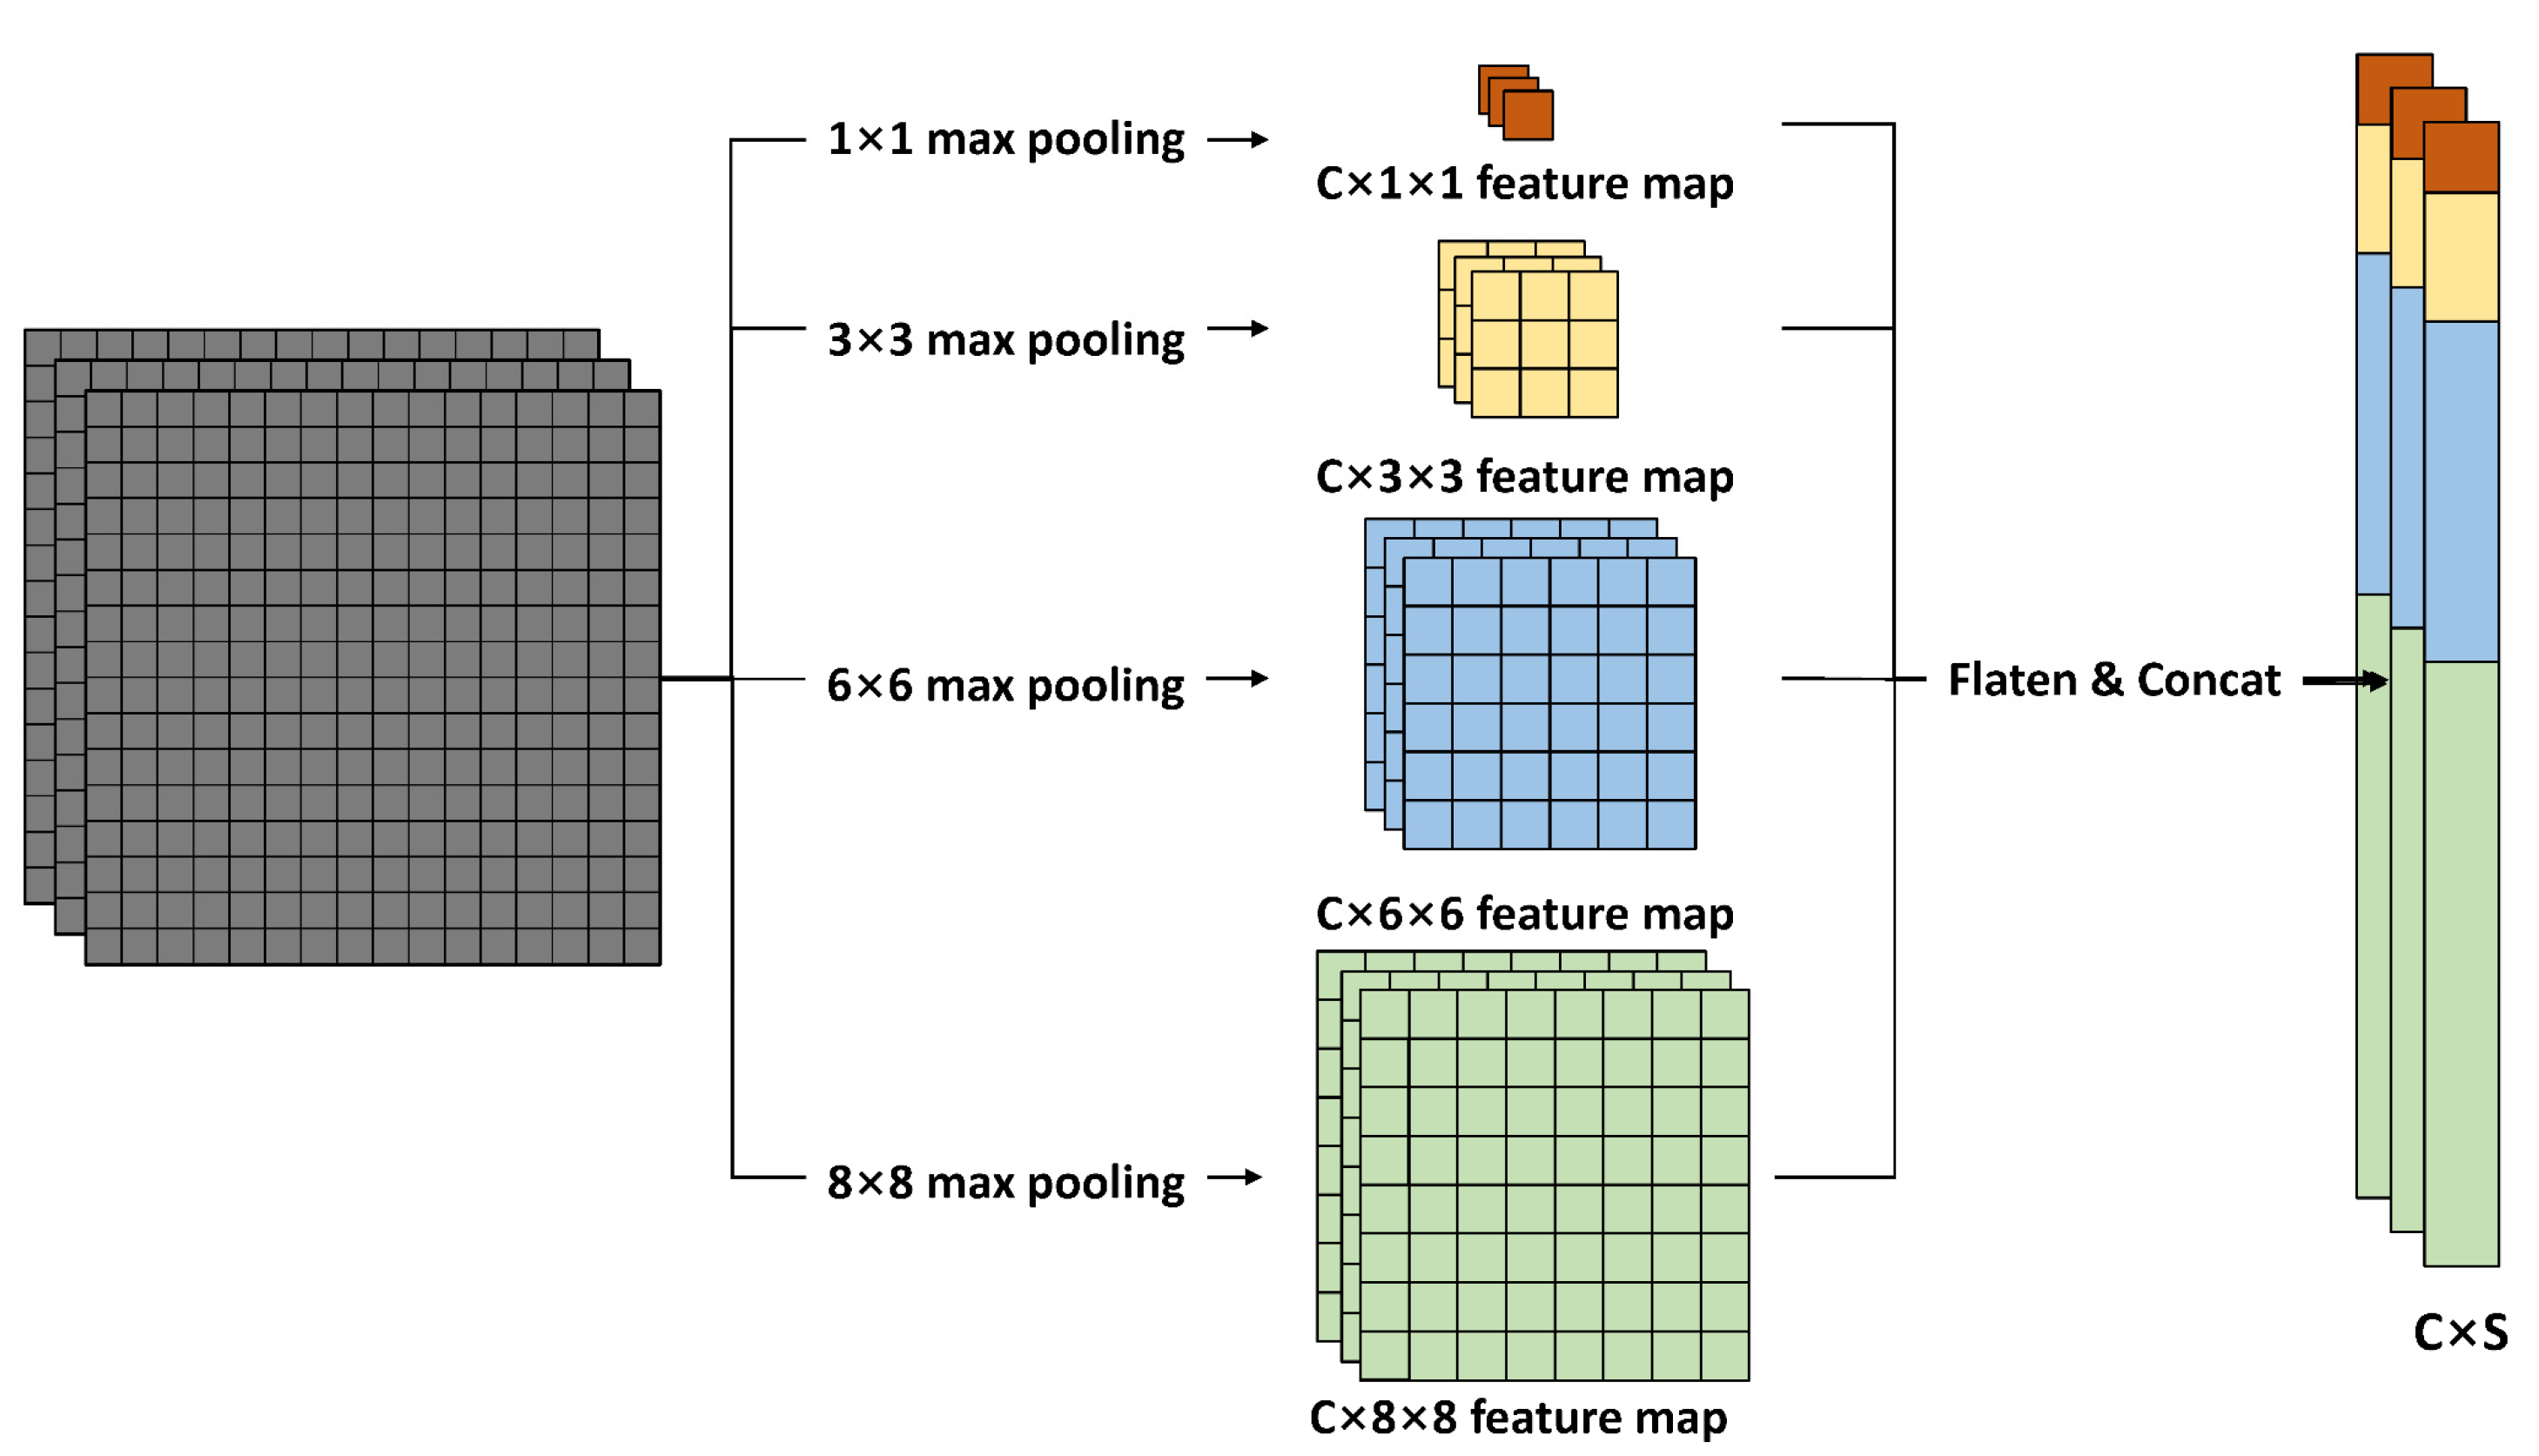
A feature map X of the input size (C × H × W, where C represents the number of channels in the feature map, H represents the height of the feature map, and W represents the width) was used in a 1 × 1 convolution operation to obtain the Query, Key, and Value branches. After entering the Q branch, the feature map with a size of C × H × W was flattened into a two-dimensional vector with a size of C × N, where N = H × W. Feature map Q was transposed to obtain a feature vector Q’ with a size of N × C. After the feature map entered branch K, the feature map with a size of C × H × W was obtained through spatial pyramid pooling to achieve a reduction in dimensionality. The spatial pyramid pooling operation is shown in Figure 5 below. The spatial pyramid pooling module performed the maximum pooling of the input feature map with a window size of n × n to obtain the feature map with a size of C × n × n. The feature map with a size of C × n × n was used to represent the sampling results of representative anchor points in each area of the origin feature map. Then, all the feature maps after the spatial pyramid pooling were flattened and concatenated to obtain a feature vector with a size of C × S, where S was determined by the size and number of the selected pooling windows. For example, in this article, the pooling widow is 1 × 1, 3 × 3, 6 × 6, and 8 × 8, and S is equal to:
After the feature map, X entered the Query and Key branches, and the feature vectors Q’ with a size of N × C and K’ with a size of C × S are matrix multiplied to obtain feature map QK’. Feature map QK’ was normalized by SoftMax to obtain the attention map QK. The purpose of this was to calculate the relationship between each pixel in feature vector Q’ and each pixel in K’. In this way, we can obtain a feature map of C × S size, which represents the attention relationship between the Query pixel and the feature anchor point in the Key, and represents the long-range dependency in the image.
The Value branch is similar to the Key branch. Feature map X inputs the Value branch can obtain feature vector V’ with a size of C × S. After the feature vector was transposed, it was multiplied with attention map QK to generate feature map QKV with a size of C × H × W. Then, feature map QKV and origin feature map X were merged using element-wise summation to obtain the result of the spatial attention module.
- 2.
- Channel Attention Block
In the process of building extraction, each channel of high-level feature maps can be regarded as a response to the specific features of a building, and different channels are related to each other. By extracting the long-range dependence between channel dimension feature maps, we can emphasize the interdependence of the feature maps and improve the feature representation. Therefore, this study used a channel attention module to model the long-range dependence relationship of channel dimensions. The structure of the channel attention module is shown in Figure 4.
The channel attention map was calculated from the original feature map X with a size of C × H × W. Specifically, feature map X was flattened into a feature vector of C × N size (N = H × W). Then, matrix multiplication operations were performed on the feature vector, and the transposition of the feature vector and SoftMax normalization were applied to obtain the channel attention map with a size of C × C.
The channel attention map represents the long-range dependence between the channel dimension of the feature maps. After obtaining the channel attention map, we performed a matrix multiplication operation on input feature map X and the channel attention map to obtain the feature map with a size of C × H × W. After that, the result was multiplied by learnable scale factor and merged with origin feature map X using element-wise summation to obtain the result of the channel attention module.
3.2.2. Training Strategy
In order to attain better building footprint extraction results from GF-7 images, we performed pre-training on the Wuhan University (WHU) [44] building dataset to get the initial pre-training weights. Then, we selected the area in the light blue box in Figure 1 to make training and verification samples. In this paper, the training epoch was set at 120 and 80 for WHU building dataset and GF-7 self-annotated building dataset, the batch size parameter (the number of samples during each training iteration at the same time) was set to 8, the initial learning rate was 0.01, and the input image size was 512 × 512. The learning rate gradually decreases with the increase in training generations to optimize the model. In the training process, sample enhancement processing was performed, including random scale scaling, rotation, flipping, and blur processing.
3.3. Point Cloud Generation
This section uses a stereo pipeline [45,46,47] to generate point cloud from the backward- and forward-view panchromatic GF-7 images. The generation process is shown in Figure 2, and this section will briefly introduce the process of point cloud generation. Since the imaging method of the satellite is push-broom imaging, it was determined that the epipolar line is hyperbolic [46,47]. Research [47] has proven that, when an image is cut into small tiles, a push-broom geometric imaging model can be approximately regarded as a pinhole model; after that, it uses standard stereo image rectification and stereo-matching tools to process the small tiles. However, due to errors in the RPC parameters of satellite images, local and global corrections need to be performed according to the satellite image RPC parameters and feature point matching results to improve the accuracy of the point cloud.
First, the original image performed block processing according to the RPC parameters given by the satellite image to divide the original image into 512 × 512 tiles. The push-broom imaging model can be regarded as a pinhole model in a 512 × 512 size area. Due to the limited accuracy of camera calibration, there is bias in the RPC functions. This bias will cause the global offset of the images; for some purposes, this bias can be ignored [45]. However, the epipolar constraint is derived from the RPC parameters, so it has to be as precise as possible. Thus, the relative errors between the RPC parameters of the multi-view images must be corrected. The local correction method also approximates the push-broom imaging model as a pinhole camera model in small tiles. This study used SIFT [48] to extract and match the feature points in each tile. According to the feature point matching result and combined with the RPC parameter, the translation parameter of the satellite image can be calculated to realize local correction. However, for the whole study area, the local correction will fail, and it must integrate the results of local corrections for global corrections. The global correction method is used to calculate the center of feature points in each tile and combine the local correction results to calculate the affine transformation of the satellite image.
After obtaining the local correction result, stereo image rectification was performed in each tile. The natural method for constructing the epipolar constraint of a stereo image is to use image feature points to perform image correction. However, for satellite imagery, since the distance from the imaging plane to the ground is much larger than the ground fluctuations, it will cause a large error in fundamental matrix F, i.e., the degradation of fundamental matrix F. Additionally, in special cases, the set of feature points are on the same plane, such as the ground. Fundamental matrix F cannot be calculated. Therefore, this paper uses SRTM terrain as prior knowledge and uses local correction results and satellite imagery RPC parameters combined with SRTM information to construct virtual matching points instead of feature matching points. In each tile, virtual points were constructed, estimated the height of the three-space points from the SRTM information, and used the RPC parameter to back-project the point into the multi-view images. In this way, the image of virtual matching points coordinates can be obtained to estimate fundamental matrix F. According to fundamental matrix F, two rectifying affine transformations of the stereo image were extracted to perform image rectification in each tile.
For each rectified tile, a disparity map was calculated by applying a stereo matching algorithm from the stereo rectified image. The SRTM information was used to estimate the initial disparity range. This study chose the classic semi-global stereo matching (SGM) algorithm [49] for stereo matching because of its performance. The disparities are then converted into the point correspondence of the original image coordinates. Combined with the local and global correction results, the ground point coordinates were iteratively calculated to generate point cloud. For more detailed point cloud generation, please refer to the relevant part of the research [45].
3.4. Building Height Extraction
After obtaining the point cloud of the study area, the inverse distance weight interpolation method was used to generate the DSM. However, due to the undulations on the ground, to obtain the height of the building, the elevation value of the lower surface of the building should be extracted from the point cloud.
The point cloud of the study area was filtered to classify ground points and non-ground points. The point cloud generated by satellite imagery is different from the point cloud generated by LiDAR. The point cloud is relatively sparse. Due to viewing angle limitations, there are more hollow areas. This study chose two filtering methods, cloth simulation filtering (CSF) [34] and morphological filtering [50], for filtering processing, and it was found that cloth simulation filtering can achieve better experimental results for the relatively sparse point cloud generated by satellite images.
The main idea of the CSF filtering method is to invert the point cloud and then simulate the process of rigid cloth covering the inverted surface. CSF then analyzed the relationship between the cloth node and the point cloud, determined the position of the cloth node, and separated the ground point by comparing the distance between the original point cloud and the generated cloth. Since this research focuses on buildings, the point cloud of buildings presents a planar distribution far away from the ground points. In the cloth simulation filtering, the cloth with higher hardness is selected for point filtering. In this way, CSF can achieve a better filtering result.
After obtaining the ground point cloud of the study area, the inverse distance weight interpolation method is also used to generate the DEM of the study area. Then, DSM and DEM were performed for difference processing to generate the nDSM. Combined with the results produced in Section 3.1, the building footprint results are superimposed with nDSM. Building heights were assigned as the maximum value of nDSM after removing the outliers of nDSM within each building footprint.
3.5. Evaluation Metrics
In order to test the feasibility of our building 3D information extraction method, this study verified the accuracy of the building footprint and building height results, respectively. Experimental results and accuracy verification are shown in Section 4. This section will introduce the accuracy evaluation method and the indicator calculation method.
To quantitatively evaluate and compare the segmentation performance of footprint extraction, five widely used metrics, i.e., overall accuracy (OA), intersection-over-union (IOU), precision rate, recall, and F1 score, were calculated based on the error matrix:
where TP is true positive, TN is true negative, FP is false positive, and FN is false negative.
Height accuracy was verified by comparing reference buildings and estimated building heights and selecting the mean absolute error (MAE) and the root mean error (RMSE) as evaluation indicators. The specific formulas are as follows:
where denotes the predicted height at building , denotes the corresponding ground truth height, and denotes the total number of buildings.
4. Results and Discussion
4.1. Performance of Building Footprint Extraction
In order to verify the performance of building footprint extraction, classic networks such as PSPNet [37], FCN [51], DeepLab v3 + [52], SegNet [53], and U-Net [35] were used for comparison. Experimental results of the WHU building segmentation dataset and the GF-7 self-annotated building dataset are as follows. Experiments are conducted on a computer that has an Intel®Core™ i9-10980XE GPU @3.00 GHz and 64 GB memory. The GPU type used in this computer is RTX 3090 with 24 GB GPU memory.
4.1.1. WHU Building Dataset
The WHU building dataset consists of an aerial image dataset and two satellite image datasets. It has become a benchmark dataset for testing the performance of building footprint extraction bases with deep learning because of the high quality of data annotation. This study uses the WHU aerial dataset to test our model. The WHU aerial dataset contains 8188 non-overlapping images (512 × 512 tiles with spatial resolution 0.3 m), covering 450 square kilometers of Christchurch, New Zealand. Among them, 4736 tiles (containing 130,500 buildings) are separated for training, 1036 tiles (containing 14,500 buildings) are separated for validating, and the rest, 2416 tiles (containing 42,000 buildings), are used for testing. The proposed deep learning of the MSAU-Net is implemented using PyTorch in the Window platform. After 120 epochs (3.8 h of training time), our network achieves a better result on the WHU dataset (Table 1). The changing losses and IOU of the WHU building dataset with the increasing epochs are shown in Figure 6.
Four representative experimental results were selected for qualitative assessment of the various building extraction methods. In Figure 7, original image 1 shows a densely distributed group of small buildings. Our model can suitably maintain the appearance of buildings. The red box in original image 2 is a container-like object that is easily confused with buildings. Compared with U-Net, our model can effectively avoid recognizing objects such as buildings due to its increased long-range dependency. Original picture 3 shows large buildings. It can be seen that PSPNet, SegNet, and ours can produce better experimental results. However, while PSPNet and SegNet easily cause blurred boundaries, our model can keep the details of the building’s boundary. The red box in original picture 4 shows buildings with an unusual shape. It can be seen that our method can maintain the unusual shape of buildings. In summary, due to its increasing long-range dependence, our model can effectively extract building footprints from fine-resolution remote sensing images. In relation to large buildings and unusually shaped buildings, our method can enhance the integrity and accuracy of a building’s shape. This is highly important for the process of building footprint extraction from GF-7 multi-spectral images.
The experimental results of the WHU building dataset are shown in Table 1. From Table 1, it is clear that our method shows a significant improvement in IOU and F1-score. The OA (overall accuracy), precision, and recall are slightly improved. However, OA describes the proportion of correctly classified pixels to total pixels. The IOU indicator describes the proportion of correctly classified building pixels to the total number of pixels in all building categories (including ground truth and predicted buildings). F1-score integrates accuracy and recall. Therefore, F1-score and IOU indicators are more convincing metrics. The WHU building dataset experimental result shows that the building footprint extraction ability of our model is better than other models.
4.1.2. GF-7 Self-Annotated Building Dataset
For the test of building footprint extraction, this study uses the GF-7 self-annotated building dataset to train and test the model. The GF-7 self-annotated building dataset contains 384 non-overlapping images (512 × 512 tiles with spatial resolution 0.65 m), covering 41.2 square kilometers of Beijing. Among them, 300 tiles (containing 4369 buildings) are separated for training, while 38 tiles (containing 579 buildings) are separated for validation. In order to verify the performance of building footprint extraction from GF-7 images, this study selected typical buildings in the study area to establish our test set (contains 46 non-overlapping 512 × 512 images, 886 buildings). During the MSAU-Net training, the training epoch was set at 80 for the GF-7 self-annotated building dataset, and the training time was 1.1 h. The changing losses and IOU of the GF-7 self-annotated building dataset with the increasing epochs are shown in Figure 8.
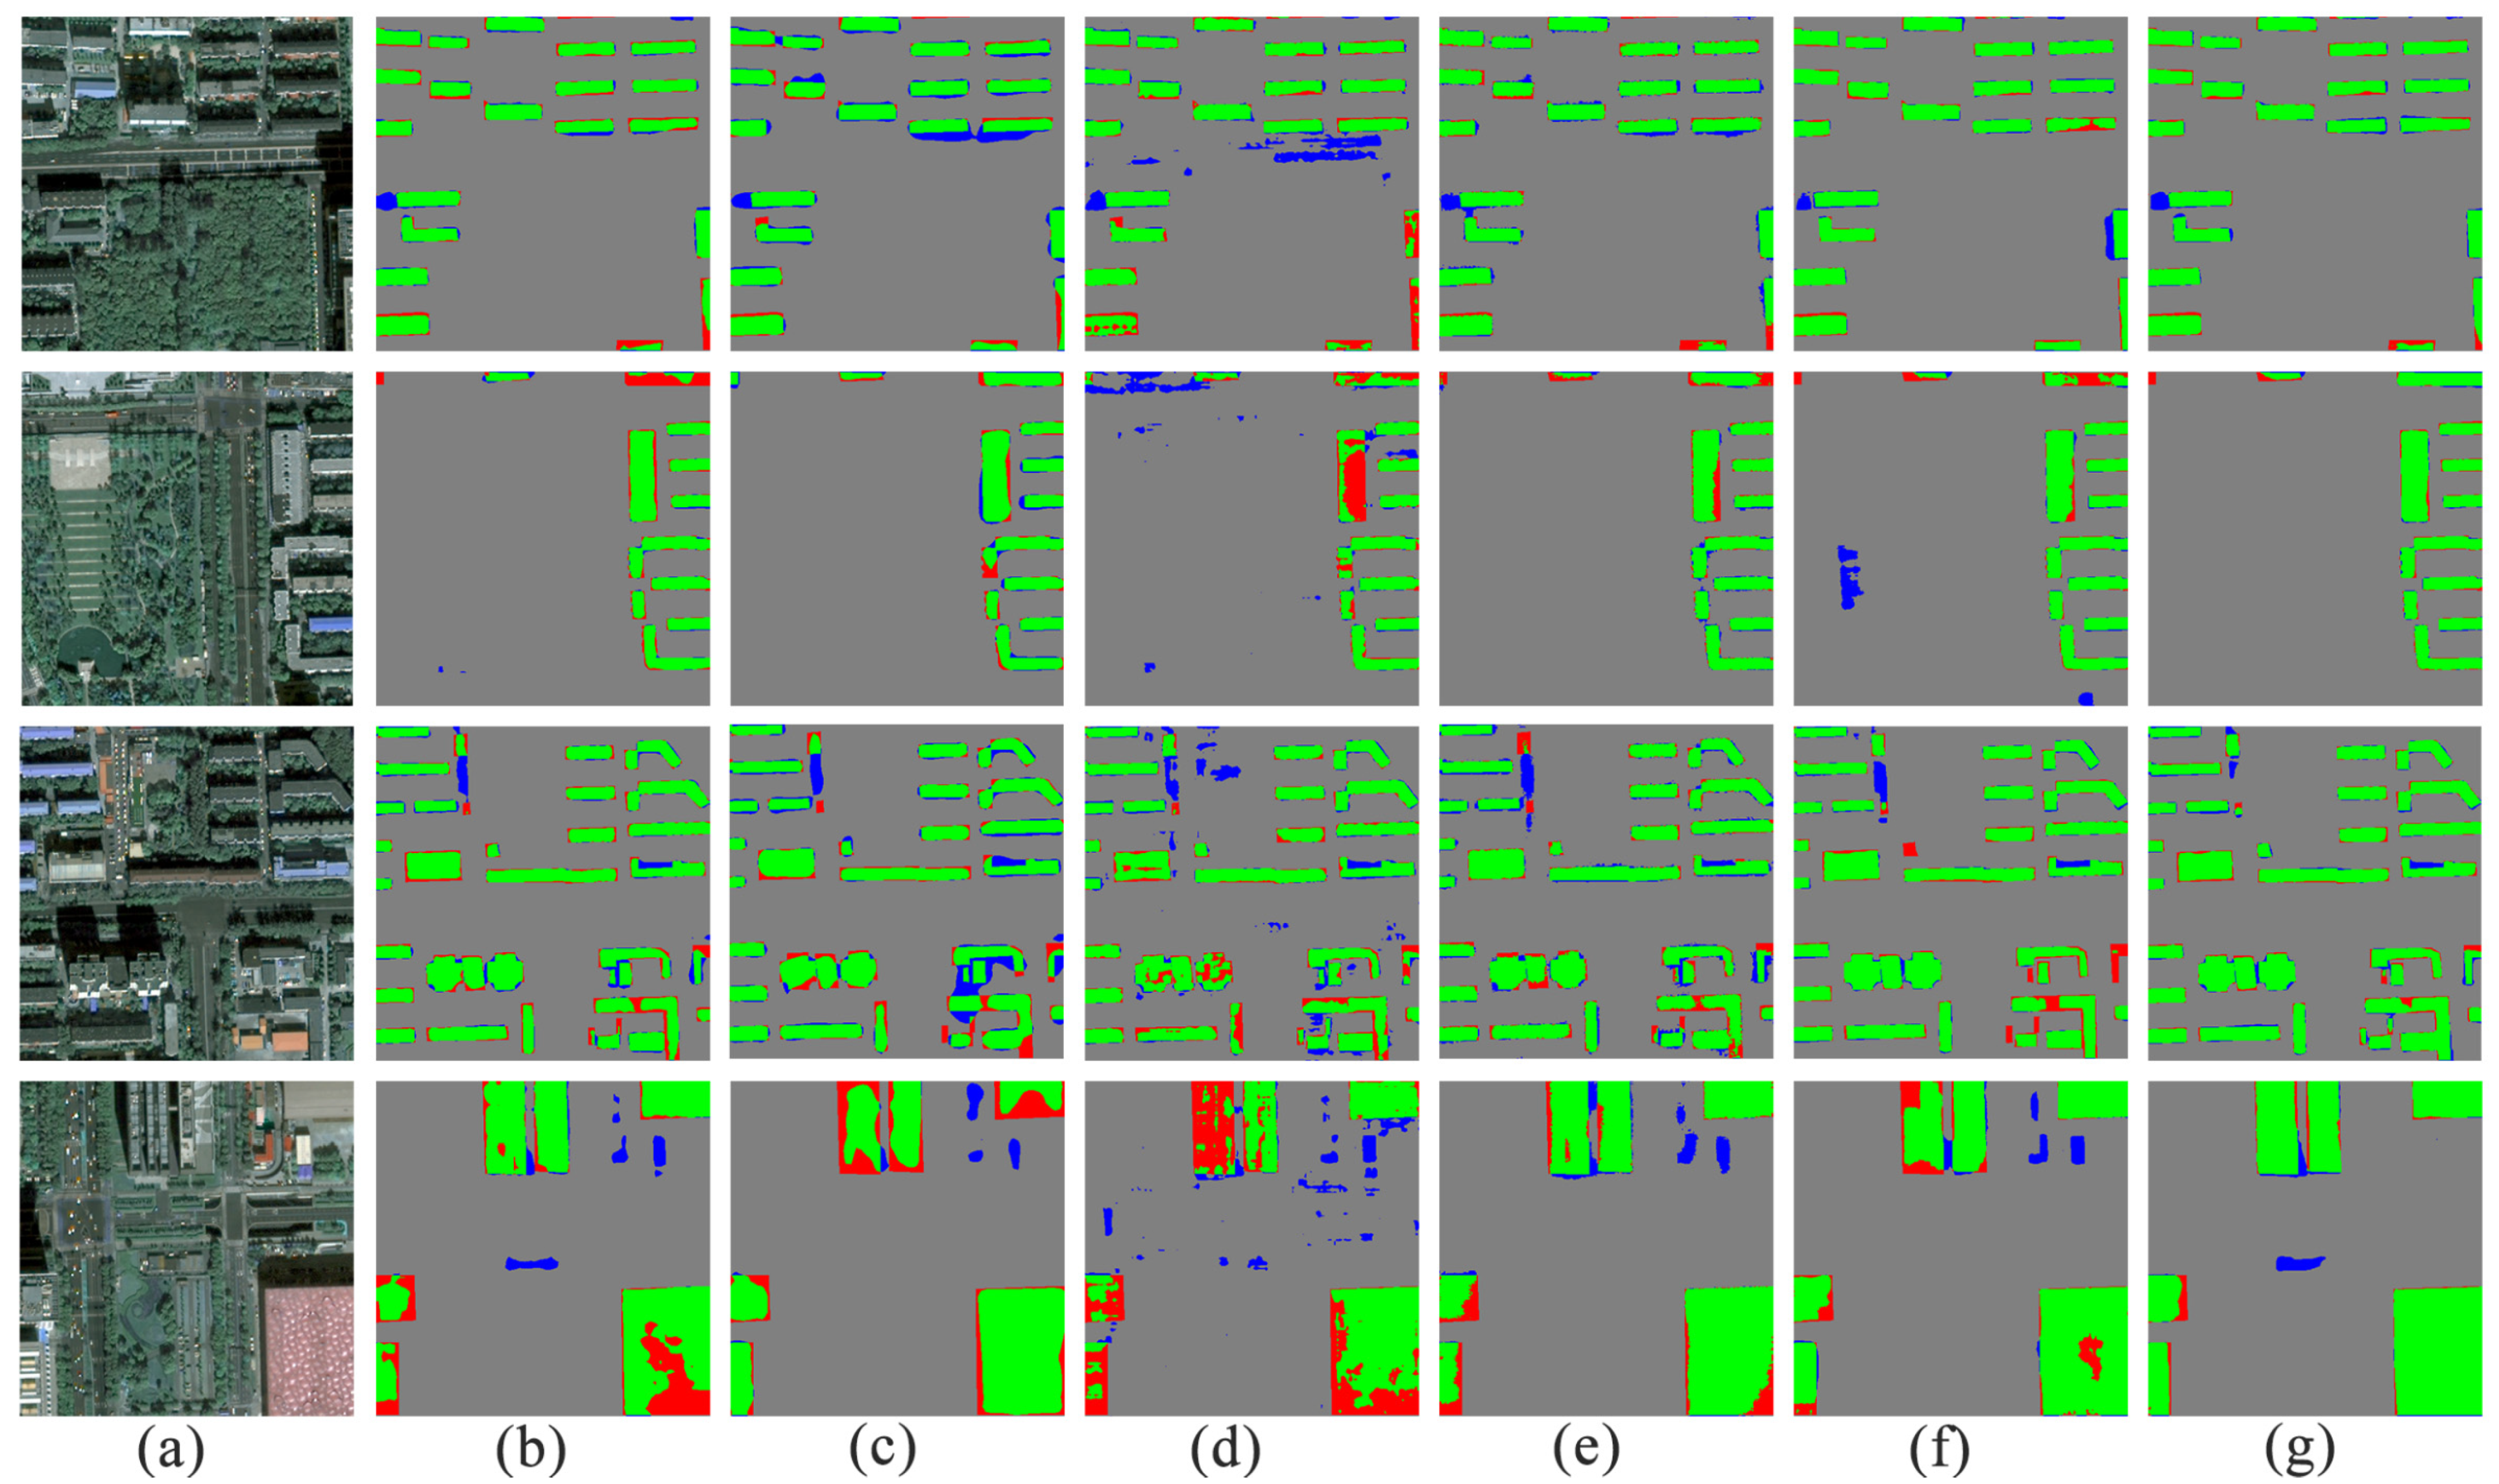
Similarly, four representative areas were selected to display the results of the GF-7 self-annotated building dataset for qualitative assessment (Figure 9). Original image 1 is a typical building group in the study area. From the experimental results, our method can maintain the appearance of buildings. Original picture 2 shows that, for large buildings, our method can maintain the integrity of a building footprint due to the increased long-range dependence. The red box of original image 3 is a building with an unusual shape. Our method can obtain a relatively better experimental result than other models. The red box of original image 4 is a landmark building in the study area (the 2008 Olympic venue, Water Cube). From the experimental results, our method can maintain the integrity of the Water Cube.
The experimental results of the GF-7 self-annotated building segmentation dataset are shown in Table 2. As can been from Table 2, our model has significantly improved IOU and F1-score. However, OA and recall are slightly improved. Since the GF-7 multi-spectral image resolution is 2.6 m, compared with the WHU building dataset with a resolution of 0.3 m, building footprint extraction is more complicated, and it is prone to confusion between building areas and non-building areas. Therefore, compared with the results of the WHU building dataset (Table 1), the IOU indicator on the GF-7 (Table 2) is lower. Experimental results show that our model can attain a better performance in relation to building footprints from GF-7 images.
In order to display the accuracy of the results more intuitively, we display the predicted results in color (Figure 10). The green area represents true positive, the grey area represents false negative, the blue area represents false positive, and the red area represents true negative. When the green area (true positive) is in the majority, and the red area (true negative) and the blue area (false positive) are in the minority, the extraction effect is good. From Figure 10, compared with the results of the other five methods, the ratio of the red part and blue part in the extraction result of our method is significantly reduced.
4.2. Performance of Building Height Extraction
Figure 11 shows the results of point cloud generation. The results show that the point cloud generation results are relatively sparse but can reflect surface elevation information. In Figure 11c, for single large buildings, the point cloud results are better, as they present a planar distribution far away from the ground points. Additionally, Figure 11a shows that the average seabed in the northeast is lower than the southwest in the study area, which is also in line with the actual geography of Beijing. However, due to the limited viewing angle of satellite images, the point cloud results are poor for dense low-rise buildings, such as the middle and lower parts of the research area. Figure 11d–i show the ground point cloud results and the off-ground point cloud results after CSF. The results show that our method can obtain a relatively complete ground point cloud.
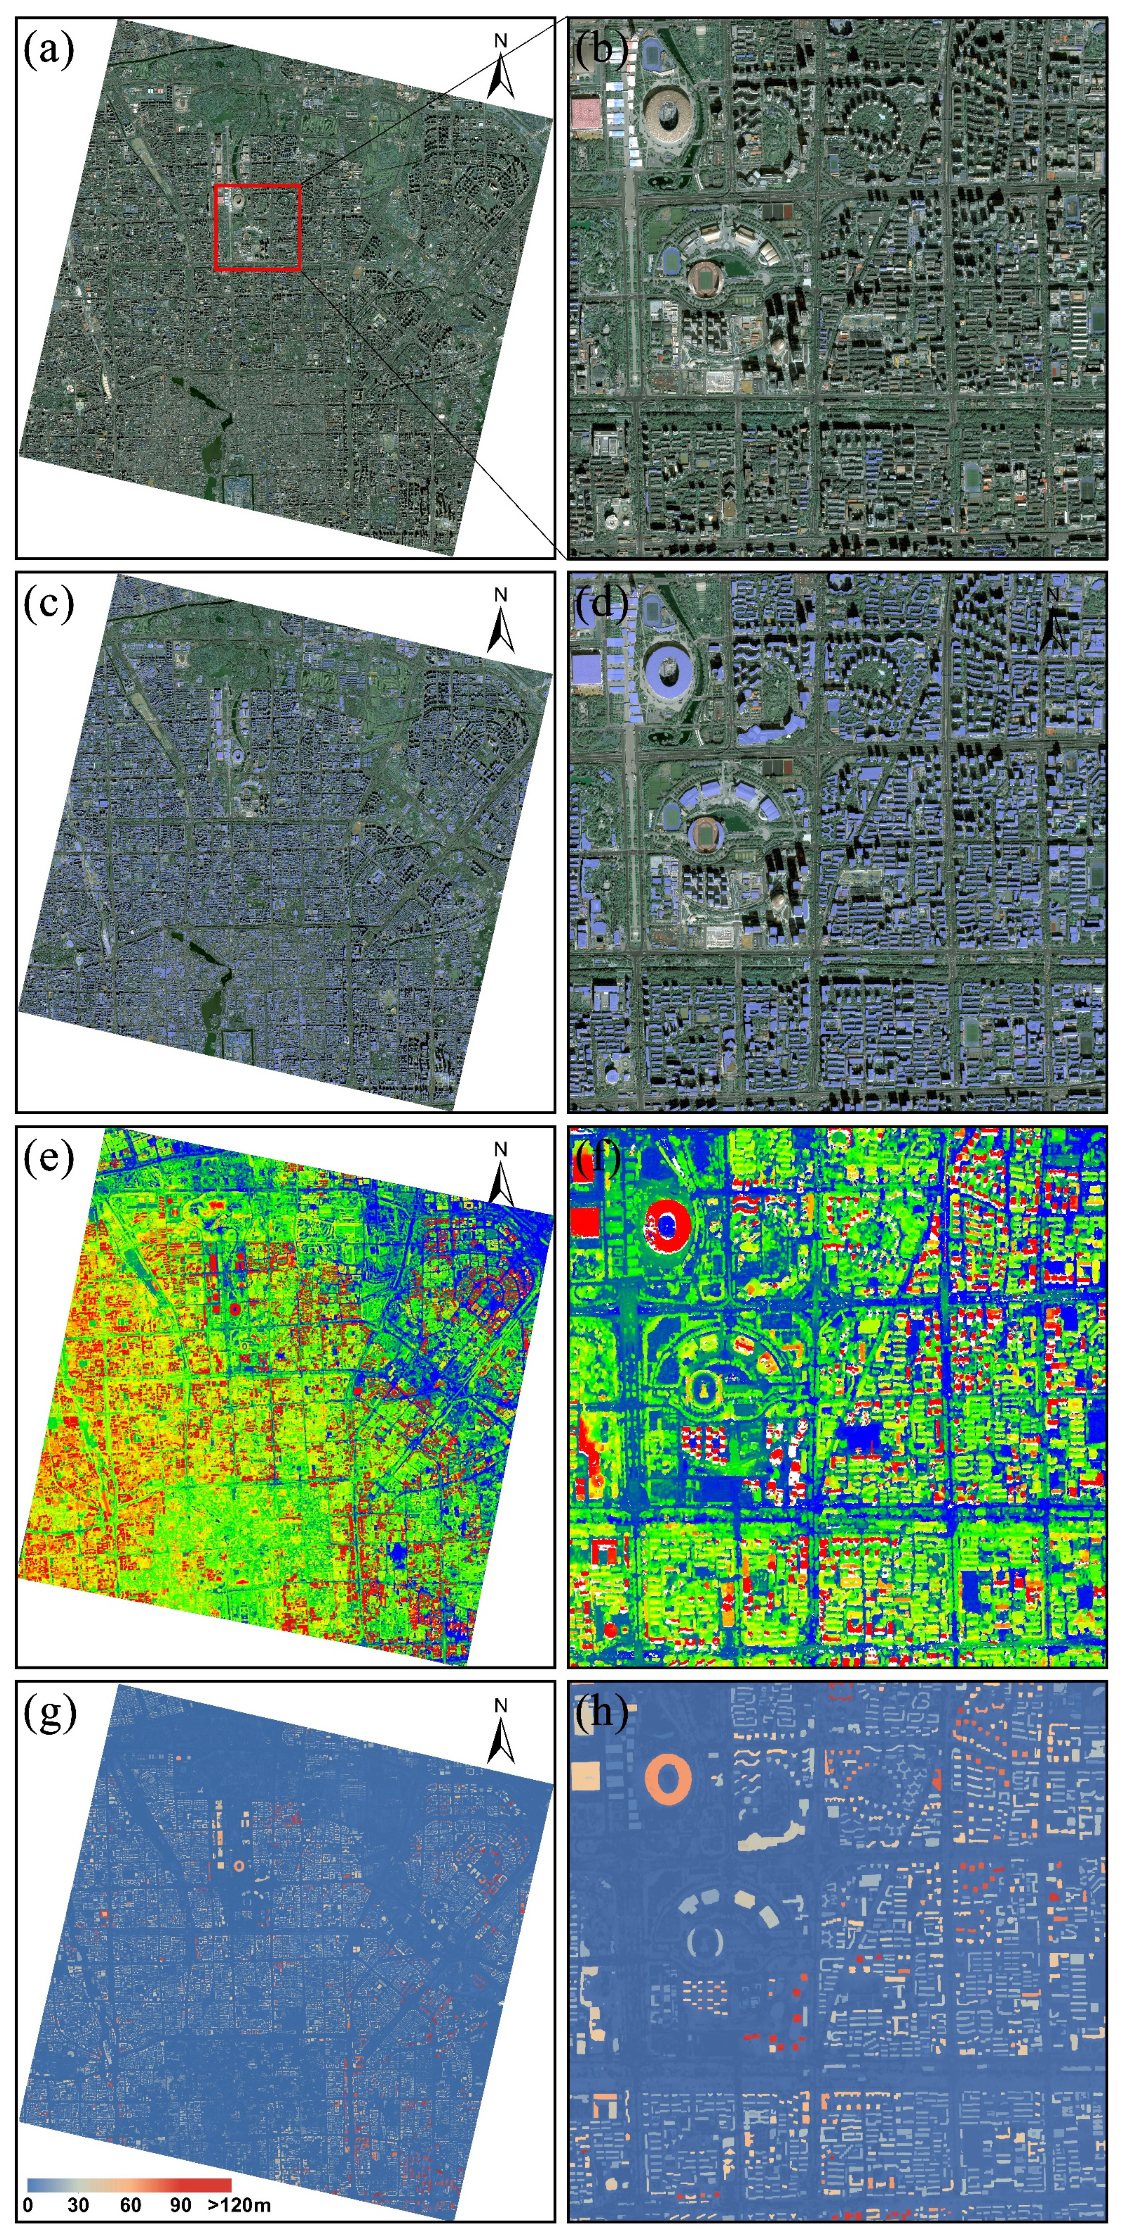
The results of the building footprint and height extraction in the study area are shown in Figure 12 to demonstrate the effectiveness of our method. Based on the original image Figure 12a, the corresponding building footprint Figure 12c, point cloud Figure 12e, and building height results Figure 12g are generated; they are enlarged and displayed Figure 12b,d,f,h, respectively. The accuracy of our building footprint extraction results has been quantitatively analyzed in the previous section. It can be seen from Figure 12c,d that our method can obtain relatively complete and accurate building footprint information. Figure 12g is the building height result of the study area; the following section will verify the building height results based on the reference building heights.
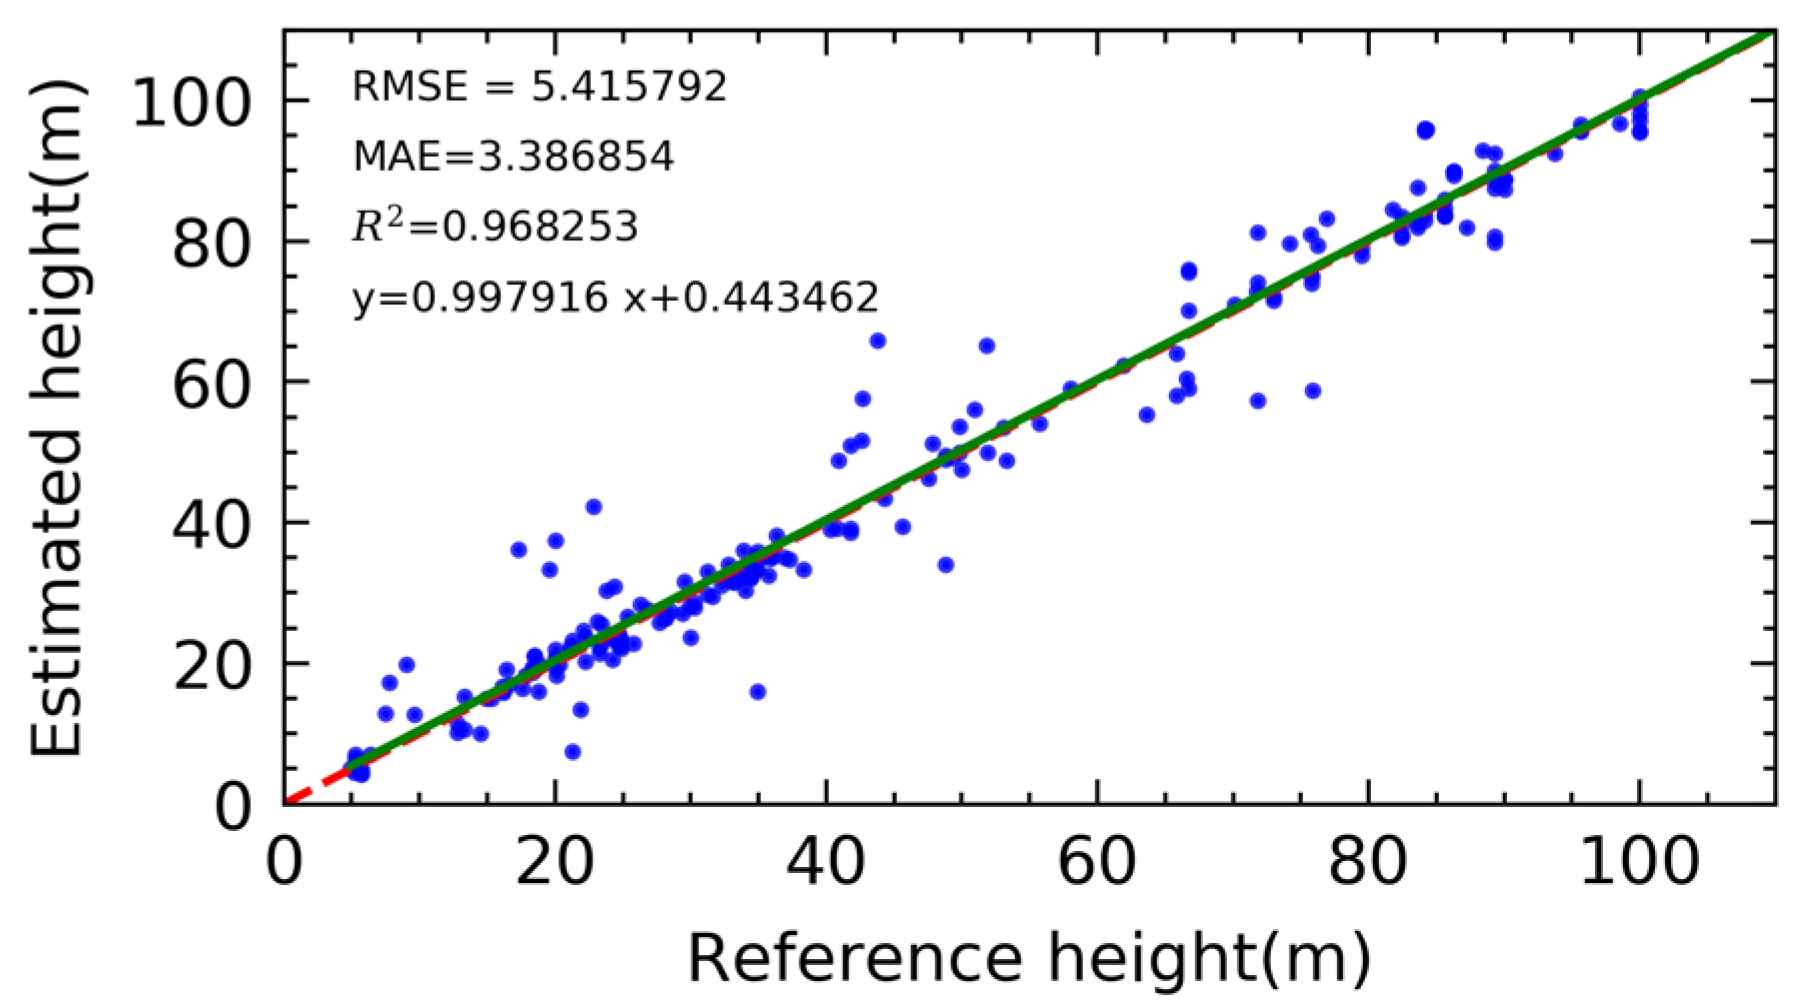
In order to quantitatively analyze the accuracy of an estimated building height, we measured 213 buildings with different height levels as the reference building height. By comparing the height of the extracted building with the height of the reference building, a quantitative evaluation is carried out according to the RMSE and MAE indicators. The evaluation result is shown in Figure 13. Building height RMSE is 5.41, the average building error is 3.38, and the correlation coefficient is 0.96, all of which point to an excellent experimental result. Linear fitting was performed on the extracted building height, and it can be seen that the line after fitting indicates that the building height value extracted by our method fluctuates up and down in relation to actual building height. Compared with other building height extraction methods based on optical satellite images, our method can achieve better experimental accuracy [26,31].
To analyze whether there was a correlation between the accuracy of the building height value extracted by our method and the actual building height, the building was divided into three groups according to the actual height, i.e., below 30 m, between 30 and 70 m, and higher than 70 m, and the RMSE and MAE were calculated for each group, respectively. The results are shown in Table 3 below. The results show that there is not much difference between the three sets of RMSE, indicating that our height extraction accuracy has little relationship with the height of the building. However, the RMSE of the building height above 30 m is greater than the RMSE of the building height below 30 m, indicating that the estimation of middle- and high-rise buildings is unstable.
The 3D information results of our method are shown in Figure 14. The experimental results and quantitative verification show that our method could be useful for accurate and automatic 3D building information extraction from GF-7 satellite images. However, for dense, low-rise buildings, such as the center of Beijing (which consists of mostly ancient buildings), due to the diversity of buildings and the viewing angle limitations of satellite imagery, both the result of footprint extraction and the result of point cloud are poor. Therefore, for dense and low-rise buildings, our method cannot get a good 3D information extraction effect.
5. Conclusions
This study aimed to extract building footprint and height information based on GF-7 satellite images. This was done in view of the existing problems in the current research field: the accuracy of building semantic segmentation is not high; most high-resolution building height information extraction is limited to small scales, and there is a lack of large-scale high-resolution building height extraction methods; GF-7 multi-view satellite images can describe the vertical structure of ground objects, but there is little research on building information extraction from GF-7 satellite images, meaning that satellite building information extraction capabilities are yet to be evaluated fully. Given these issues, we have carried out this research to develop a method for extracting 3D building information from GF-7 satellite images. We proposed a multi-stage U-Net (MSAU-Net) for building footprint extraction from GF-7 multi-spectral images. Then, we generated point cloud data from GF-7 multi-view images and constructed an nDSM to represent the height of off-terrain objects. Building height is generated by combining the results of the building footprint. Finally, we evaluated the accuracy of the extraction results based on reference building information.
We chose the Beijing area as the study area to verify the performance of our proposed method. We tested our model on two datasets: the WHU building dataset and the GF-7 self-annotated building dataset. Our model achieved IOU indicators of 89.31% and 80.27% for the WHU and GF-7 self-annotated datasets, respectively; these values were higher than the IOU indicators of other models. The RMSE between the estimated building height and the reference building height is 5.42 m, and the MAE is 3.39 m, which is higher than other building height extraction methods. The experimental results and quantitative verification show that our method could be useful for accurate and automatic 3D building information extraction from GF-7 satellite images, which has potential for application in various fields. Our method is the first attempt to extract 3D building information in dense urban areas based on GF-7 satellite images, proving the ability of GF-7 satellite images to extract 3D information of buildings. Similarly, our future work will examine 3D modeling on urban buildings based on GF-7 satellite images.
Author Contributions
Conceptualization, J.W. and Q.M.; methodology, J.W.; software, J.W.; validation, J.W., Q.M. and X.H.; formal analysis, L.Z.; investigation, X.H.; resources, Q.M.; data curation, X.L.; writing—original draft preparation, J.W.; writing—review and editing, Q.M.; visualization, C.W.; supervision, M.Z.; project administration, Q.M.; funding acquisition, Q.M. All authors have read and agreed to the published version of the manuscript.
Funding
This research was funded by (the Major Projects of High Resolution Earth Observation Systems of National Science and Technology (05-Y30B01-9001-19/20-1)), (The National Key Research and Development Program of China (2020YFC0833100)).
Acknowledgments
Our gratitude to the Group of Photogrammetry and Computer Vision (GPCV), Wuhan University for providing WHU Building Dataset (https://study.rsgis.whu.edu.cn/pages/download/building_dataset.html).
Conflicts of Interest
The authors declare no conflict of interest.
References
- Mahtta, R.; Mahendra, A.; Seto, K.C. Building up or spreading out? Typologies of urban growth across 478 cities of 1 million+. Environ. Res. Lett. 2019, 14, 124077. [Google Scholar] [CrossRef] [Green Version]
- Seto, K.C.; Dhakal, S.; Bigio, A.; Blanco, H.; Delgado, G.C.; Dewar, D.; Huang, L.; Inaba, A.; Kansal, A.; Lwasa, S. Human settlements, infrastructure and spatial planning. In Climate Change 2014: Mitigation of Climate Change. IPCC Working Group III Contribution to AR5; Cambridge University Press: Cambridge, UK, 2014. [Google Scholar]
- Berger, C.; Rosentreter, J.; Voltersen, M.; Baumgart, C.; Schmullius, C.; Hese, S. Spatio-temporal analysis of the relationship between 2D/3D urban site characteristics and land surface temperature. Remote Sens. Environ. 2017, 193, 225–243. [Google Scholar] [CrossRef]
- Venter, Z.S.; Brousse, O.; Esau, I.; Meier, F. Hyperlocal mapping of urban air temperature using remote sensing and crowdsourced weather data. Remote Sens. Environ. 2020, 242, 111791. [Google Scholar] [CrossRef]
- Huang, X.; Wen, D.; Li, J.; Qin, R. Multi-level monitoring of subtle urban changes for the megacities of China using high-resolution multi-view satellite imagery. Remote Sens. Environ. 2017, 196, 56–75. [Google Scholar] [CrossRef]
- Xia, M.; Jia, K.; Zhao, W.; Liu, S.; Wei, X.; Wang, B. Spatio-temporal changes of ecological vulnerability across the Qinghai-Tibetan Plateau. Ecol. Indic. 2021, 123, 107274. [Google Scholar] [CrossRef]
- Qin, R. Change detection on LOD 2 building models with very high resolution spaceborne stereo imagery. ISPRS J. Photogramm. Remote Sens. 2014, 96, 179–192. [Google Scholar] [CrossRef]
- Hang, J.; Li, Y.; Sandberg, M.; Buccolieri, R.; Di Sabatino, S. The influence of building height variability on pollutant dispersion and pedestrian ventilation in idealized high-rise urban areas. Build. Environ. 2012, 56, 346–360. [Google Scholar] [CrossRef]
- Facciolo, G.; De Franchis, C.; Meinhardt-Llopis, E. Automatic 3D reconstruction from multi-date satellite images. In Proceedings of the IEEE Conference on Computer Vision and Pattern Recognition, Honolulu, HI, USA, 21–26 July 2017; pp. 57–66. [Google Scholar]
- Bullinger, S.; Bodensteiner, C.; Arens, M. 3D Surface Reconstruction From Multi-Date Satellite Images. arXiv 2021, arXiv:2102.02502. [Google Scholar] [CrossRef]
- Qin, R.; Song, S.; Ling, X.; Elhashash, M. 3D reconstruction through fusion of cross-view images. In Recent Advances in Image Restoration with Applications to Real World Problems; IntechOpen: London, UK, 2020; p. 123. [Google Scholar]
- Gui, S.; Qin, R. Automated LoD-2 model reconstruction from very-high-resolution satellite-derived digital surface model and orthophoto. ISPRS J. Photogramm. Remote Sens. 2021, 181, 1–19. [Google Scholar] [CrossRef]
- Huang, X.; Chen, H.; Gong, J. Angular difference feature extraction for urban scene classification using ZY-3 multi-angle high-resolution satellite imagery. ISPRS J. Photogramm. Remote Sens. 2018, 135, 127–141. [Google Scholar] [CrossRef]
- Güneralp, B.; Zhou, Y.; Ürge-Vorsatz, D.; Gupta, M.; Yu, S.; Patel, P.L.; Fragkias, M.; Li, X.; Seto, K.C. Global scenarios of urban density and its impacts on building energy use through 2050. Proc. Natl. Acad. Sci. USA 2017, 114, 8945–8950. [Google Scholar] [CrossRef] [PubMed] [Green Version]
- Xu, M.; Cao, C.; Jia, P. Mapping fine-scale urban spatial population distribution based on high-resolution stereo pair images, points of interest, and land cover data. Remote Sens. 2020, 12, 608. [Google Scholar] [CrossRef] [Green Version]
- Tomás, L.; Fonseca, L.; Almeida, C.; Leonardi, F.; Pereira, M. Urban population estimation based on residential buildings volume using IKONOS-2 images and lidar data. Int. J. Remote Sens. 2016, 37, 1–28. [Google Scholar] [CrossRef] [Green Version]
- Xie, Y.; Weng, A.; Weng, Q. Population estimation of urban residential communities using remotely sensed morphologic data. IEEE Geosci. Remote Sens. Lett. 2015, 12, 1111–1115. [Google Scholar]
- Liu, P.; Liu, X.; Liu, M.; Shi, Q.; Yang, J.; Xu, X.; Zhang, Y. Building Footprint Extraction from High-Resolution Images via Spatial Residual Inception Convolutional Neural Network. Remote Sens. 2019, 11, 830. [Google Scholar] [CrossRef] [Green Version]
- Huang, Z.; Cheng, G.; Wang, H.; Li, H.; Shi, L.; Pan, C. Building extraction from multi-source remote sensing images via deep deconvolution neural networks. In Proceedings of the 2016 IEEE International Geoscience and Remote Sensing Symposium (IGARSS), Beijing, China, 10–15 July 2016; pp. 1835–1838. [Google Scholar]
- Lu, T.; Ming, D.; Lin, X.; Hong, Z.; Bai, X.; Fang, J. Detecting building edges from high spatial resolution remote sensing imagery using richer convolution features network. Remote Sens. 2018, 10, 1496. [Google Scholar] [CrossRef] [Green Version]
- Li, Q.; Shi, Y.; Huang, X.; Zhu, X.X. Building Footprint Generation by Integrating Convolution Neural Network With Feature Pairwise Conditional Random Field (FPCRF). IEEE Trans. Geosci. Remote Sens. 2020, 58, 7502–7519. [Google Scholar] [CrossRef]
- Zhang, Z.; Guo, W.; Li, M.; Yu, W. GIS-supervised building extraction with label noise-adaptive fully convolutional neural network. IEEE Geosci. Remote Sens. Lett. 2020, 17, 2135–2139. [Google Scholar] [CrossRef]
- Wang, C.; Li, L. Multi-Scale Residual Deep Network for Semantic Segmentation of Buildings with Regularizer of Shape Representation. Remote Sens. 2020, 12, 2932. [Google Scholar] [CrossRef]
- Zhu, Q.; Liao, C.; Hu, H.; Mei, X.; Li, H. MAP-Net: Multiple Attending Path Neural Network for Building Footprint Extraction From Remote Sensed Imagery. IEEE Trans. Geosci. Remote Sens. 2021, 59, 6169–6181. [Google Scholar] [CrossRef]
- Liu, Y.; Chen, D.; Ma, A.; Zhong, Y.; Fang, F.; Xu, K. Multiscale U-Shaped CNN Building Instance Extraction Framework with Edge Constraint for High-Spatial-Resolution Remote Sensing Imagery. IEEE Trans. Geosci. Remote Sens. 2021, 59, 6106–6120. [Google Scholar] [CrossRef]
- Cao, Y.; Huang, X. A deep learning method for building height estimation using high-resolution multi-view imagery over urban areas: A case study of 42 Chinese cities. Remote Sens. Environ. 2021, 264, 112590. [Google Scholar] [CrossRef]
- Yang, X.; Wang, C.; Xi, X.; Wang, P.; Lei, Z.; Ma, W.; Nie, S. Extraction of multiple building heights using ICESat/GLAS full-waveform data assisted by optical imagery. IEEE Geosci. Remote Sens. Lett. 2019, 16, 1914–1918. [Google Scholar] [CrossRef]
- Cheng, F.; Wang, C.; Wang, J.; Tang, F.; Xi, X. Trend analysis of building height and total floor space in Beijing, China using ICESat/GLAS data. Int. J. Remote Sens. 2011, 32, 8823–8835. [Google Scholar] [CrossRef]
- Li, X.; Zhou, Y.; Gong, P.; Seto, K.C.; Clinton, N. Developing a method to estimate building height from Sentinel-1 data. Remote Sens. Environ. 2020, 240, 111705. [Google Scholar] [CrossRef]
- Qi, F.; Zhai, J.Z.; Dang, G. Building height estimation using Google Earth. Energy Build. 2016, 118, 123–132. [Google Scholar] [CrossRef]
- Liu, C.; Huang, X.; Wen, D.; Chen, H.; Gong, J. Assessing the quality of building height extraction from ZiYuan-3 multi-view imagery. Remote Sens. Lett. 2017, 8, 907–916. [Google Scholar] [CrossRef]
- Xu, Y.; Ma, P.; Ng, E.; Lin, H. Fusion of worldview-2 stereo and multitemporal TerraSAR-X images for building height extraction in urban areas. IEEE Geosci. Remote Sens. Lett. 2015, 12, 1795–1799. [Google Scholar]
- Chen, Q.; Wang, L.; Waslander, S.L.; Liu, X. An end-to-end shape modeling framework for vectorized building outline generation from aerial images. ISPRS J. Photogramm. Remote Sens. 2020, 170, 114–126. [Google Scholar] [CrossRef]
- Zhang, W.; Qi, J.; Wan, P.; Wang, H.; Xie, D.; Wang, X.; Yan, G. An Easy-to-Use Airborne LiDAR Data Filtering Method Based on Cloth Simulation. Remote Sens. 2016, 8, 501. [Google Scholar] [CrossRef]
- Ronneberger, O.; Fischer, P.; Brox, T. U-net: Convolutional networks for biomedical image segmentation. In Proceedings of the International Conference on Medical Image Computing and Computer-Assisted Intervention—MICCAI 2015, Munich, Germany, 5–9 October 2015; pp. 234–241. [Google Scholar]
- He, K.; Zhang, X.; Ren, S.; Sun, J. Deep residual learning for image recognition. In Proceedings of the IEEE Conference on Computer Vision and Pattern Recognition (CVPR), Las Vegas, NV, USA, 27–30 June 2016; pp. 770–778. [Google Scholar]
- Zhao, H.; Shi, J.; Qi, X.; Wang, X.; Jia, J. Pyramid Scene Parsing Network. In Proceedings of the 2017 IEEE Conference on Computer Vision and Pattern Recognition (CVPR), Honolulu, HI, USA, 21–26 July 2017; Volume 1, pp. 6230–6239. [Google Scholar]
- Fu, J.; Liu, J.; Tian, H.; Li, Y.; Bao, Y.; Fang, Z.; Lu, H. Dual attention network for scene segmentation. In Proceedings of the IEEE/CVF Conference on Computer Vision and Pattern Recognition (CVPR), Long Beach, CA, USA, 16–20 June 2019; pp. 3146–3154. [Google Scholar]
- Li, R.; Duan, C.; Zheng, S.; Zhang, C.; Atkinson, P.M. MACU-Net for Semantic Segmentation of Fine-Resolution Remotely Sensed Images. IEEE Geosci. Remote Sens. Lett. 2021, 1–5. [Google Scholar] [CrossRef]
- Wang, X.; Girshick, R.; Gupta, A.; He, K. Non-local neural networks. In Proceedings of the IEEE Conference on Computer Vision and Pattern Recognition, Salt Lake City, UT, USA, 18–22 June 2018; pp. 7794–7803. [Google Scholar]
- Zhu, Z.; Xu, M.; Bai, S.; Huang, T.; Bai, X. Asymmetric non-local neural networks for semantic segmentation. In Proceedings of the IEEE/CVF International Conference on Computer Vision, Seoul, Korea, 27 October–2 November 2019; pp. 593–602. [Google Scholar]
- Zhou, D.; Wang, G.; He, G.; Long, T.; Yin, R.; Zhang, Z.; Chen, S.; Luo, B. Robust Building Extraction for High Spatial Resolution Remote Sensing Images with Self-Attention Network. Sensors 2020, 20, 7241. [Google Scholar] [CrossRef] [PubMed]
- Li, R.; Su, J.; Duan, C.; Zheng, S. Multistage Attention ResU-Net for Semantic Segmentation of Fine-Resolution Remote Sensing Images. arXiv 2020, arXiv:2011.14302. [Google Scholar] [CrossRef]
- Ji, S.; Wei, S.; Lu, M. Fully convolutional networks for multisource building extraction from an open aerial and satellite imagery data set. IEEE Trans. Geosci. Remote Sens. 2018, 57, 574–586. [Google Scholar] [CrossRef]
- de Franchis, C.; Meinhardt-Llopis, E.; Michel, J.; Morel, J.M.; Facciolo, G. An automatic and modular stereo pipeline for pushbroom images. In ISPRS Annals of the Photogrammetry, Remote Sensing and Spatial Information Sciences; HAL: Bengaluru, India, 2014; Volume II-3, pp. 49–56. [Google Scholar] [CrossRef] [Green Version]
- de Franchis, C.; Meinhardt-Llopis, E.; Michel, J.; Morel, J.-M.; Facciolo, G. Automatic sensor orientation refinement of Pléiades stereo images. In Proceedings of the 2014 IEEE Geoscience and Remote Sensing Symposium, Quebec City, QC, Canada, 13–18 July 2014; pp. 1639–1642. [Google Scholar]
- de Franchis, C.; Meinhardt-Llopis, E.; Michel, J.; Morel, J.-M.; Facciolo, G. On stereo-rectification of pushbroom images. In Proceedings of the 2014 IEEE International Conference on Image Processing (ICIP), Paris, France, 27–30 October 2014; pp. 5447–5451. [Google Scholar]
- Lowe, D.G. Distinctive image features from scale-invariant keypoints. Int. J. Comput. Vis. 2004, 60, 91–110. [Google Scholar] [CrossRef]
- Hirschmuller, H. Stereo processing by semiglobal matching and mutual information. IEEE Trans. Pattern Anal. Mach. Intell. 2008, 30, 328–341. [Google Scholar] [CrossRef]
- Zhang, K.; Chen, S.-C.; Whitman, D.; Shyu, M.-L.; Yan, J.; Zhang, C. A progressive morphological filter for removing nonground measurements from airborne LIDAR data. IEEE Trans. Geosci. Remote Sens. 2003, 41, 872–882. [Google Scholar] [CrossRef] [Green Version]
- Long, J.; Shelhamer, E.; Darrell, T. Fully convolutional networks for semantic segmentation. In Proceedings of the IEEE Conference on Computer Vision and Pattern Recognition (CVRP), Boston, MA, USA, 7–12 June 2015; pp. 3431–3440. [Google Scholar]
- Chen, L.-C.; Zhu, Y.; Papandreou, G.; Schroff, F.; Adam, H. Encoder-decoder with atrous separable convolution for semantic image segmentation. In Proceedings of the European Conference on Computer Vision (ECCV), Munich, Germany, 8–14 September 2018; pp. 801–818. [Google Scholar]
- Badrinarayanan, V.; Kendall, A.; Cipolla, R. Segnet: A deep convolutional encoder-decoder architecture for image segmentation. IEEE Trans. Pattern Anal. Mach. Intell. 2017, 39, 2481–2495. [Google Scholar] [CrossRef]
Figure 1.
GF-7 multi-spectral and multi-view image of the study area.

Figure 2.
Workflow of the building footprint and building height extraction.

Figure 3.
Structure of proposed network.

Figure 4.
Structure of the attention block.

Figure 5.
Structure of spatial pyramid pooling.

Figure 6.
Plots showing the loss and IOU of the proposed model for training the WHU building dataset. The training loss (a) and the IOU (b) change when the epochs increase.
Figure 6.
Plots showing the loss and IOU of the proposed model for training the WHU building dataset. The training loss (a) and the IOU (b) change when the epochs increase.

Figure 7.
Example of the results with the PSPNet, FCN, DeepLab v3+, SegNet, U-Net, and our proposed method using the WHU building dataset: (a) Original image. (b) PSPNet. (c) FCN. (d) DeepLab v3+. (e) SegNet. (f) U-Net. (g) Proposed model. (h) Ground truth.
Figure 7.
Example of the results with the PSPNet, FCN, DeepLab v3+, SegNet, U-Net, and our proposed method using the WHU building dataset: (a) Original image. (b) PSPNet. (c) FCN. (d) DeepLab v3+. (e) SegNet. (f) U-Net. (g) Proposed model. (h) Ground truth.

Figure 8.
Plots showing the loss and IOU of the proposed model for training the GF-7 self-annotated building dataset. The training loss (a) and the IOU (b) change when the epochs increase.
Figure 8.
Plots showing the loss and IOU of the proposed model for training the GF-7 self-annotated building dataset. The training loss (a) and the IOU (b) change when the epochs increase.

Figure 9.
Example of the results with the PSPNet, FCN, DeepLab v3+, SegNet, U-Net, and our proposed method the GF-7 self-annotated building Dataset: (a) Original image. (b) PSPNet. (c) FCN. (d) DeepLab v3+. (e) SegNet. (f) U-Net. (g) Proposed model. (h) Ground truth.
Figure 9.
Example of the results with the PSPNet, FCN, DeepLab v3+, SegNet, U-Net, and our proposed method the GF-7 self-annotated building Dataset: (a) Original image. (b) PSPNet. (c) FCN. (d) DeepLab v3+. (e) SegNet. (f) U-Net. (g) Proposed model. (h) Ground truth.

Figure 10.
Example of the results with the PSPNet, FCN, DeepLab v3+, SegNet, U-Net, and our proposed method using the GF-7 self-annotated building dataset: (a) Original image. (b) PSPNet. (c) FCN. (d) DeepLab v3+. (e) SegNet. (f) U-Net. (g) Proposed model.
Figure 10.
Example of the results with the PSPNet, FCN, DeepLab v3+, SegNet, U-Net, and our proposed method using the GF-7 self-annotated building dataset: (a) Original image. (b) PSPNet. (c) FCN. (d) DeepLab v3+. (e) SegNet. (f) U-Net. (g) Proposed model.

Figure 11.
Point cloud generation results in the study area: (a–c) point cloud results; (d–f) ground point results; (g–i) off-ground point cloud results.
Figure 11.
Point cloud generation results in the study area: (a–c) point cloud results; (d–f) ground point results; (g–i) off-ground point cloud results.

Figure 12.
Experimental results in the study area: (a,b) original images; (c,d) building footprint extraction results; (e,f) point cloud results; (g,h) building height extraction results.
Figure 12.
Experimental results in the study area: (a,b) original images; (c,d) building footprint extraction results; (e,f) point cloud results; (g,h) building height extraction results.

Figure 13.
Accuracy of building height predictions.

Figure 14.
The 3D information results of our method.


Table 1.
Experimental results of the WHU building dataset.
| Method | OA (%) | IOU (%) | Precision (%) | Recall (%) | F1-Score (%) |
|---|---|---|---|---|---|
| PSPNet | 98.55 | 87.67 | 92.49 | 94.39 | 93.45 |
| FCN | 97.42 | 79.48 | 89.73 | 87.42 | 88.56 |
| DeepLab v3+ | 96.84 | 73.55 | 78.79 | 91.71 | 84.76 |
| SegNet | 98.06 | 84.01 | 91.40 | 91.21 | 91.31 |
| U-Net | 98.56 | 87.94 | 93.84 | 93.33 | 93.58 |
| MSAU-Net | 98.74 | 89.31 | 94.18 | 94.52 | 94.35 |
Table 2.
Experimental results of the GF-7 self-annotated building segmentation dataset.
| Method | OA (%) | IOU (%) | Precision (%) | Recall (%) | F1-Score (%) |
|---|---|---|---|---|---|
| PSPNet | 94.66 | 75.27 | 81.98 | 90.18 | 85.89 |
| FCN | 93.09 | 70.21 | 82.16 | 82.84 | 82.50 |
| DeepLab v3+ | 91.53 | 62.55 | 71.40 | 83.46 | 76.96 |
| SegNet | 94.16 | 74.04 | 84.03 | 86.03 | 85.08 |
| U-Net | 95.17 | 77.58 | 84.21 | 90.70 | 87.33 |
| MSAU-Net | 95.74 | 80.27 | 87.46 | 90.71 | 89.06 |
Table 3.
Experimental results of GF-7 building height.
| Number | RMSE | MAE | |
|---|---|---|---|
| Below 30 m | 83 | 4.95 | 2.83 |
| From 30 m to 70 m | 67 | 5.99 | 3.91 |
| Above 70 m | 63 | 5.35 | 3.55 |
| All | 213 | 5.41 | 3.39 |
Publisher’s Note: MDPI stays neutral with regard to jurisdictional claims in published maps and institutional affiliations. |
© 2021 by the authors. Licensee MDPI, Basel, Switzerland. This article is an open access article distributed under the terms and conditions of the Creative Commons Attribution (CC BY) license (https://creativecommons.org/licenses/by/4.0/).
Share and Cite
MDPI and ACS Style
Wang, J.; Hu, X.; Meng, Q.; Zhang, L.; Wang, C.; Liu, X.; Zhao, M. Developing a Method to Extract Building 3D Information from GF-7 Data. Remote Sens. 2021, 13, 4532. https://doi.org/10.3390/rs13224532
AMA Style
Wang J, Hu X, Meng Q, Zhang L, Wang C, Liu X, Zhao M. Developing a Method to Extract Building 3D Information from GF-7 Data. Remote Sensing. 2021; 13(22):4532. https://doi.org/10.3390/rs13224532
Chicago/Turabian StyleWang, Jingyuan, Xinli Hu, Qingyan Meng, Linlin Zhang, Chengyi Wang, Xiangchen Liu, and Maofan Zhao. 2021. "Developing a Method to Extract Building 3D Information from GF-7 Data" Remote Sensing 13, no. 22: 4532. https://doi.org/10.3390/rs13224532
Note that from the first issue of 2016, this journal uses article numbers instead of page numbers. See further details here.