Article

Estimation of Co-Seismic Surface Deformation Induced by 24 September 2019 Mirpur, Pakistan Earthquake along an Active Blind Fault Using Sentinel-1 TOPS Interferometry

by
Muhammad Ali
1,
Gilda Schirinzi
1,*,
Zeeshan Afzal
2,
Alessandra Budillon
1,
Muhammad Saleem Mughal
3,
Sajid Hussain
4 and
Giampaolo Ferraioli
5
1
Dipartimento di Ingegneria, Università degli Studi di Napoli Parthenope, 80143 Napoli, Italy
2
State Key Laboratory of Information Engineering in Surveying, Mapping and Remote Sensing, Wuhan University, Wuhan 430079, China
3
Institute of Geology, University of Azad Jammu and Kashmir, Muzaffarabad 13100, Pakistan
4
School of Remote Sensing and Information Engineering, Wuhan University, Wuhan 430079, China
5
Dipartimento di Scienze e Tecnologie, Universit`a degli Studi di Napoli Parthenope, 80143 Napoli, Italy
*
Author to whom correspondence should be addressed.
Remote Sens. 2024, 16(8), 1457; https://doi.org/10.3390/rs16081457
Submission received: 17 March 2024 / Revised: 5 April 2024 / Accepted: 16 April 2024 / Published: 20 April 2024
(This article belongs to the Special Issue Monitoring Geohazard from Synthetic Aperture Radar Interferometry)

Abstract

:
Surface deformation caused by an earthquake is very important to study for a better understanding of the development of geological structures and seismic hazards in an active tectonic area. In this study, we estimated the surface deformation due to an earthquake along an active blind fault using Sentinel-1 SAR data. On 24 September 2019, an earthquake with 5.6 Mw and 10 km depth stroke near Mirpur, Pakistan. The Mirpur area was highly affected by this earthquake with a huge collapse and the death of 34 people. This study aims to estimate the surface deformation associated with this earthquake in Mirpur and adjacent areas. The interferometric synthetic aperture radar (InSAR) technique was applied to study earthquake-induced surface motion. InSAR data consisting of nine Sentinel-1A SAR images from 11 August 2019 to 22 October 2019 was used to investigate the pre-, co- and post-seismic deformation trends. Time series investigation revealed that there was no significant deformation in the pre-seismic time. In the co-seismic time, strong displacement was observed and in post-seismic results, small displacements were seen due to 4.4 and 3.2 Mw aftershocks. Burst overlap interferometry and offset-tracking analysis were used for more sensitive measurements in the along-track direction. Comprehensive 3D displacement was mapped with the combination of LOS and along-track offset deformation. The major outcome of our results was the confirmation of the existence of a previously unpublished blind fault in Mirpur. Previously, this fault line was triggered during the 2005 earthquake and then it was activated on 24 September 2019. Additionally, we presented the co-seismically induced rockslides and some secondary faulting evidence, most of which occurred along or close to the pre-existing blind faults. The study area already faces many problems due to natural hazards where additional surface deformations, particularly because of the earthquake with activated blind fault, have increased its vulnerability.

1. Introduction

Land deformation caused by earthquakes along active blind faults has been an extensive geological problem [1,2]. Without proper management mechanisms, earthquakes along active blind faults can cause a lot of damage [3,4]. Therefore, this study focuses on the estimation of surface deformation due to seismic activity along a blind fault, which is a challenging task using traditional methods.
To estimate the surface deformation associated with earthquakes, the differential interferometric synthetic aperture radar (DInSAR) technique is an accurate method [5]. DInSAR is used worldwide for earthquake monitoring because of the theoretical observation precision in millimeters [6,7,8,9,10].
Pakistan is located in a seismically active region at a juncture of the Indian and the Eurasian tectonic plates. When these plates strike in the area, they repeatedly leave the inhabitants as targets of deadly earthquakes [11,12].
Earthquakes have serious consequences and some regions are highly affected by these earthquakes. Himalaya is one of the most affected regions of the world [13]. Like many other countries, there is a history of earthquakes in Pakistan and huge losses of people and infrastructure were observed in the past [14,15,16]. Pakistan is located in a seismically active region due to the subduction of the Arabian plate with the Eurasian plate in the west, while the collision of Eurasian and Indian plates at the north formed the Himalayas due to convergence [17]. This region has experienced one of the most damaging earthquakes on Earth; the most damaging earthquake in the Himalayas was the 8 October 2005 earthquake with Mw = 7.6 that caused the death of more than 80,000 people, and millions of people were affected by this earthquake [18].
On 24 September 2019, 7 km SSE of New Mirpur, Punjab, an earthquake stroke with a magnitude of 5.6 at a depth of 10 km (Figure 1). After the main earthquake, aftershocks were also observed near this area with a magnitude of 3.2 on the same day, and an aftershock of 4.4 Mw at the depth of 12 km was observed near the area of the main earthquake on 26 September 2019 [19]. This earthquake was strongly felt in most parts of Upper Punjab and many places in Azad Kashmir, including Mirpur, Bhimber, and Muzaffarabad. In total, 39 people lost their lives, while 746 people were injured in these areas. The study area Mirpur was highly affected, with deaths totaling 34 people, while four people died in Bhimber and one died in Jhelum [20].
In this paper, we analyze the co-seismic deformation caused by the Mw 5.6 Mirpur earthquake along an active blind fault. The surface deformation was measured along the line of sight (LOS) using multiple interferometric pairs collected by the C-band Sentinel-1A sensor to estimate the surface deformation [21]. Secondly, we used the combination of offset tracking [22] and burst overlap interferometry [23] to resolve the displacement in both ground range and along-track directions [24].
There are very few studies published on surface deformation caused by the earthquake and particularly using InSAR in Pakistan [25,26,27,28], and there are no studies dealing with the surface deformation along active blind faults. Firstly, co-seismic surface deformation was estimated with the interferometric synthetic aperture radar (InSAR) method using Sentinel-1 TOPS images [29]. Secondly, we presented the time series InSAR analysis using pre-, co-, and post-seismic Sentinel-1 TOPS images. Thirdly, we used the combination of offset tracking and burst overlap interferometry to resolve the displacement in both ground range and with-track directions. Finally, we presented some results of the field survey and gave comprehensive information for the characteristics of earthquake-induced geological effects, such as rockslides and secondary faulting. With the local tectonics not being very well studied, the blind fault identified in our work is of great significance for the better understanding of the local tectonic and the local earthquake risk management.

1.1. Geology and Tectonic Settings
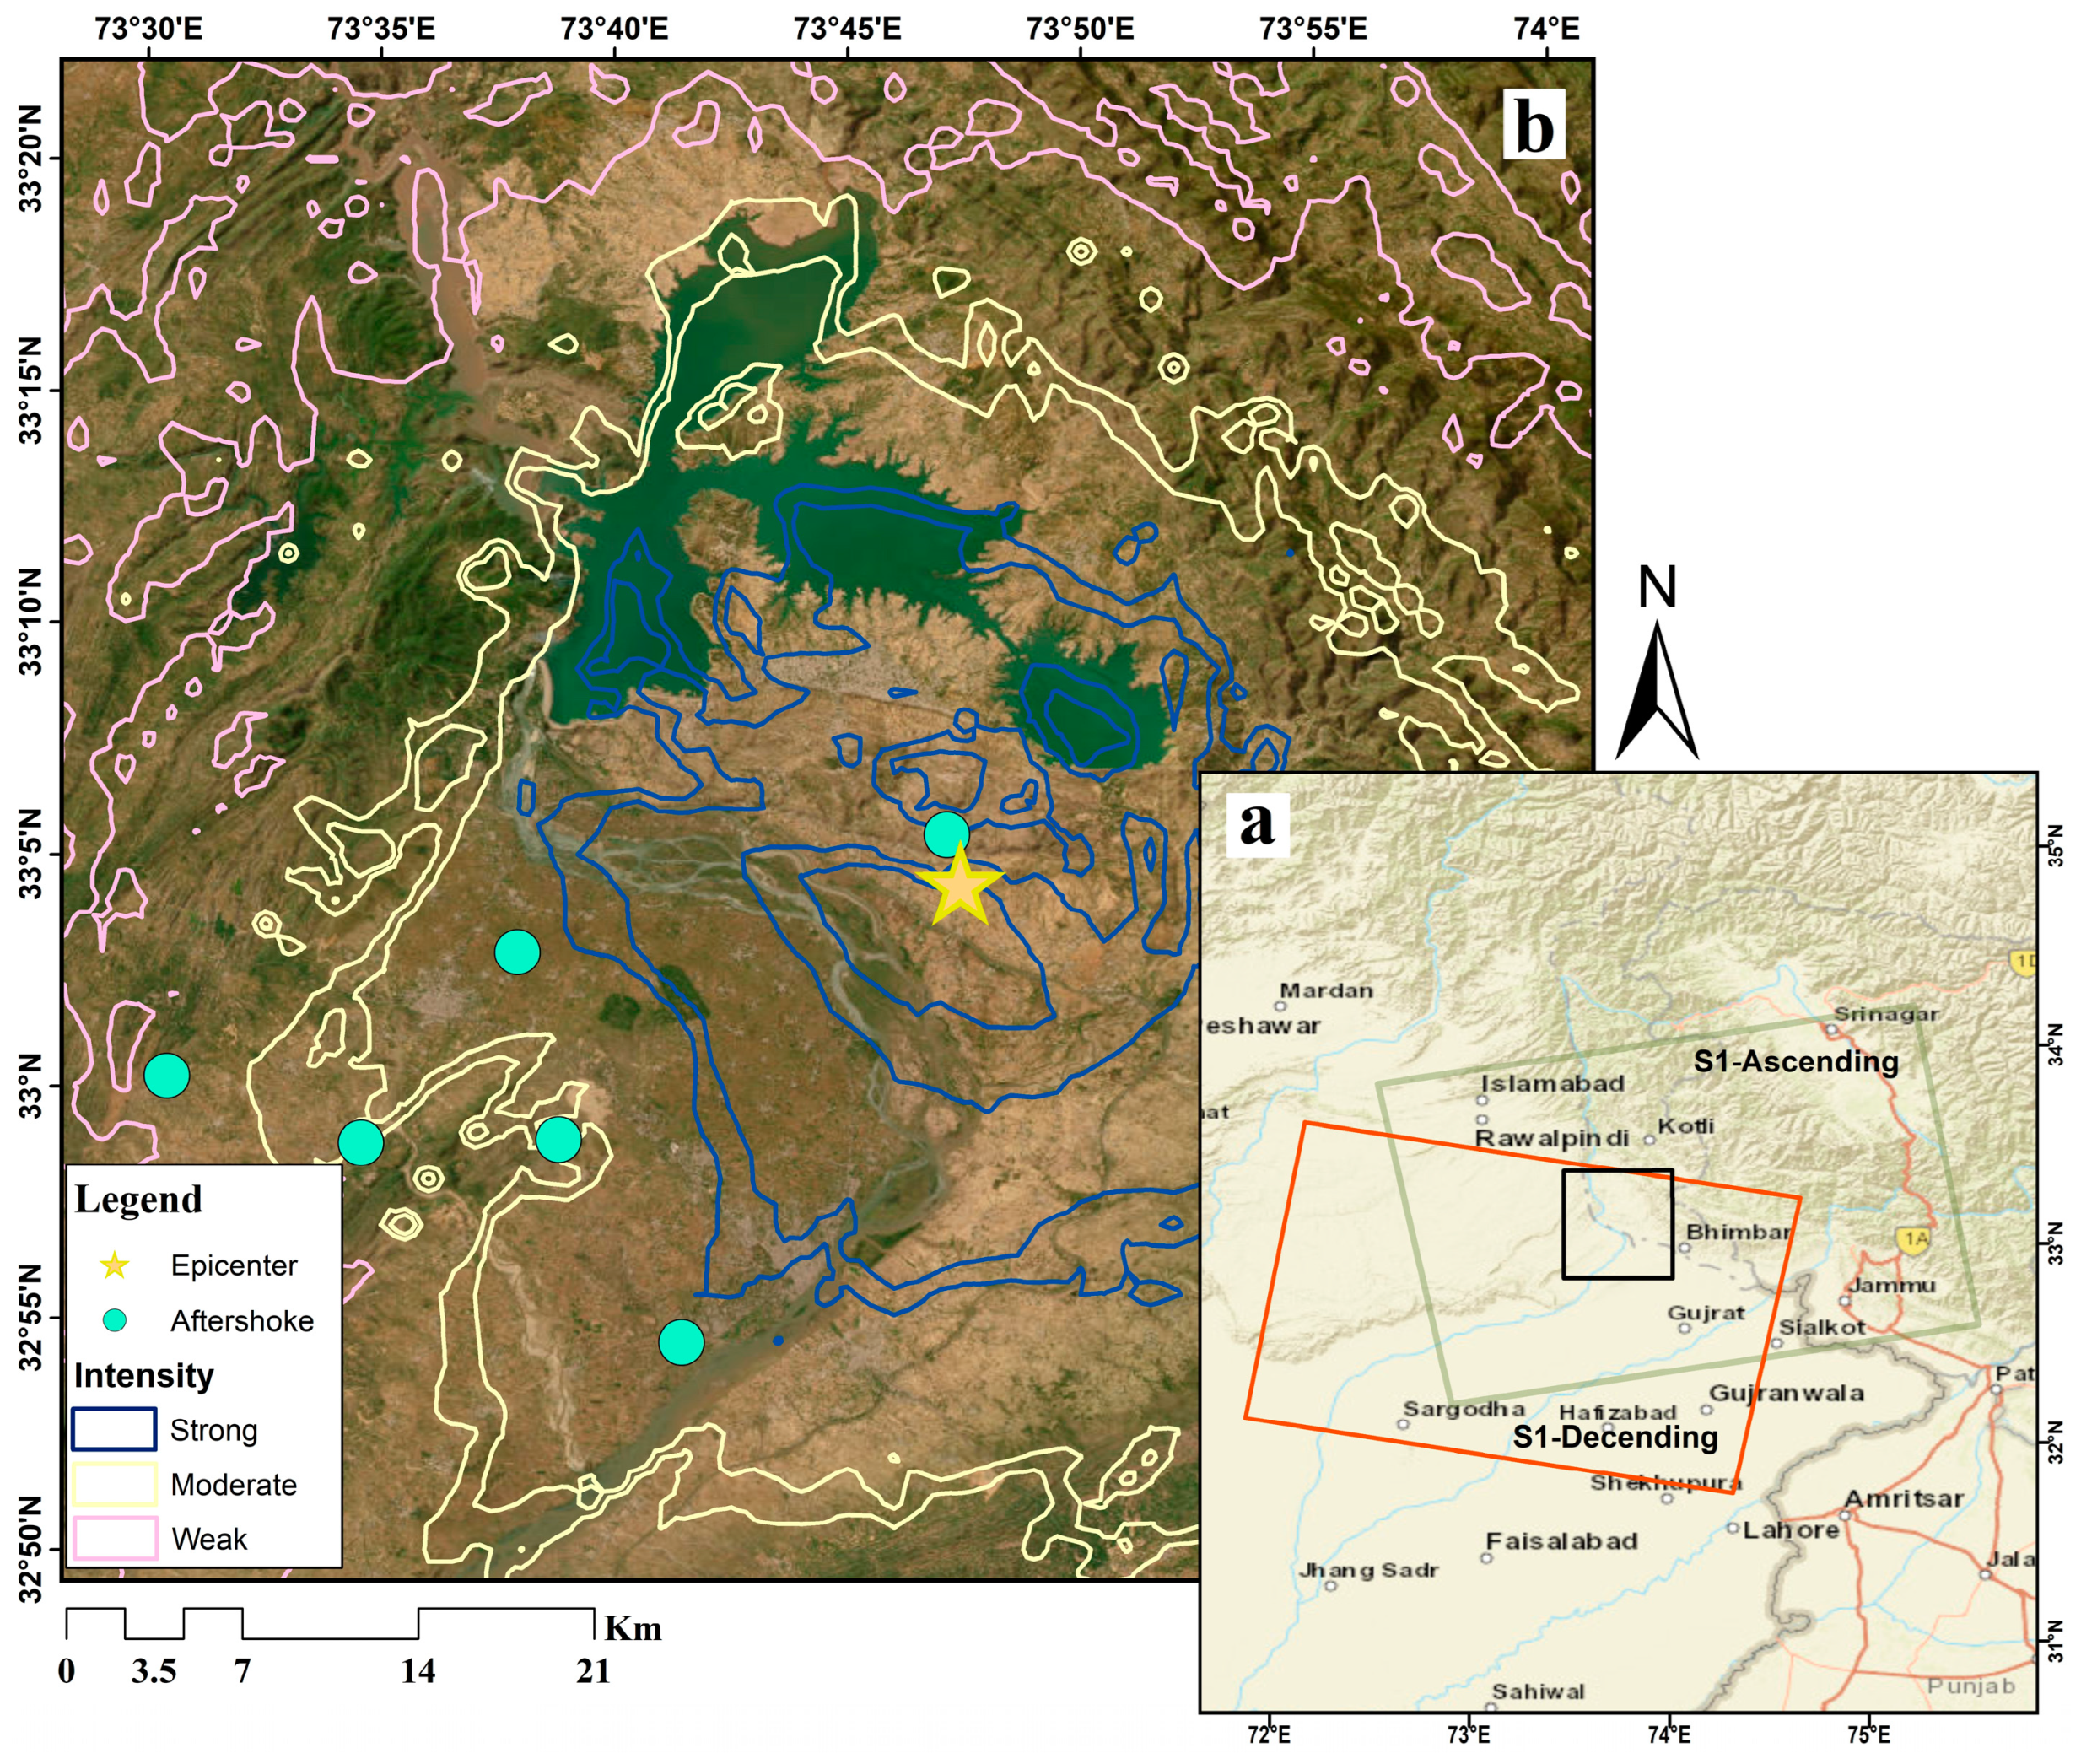
The study area lies in the sub-Himalayas, also called Himalayan foredeep or Himalayan foreland basin [30]. Sediments in the Himalayan foreland basin are molasses deposits. Himalayan molasses deposits are divided into two groups, Rawalpindi and Siwalik, where the Rawalpindi group has two formations, the Murree formation and the Kamlial formation [31]. The Siwalik group includes four formations, the Chinji formation, the Nagri formation, the Dhok Pathan formation, and the Soan formation. Orogenic recycling occurs in the higher and lesser Himalayas. These are stratified and igneous plutonic or deformed, uplifted and eroded rocks. These detritus were then deposited in the sub-Himalayas or Himalayan foreland basin, forming molasses deposits [32].
In this area, the Dhok Pathan formation is older and the Soan formation is younger. The contact between these formations is faulted and the Dhok Pathan formation thrusts onto the Soan formation. In the study area, along this fault, thrust movements are also observed because the Dhok Pathan formation is thrusted over the Soan formation [30,33].
Due to the subduction and collision of tectonic plates across Pakistan, there are a series of faults and fault systems developed in different parts of Pakistan. Most of these faults are in northern Pakistan. These are some of the well-known fault systems in Pakistan and can be considered the main cause of seismicity in Pakistan [34,35].
A five-member team from the Institute of Geology of the University of Azad Jammu conducted a study from 27 September 2019 to 30 September 2019 and submitted a preliminary assessment report to the Azad Jammu Kashmir (AJK) government, which concluded that the 24 September 2019 earthquake occurred due to the movement along the reverse Jari Kass Fault (JKF). They also said that the affected area was positioned on two faults, the Jari Kass fault and the Samwal Fault, which trend in the east–west direction (Figure 2). Previously, this fault line was triggered during the 2005 earthquake [36]. Our study confirms this assumption, but also shows that the Salt Range Thrust (SRT) fault showed motion during the earthquake and that the estimated position of the Samwal Fault and/or the JKF may have to be refined.
The Jhelum Fault Lines lie on the western limb of the Hazara Kashmir Syntaxis (HKS). HKS is a complex tectonic zone composed of sedimentary, volcanic, and metamorphic rocks of Pre-Cambrian to Neogene, and marks the eastern boundary with the Nanga Partbat-Haramosh Massif [37]. The Jhelum fault passes through the Panjar and Ziarat area on the right bank of river Jhelum. It is a left-lateral strike-slip fault with subordinate reverse motion. The shearing, crushing, fault breccia and gauge are present along the fault zone [38]. Historic data on the occurrence of earthquake events in the region obtained from the USGS showed that the number of earthquakes in the Mirpur and adjacent areas has progressively increased, and a dramatic increase was seen over the last two decades (Figure 3).

1.2. Study Area

Our study area lies in the district of Mirpur and the main city close to our study area is Mirpur. Mirpur, well known as New Mirpur, is the second-largest city of Azad Jammu and Kashmir, lies at the latitude of 33°05′N to 33°07′N and 73°37′E to 73°45′E, and is located in northeastern Pakistan, at an elevation of 459 m. Mirpur AJK is the largest district in Azad Kashmir with an area of 1010 km2 [39]. According to the census of 2017, the population of Mirpur district is 456,200, while the population of Mirpur city is 124,000. The Mirpur district can be considered the industrial hub of Azad Kashmir [40].
The area has an arid to semi-arid climate, with some changes due to variations in temperature and rainfall during the year. The clay of the Soan formation, surficial and stream channel deposits, the sand of Siwalik molasses and limestone aggregate are used in the construction of houses [41].

2. Materials and Methods

Sentinel-1 Wide Swath data were used to estimate land deformation. Both ascending and descending passes with VV polarization were used. A total of nine images were selected and seven interferograms were generated (Table 1). The small baseline between SAR images pairs is used to maintain the overlay of images and affects the coherence between the images [42,43,44].

2.1. InSAR Processing

The interferometric processing for both ascending and descending orbits of Sentinel-1 data was applied using SNAP (version 8.0.9) software [45]. The SRTM Digital Elevation Model (DEM) with 30 m spatial resolution was used for the co-registration and the removal of topographic fringes [46]. The accuracy of the SRTM DEM 30 m resolution can vary depending on several factors, including the ruggedness of the terrain and the presence of steep slopes, valleys, and other topographic features. It has proven to be sufficiently accurate for many applications, including terrain co-registration and removal of terrain stripes. To increase the quality of the interferograms, the Goldstein phase filter was applied. It also increased the signal-to-noise ratio (SNR) of the data and, after that, the phase was unwrapped [47,48,49]. Minimum cost flow was used to unwrap the interferometric phase [50]. After that, the unwrapped phase was used to compute LOS displacement [8,51].
Atmospheric noise is a main obstruction while estimating the earthquake-induced surface deformation using InSAR. Geometric decorrelation, temporal decorrelation and atmospheric artifacts reduce the spatial and temporal coherence, and intensely distress the surface displacement recognition [52,53]. Atmospheric phase screen (APS) filtering has been altered for Sentinel-1. Atmospheric artifacts have been removed using different adaptive filters selecting stable and high coherence pixels for measuring the surface displacement [54,55]. We used three pre-seismic, one co-seismic and two post-seismic interferograms, and applied atmospheric corrections.
To investigate the time-series changes in deformation along the LOS, we applied the InSAR method on Sentinel-1 IW SLC images from 11 August 2019 to 22 October 2019 and six interferograms (two pre-seismic, one co-seismic and two post-seismic) were generated.
The pixel offset tracking technique is used to estimate the large deformation whether it has high gradient deformation or not, and it does not need phase unwrapping and high coherence [56]. This technique obtains displacement in both ground range and azimuth directions. It has been successfully used in glacial drift, earthquakes, etc. [22,57]. In SNAP software, master and slave images used in offset tracking should be co-registered first by DEM-assisted co-registration. Then, the Offset Tracking operator should be run with the co-registered stack as input to produce the map.
Surface deformation limited to the LOS can be decomposed into three mutually perpendicular components (up–down, east–west and north–south) [58]. The along-track deformation estimated from the interferometric pair acquired reliable results by overcoming the limits of LOS deformation. Therefore, we can obtain comprehensive 3D displacement with the combination of LOS and along-track deformation [59,60]. We have estimated 3D co-seismic surface by integrating the ascending and descending orbits LOS deformation resulting from InSAR and along-track deformation resulting from offset tracking. The offset tracking technique finds the corresponding point on the amplitude images by the cross-correlation method and calculates the selected points azimuth offsets [61,62].

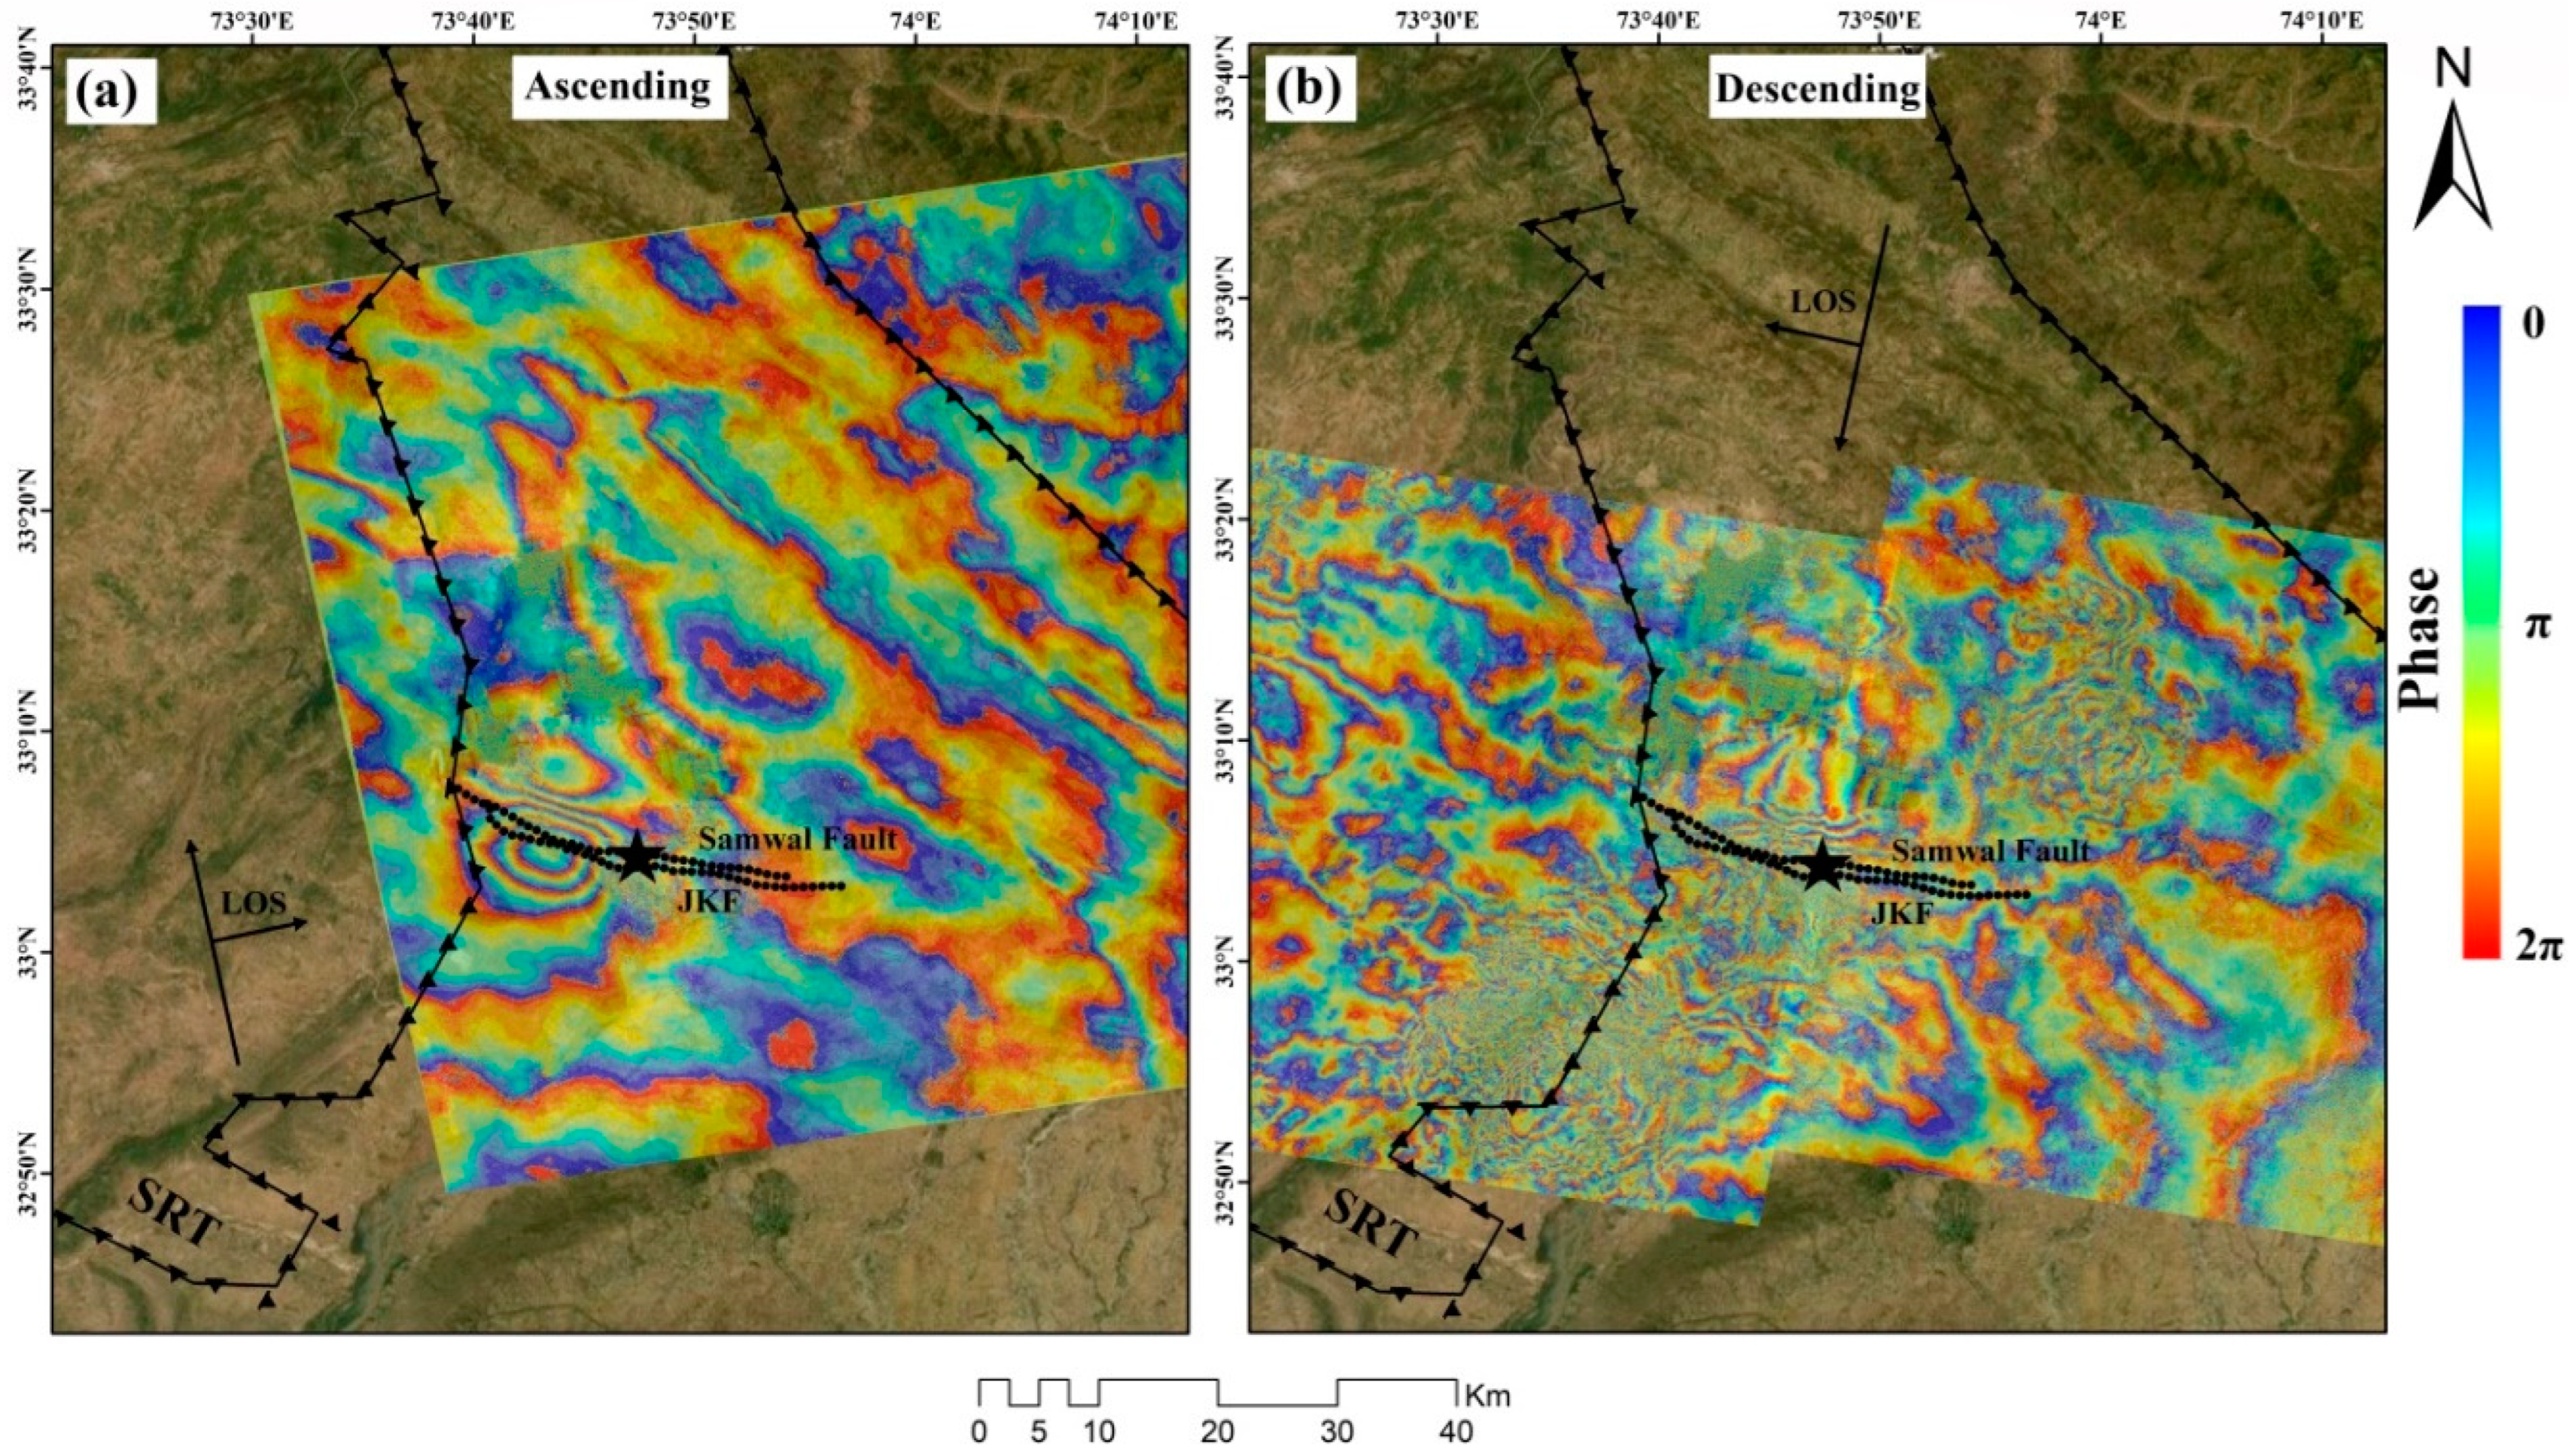
2.2. Co-Seismic Interferometric Phase

Comparative ground movement among two points can be estimated by calculating fringes and multiplying by half of the wavelength, assuming no atmospherical or topographical error. The closer the fringes, the greater the tension on the surface [63]. Thus, near the epicenter, the interferometric fringes are closer (Figure 4a,b).
It can be observed that the fringes along the LOS with different orbits have a significant disagreement. This is because radar imaging geometry plays a very important role in the pattern of co-seismic deformation, as the motion jumps because of the surface ruptures [64]. The slant range shortening and lengthening signals of the ascending and descending tracks are completely different, indicating that the surface deformation of the Mirpur, Pakistan, earthquake is dominated by a horizontal component.

3. Results

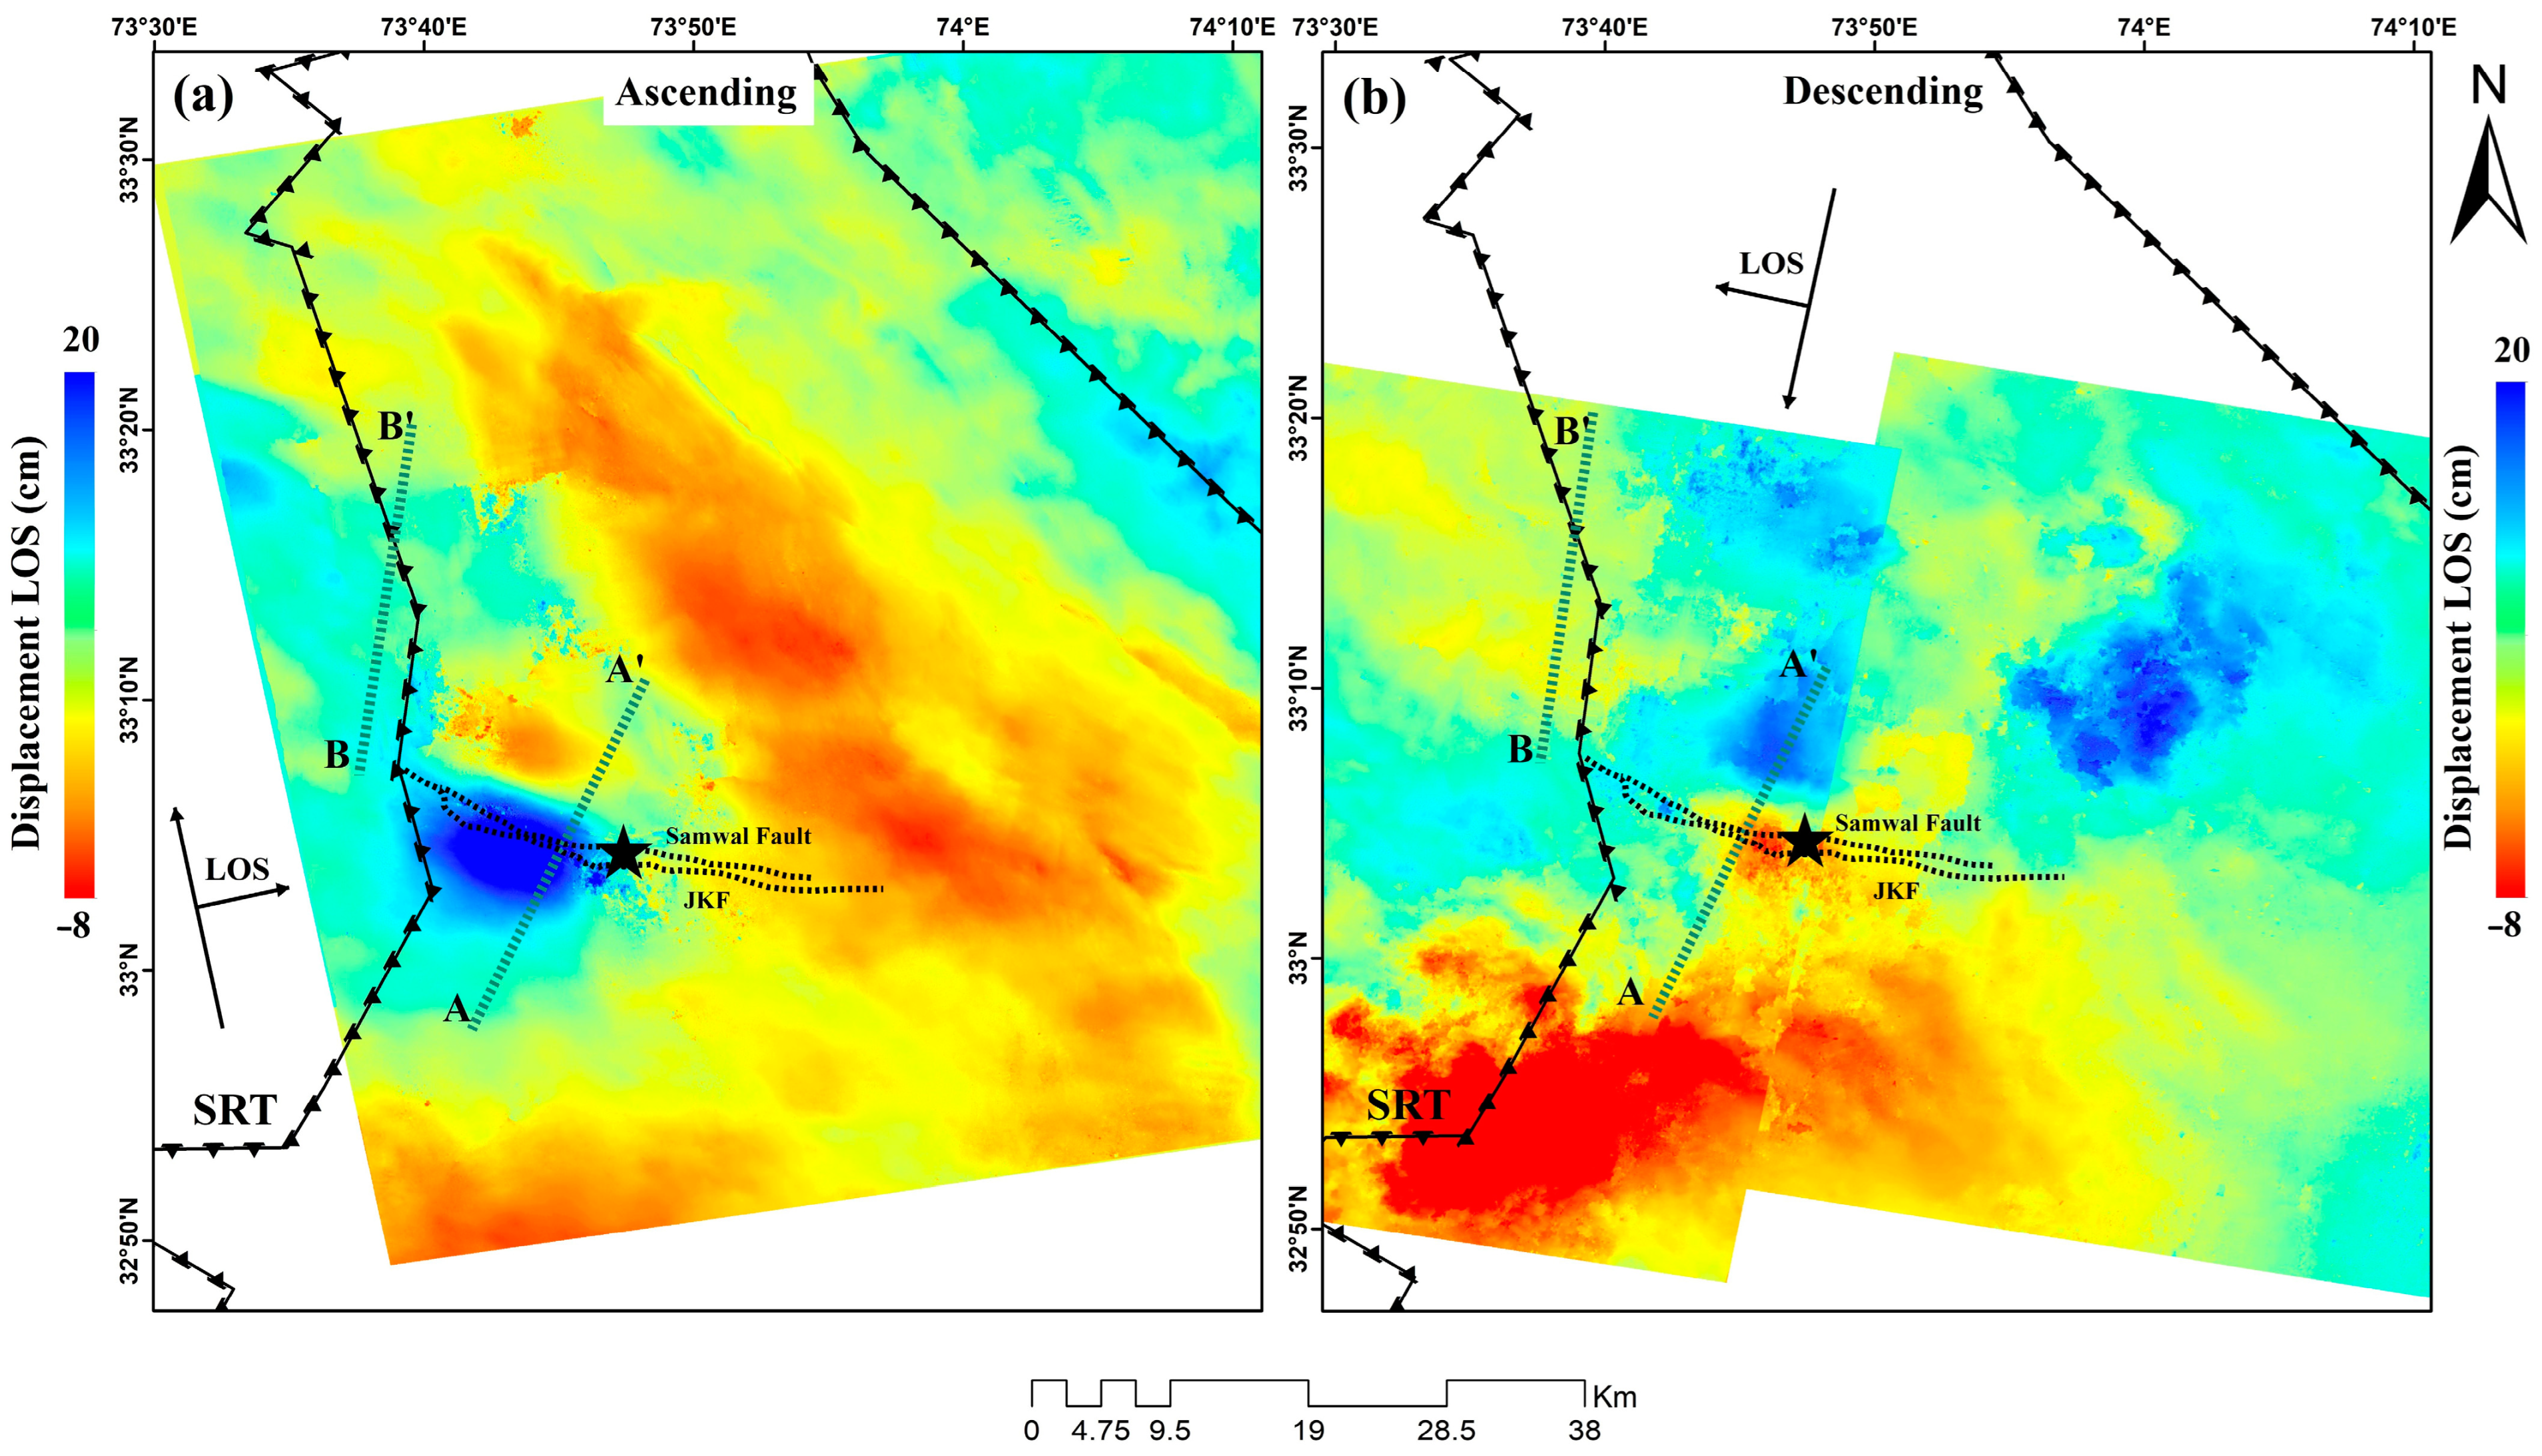
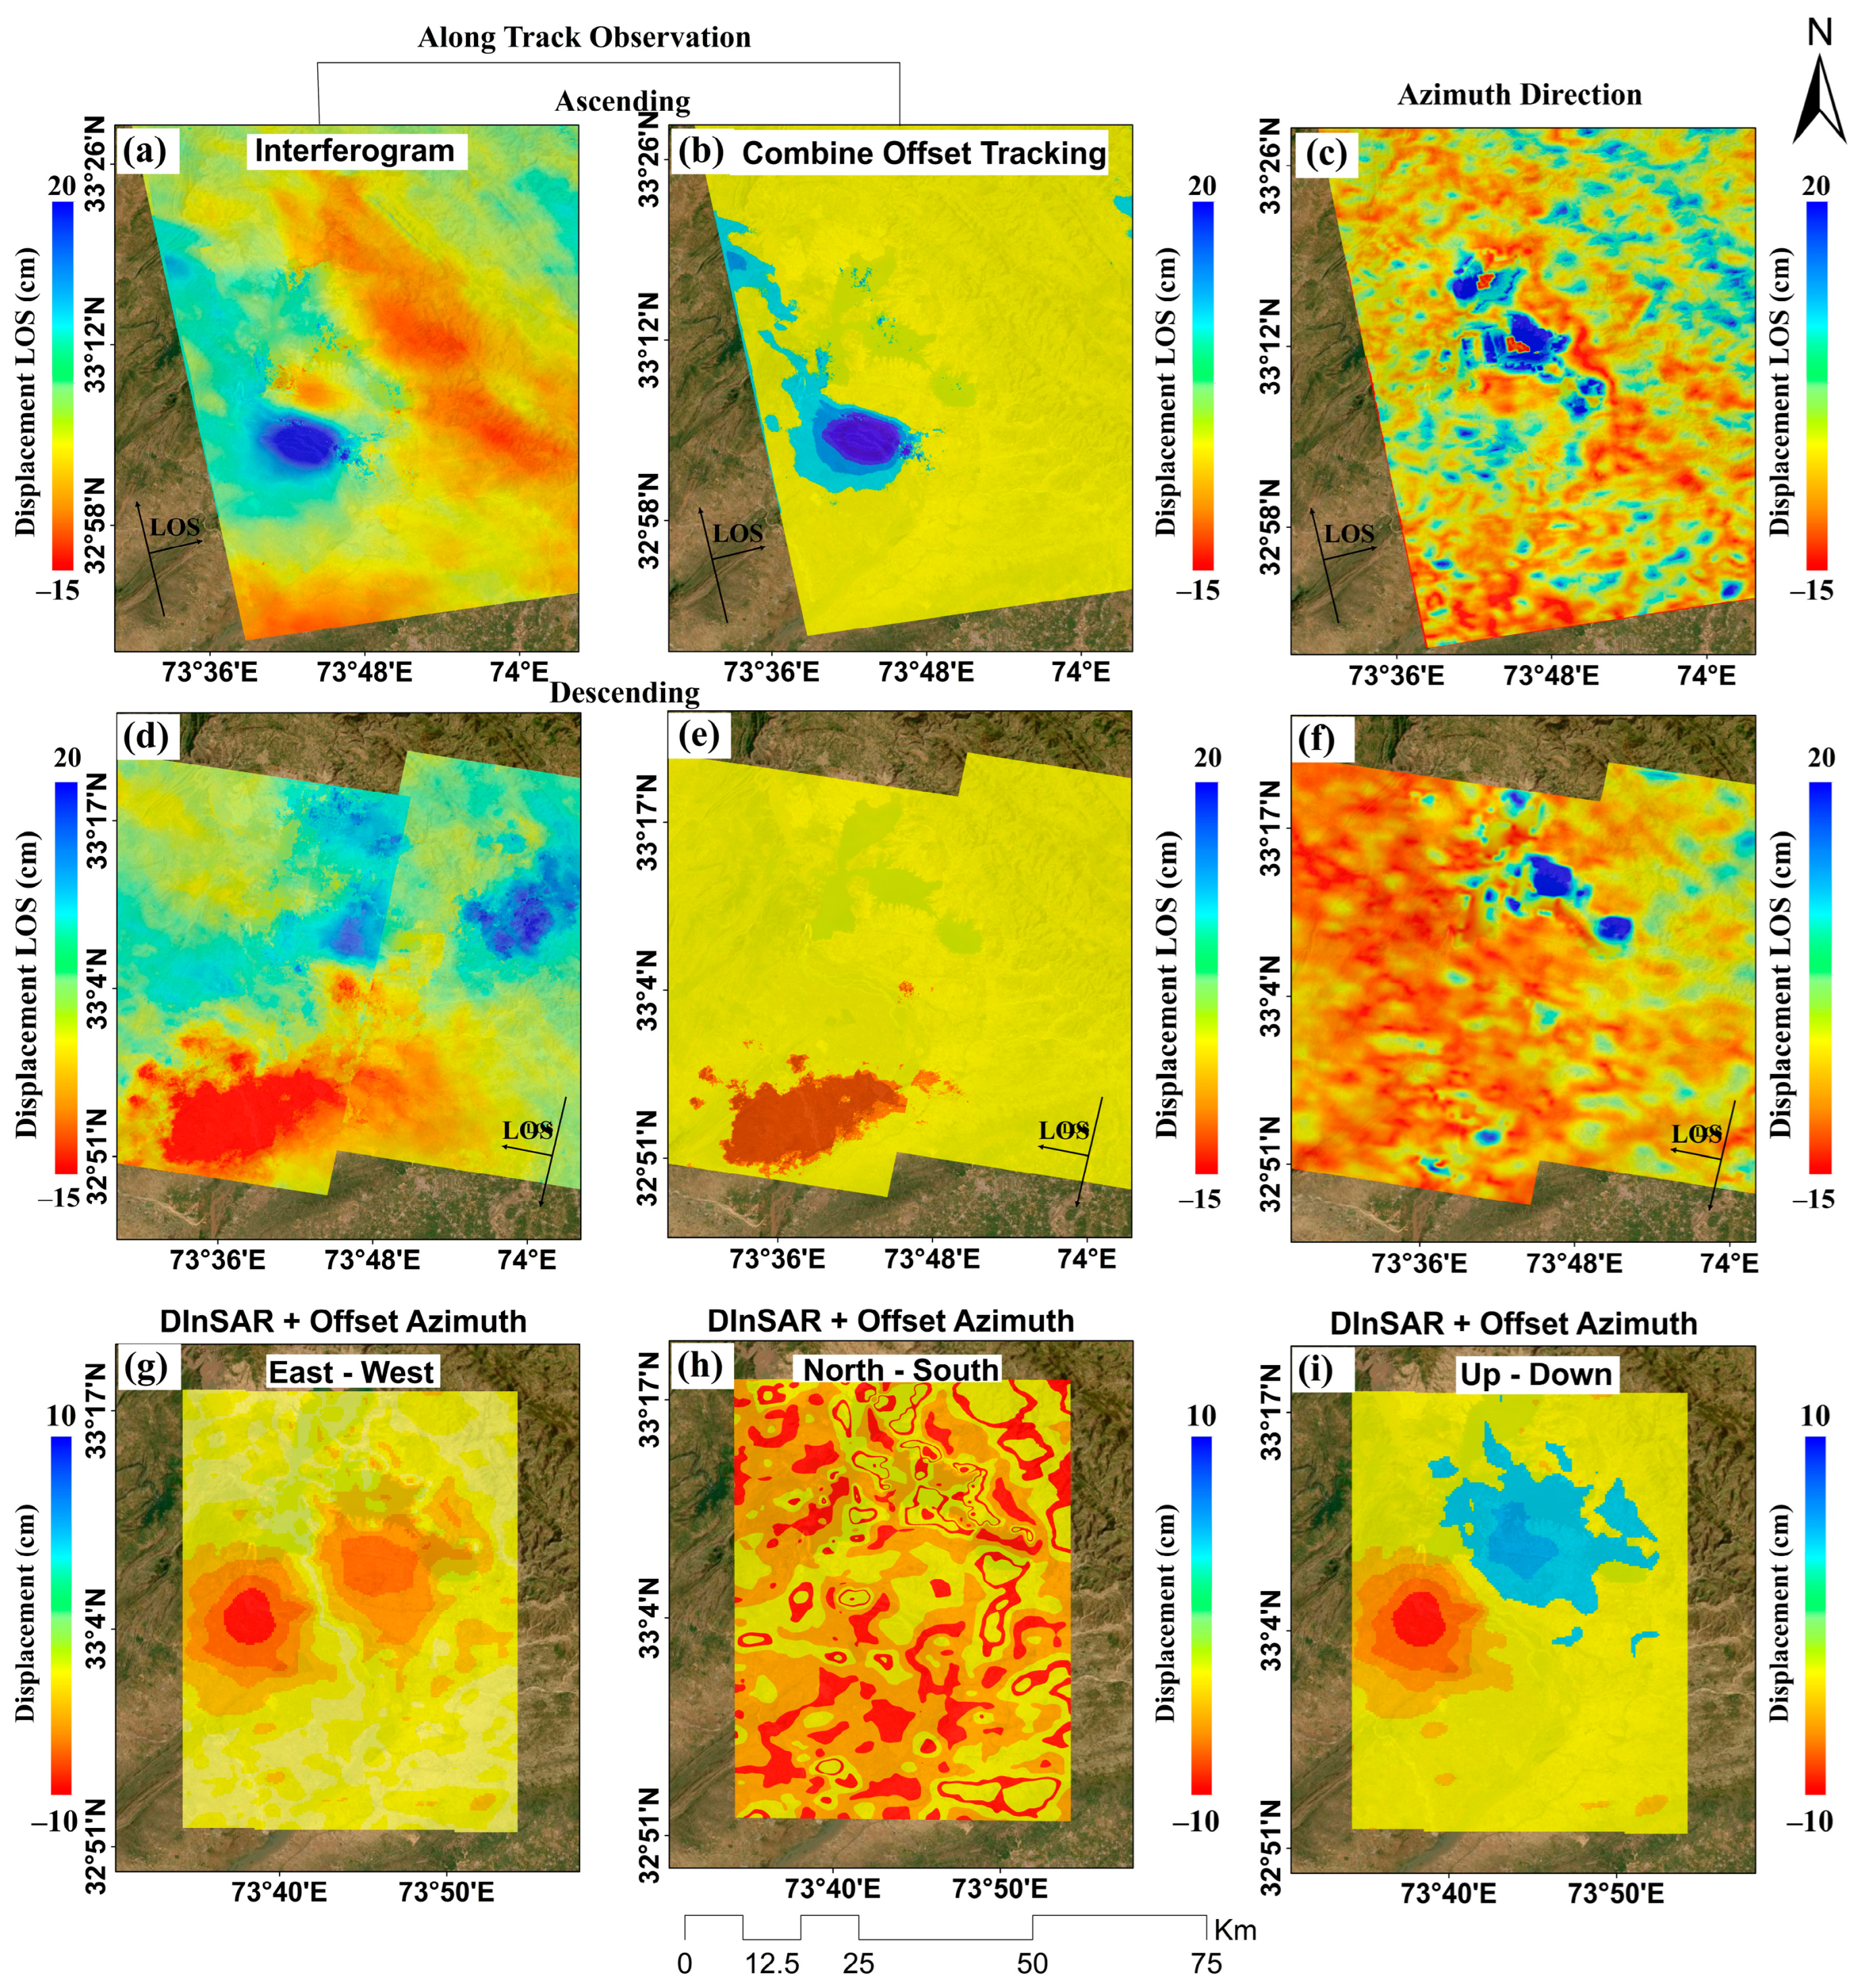
3.1. LOS Displacement

The co-seismic deformation along the LOS was estimated by the SAR interferometric technique as it is explained in the InSAR processing section. Figure 5a,b shows the unwrapped LOS deformation without atmospheric corrections applied, which were derived using ascending and descending images. According to the estimated results from the co-seismic data for both ascending and descending orbits, the maximum horizontal surface motion observed is about 15 cm for ascending data results and 20 cm for descending data (Figure 5a,b). Our results identify that the earthquake was along the active reverse blind fault, which was previously triggered in 2005. A surface motion from 0 to −5 for ascending and 0 to −8 for descending was observed in the study area because of external pressure.
In more detail, Figure 6a,b shows the displacement along the LOS, which was estimated from both ascending and descending orbits of Sentinel-1 data along the dotted lines (line A to A′ and line B to B′) and extracted from Figure 5a,b. The main reason for selection of line A to A′ and line B to B′ is that they cross the fault lines in an area where noticeable deformations are present. The NW Himalayan Fold and Thrust Belt of Pakistan is considered as one of the most active intercontinental regions of the world and forms the northwestern portion of the Himalayan frontal arc. Tectonically, the area lies between the Indus Suture (MMT) and the Salt Range Thrust (SRT). The SRT is a major tectonic boundary where the Indian Plate thrusts northward over the Eurasian Plate, resulting in significant deformation and uplift [65]. It is noticeable with these lines that when we move away from the epicenter, the displacement continuously decreases for both sides towards A and A′, and the same is observed for line B to B′ (Figure 6a,b).

3.2. Offset Tracking

In this research, a combination of burst overlap interferometry and offset-tracking methods were used, which indorsed more complex estimation in the along-track direction. The linear interpolations of offset values resulting from the ESD method, used through the TOPS co-registration, were considered preliminary track values for the offset tracking. Offset tracking was then executed to estimate ground motion in both the range and azimuth directions. LOS deformation and along-track deformation are both used for 3D displacement estimation.
Figure 7 shows the contrast between interferometric and combined offset-tracking results; all the results were unwrapped and plotted with each color bar. As expected, the range offset results (Figure 7b,e) show the same co-seismic pattern as seen in interferometric results. However, one benefit of using the combined offset-tracking method is that the technique is less affected by the decorrelation problem. Therefore, the deformation signal could be better resolved even in some damaged areas where the interferometric phase may be lost due to decorrelation. The Sentinel-1 SAR has a much higher resolution in the range direction than in the along-track direction; thus, the range offsets have higher accuracy.
The comprehensive 3D co-seismic deformation of the Mirpur earthquake is shown in Figure 7g–i. There is significant deformation in the area around the epicenter in all three directions, especially in the east–west and up–down directions. In the east–west direction, the area is categorized by westwards drive. In the north–south direction, there is no horizontal displacement toward the north. The massive change among the uplift and subsidence lobes on the two sides of the fault confirms the thrusting movement. Moreover, the field geological survey shows that there is no surface rupture related to the seismogenic fault. Therefore, this earthquake can be caused by an active blind fault.
Surface geology and topography played an important role in this deformation. The SRT encapsulates the southern edge of the Salt Range separating the Jhelum and the Indus rivers. The SRT terminates in the west against the Kalabagh fault and its eastern termination is near the right bank of the Jhelum River. The source of the 24 September Mirpur earthquake was the Jari Kass Fault, a shallow blind fault line, which was also demarcated. This suggests that both the Jari Kass Fault Line and the Samwal Fault Line are the surface expression of this blind fault line. The western part of the study area consists mostly of open land with soft rocks and sediments, while the northern and eastern parts of the study area consist of mountain ranges. The main urban area of Mirpur also lies in the northeastern part of the epicenter of the earthquake (Figure 8).

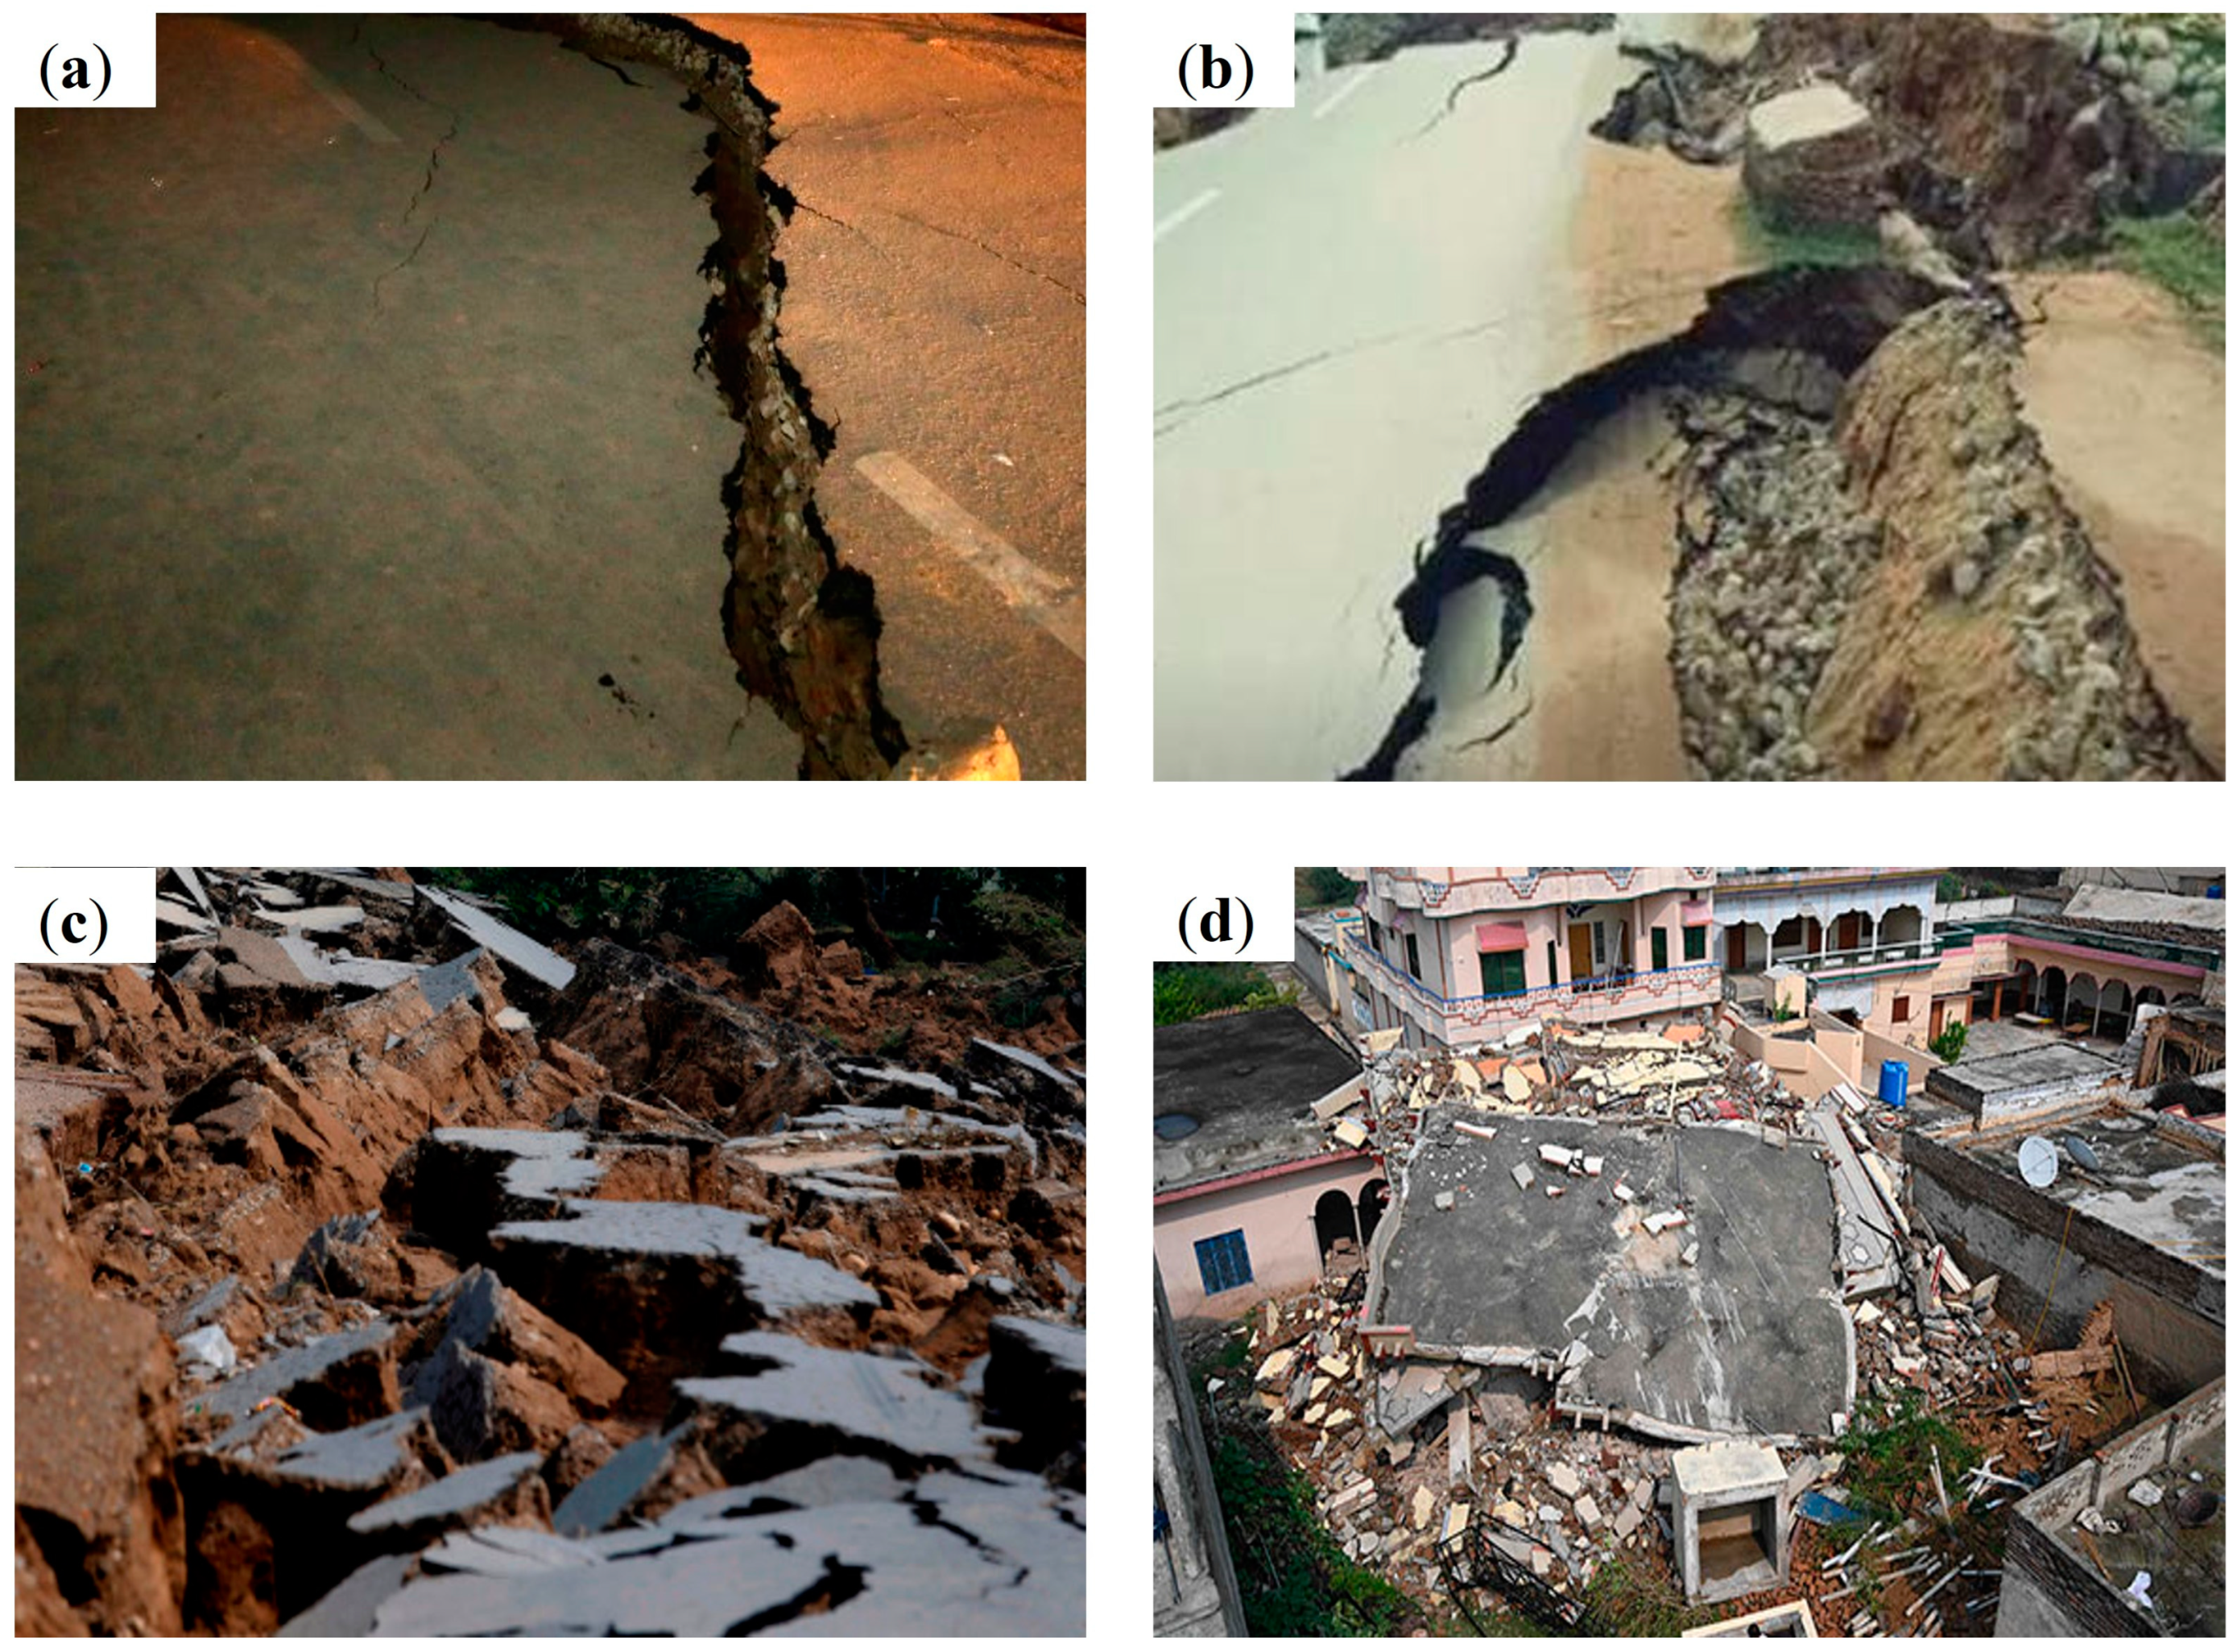
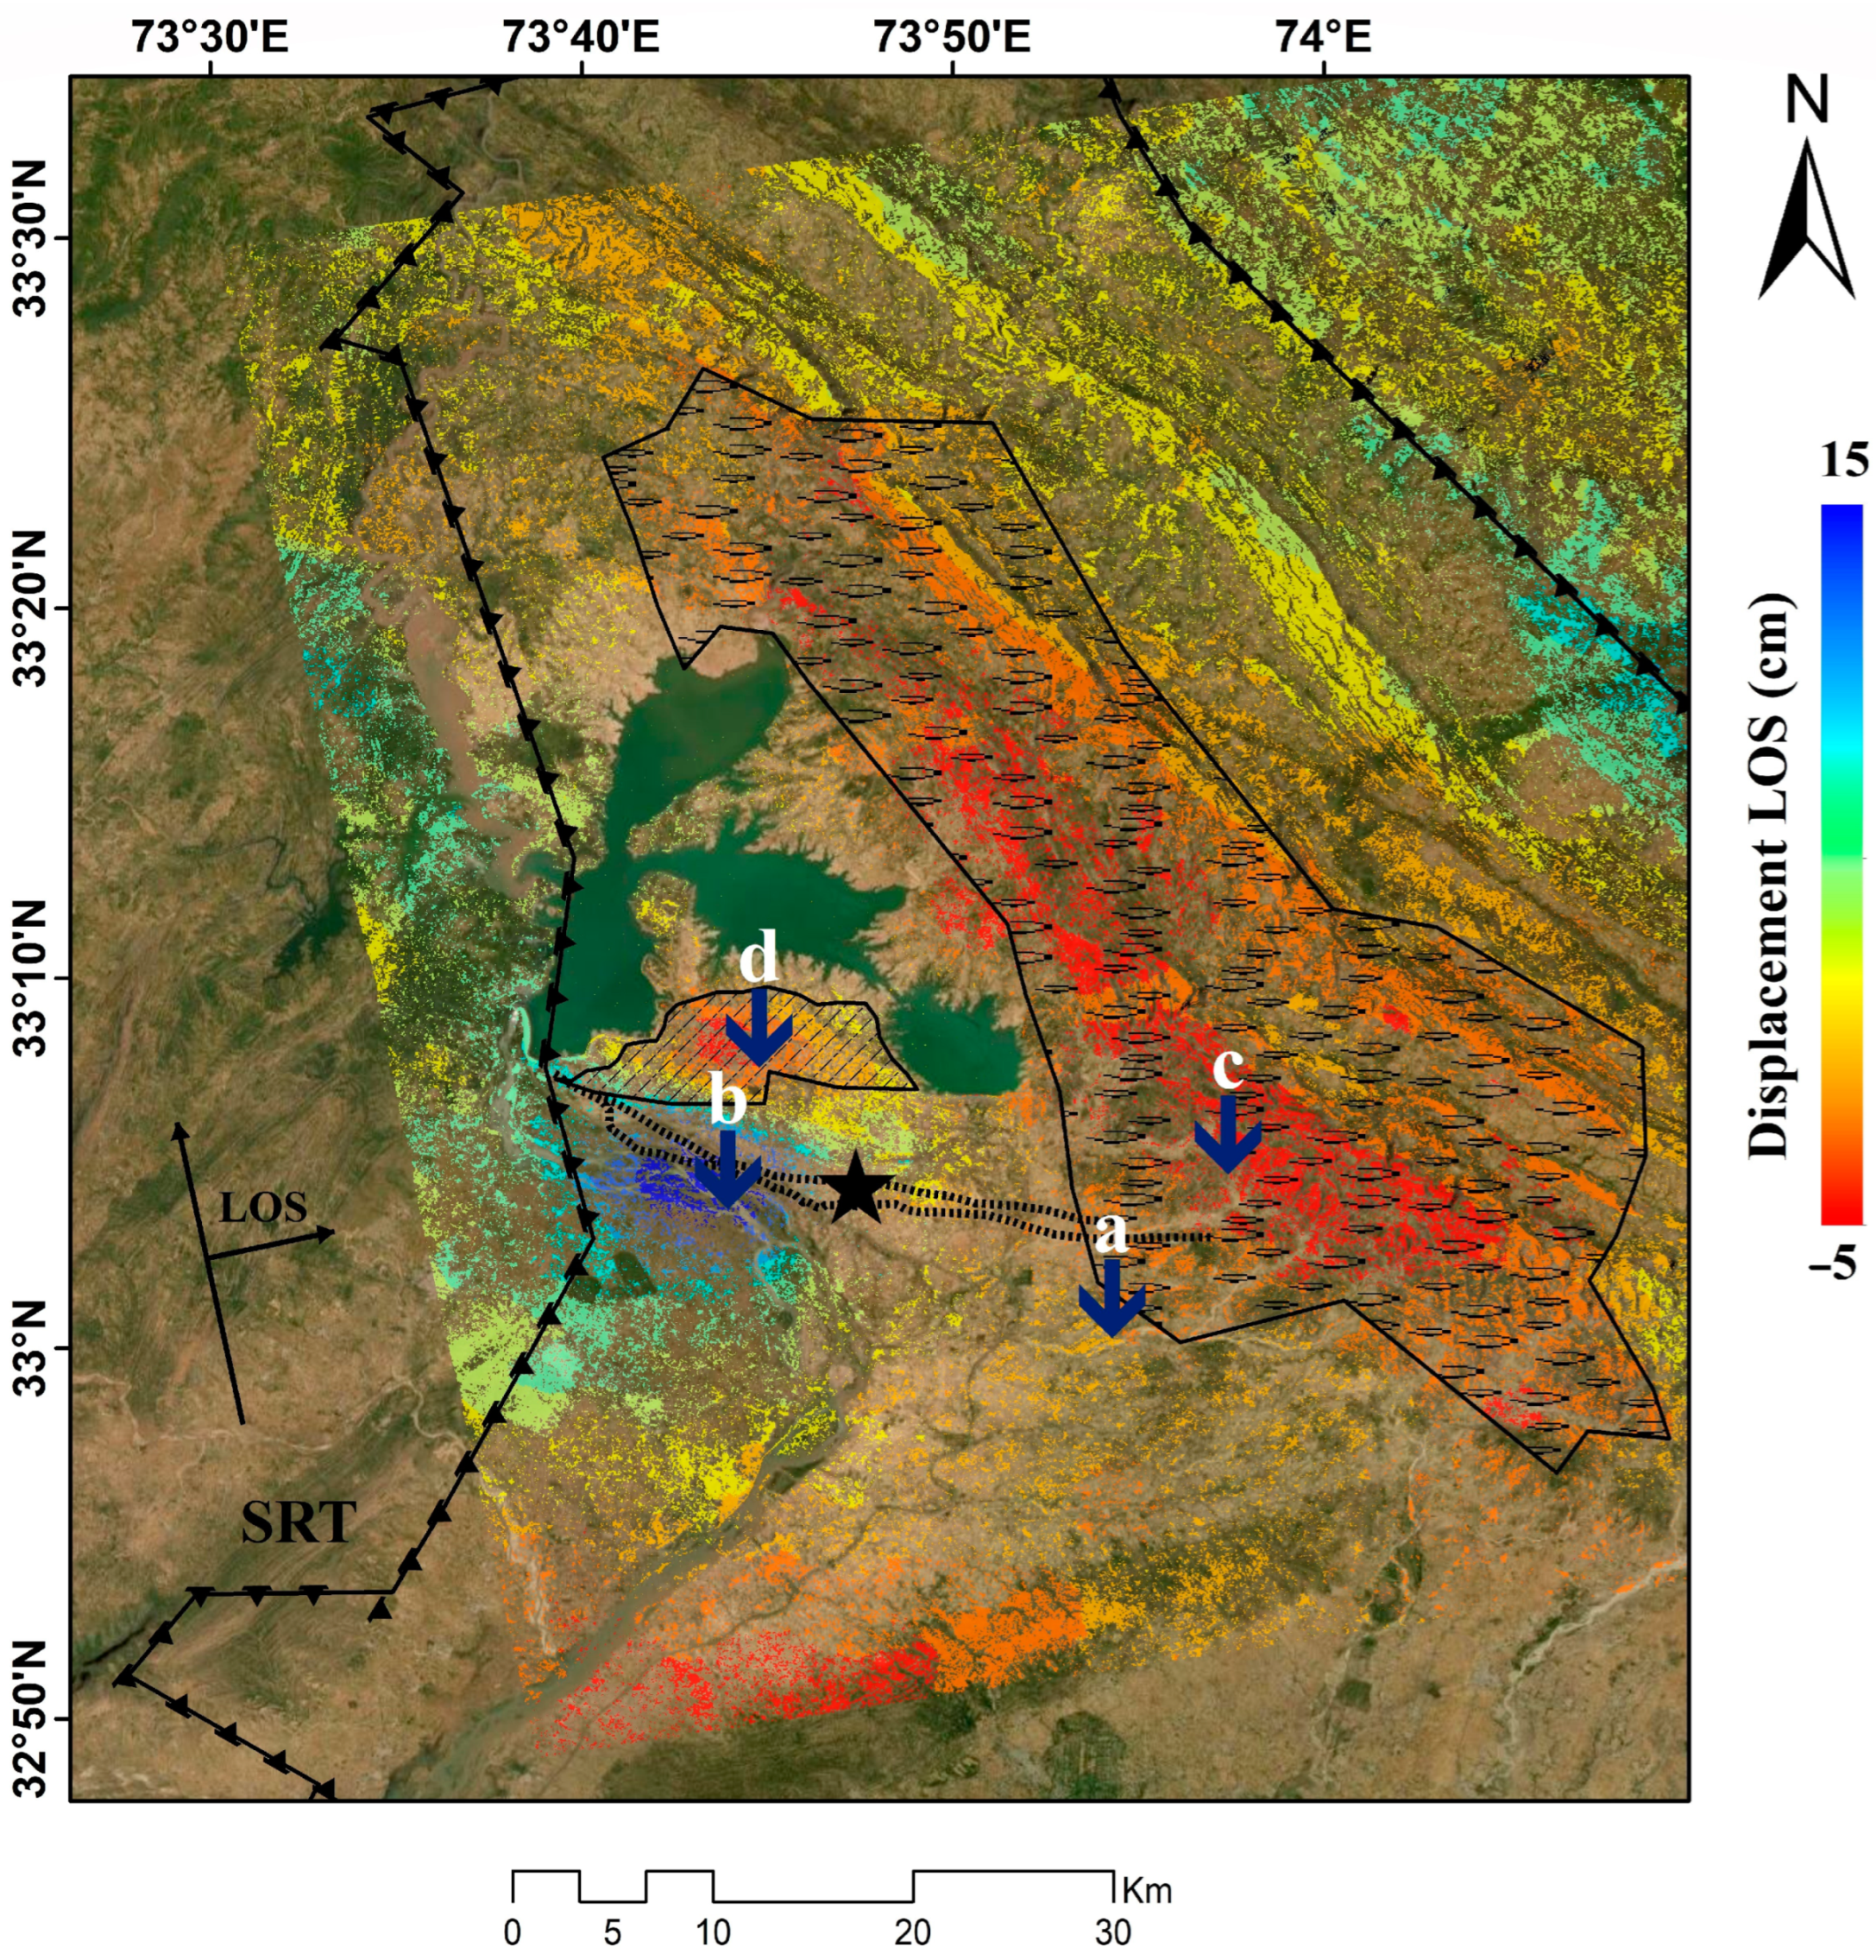
3.3. Ground Faulting and Deformation

The movement of the earth crust along the fault lines activates some geological processes like ground faulting and surface deformation. To identify the tectonic processes and earthquake hazards, it is necessary to examine the ground faulting and deformation processes. Ground faulting usually appears alongside the active fault where tectonic forces trigger the Earth crust to deform [66].
The 24 September 2019 earthquake caused a lot of damage to the structure and caused surface displacement. Mirpur city and adjacent areas were the most affected by this earthquake as shown in Figure 9. Some secondary faults (Figure 9a) were observed in the Mirpur area due to the earthquake. Examples are shown in Figure 9b,d from Mirpur and adjacent areas. As the eastern part of Mirpur has mountains, due to the earthquake of 24 September 2019, some small and medium-sized rockfalls occurred beside the pre-existing fault zones. Figure 9c demonstrates a rockslide in the Mirpur region, in which the rockslide blocked a small road. By understanding faulting and deformation patterns, seismic hazards and mitigation measures associated with earthquakes can be better evaluated.

4. Discussion

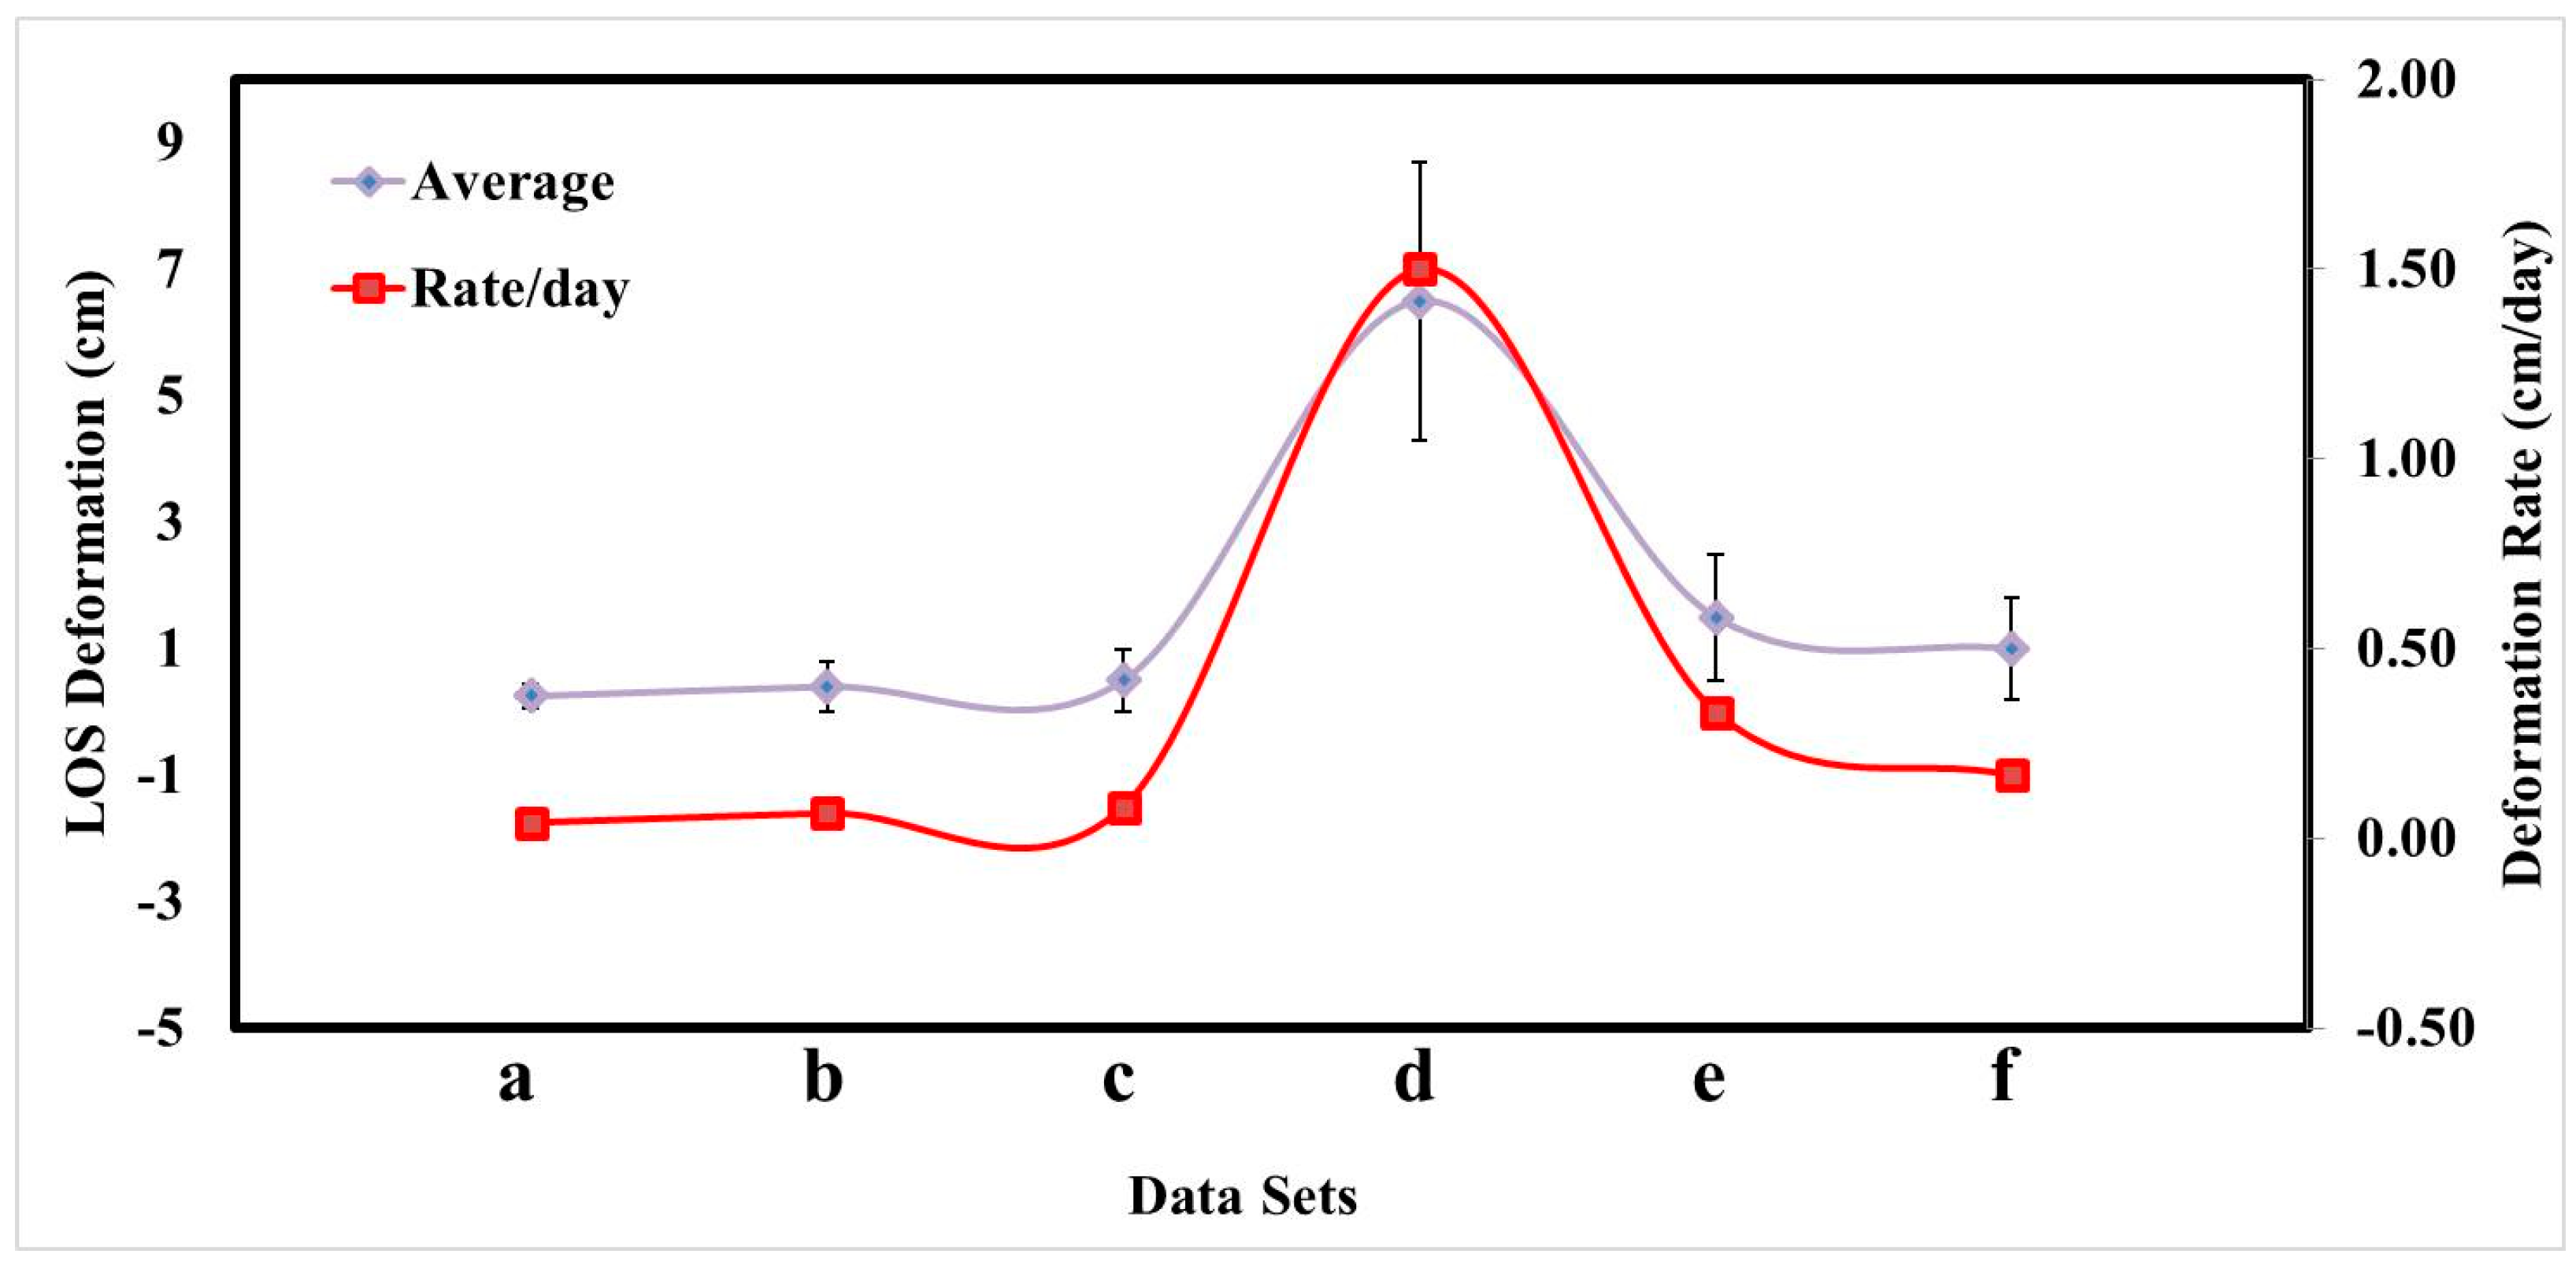
Time Series Analysis for LOS Displacement

To investigate the surface deformation along the LOS based on time series analysis, eight Sentinel-1 images from 11 August 2019 to 22 October 2019 were used to generate six interferograms. For the time series investigation, we used a coherence threshold of ≥0.4.
Since InSAR processing has also been investigated as a promising technique for the search of earthquake precursors [67], we have analyzed InSAR multi-temporal data for the detection of pre- to post-seismic ground displacements. We noted that the 24 September 2019 Mirpur earthquake occurred in a region of Pakistan where the tectonic regime is primarily compressional due to the collision between the Indian Plate and the Eurasian Plate. Detecting pre-seismic deformations in such settings can be challenging. For this kind of analysis, three interferograms were generated starting from pre-seismic data (Figure 10a–c), one interferogram from co-seismic data (Figure 10d), and two interferograms from post-seismic data (Figure 10e,f).
The temporal variations in average displacement along the LOS and the rate of change in regional displacement per day along the LOS estimated during the pre-seismic, co-seismic and post-seismic time periods from 11 August 2019 to 22 October 2019 are shown in Figure 11. InSAR analysis reveals that there was no deformation in the pre-seismic results from 11 August 2019 to 16 September 2019 (Figure 10a–c), as only small displacements from 0 cm to 1 cm are observed in parts (northeastern side) of the study area. The average displacement of about 0.38 cm was observed within 36 days, with a displacement rate of 0.06 cm/day, as shown in Figure 11 (Data Sets a–c). This displacement might be due to atmospheric or topographic artifacts. Indeed, standard APS and DEM corrections have been applied in the data preprocessing (see Section 2.1) that may have left negligible artifacts.
In the co-seismic data result (Figure 10d) from 16 September 2019 to 28 September 2019, the surface showed major displacement in the range from −5 cm to 15 cm as horizontal surface motion in the area around the epicenter. The uplift and subsidence lobes on the two sides of the fault were clearly visible. An average displacement of about 6.5 cm within 12 days with a displacement rate of 1.50 cm/day was observed in the co-seismic time period, as shown in Figure 11 (Data Sets c).
Later, in post-seismic results (Figure 10e,f) from 28 September 2019 to 10 October 2019, there was a small shift in surface, about 0 to 4 cm displacement with an average of 1.4 cm within the 12 days and a displacement rate of about 0.33 cm, as shown in Figure 11 (Data Sets e). From 10 October 2019 to 22 October 2019 in the post-seismic period, displacement along the LOS of about 0 to 3 cm was observed. The average displacement of about 1 cm was observed within 12 days with a displacement rate of 0.17 cm/day, as shown in Figure 11 (Data Sets f). The displacement was high in post-seismic time because on 10 October, an aftershock occurred with the magnitude of 4.4 Mw.

5. Conclusions

In this study, we discussed the surface deformation caused by the earthquake using the ascending and descending co-seismic interferograms derived from the Sentinel-1 data. On 24 September 2019, an earthquake with a magnitude of 5.6 Mw and 10 km depth stroke near Mirpur, Pakistan. A total of 39 people lost their lives, while 746 people were injured because of this earthquake. The Mirpur area was highly affected by this earthquake with the death of 34 people. This paper estimated the surface displacement related to the 24 September 2019 Mirpur earthquake. An active blind fault named Jari Kass Fault is considered the main source of this earthquake. Our results identified the existence of a previously unpublished blind fault in Mirpur and can also help to locate the fault line. Previously, this fault line was triggered during the 2005 earthquake, and then it was activated on 24 September 2019. The active blind fault identified in our work is of great significance for a better understanding of the local tectonic and the local earthquake risk management. InSAR analysis was applied on nine Sentinel-1A (Wide Swath SLC) SAR images from 11 August 2019 to 22 October 2019 to generate interferograms for estimation of ground displacement induced by this earthquake. The results show that surface deformation was widespread and irregularly distributed with large differences in the study area. The deformation range along the LOS was estimated at −5 cm to 15 cm in ascending orbit and −8 cm and 20 cm in descending orbit of Sentinel-1A data. The results also indicate the maximum displacement near the epicenter. InSAR time series analysis was carried out to investigate the trend and rate of deformation along the LOS from 11 August 2019 to 22 October 2019. An average displacement of about 6.5 cm within 12 days with a displacement rate of 1.50 cm/day was observed in the co-seismic time period. Earthquake-induced failures in the form of rockslides, structure collapse, and secondary faulting were also observed along or close to pre-existing faults.

Author Contributions

Conceptualization, M.A. and G.S.; methodology M.A. and Z.A.; resources, G.S.; data collection, M.A. and S.H.; software, M.A. and Z.A.; supervision, G.S.; validation, M.A. and A.B.; project administration, G.S.; writing—review and editing, M.A., M.S.M. and G.F.; revision of the original manuscript, M.A. and G.S. All authors have read and agreed to the published version of the manuscript.

Funding

This research received no external funding.

Data Availability Statement

The Sentinel ascending and descending track data (from 11 August 2019 to 22 October 2019) used in this research were downloaded from the European Space Agency (https://scihub.copernicus.eu) (accessed on 12 August 2023) and were processed with the SNAP software 10.0.0 (18.04.2024 7:00 UTC). Earthquake epicenter and the aftershocks data were provided by the USGS. Real ground data were provided by the National Disaster Management Authority (NDMA), Pakistan.

Conflicts of Interest

The authors declare no conflicts of interest.

References

  1. Giménez, J.; Borque, M.; Gil, A.J.; Alfaro, P.; Estévez, A.; Surinach, E. Comparison of long-term and short-term uplift rates along an active blind reverse fault zone (Bajo Segura, Se Spain). Stud. Geophys. Geod. 2009, 53, 81–98. [Google Scholar] [CrossRef]
  2. Ganas, A.; Valkaniotis, S.; Briole, P.; Serpetsidaki, A.; Kapetanidis, V.; Karasante, I. Domino-style earthquakes along blind normal faults in Northern Thessaly (Greece): Kinematic evidence from field observations, seismology, SAR interferometry and GNSS. Bull. Geol. Soc. Greece 2021, 58, 37–86. [Google Scholar] [CrossRef]
  3. Ollarves, R.; Audemard, F.; Carlota, L.C.M. Morphotectonic Criteria for the Identification of Active Blind Faulting in Alluvial Environments: Case Studies from Venezuela and Colombia. Z. Für Geomorphol. 2006, 145, 81–103. [Google Scholar]
  4. Sithu, K.; Khaing, S. Structural Deformation along the Active Sagaing Fault Zone Between Sagaing and Mingun Area, Central Myanmar. In Proceedings of the Asia Oceania Geosciences Conference, Singapore, 6–11 August 2017. [Google Scholar]
  5. He, P.; Wen, Y.; Xu, C.; Chen, Y. High-quality three-dimensional displacement fields from new-generation SAR imagery: Application to the 2017 Ezgeleh, Iran, earthquake. J. Geod. 2019, 93, 573–591. [Google Scholar] [CrossRef]
  6. Yang, Y.; Chen, Q.; Xu, Q.; Zhang, Y.; Yong, Q.; Liu, G. Coseismic surface deformation of the 2014 Napa earthquake mapped by Sentinel-1A SAR and accuracy assessment with COSMO-SkyMed and GPS data as cross validation. Int. J. Digit. Earth 2017, 10, 1197–1213. [Google Scholar] [CrossRef]
  7. Keren, D. Integration of New Generation SAR Data for Extracting the Earth’s Surface Topography and Displacement: Methodology and Modelling. Acta Geod. Cartogr. Sin. 2018, 47, 422. [Google Scholar]
  8. Chang, X.-T.; Jinyun, G.; Zhang, Y.-H.; Wang, X.-Q. On the application of DInSAR to deformation monitoring in desert areas. Appl. Geophys. 2011, 8, 86–93. [Google Scholar] [CrossRef]
  9. Bayik, C. Deformation analysis of 2020 mw 5.7 Karlıova, Turkey, earthquake using DInSAR method with different incidence angle SAR data. Arab. J. Geosci. 2021, 14, 273. [Google Scholar] [CrossRef]
  10. Carboni, F.; Porreca, M.; Valerio, E.; Mariarosaria, M.; De Luca, C.; Azzaro, S.; Ercoli, M.; Barchi, M.R. Surface ruptures and off-fault deformation of the October 2016 central Italy earthquakes from DInSAR data. Sci. Rep. 2022, 12, 3172. [Google Scholar] [CrossRef]
  11. Maqsood, T.; Schwarz, J. Estimation of Human Casualties from Earthquakes in Pakistan--An Engineering Approach. Seismol. Res. Lett. 2011, 82, 32–41. [Google Scholar] [CrossRef]
  12. Mahmood, I.; Kidwai, A.A.; Qureshi, S.N.; Iqbal, M.F.; Atique, L. Revisiting major earthquakes in Pakistan. Geol. Today 2015, 31, 33–38. [Google Scholar] [CrossRef]
  13. Pasari, S.; Sharma, Y. Contemporary earthquake hazards in the West-northwest Himalaya: A statistical perspective through natural times. Seism. Res. Lett. 2020, 91, 3358–3369. [Google Scholar] [CrossRef]
  14. Shah, S.U.; Shafique, M.; Basharat, M.; Chen, X. Evaluating susceptibility of the 2005 earthquake produced landslides in Kashmir region, Northern Pakistan. J. Himal. Earth Sci. 2019, 52, 83. [Google Scholar]
  15. Ahmad, N.; Barkat, A.; Ali, A.; Sultan, M.; Rasul, K.; Iqbal, Z.; Iqbal, T. Investigation of spatio-temporal satellite thermal IR anomalies associated with the Awaran earthquake (Sep 24, 2013; M 7.7), Pakistan. Pure Appl. Geophys. 2019, 176, 3533–3544. [Google Scholar] [CrossRef]
  16. Pararas-Carayannis, G. The potential of tsunami generation along the Makran Subduction Zone in the northern Arabian Sea: Case study: The earthquake and tsunami of November 28, 1945. Sci. Tsunami Hazards 2006, 24, 358–384. [Google Scholar]
  17. Shah, S.T.; Özacar, A.A.; Gülerce, Z. Fault-based probabilistic seismic hazard assessment of the eastern Makran subduction and the Chaman transform fault, Pakistan: Emphasis on the source characterization of megathrust. J. Asian Earth Sci. 2021, 205, 104604. [Google Scholar] [CrossRef]
  18. Jouanne, F.; Awan, A.; Madji, A.; Pêcher, A.; Latif, M.; Kausar, A.; Mugnier, J.L.; Khan, I.; Khan, N.A. Postseismic deformation in Pakistan after the 8 October 2005 earthquake: Evidence of afterslip along a flat north of the Balakot-Bagh Thrust. J. Geophys. Res. 2011, 116, B7. [Google Scholar] [CrossRef]
  19. USGS. M 5.4—7km SSE of New Mirpur, Pakistan; National Earthquake Information Center: Denver, CO, USA, 2019.
  20. NDMA. NDMA Situation Report No. 11—Mirpur Earthquake 2019; Government of Pakistan: Islamabad, Pakistan, 2019.
  21. García Sánchez, A.J. Application of differential synthetic aperture radar interferometry (DINSAR) to the monitoring of ground and structure movements. Caminos 2019. [Google Scholar]
  22. Jia, H.; Wang, Y.; Ge, D.; Deng, Y.; Wang, R. Improved offset tracking for predisaster deformation monitoring of the 2018 Jinsha River landslide (Tibet, China). Remote Sens. Environ. 2020, 247, 111899. [Google Scholar] [CrossRef]
  23. Li, X.; Jónsson, S.; Cao, Y. Interseismic deformation from sentinel-1 burst-overlap interferometry: Application to the southern Dead Sea fault. Geophys. Res. Lett. 2021, 48, e2021GL093481. [Google Scholar] [CrossRef]
  24. Budillon, A.; Gierull, C.H.; Pascazio, V.; Schirinzi, G. Along-track interferometric SAR systems for ground-moving target indication: Achievements, potentials, and outlook. IEEE Geosci. Remote Sens. Mag. 2020, 8, 46–63. [Google Scholar] [CrossRef]
  25. Ali, M.; Shahzad, M.I.; Nazeer, M.; Mahmood, I.; Zia, I. Estimation of surface deformation due to Pasni earthquake using RADAR interferometry. Geocarto Int. 2019, 36, 1630–1645. [Google Scholar] [CrossRef]
  26. Ali, M.; Shahzad, M.I.; Nazeer, M.; Kazmi, J. Estimation of surface deformation due to pasni earthquake using sar interferometry. ISPRS-Int. Arch. Photogramm. Remote Sens. Spat. Inf. Sci. 2018, XLII-3, 23–29. [Google Scholar] [CrossRef]
  27. Ramzan, U.; Fan, H.; Aeman, H.; Ali, M.; Al-qaness, M.A.A. Combined analysis of PS-InSAR and hypsometry integral (HI) for comparing seismic vulnerability and assessment of various regions of Pakistan. Sci. Rep. 2022, 12, 22423. [Google Scholar] [CrossRef] [PubMed]
  28. Ali, M.; Afzal, Z.; Budillon, A.; Ferraioli, G.; Hussain, S.; Schirinzi, G. Pakistan Earthquake Study Using Sentinel-1 Tops Interferometry. In Proceedings of the IGARSS 2023—2023 IEEE International Geoscience and Remote Sensing Symposium, Pasadena, CA, USA, 16–21 July 2023; pp. 2181–2184. [Google Scholar]
  29. Yang, C.; Han, B.; Zhao, C.; Du, J.; Zhang, D.; Zhu, S. Co-and post-seismic deformation mechanisms of the MW 7.3 Iran earthquake (2017) revealed by Sentinel-1 InSAR observations. Remote Sens. 2019, 11, 418. [Google Scholar] [CrossRef]
  30. Mughal, M.S.; Zhang, C.; Du, D.; Zhang, L.; Mustafa, S.; Hameed, F.; Khan, M.R.; Zaheer, M.; Blaise, D. Petrography and provenance of the Early Miocene Murree Formation, Himalayan Foreland Basin, Muzaffarabad, Pakistan. J. Asian Earth Sci. 2018, 162, 25–40. [Google Scholar] [CrossRef]
  31. Iqbal, O.; Baig, M.S.; Pervez, S.; Siddiqi, M.I. Structure and stratigraphy of Rumbli and Panjar areas of Kashmir and Pakistan with the aid of GIS. J. Geol. Soc. India 2018, 91, 57–66. [Google Scholar] [CrossRef]
  32. Iqbal, O.; Ahmad, M.; Kadir, A. Effective Evaluation of Shale Gas reservoirs by Means of an Integrated Approach to Petrophysics and Geomechanics for the Optimization of Hydraulic Fracturing: A case Study of the Permian Roseneath and Murteree Shale Gas Reservoirs, Cooper Basin, Australia. J. Nat. Gas Sci. Eng. 2018, 58, 34–58. [Google Scholar] [CrossRef]
  33. Khan, M.Y.; Turab, S.A.; Riaz, M.S.; Atekwana, E.A.; Muhammad, S.; Butt, N.A.; Abbas, S.M.; Zafar, W.A.; Ohenhen, L.O. Investigation of coseismic liquefaction-induced ground deformation associated with the 2019 Mw 5.8 Mirpur, Pakistan, earthquake using near-surface electrical resistivity tomography and geological data. Near Surf. Geophys. 2021, 19, 169–182. [Google Scholar] [CrossRef]
  34. Talha Qadri, S.; Shah, A.A.; Sahari, S.; Raja, A.; Yaghmaei-Sabegh, S.; Khan, M.Y. Tectonic geomorphology-based modeling reveals dominance of transpression in Taxila and the contiguous region in Pakistan: Implications for seismic hazards. Model. Earth Syst. Environ. 2023, 9, 1029–1050. [Google Scholar] [CrossRef]
  35. Awais, M.; Qasim, M.; Tanoli, J.I.; Ding, L.; Sattar, M.; Baig, M.S.; Pervaiz, S. Detrital Zircon Provenance of the Cenozoic Sequence, Kotli, Northwestern Himalaya, Pakistan; Implications for India–Asia Collision. Minerals 2021, 11, 1399. [Google Scholar] [CrossRef]
  36. Raza, S.I.; Naqash, T. Quake shakes AJK, Punjab & KP; 25 killed in Mirpur. DAWN, 25 September 2019. [Google Scholar]
  37. Sana, H.; Nath, S. In and Around the Hazara-Kashmir Syntaxis: A Seismotectonic and Seismic Hazard perspective. J. Indian Geophys. Union 2016, 20, 496–505. [Google Scholar]
  38. Ali, A.; Tanveer, M.U.; Munawar, R.K.; Rehman, S.-U.; Aslam, I.; Tanver, G.; Mahmood, S.A. Investigation of Surface Deformation in Lower Jehlum Valley and Eastern Potwar using SRTM DEM. Int. J. Innov. Sci. Technol. 2019, 2, 17–30. [Google Scholar]
  39. Mahmood, A.; Qureshi, R.A.; Mahmood, A.; Sangi, Y.; Shaheen, H.; Ahmad, I.; Nawaz, Z. Ethnobotanical survey of common medicinal plants used by people of District Mirpur, AJK, Pakistan. J. Med. Plant Res. 2011, 5, 4493–4498. [Google Scholar]
  40. Rafique Mir, K. Cesium-137 activity concentrations in soil and brick samples of Mirpur, Azad Kashmir; Pakistan. Iran. J. Radiat. Res. 2014, 12, 39–46. [Google Scholar]
  41. Iqbal, A.; Baig, M.; Akram, M.; Kazmi, A.; Saleem, S.; Qureshi, A. Radon Levels in Dwellings of New Mirpur Azad Kashmir, Sub-Himalayas, Pakistan. Indoor Built Environ. 2008, 17, 397–402. [Google Scholar] [CrossRef]
  42. Berardino, P.; Fornaro, G.; Lanari, R.; Sansosti, E. A new algorithm for surface deformation monitoring based on small baseline differential SAR interferograms. IEEE Trans. Geosci. Remote Sens. 2002, 40, 2375–2383. [Google Scholar] [CrossRef]
  43. Lanari, R.; Casu, F.; Manzo, M.; Zeni, G.; Berardino, P.; Manunta, M.; Pepe, A. An Overview of the Small BAseline Subset Algorithm: A DInSAR Technique for Surface Deformation Analysis. Deform. Gravity Change Indic. Isostasy Tecton. Volcanism Clim. Change 2007, 164, 637–661. [Google Scholar]
  44. Xu, H.P.; Zhu, L.F.; Liu, X.H.; Chen, Y.F. A novel baseline estimation approach of spaceborne InSAR based on interferometric fringe frequency. Dianzi Xuebao 2011, 39, 2212–2217. [Google Scholar]
  45. Elias, P.; Ganas, A.; Briole, P.; Parcharidis, I.; Avallone, A.; Roukounakis, N.; Panagiotis, A.; Marine, R.; Daniele, C.; Cristiano, T.; et al. Surface Deformation due to the M6.5 Lefkada Earthquake (17 November 2015) Exploiting SENTINEL-1 and GNSS Observations. Implications for Seismic Hazard. In Proceedings of the 19th EGU General Assembly, EGU2017, Vienna, Austria, 23–28 April 2017. [Google Scholar]
  46. Jiang, S.; Wang, B.; Xiang, M.; Fu, X.; Sun, X.; Hu, X.; Qian, Q. The Method of the InSAR/INS Integrated Navigation Based on Fringe Matching. Tien Tzu Hsueh Pao/Acta Electron. Sin. 2017, 45, 2832–2841. [Google Scholar]
  47. Goldstein, R.M.; Werner, C.L. Radar interferogram filtering for geophysical applications. Geophys. Res. Lett. 1998, 25, 4035–4038. [Google Scholar] [CrossRef]
  48. Bhattacharya, A.; Arora, M.K.; Sharma, M.L. Usefulness of synthetic aperture radar (SAR) interferometry for digital elevation model (DEM) generation and estimation of land surface displacement in Jharia coal field area. Geocarto Int. 2012, 27, 57–77. [Google Scholar] [CrossRef]
  49. Suo, Z.; Zhang, J.; Li, M.; Zhang, Q.; Fang, C. Improved InSAR phase noise filter in frequency domain. IEEE Trans. Geosci. Remote Sens. 2016, 54, 1185–1195. [Google Scholar] [CrossRef]
  50. Osmanoglu, B.; Dixon, T.H.; Wdowinski, S. Three-dimensional phase unwrapping for satellite radar interferometry, I: DEM generation. IEEE Trans. Geosci. Remote Sens. 2014, 52, 1059–1075. [Google Scholar] [CrossRef]
  51. Bechor, N.B.; Zebker, H.A. Measuring two-dimensional movements using a single InSAR pair. Geophys. Res. Lett. 2006, 33, 16. [Google Scholar] [CrossRef]
  52. Macchiarulo, V.; Milillo, P.; Blenkinsopp, C.; Giardina, G. Monitoring deformations of infrastructure networks: A fully automated GIS integration and analysis of InSAR time-series. Struct. Health Monit. 2022, 21, 1849–1878. [Google Scholar] [CrossRef]
  53. Aimaiti, Y.; Liu, W.; Yamazaki, F.; Maruyama, Y. Earthquake-induced landslide mapping for the 2018 Hokkaido Eastern Iburi earthquake using PALSAR-2 data. Remote Sens. 2019, 11, 2351. [Google Scholar] [CrossRef]
  54. Niraj, K.; Gupta, S.K.; Shukla, D. Kotrupi landslide deformation study in non-urban area using DInSAR and MTInSAR techniques on Sentinel-1 SAR data. Adv. Space Res. 2022, 70, 3878–3891. [Google Scholar] [CrossRef]
  55. Fadhillah, M.F.; Achmad, A.R.; Lee, C.-W. Improved combined scatterers interferometry with optimized point scatterers (ICOPS) for interferometric synthetic aperture radar (InSAR) time-series analysis. IEEE Trans. Geosci. Remote Sens. 2021, 60, 1–14. [Google Scholar] [CrossRef]
  56. Chen, Y.; Tong, Y.; Tan, K. Coal mining deformation monitoring using SBAS-InSAR and offset tracking: A case study of Yu County, China. IEEE J. Sel. Top. Appl. Earth Obs. Remote Sens. 2020, 13, 6077–6087. [Google Scholar] [CrossRef]
  57. Zhao, G.; Wang, L.; Deng, K.; Wang, M.; Xu, Y.; Zheng, M.; Luo, Q. An adaptive offset-tracking method based on deformation gradients and image noises for mining deformation monitoring. Remote Sens. 2021, 13, 2958. [Google Scholar] [CrossRef]
  58. Huang, Z.; Zhang, G.; Shan, X.; Gong, W.; Zhang, Y.; Li, Y. Co-seismic deformation and fault slip model of the 2017 Mw 7.3 Darbandikhan, Iran–Iraq earthquake inferred from D-InSAR measurements. Remote Sens. 2019, 11, 2521. [Google Scholar] [CrossRef]
  59. Mastro, P.; Serio, C.; Masiello, G.; Pepe, A. The multiple aperture SAR interferometry (MAI) technique for the detection of large ground displacement dynamics: An overview. Remote Sens. 2020, 12, 1189. [Google Scholar] [CrossRef]
  60. He, P.; Wen, Y.; Xu, C.; Chen, Y. Complete three-dimensional near-field surface displacements from imaging geodesy techniques applied to the 2016 Kumamoto earthquake. Remote Sens. Environ. 2019, 232, 111321. [Google Scholar] [CrossRef]
  61. Li, S.; Leinss, S.; Hajnsek, I. Cross-correlation stacking for robust offset tracking using SAR image time-series. IEEE J. Sel. Top. Appl. Earth Obs. Remote Sens. 2021, 14, 4765–4778. [Google Scholar] [CrossRef]
  62. Liu, X.; Zhao, C.; Zhang, Q.; Lu, Z.; Li, Z. Deformation of the Baige landslide, Tibet, China, revealed through the integration of cross-platform ALOS/PALSAR-1 and ALOS/PALSAR-2 SAR observations. Geophys. Res. Lett. 2020, 47, e2019GL086142. [Google Scholar] [CrossRef]
  63. Anantrasirichai, N.; Biggs, J.; Albino, F.; Hill, P.; Bull, D. Application of Machine Learning to Classification of Volcanic Deformation in Routinely Generated InSAR Data. J. Geophys. Res. Solid Earth 2018, 123, 6592–6606. [Google Scholar] [CrossRef]
  64. Zhao, D.; Qu, C.; Shan, X.; Bürgmann, R.; Chen, H.; Wu, D.; Gong, W. Post-seismic deformation of the 2008 Wenchuan earthquake reveals a misaligned rheological boundary in the lower crust along the eastern Tibetan Plateau margin. Geophys. J. Int. 2023, 235, 1353–1372. [Google Scholar] [CrossRef]
  65. Khan, S.D.; Chen, L.; Ahmad, S.; Ahmad, I.; Ali, F. Lateral structural variation along the Kalabagh Fault Zone, NW Himalayan foreland fold-and-thrust belt, Pakistan. J. Asian Earth Sci. 2012, 50, 79–87. [Google Scholar] [CrossRef]
  66. Karakostas, V.; Papazachos, C.; Papadimitriou, E.; Foumelis, M.; Kiratzi, A.; Pikridas, C.; Kostoglou, A.; Kkallas, C.; Chatzis, N.; Bitharis, S.; et al. The March 2021 Tyrnavos, central Greece, doublet (Μw6. 3 and Mw6. 0): Aftershock relocation, faulting details, coseismic slip and deformation. Bull. Geol. Soc. Greece 2021, 58, 131–178. [Google Scholar] [CrossRef]
  67. Moro, M.; Saroli, M.; Stramondo, S.; Bignami, C.; Albano, M.; Falcucci, E.; Gori, S.; Doglioni, C.; Polcari, M.; Tallini, M.; et al. New insights into earthquake precursors from InSAR. Sci. Rep. 2017, 7, 12035. [Google Scholar] [CrossRef] [PubMed]
Figure 1. Intensity map of Mirpur earthquake showing shaking intensity following the earthquake with strong shaking observed in the study area (data provided by USGS). (a) Black rectangular shows study area of Mirpur, Pakistan (derived from Open Street Map). The green rectangle shows the ascending swath of Sentinel-1 IW SLC images and the red rectangle shows the descending swath of Sentinel-1 IW SLC images that are used for this study. (b) Contour lines with different colors indicate the intensity of the earthquake, while yellow color star shows the epicenter of the 24 September 2019 Mirpur earthquake; the turquoise color dots show the aftershocks occurring for up to one month (from 24 September 2019 to 22 October 2019) after the mainshock (USGS, 2019).
Remotesensing 16 01457 g001
Figure 2. The regional tectonic map shows major geological formations and faults of northwestern Pakistan. Blue rectangle indicates the study area and yellow color star shows the epicenter of the 24 September 2019 Mirpur earthquake. Solid black lines show positions of major geological faults and their divisions, and black circular dotted lines show the identified blind faults in the study area.
Remotesensing 16 01457 g002
Figure 3. Frequency distribution of earthquake strikes in Mirpur, Pakistan. Multiple colors indicate the differences in frequency of earthquakes (magnitude ≥ 4) from 1970–2019.
Remotesensing 16 01457 g003
Figure 4. Wrapped co-seismic deformation interferograms derived from the Sentinel-1 data. (a) The interferogram is derived from ascending orbit (16 September 2019 to 28 September 2019) and (b) the interferogram is derived from descending orbit (17 September 2019 to 29 September 2019). The solid black lines denote the estimated locations of the thrust faults and black circular dotted lines show the identified blind faults in the study area. The black star indicates the epicenter of the 24 September 2019 Mirpur earthquake derived from USGS data.
Remotesensing 16 01457 g004
Figure 5. Unwrapped displacement in cm without atmospheric correction along the LOS estimated by Interferometric SAR using Sentinel-1 data (a) from the ascending orbit between 16 September 2019 and 28 September 2019 and (b) from the descending orbit between 17 September 2019 and 29 September 2019. Both green rectangular dotted lines (A to A′ and B to B′) with reference direction to thrust fault lines are used to extract displacement values along the LOS. The solid black lines show the estimated locations of the thrust faults, black circular dotted lines show the identified blind faults and the black star indicates the epicenter of the Mirpur earthquake on 24 September 2019 derived from USGS data.
Remotesensing 16 01457 g005
Figure 6. Graphs based on extracted values of LOS displacement by dotted lines shown in Figure 6, (a) shows the LOS displacement for line A to A′ of both ascending and descending orbit and (b) shows the LOS displacement for line B to B′ of both ascending and descending orbit of Sentinel-1 data.
Remotesensing 16 01457 g006
Figure 7. Shows the interferometric and combined offset tracking results. (a,d) surface displacement results (without atmospheric correction applied) derived from the interferometry in both descending and ascending orbits of Sentinel-1 images, respectively, and (b,e) surface displacement results retrieved from the combined offset tracking in both descending and ascending orbits of Sentinel-1 images. Where (c,f) surface displacement results obtained along the azimuth direction for both ascending and descending orbits of Sentinel-1 images, respectively. (gi) Three-dimensional (3D) co-seismic deformation map based on the ascending and descending orbit LOS displacements (from DInSAR) and azimuth displacement (from offset tracking) in the east–west, north–south, and up-down directions, respectively.
Remotesensing 16 01457 g007
Figure 8. Unwrapped displacement in cm with atmospheric corrections applied along the LOS estimated by Interferometric SAR using Sentinel-1 data. The polygon with black circular patches indicates the mountainous area, while the polygon with black dotted lines indicates the urban area in Mirpur. The blue arrow marks are the geolocated points of real-time data obtained during the field survey and a, b, c, d are assigned according to Figure 9. The solid black lines show the estimated locations of the thrust faults, black circular dotted lines show the identified blind faults, and the black star indicates the epicenter of the Mirpur earthquake on 24 September 2019 derived from USGS data.
Remotesensing 16 01457 g008
Figure 9. Photos of surface displacement in Mirpur, Pakistan taken on 25 September 2019, one day after the earthquake (National Disaster Management Authority). (a) Shows the ground photos of secondary faulting observed after the earthquake stroke. (b,d) Show the structure collapse due to the earthquake in Mirpur, Pakistan. (c) Shows the rocks sliding damaged the small road in Mirpur, Pakistan.
Remotesensing 16 01457 g009
Figure 10. The estimated threshold displacement (cm) with atmospheric corrections applied along the LOS using SAR Interferometry for the pre-seismic time periods (a) 11 August 2019 to 23 August 2019, (b) 23 August 2019 to 4 September 2019, (c) 4 September 2019 to 16 September 2019; co-seismic time periods (d) 16 September 2019 to 28 September 2019; and post-seismic time period (e) 28 September 2019 to 10 October 2019, and (f) 10 October 2019 to 22 October 2019. Displacement variation showed in different color patterns and areas with no colors experienced no displacement.
Remotesensing 16 01457 g010
Figure 11. Temporal variations in average displacement (cm) along the LOS (diamond purple line along the primary y-axis) and rate of change of regional displacement (cm) per day along the LOS (square red line along the secondary y-axis) estimated during pre-seismic, co-seismic and post-seismic time periods from 11 August 2019 to 22 October 2019. The X-axis shows the index of pre-seismic, co-seismic and post-seismic interferograms as shown in Figure 10a–f. Error bars show the standard deviation in the regional displacement values along the LOS.
Remotesensing 16 01457 g011
Table 1. List of Sentinel-1 Wide Swath SAR images from 11 August 2019 to 22 October 2019 that are used for this study. The baseline is calculated for each previous image in the list as a master image.
Sr. No.Pair’s Acquisition DatesDatasetsTrackUTC TimeBaseline (m)Time Span (Days)
111 August 2019
23 August 2019
Pre-seismicAscending04:41−120.1812
223 August 2019
4 September 2019
Ascending13:0446.8512
34 September 2019
16 September 2019
Ascending13:0492.3312
416 September 2019
28 September 2019
Co-seismicAscending05:42−45.8712
517 September 2019
29 September 2019
Descending15:28150.6012
628 September 2019
10 October 2019
Post-seismicAscending15:23−57.8612
710 October 2019
22 October 2019
Ascending15:23−32.2812
Disclaimer/Publisher’s Note: The statements, opinions and data contained in all publications are solely those of the individual author(s) and contributor(s) and not of MDPI and/or the editor(s). MDPI and/or the editor(s) disclaim responsibility for any injury to people or property resulting from any ideas, methods, instructions or products referred to in the content.

