1. Introduction
Oil and gas fields are conducive to the emergence of surface deformations due to the processes associated with production and fluid injection into reservoirs. The production activities can lead to the geological fault’s reactivation, potentially resulting in fluid migration and the emergence of surface instability processes [
1,
2]. Thus, it is appropriate to implement quantitative analyses of deformational processes in oil and gas production fields, with the objective of safeguarding wells and neighboring regions [
3]. However, the exclusive application of field techniques in extensive areas might not be feasible. In such scenarios, a promising alternative lies in the usage of remote-sensing techniques [
4].
Remote-sensing analysis provides significant advantages in terms of coverage area when compared to conventional field-based methods. Techniques such as differential interferometry synthetic aperture radar (DInSAR) allow the measurement of surface variations across vast areas, reducing the necessity for extensive field campaigns. The DInSAR technique is based on the phase difference between two interferograms, providing the displacement along the sensor line of sight (LOS). Consequently, this technique has the potential to identify surface displacements, serving as a complementary action for guiding field activities and analyses [
5,
6].
Nevertheless, the phase difference between two interferograms does not exclusively represent terrain displacement; it also includes artifacts from the atmospheric components, SAR system noise, topographic influences, and errors in baseline estimation. In this manner, the classic DInSAR cannot handle these errors because it requires a statistical analysis of a time series of images to mitigate their influences [
7].
Advanced differential interferometry (A-DInSAR) is one of the techniques employed for assessing surface stability in onshore oil fields [
8,
9]. This technique represents an advancement over classical DInSAR, because it analyzes the phase difference associated with time-series SAR images, enabling the gradual measurement of deformation phenomena over a given time interval. The method also enables an estimation of noise phase components, thereby improving displacement measurements [
7].
Persistent scatterer interferometry (PSI) is an A-DInSAR method distinguished by its reliance on identifying persistent scatterers, which demonstrate stable backscattering properties and minimal signal fluctuation across the temporal series of SAR images [
10,
11]. The PSI is widely used, being applied in deformation analyses with millimetric to centimetric precision [
5,
12,
13,
14], providing precise surface displacement data, facilitating the measurement and monitoring of deformation events across large areas. Although the PSI technique delivers deformation data with high accuracy, it faces constraints when measuring deformation phenomena characterized by high deformation rates, being restricted from measuring differential phases above π [
6].
A study carried out in Cushing, Oklahoma, in 2018, considered the largest above-ground crude oil installation in the world, in an arid region with sparse vegetation, used the A-DInSAR technique [
15], with the intention of monitoring surface deformations and exploration processes. The results presented some intriguing questions regarding the magnitude of the observed deformation yet the lack of seismicity in the area. This region showed a clear area of uplift bounded by faults on the western and eastern sides of the deformation, with a longer central fault. A horizontal profile highlights the variation in an area of subsidence west of the fault (−8 mm) through an area of large deformation (+27 mm).
The Tengiz oil field, located approximately 150 km southeast of the city of Atyrau in western Kazakhstan, one of the largest world-class oil fields in the Pre-Caspian Basin, was analyzed in 2019 using the A-DInSAR technique [
16], being a dry steppe region predominantly covered by bare soil. The results revealed a well-defined bowl subsiding with a maximum rate of −15.7 mm/year, which was corroborated against and validated against leveling data.
A-DInSAR analysis was applied to verify soil deformation in the Marun oil field, located in southwestern Iran, a region characterized as desert with a lack of vegetation [
17]. The results revealed maximum subsidence of the order of 13.5 mm per year over the three-year period. The monthly production rate of the sampled wells was consistent with the pace of oil production. The variation obtained from ground movements was influenced by the combined effects of tectonic activity, reduced underground pressure, hydraulic fractures, physical properties of reservoir rocks, and oil production rates.
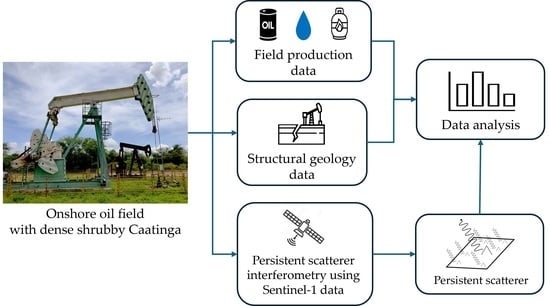
The main goal of our research was analyzing the surface displacements in LOS geometry by PSI technique using Sentinel-1 data in the Canto do Amaro onshore oil fields, located in the northeast of Brazil. The analyses considered the well production data, as well as the structural geology dataset, to verify the capacity of PSI results to provide a comprehensive understanding of the contribution of each variable to the surface movements’ processes. The Canto do Amaro site differs from the other regions studied because it is semi-arid region in Brazil with a dense shrubby Caatinga, with heavy rains during the summer and autumn, where the oil extraction is carried out in small areas of vegetation clearings.
2. Study Area
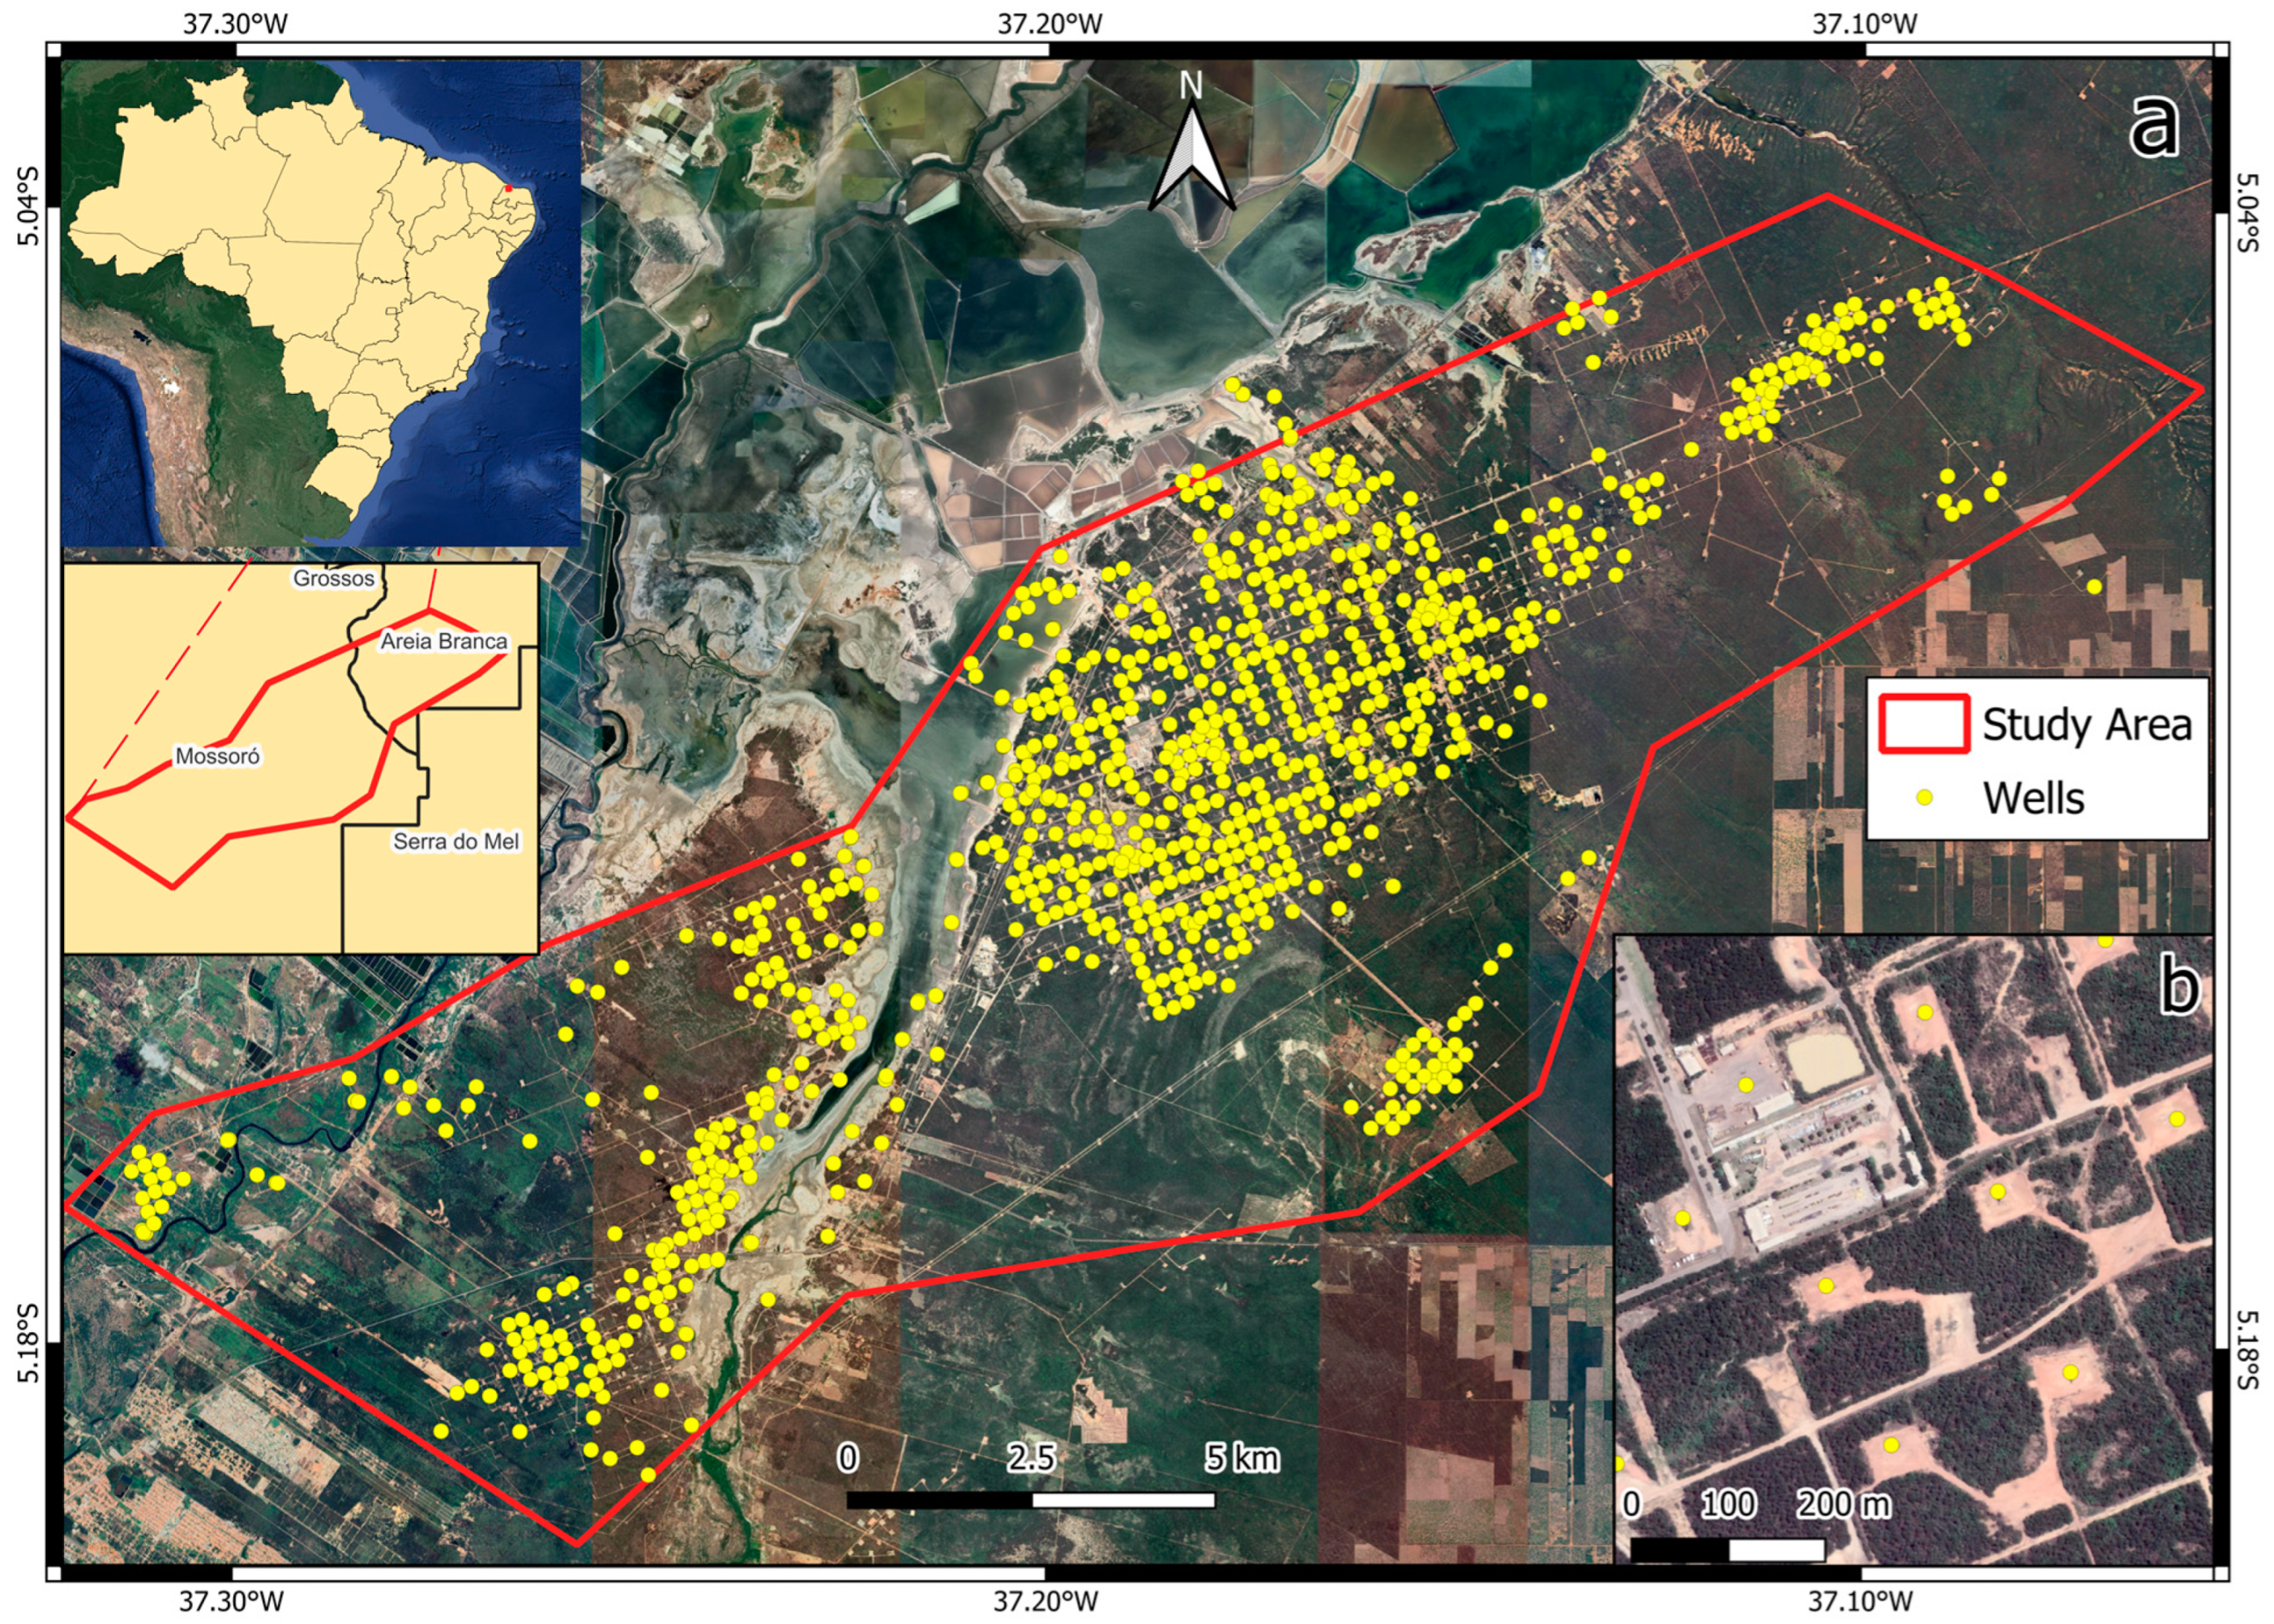
The Canto do Amaro, located in the state of Rio Grande do Norte (RN), in northeastern Brazil (
Figure 1a), is a mature onshore field which has produced oil and gas since 1985 [
18]. This area comprises numerous onshore hydrocarbon production wells that, during the analysis period (July 2020 to December 2021), were managed by Petroleo Brasileiro S.A. (Petrobras). The wells are strategically situated within clear-cut zones, with vegetation suppression areas ranging from 3000 m
2 to 3900 m
2 (
Figure 1b).
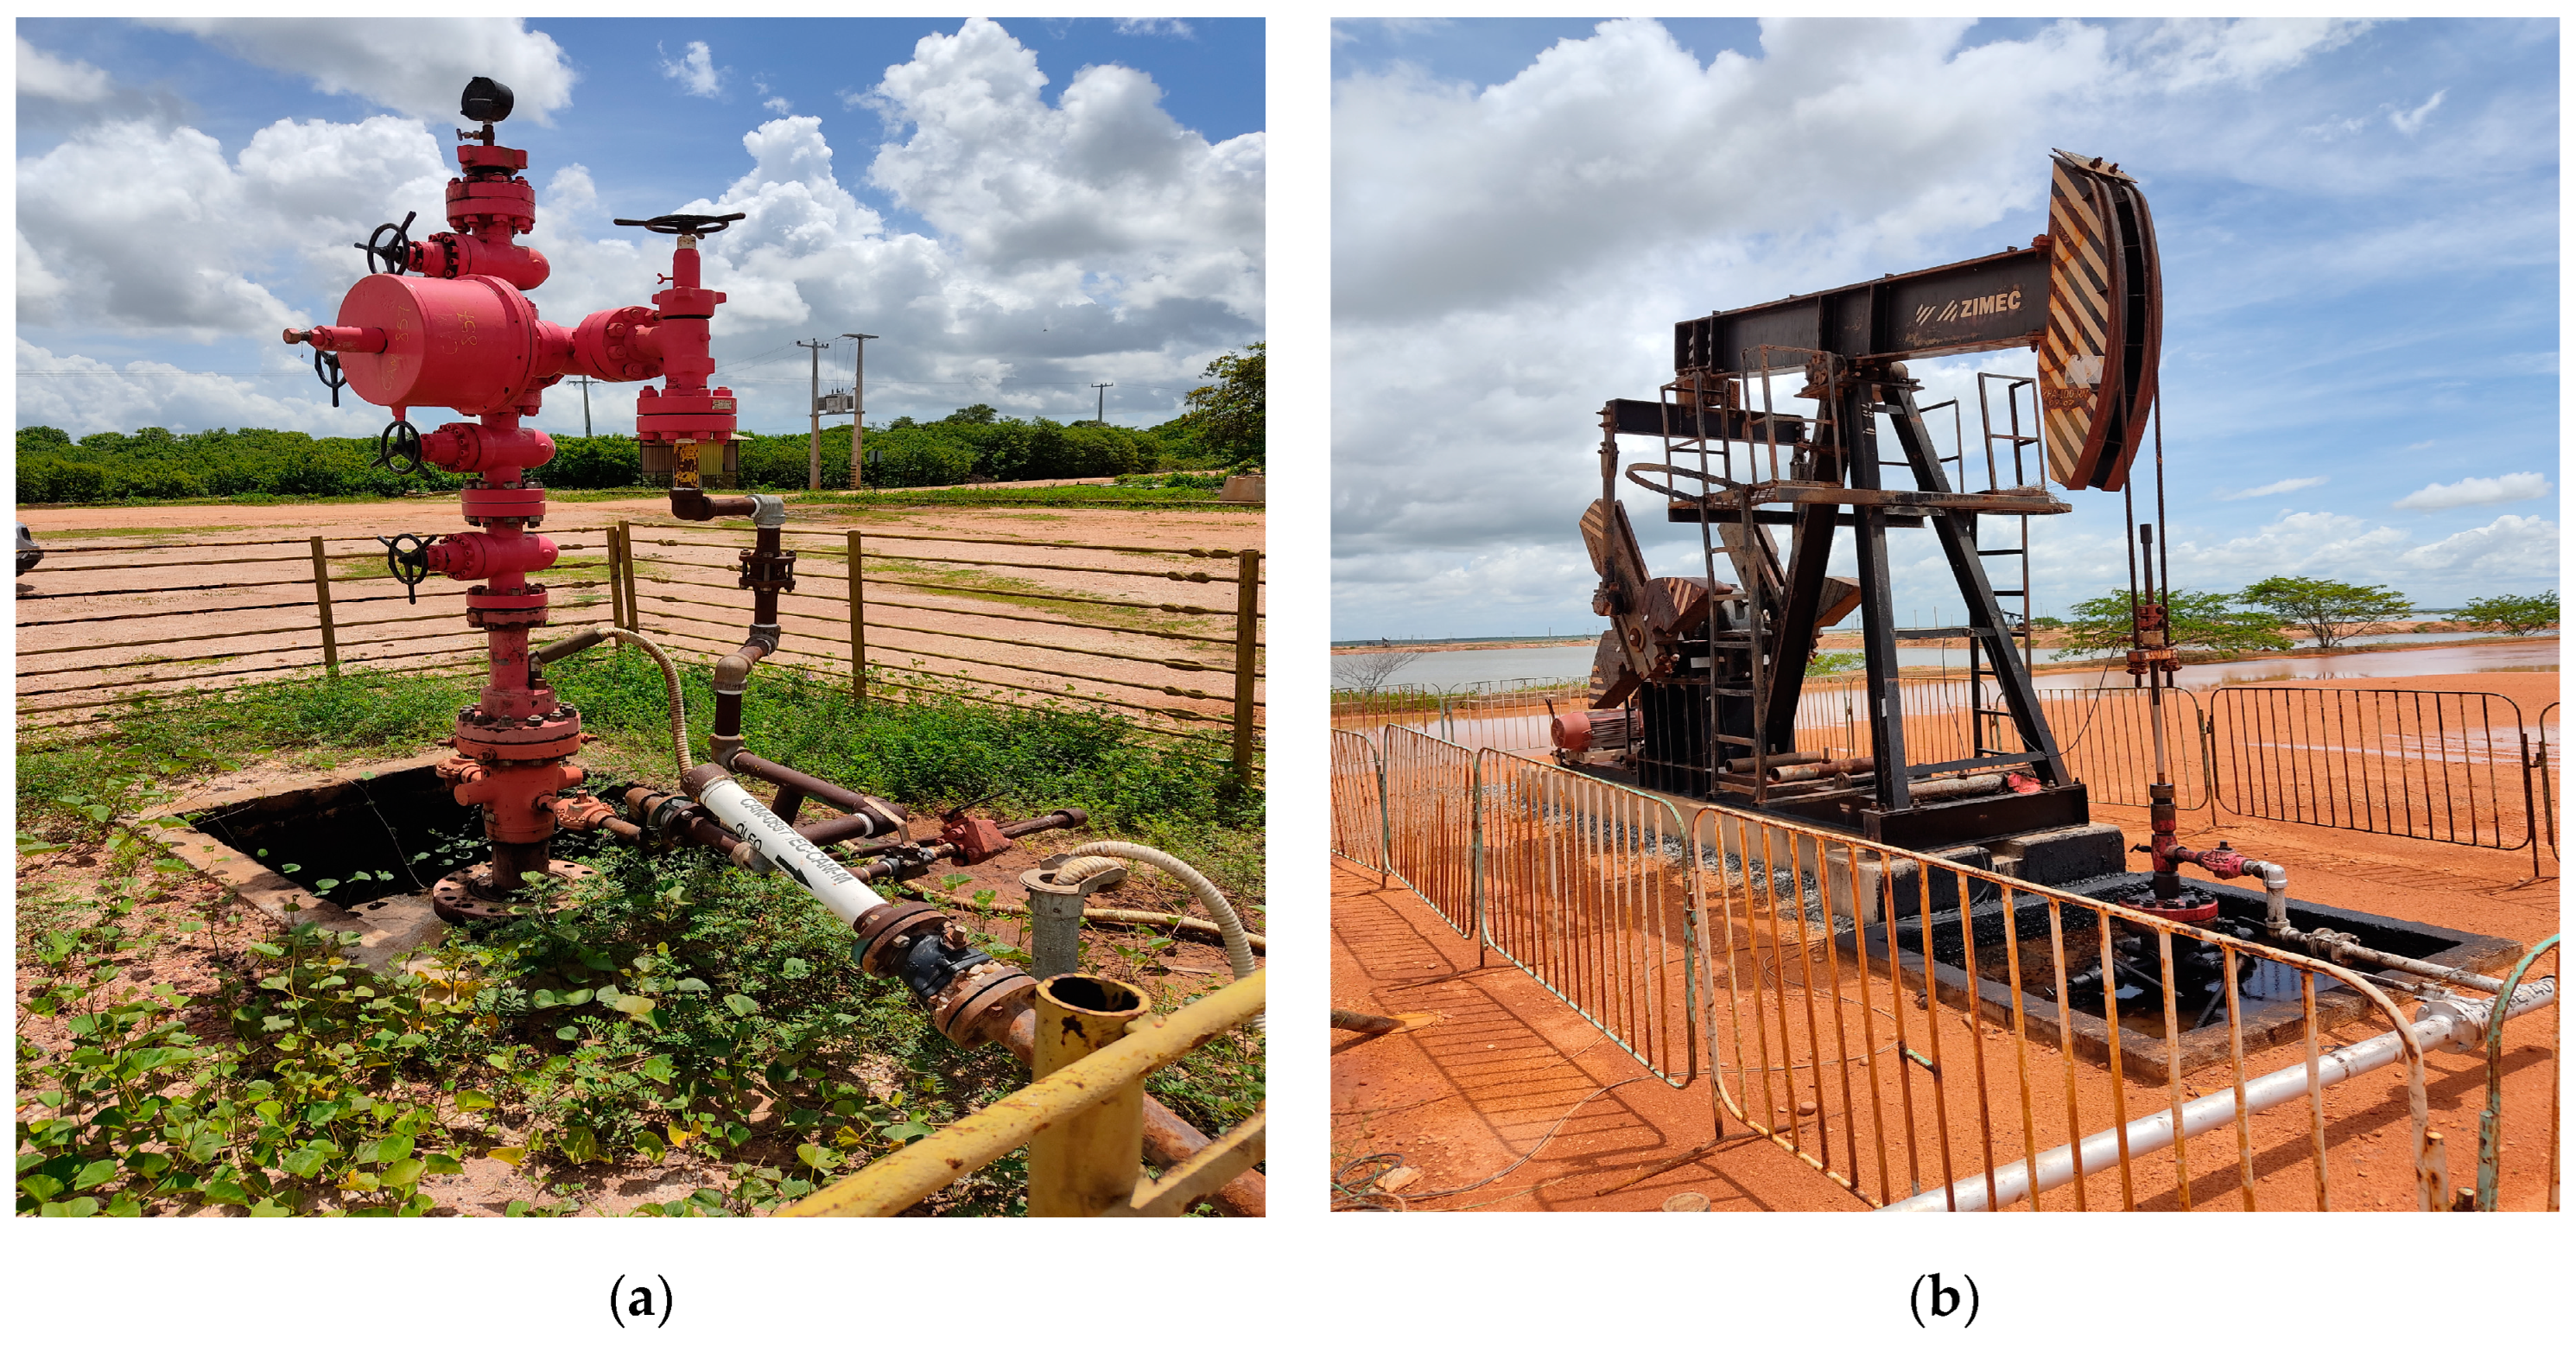
The oil and gas extraction in Canto do Amaro primarily utilizes wells employing artificial lift methods such as electrical submersible pumping (
Figure 2a); nevertheless, there is also a minority application of the beam pumping method (
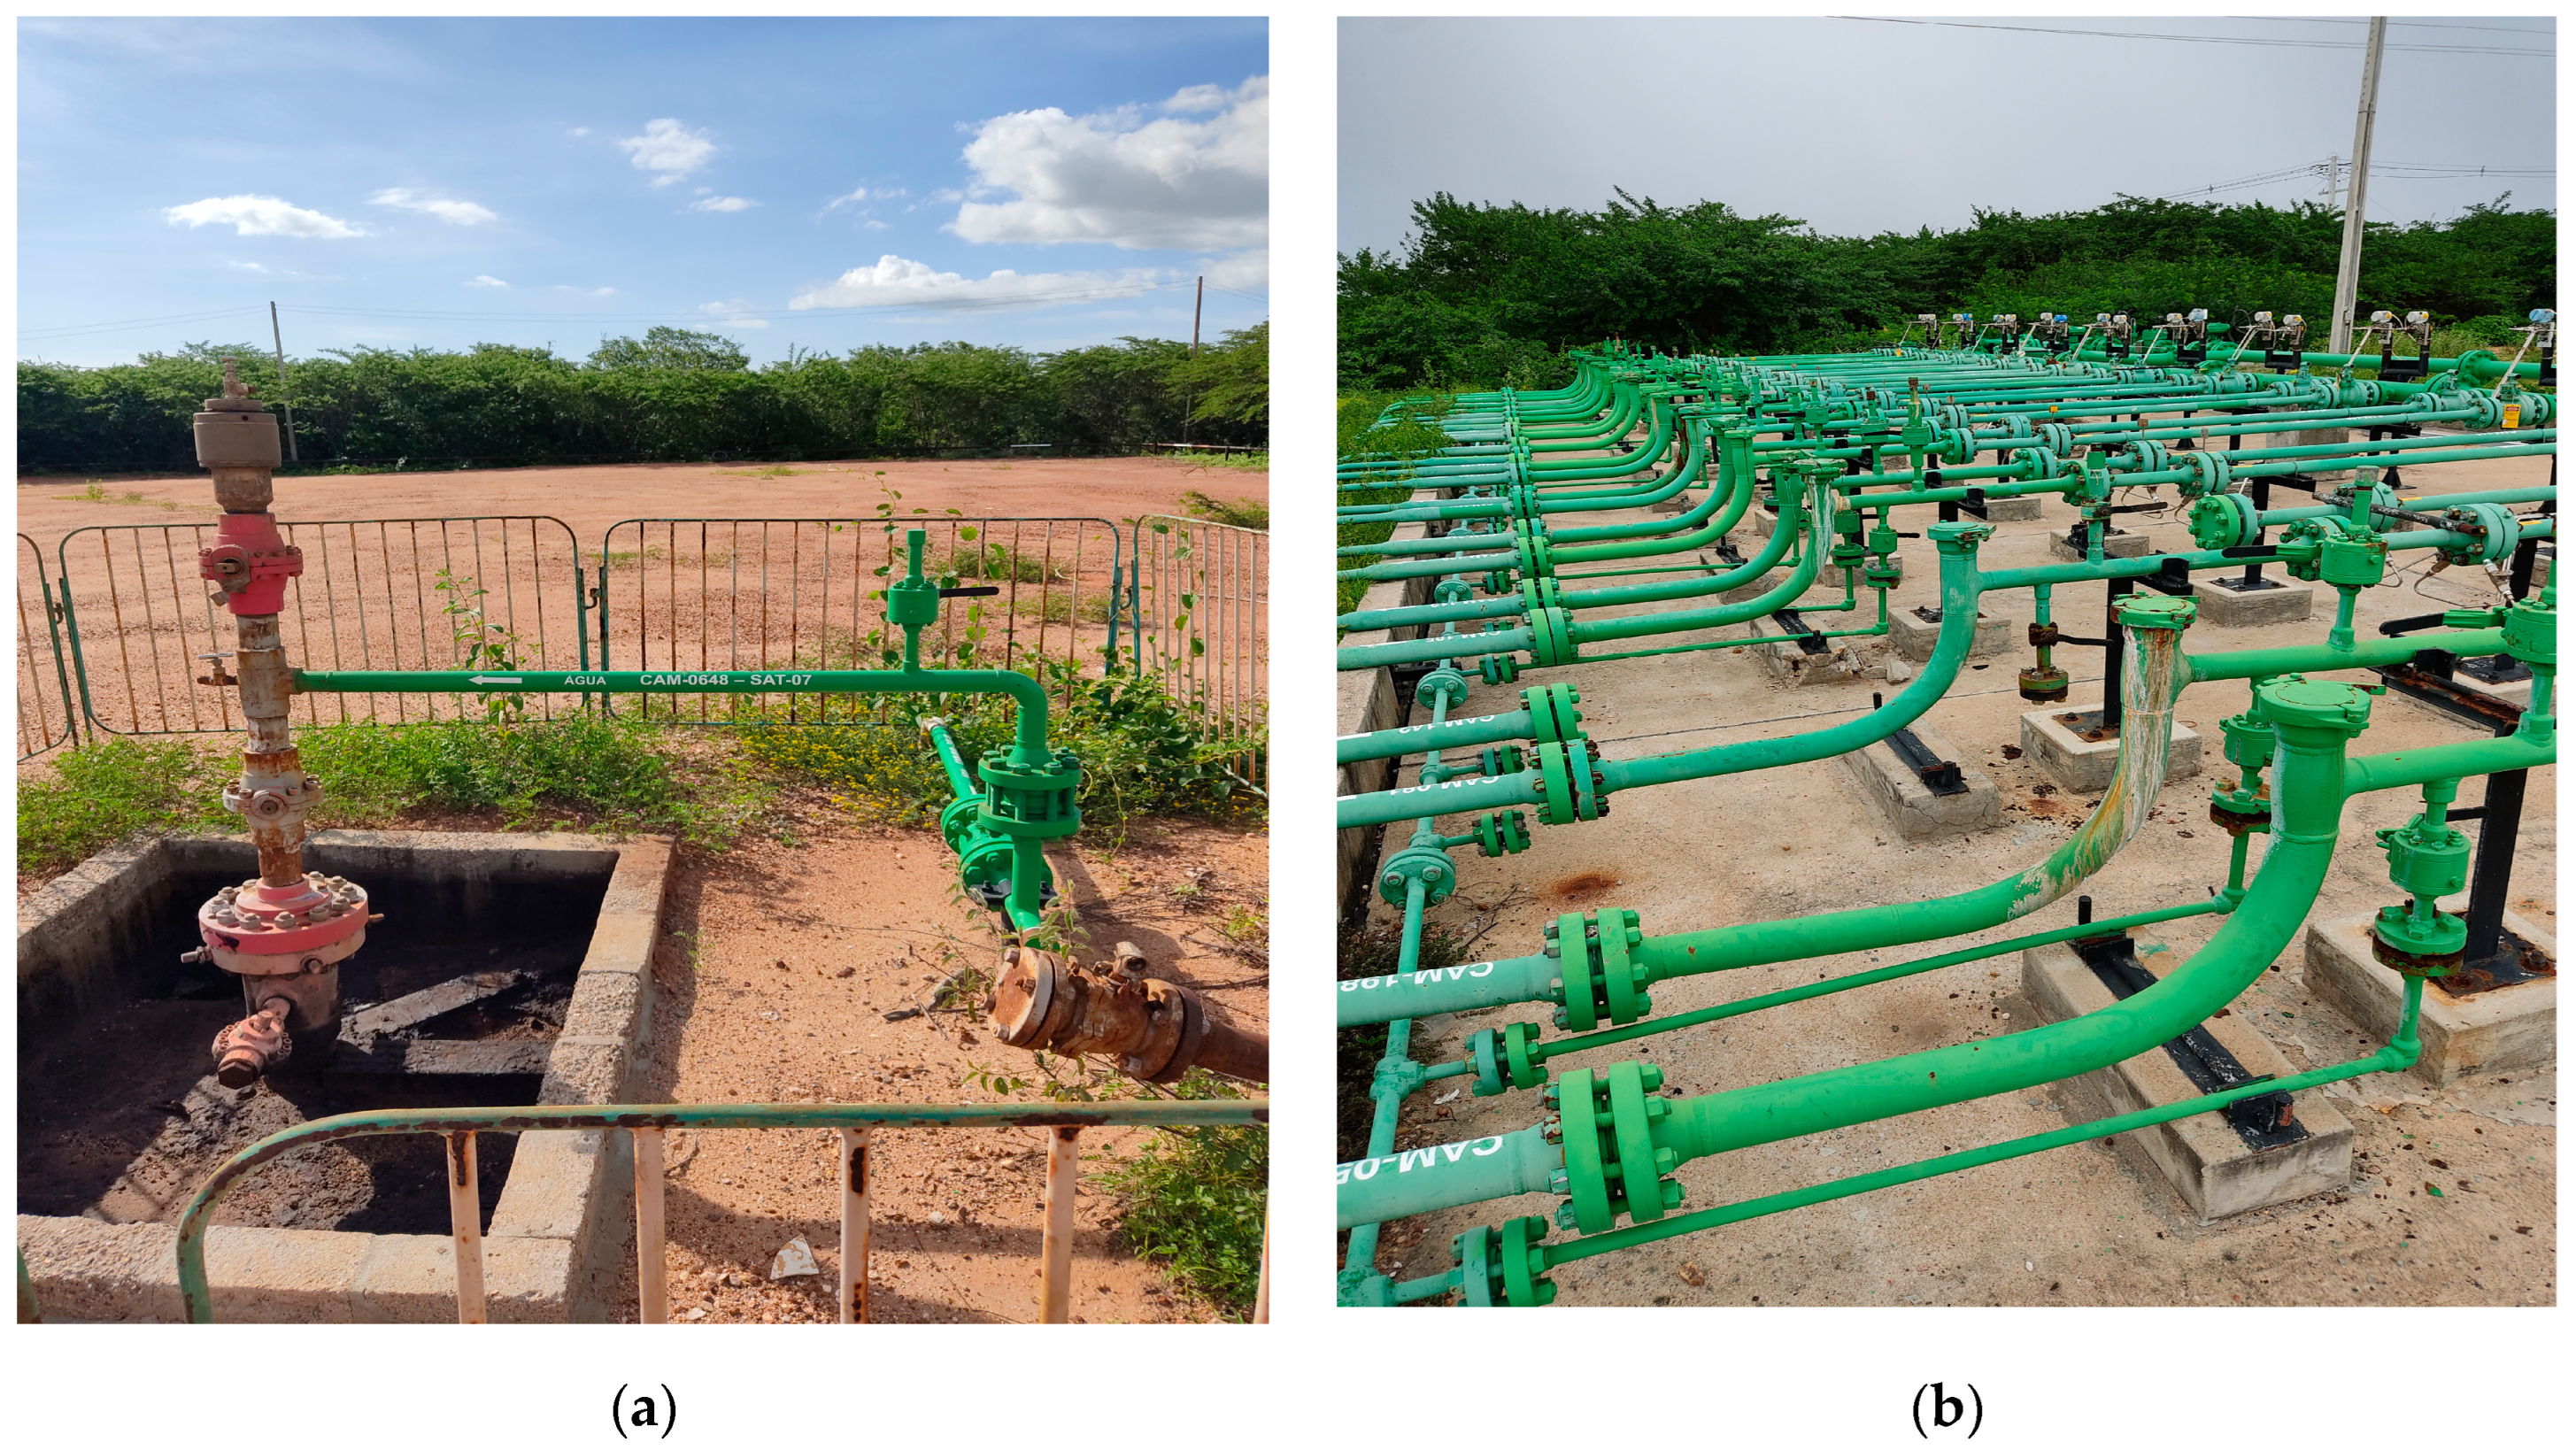
Figure 2b). Furthermore, there are water injection wells (
Figure 3a) in which the water resources are delivered by interconnected pipelines linking water distribution stations to the injection sites (
Figure 3b).
The prevailing climate in the region is semi-arid, characterized by an average annual temperature of 27.5 °C, a relative humidity of 68.9%, and an average precipitation of 673.9 mm [
19]. Peak rainfall occurs in the initial months, from January to April, while the drought period encompasses the months of August to November [
20].
The vegetation cover in the area is part of the shrubby Caatinga biome, characterized by flora well-suited to arid and semi-arid environments. Such vegetation is distinguished by its thorny trees and shrubs that shed part of their leaves in the drought season. Moreover, it encompasses spiny succulents, and herbaceous species, which experience substantial growth during rainy periods [
21].
The region is part of the Potiguar Basin (PB), a sedimentary basin extending across the Rio Grande do Norte and Ceará States [
22]. It covers an estimated 21,500 km
2 in its emerged portion, and 26,500 km
2 in the submerged region [
23]. The basin carries notable regional and national economic significance, due to the offshore and onshore discoveries [
24]. This oil field has mature oil and gas wells, positioning itself in the third place in the Brazilian Onshore Oil Production ranking for the year 2020 [
25].
The PB forms part of the Cretaceous Rift System of northeastern Brazil; it is located within the northern sector of the Borborema Province, controlled by a NE-SW rift system. Its genesis is linked to the Gondwana break-up, which led to the opening process of the Atlantic Ocean. This event is marked by three tectonics stages: syn-rift I (Late Jurassic), syn-rift II (Early Berriasian to Late Barremian) and syn-rift III (Late Barremian to Early Aptian) [
26,
27].
The onshore rift segment of the Potiguar Basin is linked to the syn-rift phase II, which is regarded as the main rifting stage of the northeast Brazilian rift system, characterized by a prevailing NW-SE orientation [
26]. The rift’s geometry is influenced by the Carnaubais, Baixa Grande, Apodi, and Areia Branca fault systems. The Areia Branca fault system forms a hinge line that delineates the Potiguar Rift to the west, and it is notable for its prevalence of NE-SW oriented normal faults [
28]. During the final stage of rifting (syn-rift III), there was a transition to an E-W extension direction, changing the axis of the Potiguar Rift to the offshore zone [
26,
29].
The stratigraphic sequence of the PB is defined by three tectonic stages: rift, occurring in the Early Cretaceous; post-rift, spanning the Aptian–Albian; and drift, from Albian to the present [
23]. The rift stage is characterized by fluvio-deltaic and lacustrine deposits of the Pendência and Pescada Formations [
23]. The post-rift phase includes the Alagamar Formation, consisting of fluvio-deltaic sequences, with the earliest records of marine ingression [
30]. The drift supersequence comprises transgressive fluvio-marine deposits, consisting of the Açu, Ponta do Mel, Quebradas, Jandaíra, and Ubarana Formations. These formations are overlain by regressive clastic and carbonate sequences known as the Ubarana, Tibau, and Guamaré Formations [
23,
31]. The volcanic rocks linked to the BP derive from the Macau Formation, Rio Ceará Mirim, and Cuó [
23].
Oil production in the PB is sourced from siliciclastic reservoirs deposited during the rift, transitional, and drift stages. Specific structural and reservoir styles are associated with oil and gas within each sequence. During the drift sequence, which encompasses the lithostratigraphy of the Canto do Amaro field, hydrocarbons were predominantly generate in the Alagamar Formation, leasing to the establishment of the Alagamar-Açu Petroleum System. Nevertheless, the shales from the rift phase have also made contributions in regions where the Alagamar Formation is immature [
24].
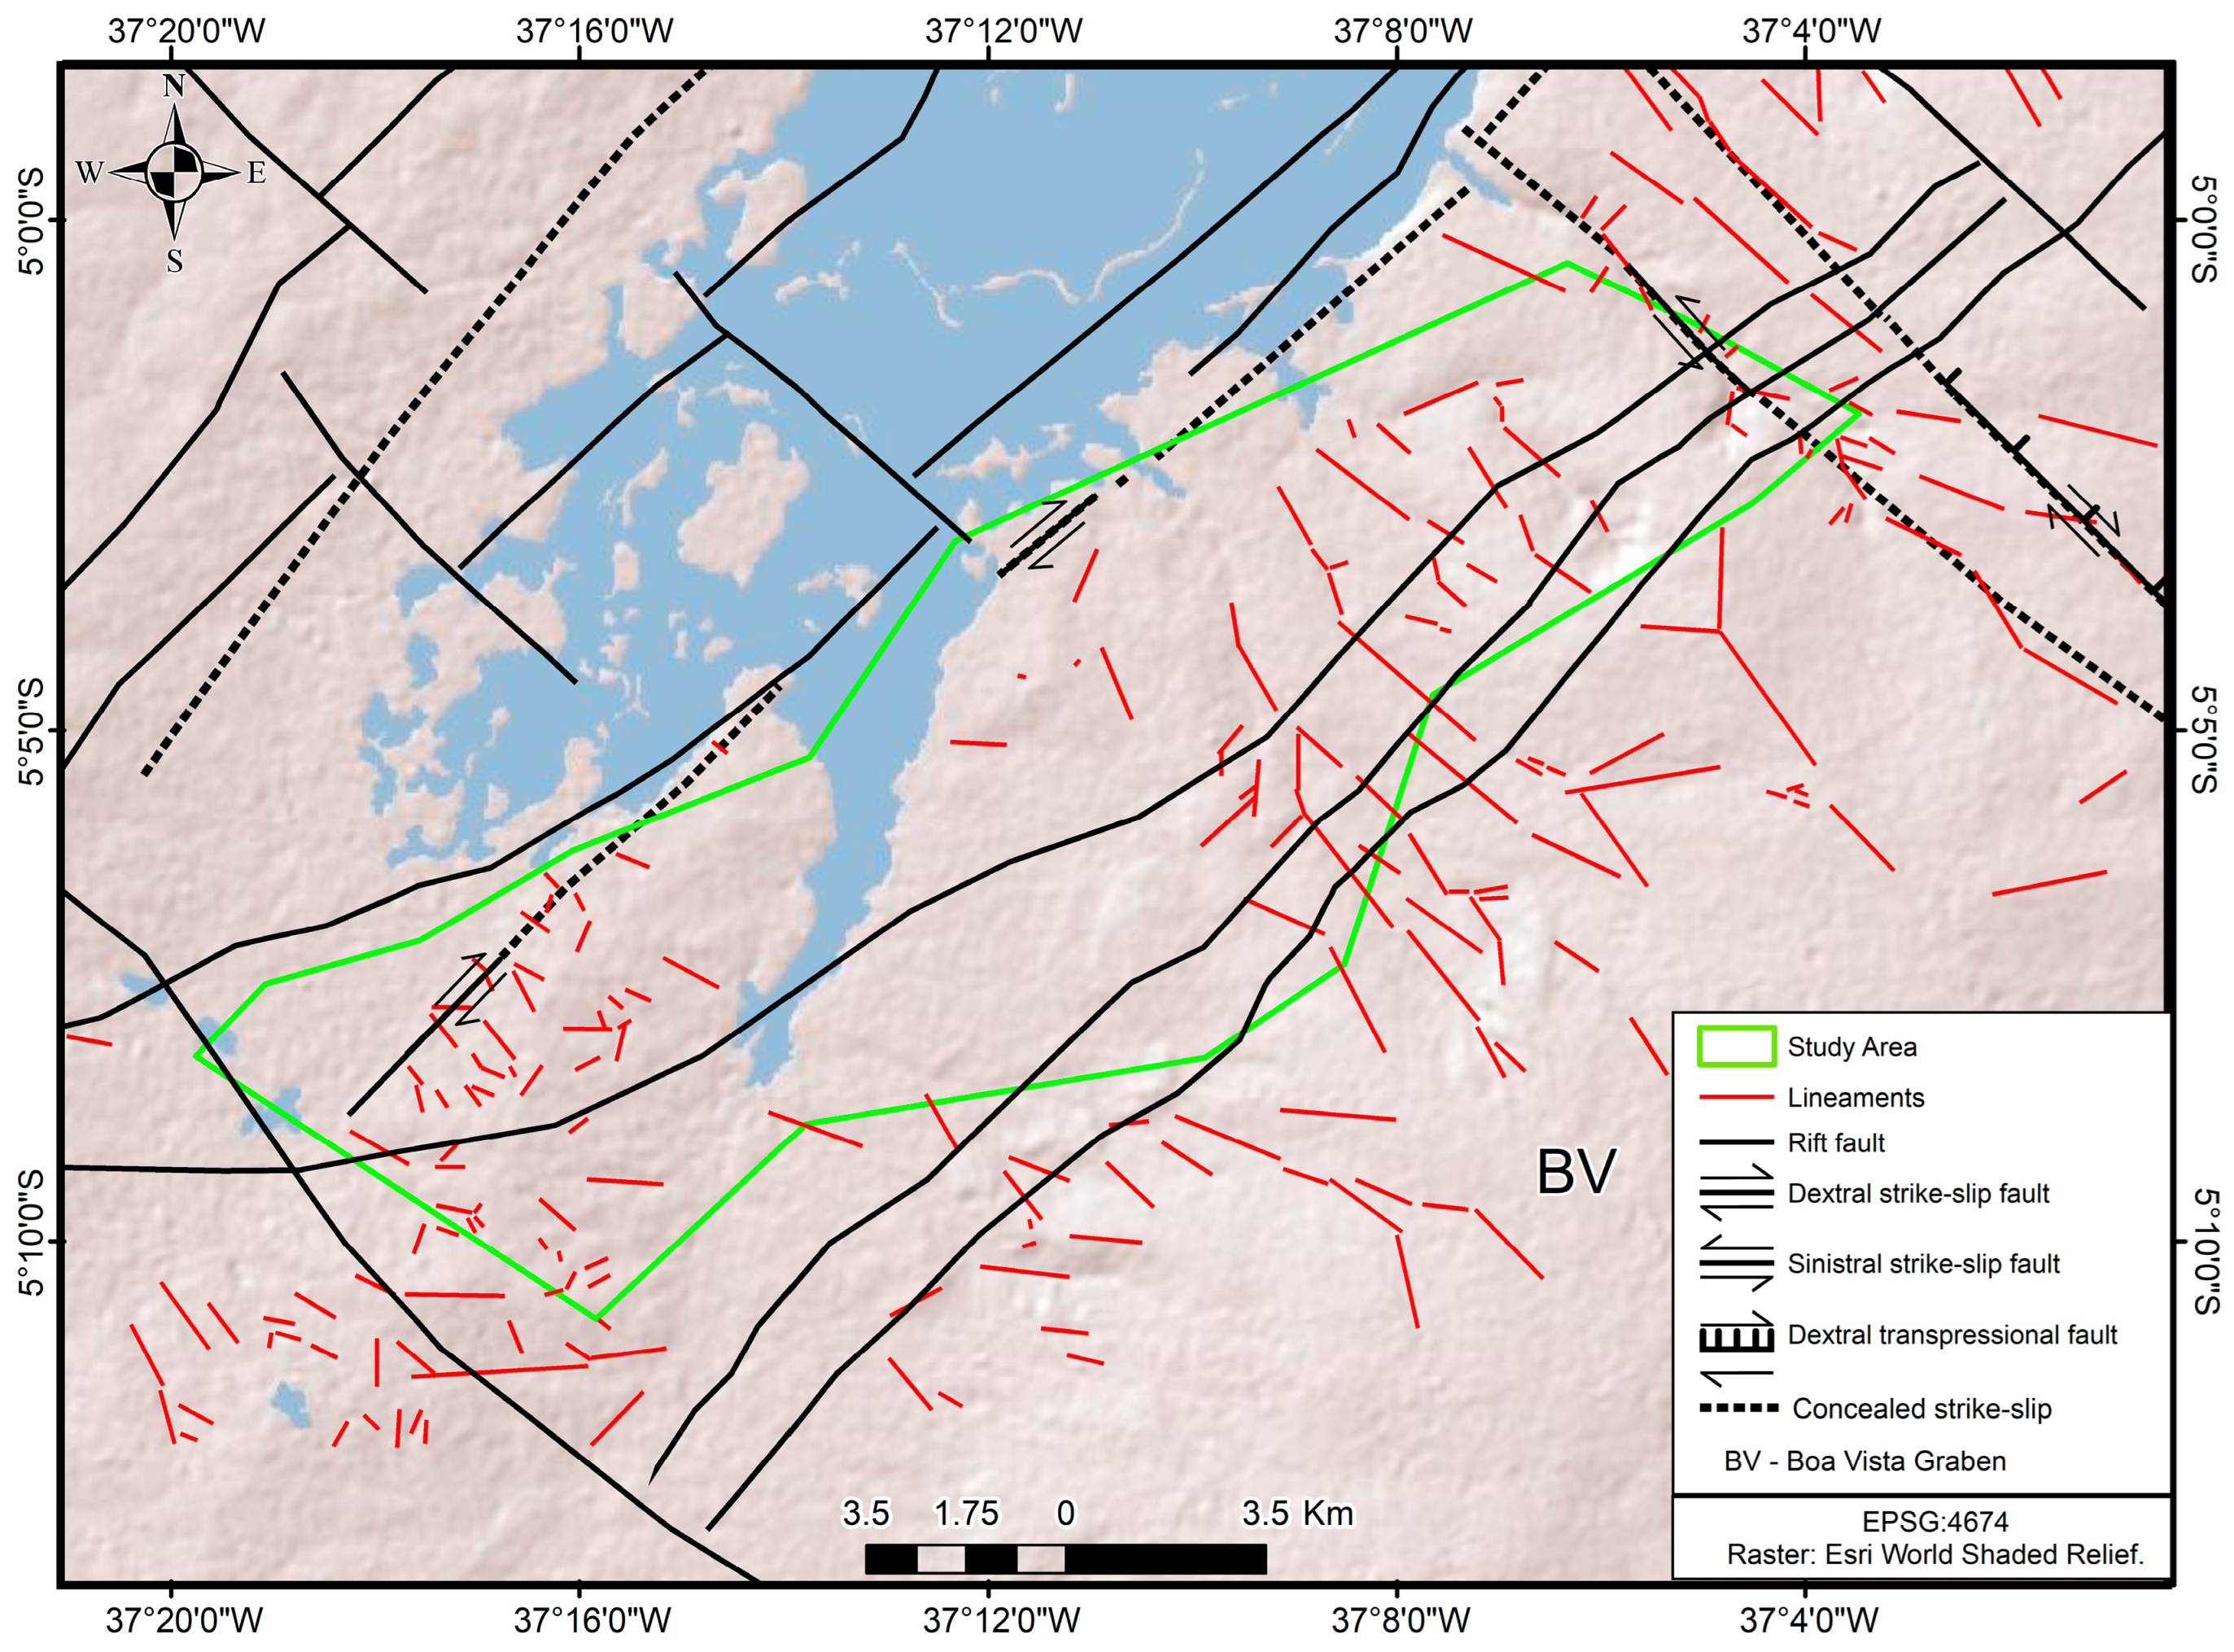
The structural geology of the area of interest comprises rift and transcurrent fault structures, as evidenced in
Figure 4.
3. Materials and Methods
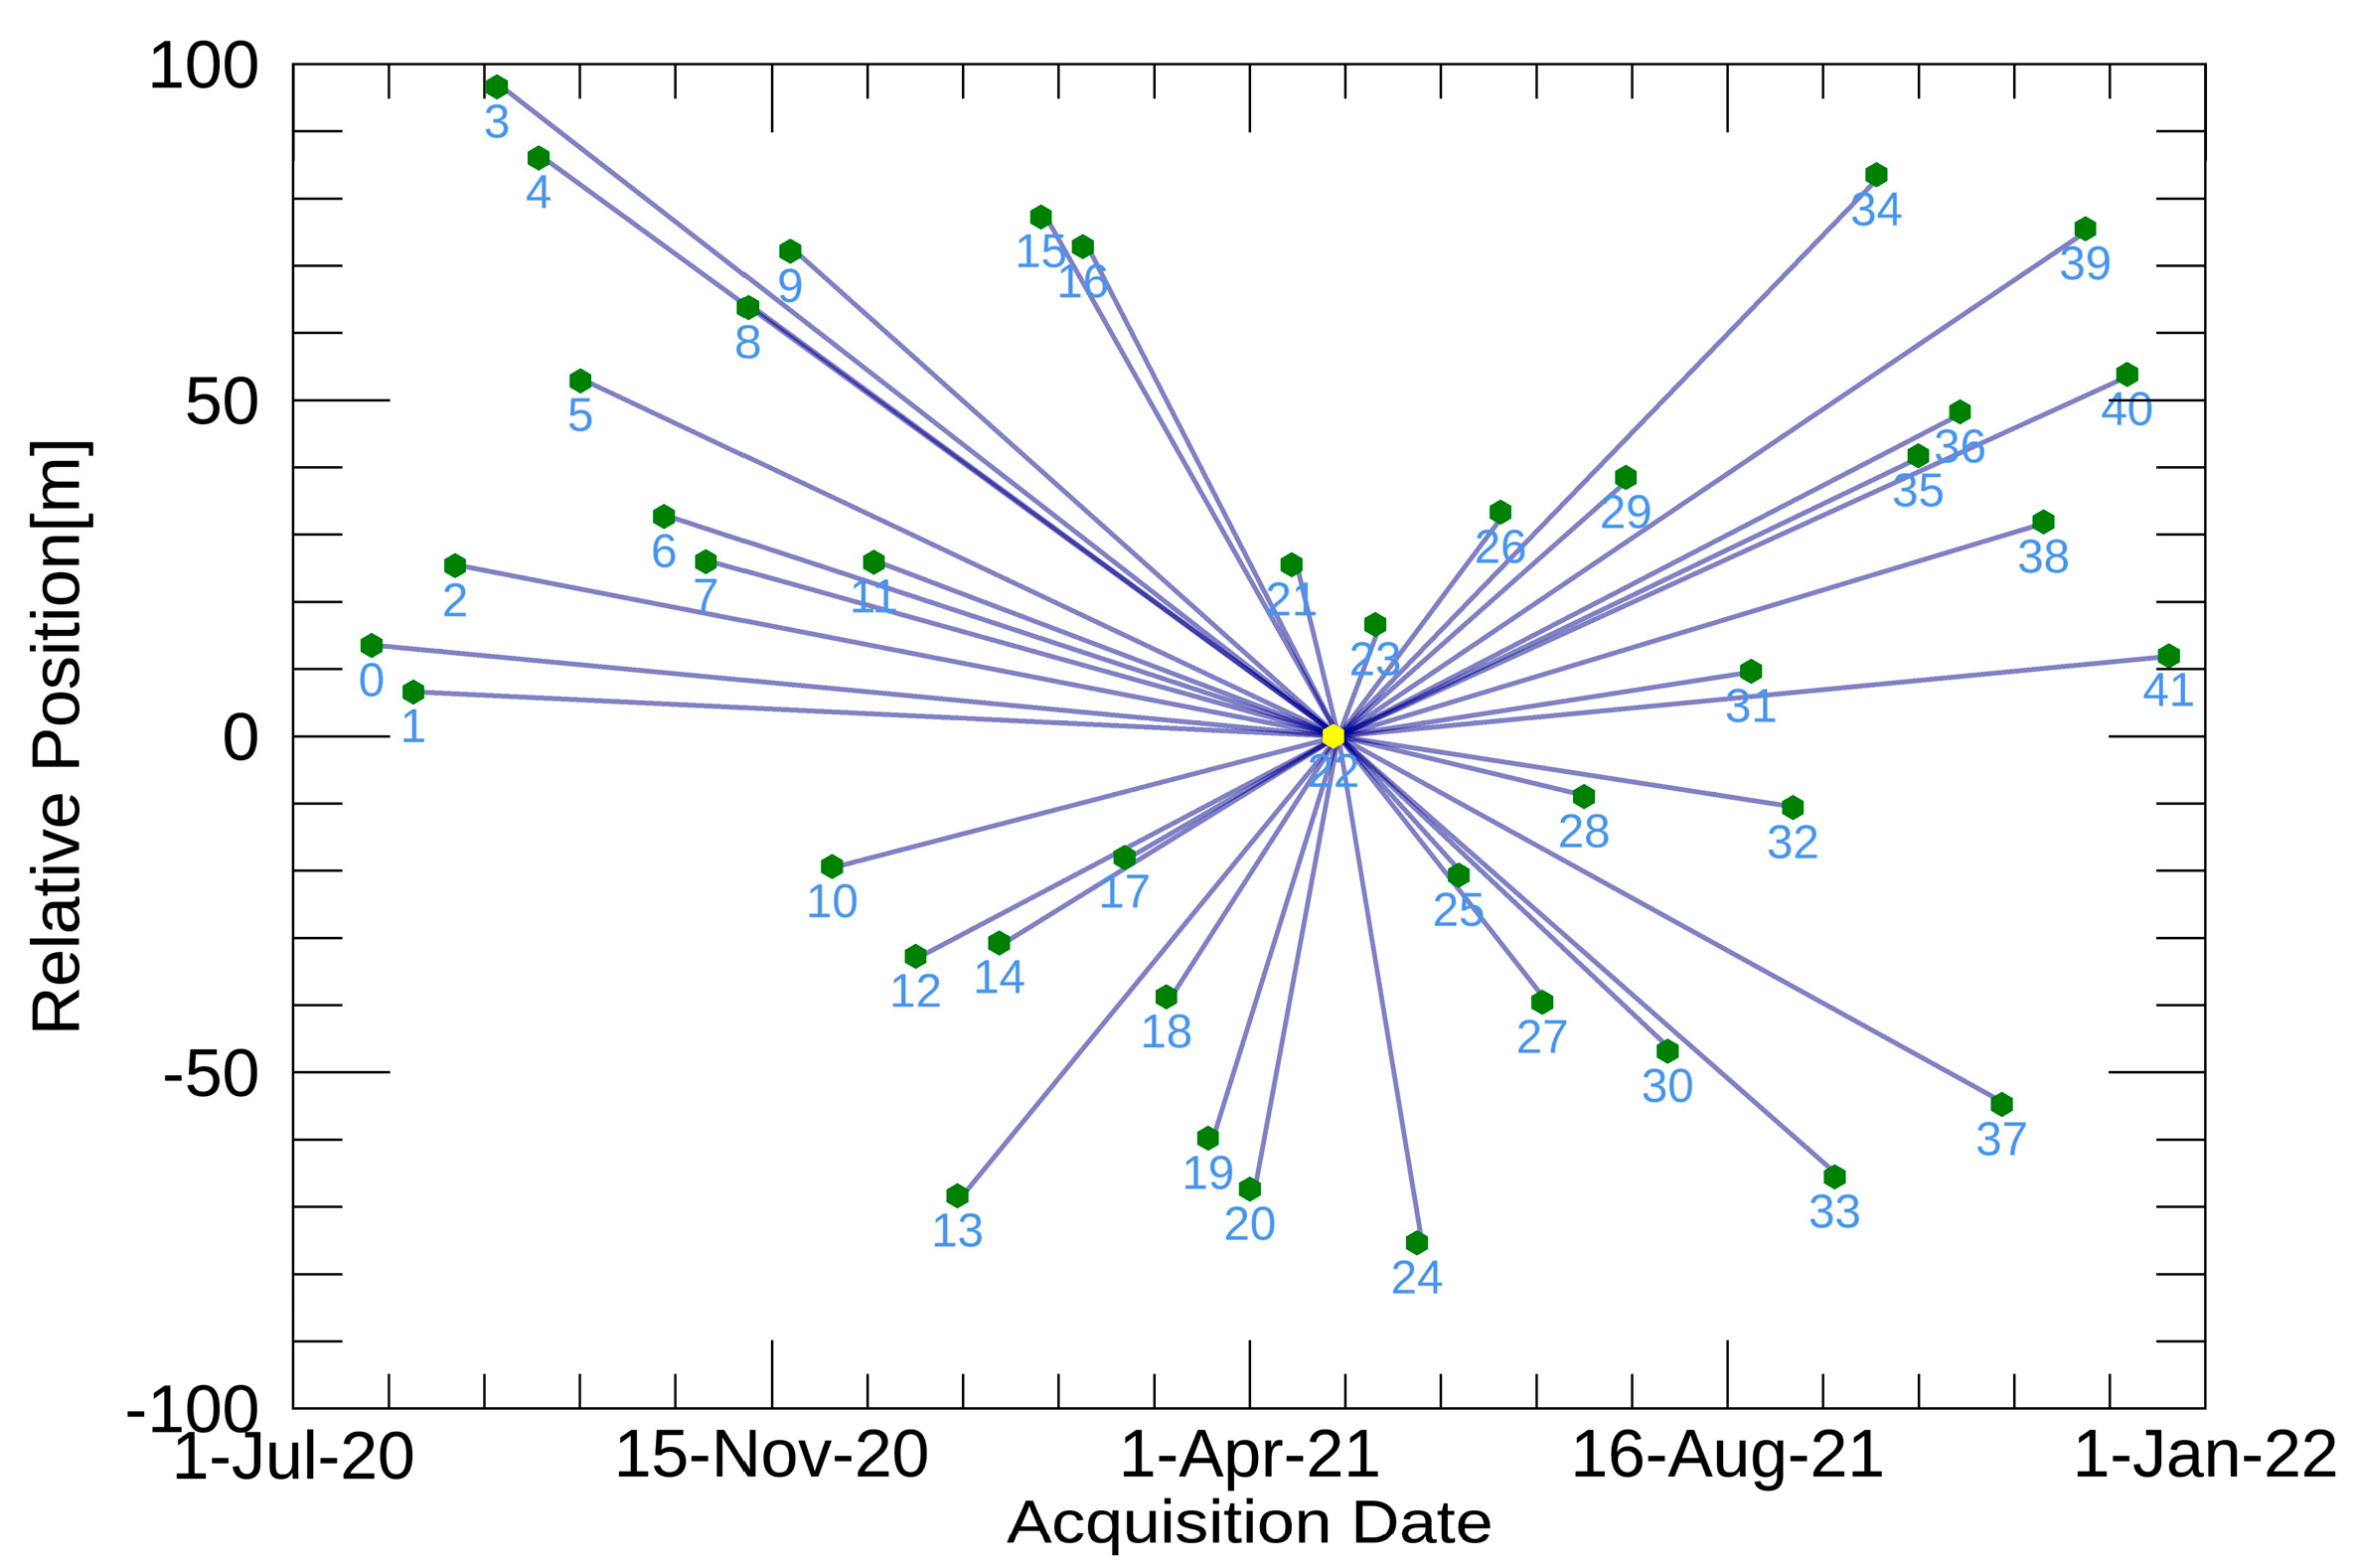
The processing of 42 Sentinel-1A Single Look Complex (SLC) images (
Table 1) was carried out using the PSI technique. These scenes cover the study area from 23 July 2020 up to 21 December 2021. The SAR processing workflow was executed using SARScape 5.6.2, that allowed importing the data, to do the deburst processing and clip the interest area. The digital elevation model (DEM) employed to simulate the topographic phase in SAR processing was sourced from a digital elevation model (DEM) LiDAR.
Well production data are sourced from monthly spreadsheets on oil and natural gas production, which are accessible on the website of the Brazilian National Agency of Petroleum, Natural Gas, and Biofuels. Data mining of production data was executed using Python 3, leveraging data analysis libraries such as Pandas, Numpy, and Seaborn.
The study area geological structures were acquired by vectorizing structural maps available in the literature [
32,
33] and by extracting structural lineaments using the LiDAR DEM. The structural data vectorization, production data analysis, and map creation were conducted using the QGIS 3.22.4 and ArcMap 10.8.
3.1. SAR Processing
PSI processing (
Figure 5) was performed in a stack of 42 Sentinel-1 images using the SARscape 5.6.2 software package. Using a substantial image dataset, the technique facilitates statistical analyses of phase errors associated with atmospheric conditions and/or other noises. Within this stack of images is selected a reference image, typically positioned at the center of the temporal series to enhance interferometric coherence between the pairs. The choice of the reference image (master image) relies on minimizing the baseline dispersion and temporal distance between images. This approach aims to mitigate the temporal and spatial decorrelation [
7,
11].
At the beginning of the processing workflow, depicted in
Figure 5, the orbit information was corrected by acquiring precise orbit data for individual images. After that, the images were clipped using a defined region of interest, with only VV polarization products retained for further analysis. The stack coregistration process was conducted by using the master image as the reference, entailing precise adjustment of the pixel grid to achieve correspondence among pixels across all images. Afterwards, the master image, acting as the reference SAR product, and auxiliary images were picked to construct interferometric pairs (
Figure 6).
The phase information (
) contained within each pixel of the interferogram is a composite of various contributing variables, as depicted in Equation (1) [
34].
where
is the phase component linked to the topography,
denotes the phase difference generated as result of the terrain deformation,
is the phase contribution related to atmospheric components noise, and
refers to the phase attributed to the system noise.
The biggest phase component of Equation (1) is the topographic phase; hence, it is essential to minimize it to ensure a more precise terrain deformation () estimation. Consequently, the differential interferograms were obtained by subtracting the simulated topographic phase, processed from the LiDAR elevation model. In addition, multi-looking was conducted with a 12 × 3 window size in range and azimuth directions. The atmospheric component was filtered using a low-pass window size of 1200 m and a low-pass window size of 365 days for each pixel.
The selection of the reference point can be based on either the reflectivity map generated by the software or the identification of stable targets in optical sensor images, such as buildings or rocky outcrops [
35]. In this study, the selection of a reference point was automated by SARScape, which selected an object demonstrating high stability across the temporal series.
Persistent scatterer candidates are points characterized by a high signal-to-noise ratio, identified through the analysis of amplitude variation. Therefore, a threshold range based on the amplitude dispersion index of 0.4 is used for the selection of persistent scatterers [
10].
In PSI processing, two principal assumptions are considered: (1) a linear correlation exists between the phase representing topographic error and the components of perpendicular baselines, and (2) it is assumed that there is a linear relationship between deformation and time. It is further assumed that the residuals of the linear regression of deformation over time are correlated with atmospheric phase components, noise, and the nonlinear deformation phase [
36]. Consequently, these residual phases may be estimated employing relevant filters and statistical techniques.
After the PSI processing was completed, the persistent scatterer points obtained were analyzed. When necessary, refinement of the model was carried out through the updating of input parameters, followed by the subsequent reprocessing of these points. The deformation map of the study area was generated, and the deformation points were exported as shapefiles for later analysis.
3.2. Oil, Gas, and Water Production Data Mining
Brazil’s petroleum production data were obtained from the ANP (2021), which receives production wells reports from companies monthly, and whose data are released 2 months after validation by the ANP. However, these data encompass all Brazilian onshore oil extraction wells, so the values of production wells related to the study area (Canto do Amaro) were filtered by data mining, using Python 3.9, as well as Pandas, Seaborn, and Numpy libraries. Originally, the production information was presented in comma-separated values format spreadsheets, in a total of 18 files covering the study period of July 2020 to December 2021. Following the filtration process, monthly information was aggregated into a matrix comprising the summation of oil, gas, and water production data. Finally, an exploratory examination of the production data was carried out using Python 3.9 and the previously referenced data analysis modules.
3.3. Geospatial Correlation Analysis
Utilizing ArcMap 10.8 software within a geographic information system (GIS) environment, the dataset was organized, consolidating structural, production, and deformation data into geospatial vectors. Thus, interpretations of structural geology were undertaken, with the objective of establishing geospatial correlations among deformational data, geological structures, and production information within the geolocated well vectors. Moreover, analyses were performed on 500 × 500 m grid zones, employing zonal statistics of production and deformation data. Following this, correlation matrix analyses of statistical data within each grid were conducted using Python 3. An assessment was conducted to determine the presence of surface deformations and ascertain any correlation between ground movements, geological structures, and/or the inherent methods of oil and gas production in the Canto do Amaro oil field.
4. Results
4.1. Interferometric Coherence
The statistical analysis of the data reveals that the average interferometric coherence was 0.69, with a maximum value of 0.96. The 50th and 75th percentiles are 0.66 and 0.74, respectively, indicating that half of the data have coherence values close to the lower threshold, and that a significant portion of persistent points (75%) have correlation measures lower than or equal to 0.74.
The PSs showing the highest coherence values (0.8 or higher) are situated over areas featuring oil storage tanks, metallic structures, residential areas, and exposed ground. The persistent scatterer points with correlation values near the lower limit (0.6) are spatially located near vegetated areas and surrounding regions with water resources. Aiming to mitigate noisy deformational data, all persistent points with coherence values below 0.7 were excluded from the analysis.
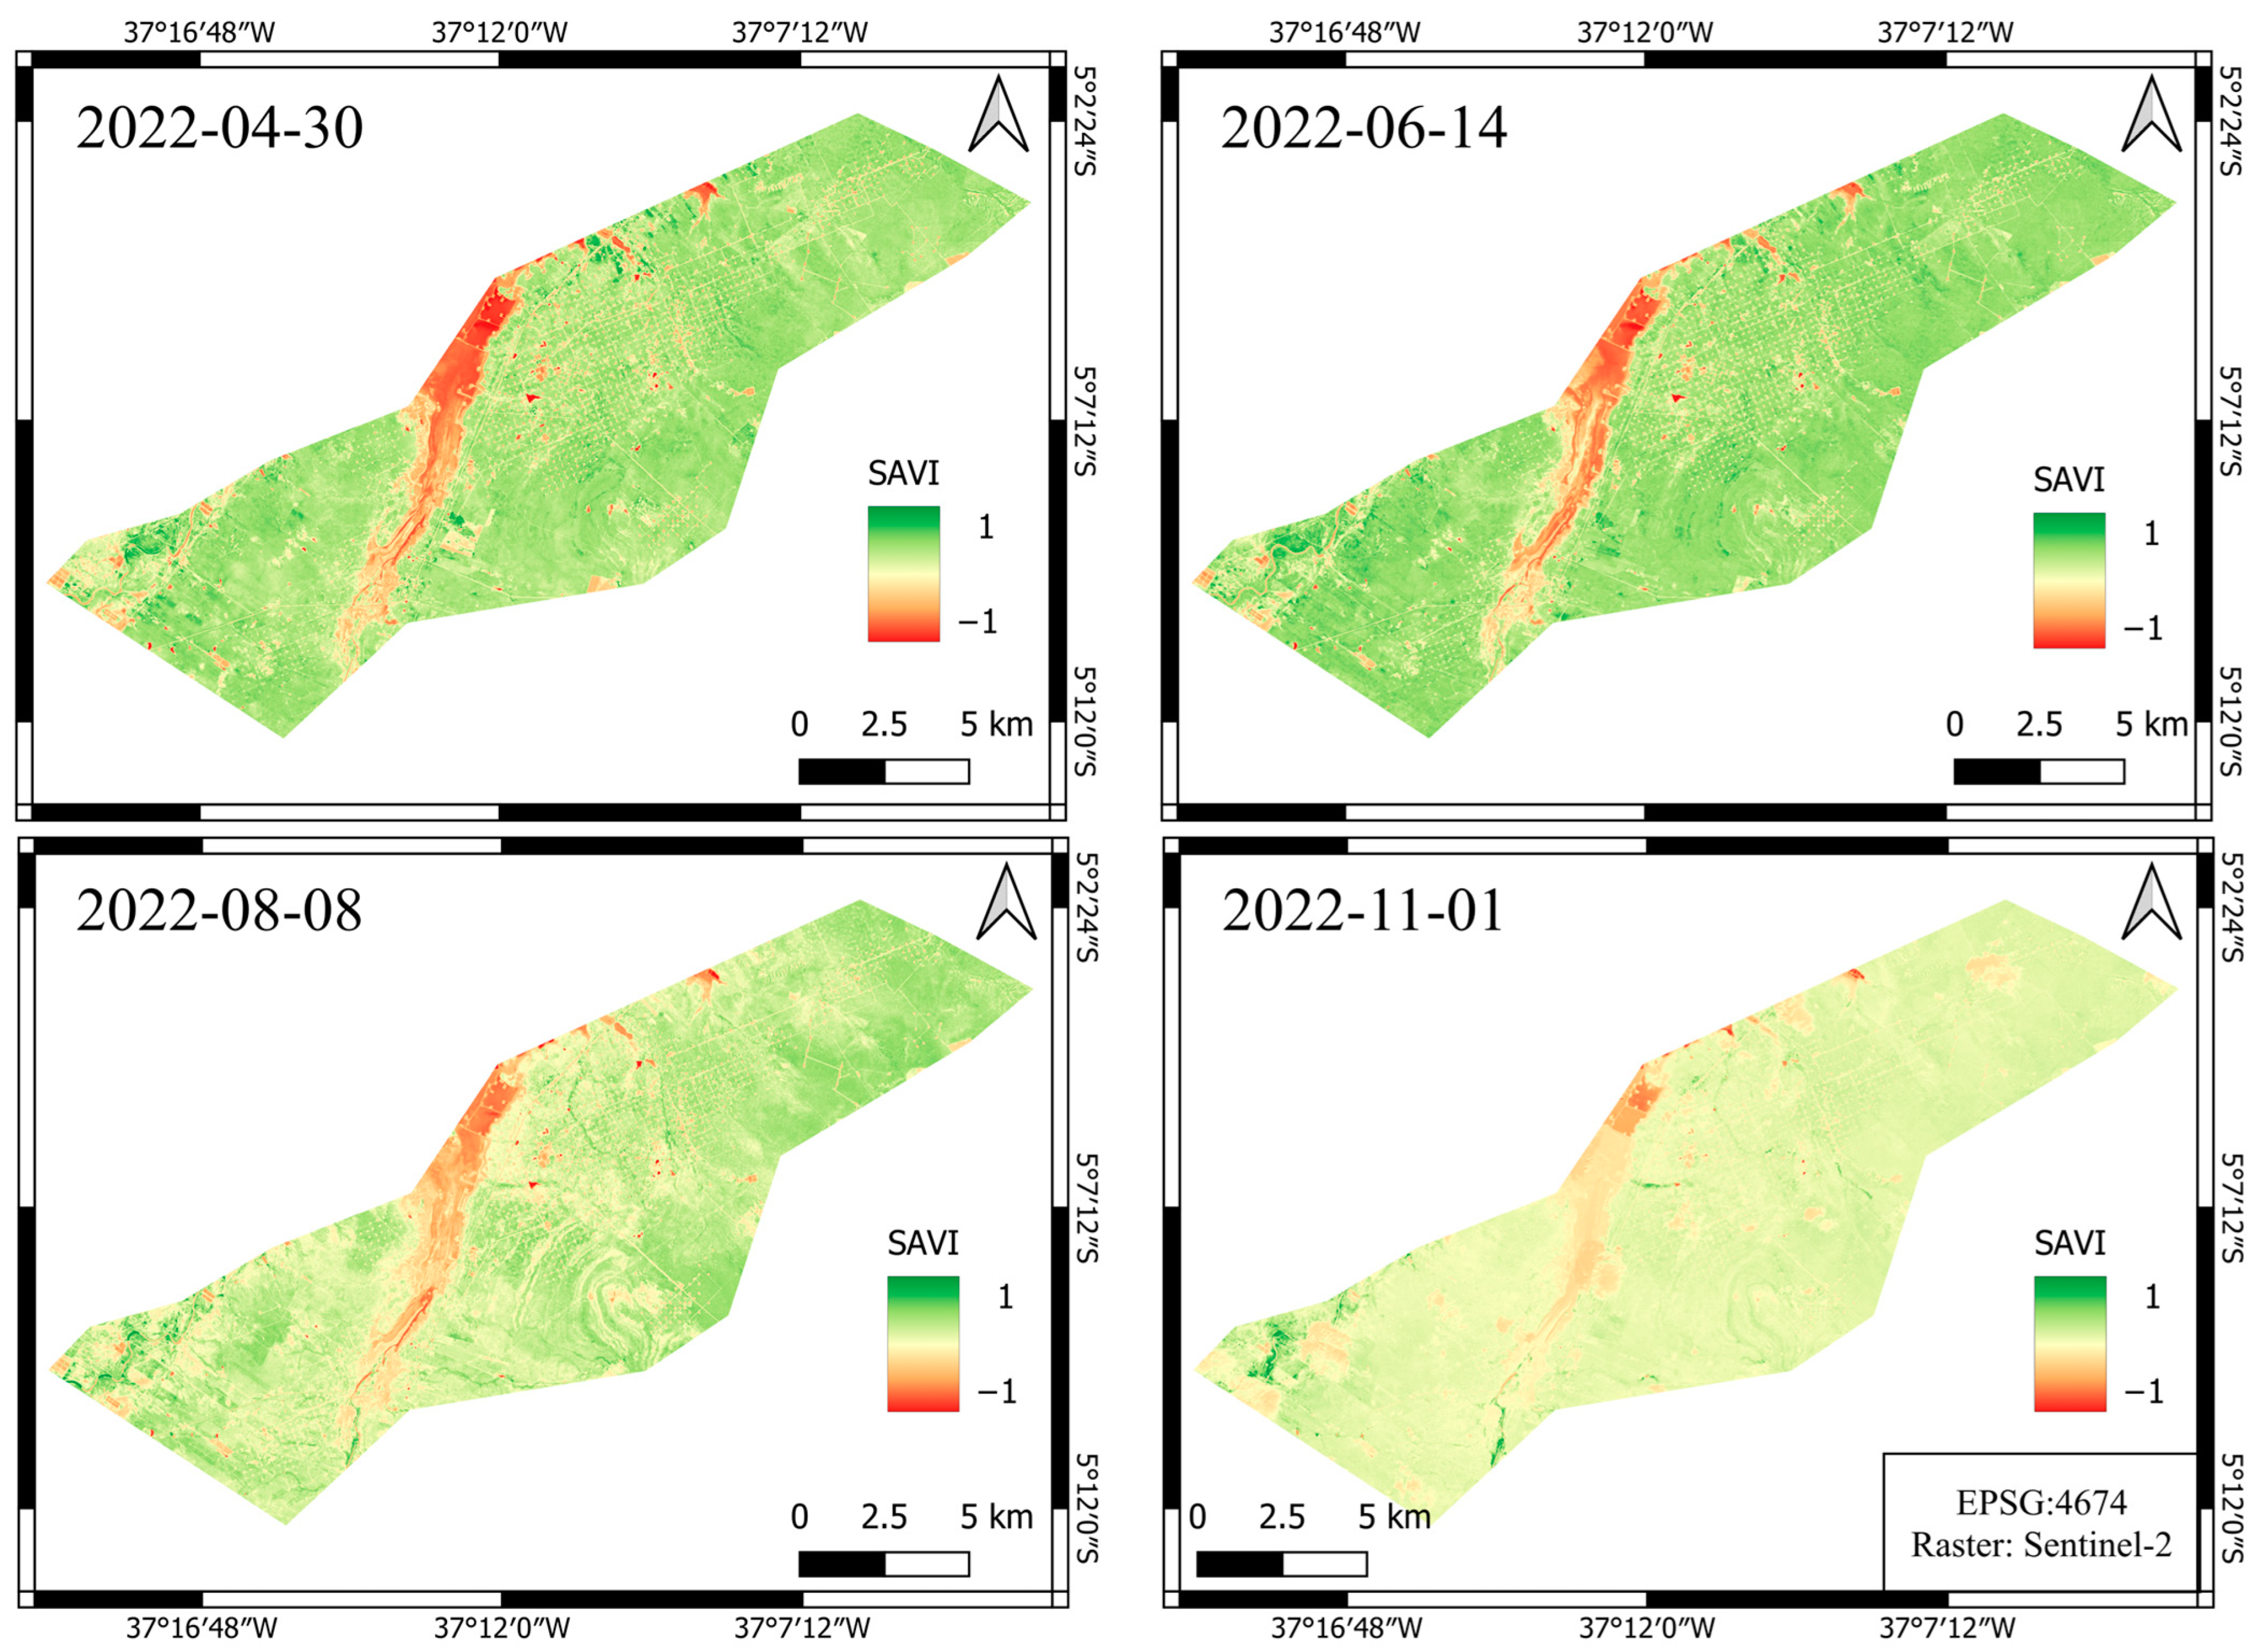
Significant variations in target backscatter are observed over the temporal series, attributed to both the sensor’s characteristics and the considerable seasonal fluctuations in vegetation biomass content within the Caatinga biome [
21]. The temporal analysis of the soil-adjusted vegetation index (SAVI) using Sentinel-2 data, which minimizes soil interference in vegetation assessment [
37] and serves as an indicator of biomass content [
38], has enabled the identification of significant variation in the index values between rainy and dry periods (
Figure 7). The SAVI index ranges from −1 to 1, where negative values mean water presence, values nearing 1 denote abundant vegetation, and those nearing zero means minimal to no vegetation cover [
38]. The data suggest the seasonal fluctuation of Caatinga vegetation within the CAM, demonstrating substantial changes in vegetation cover in between seasons, which may result in data coherence reduction and consequently the number of PSs can decrease or even disappear. In
Figure 7, data were employed from outside the temporal range to illustrate the fluctuation in vegetation within the study area. This decision-making was made due to the challenge of acquiring cloud-free Sentinel-2 images during the rainy periods (January to April) of 2020 and 2021.
4.2. Deformation Data Analysis
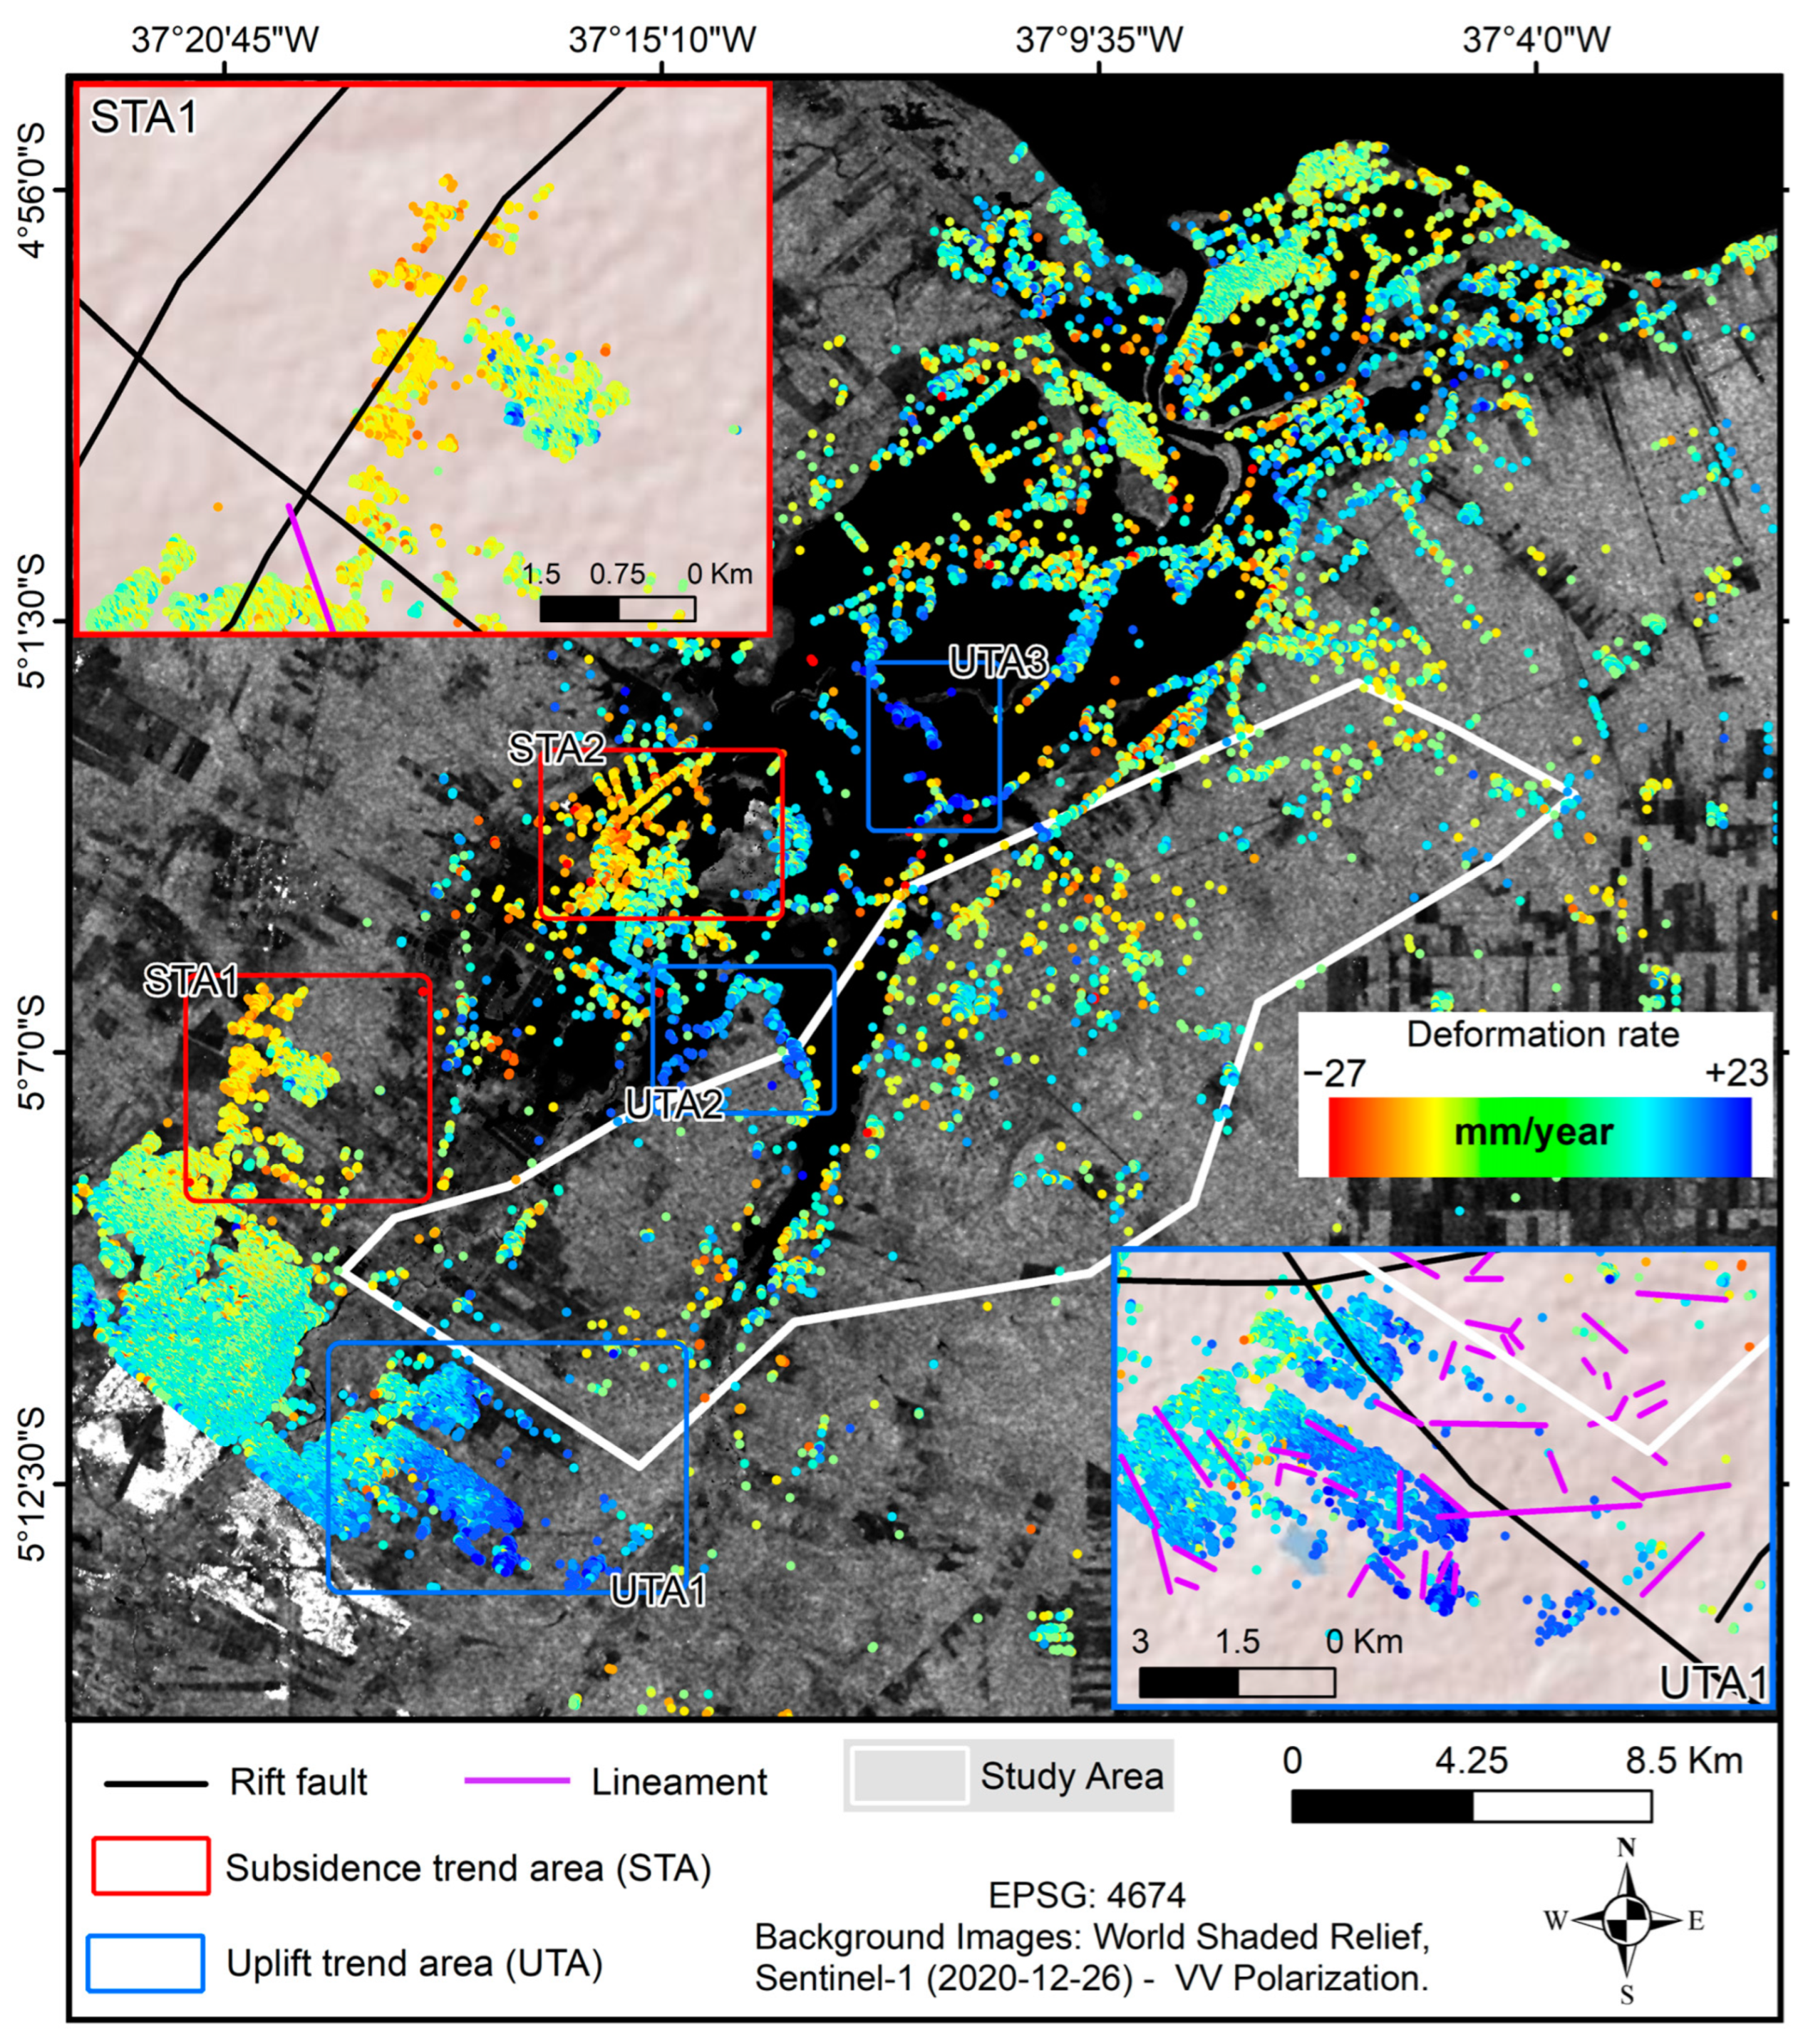
A low density of persistent points is observed within the polygon corresponding to the study area, revealing a significant contrast between deformational data in the region and the quantities of data generated in surrounding areas (
Figure 8). These variations in point density may be associated with differences in the stability of target backscattering in both regions. Regions characterized by dense clusters of civil constructions, such as Mossoro City, demonstrate targets with limited temporal variation in backscattering. Consequently, these targets exhibit consistent and intense responses over time, contributing to increase the persistent scatterer point density [
7]. However, the opposite scenario occurs in the Canto do Amaro area, which is covered by the Caatinga biome. In this area, the radar sensor’s resolution and penetration capabilities lead to fluctuations in target scattering across temporal series, resulting in a decreased presence of persistent scatterers (PSs).
Persistent scatterer (PS) points exhibit deformation velocities along the satellite line-of-sight direction ranging from −27 mm/year to 23 mm/year. According to the deformation patterns observed in the
Figure 8, some of the higher subsidence values are clustered in two regions highlighted as red polygons, referred to as subsidence trend areas (STA).
In the STA1, situated in the northern region of Mossoro-RN municipality, PS values demonstrate a geospatial correlation of this deformational locale with rift faults [
32]. The deformational data pertaining to STA2, and its adjacent areas are intrinsically linked to surface modifications resulting from anthropogenic activities, as these regions are hubs for shrimp farming and salt extraction practices.
The groupings of persistent points displaying the most substantial rates of uplift are outlined as blue polygons in
Figure 8 and are labeled as uplift trend areas (UTA). Positioned near Mossoro-RN municipality, UTA1 exhibits a notable concentration of deformation points nearing the upper boundary of uplift (23 mm/year). Correlation with structural lineaments trending is observed in the area. Additionally, the PSs identified within UTA1 are positioned approximately 700 m away from the confluence of two rift faults [
32].
UTA2 is located along a water resource margin, and the uplift rates in this region may be governed by the erosional and sedimentary dynamics inherent to such environments. The persistent scatterer points of UTA3 are geospatially situated within a region known for its salt extraction operations. Therefore, the deformational data in this area might be connected to the dynamics of surface changes driven by the activities of the establishments located there.
Canto do Amaro Deformation Analysis
The PSs encompassed within the study polygon (white polygon in
Figure 8) exhibit maximum rates of subsidence and uplift velocities in LOS of −20.93 mm/year and 14.63 mm/year, respectively. The distribution pattern of deformational data conforms to a normal distribution, with its peak centered around the mean velocity of −0.191 mm/year. The 5th and 95th percentiles are −5.50 mm/year and 4.95 mm/year, respectively, as depicted in
Figure 9. In this manner, the values identified at persistent points suggest that, overall, deformational velocities in Canto do Amaro were relatively low throughout the analyzed period. This statement is founded on the observation that 90% of the data fall within the subsidence and uplift range of −5.5 mm/year and 4.95 mm/year, respectively.
Given the sparse distribution of persistent points within the study area’s polygon (
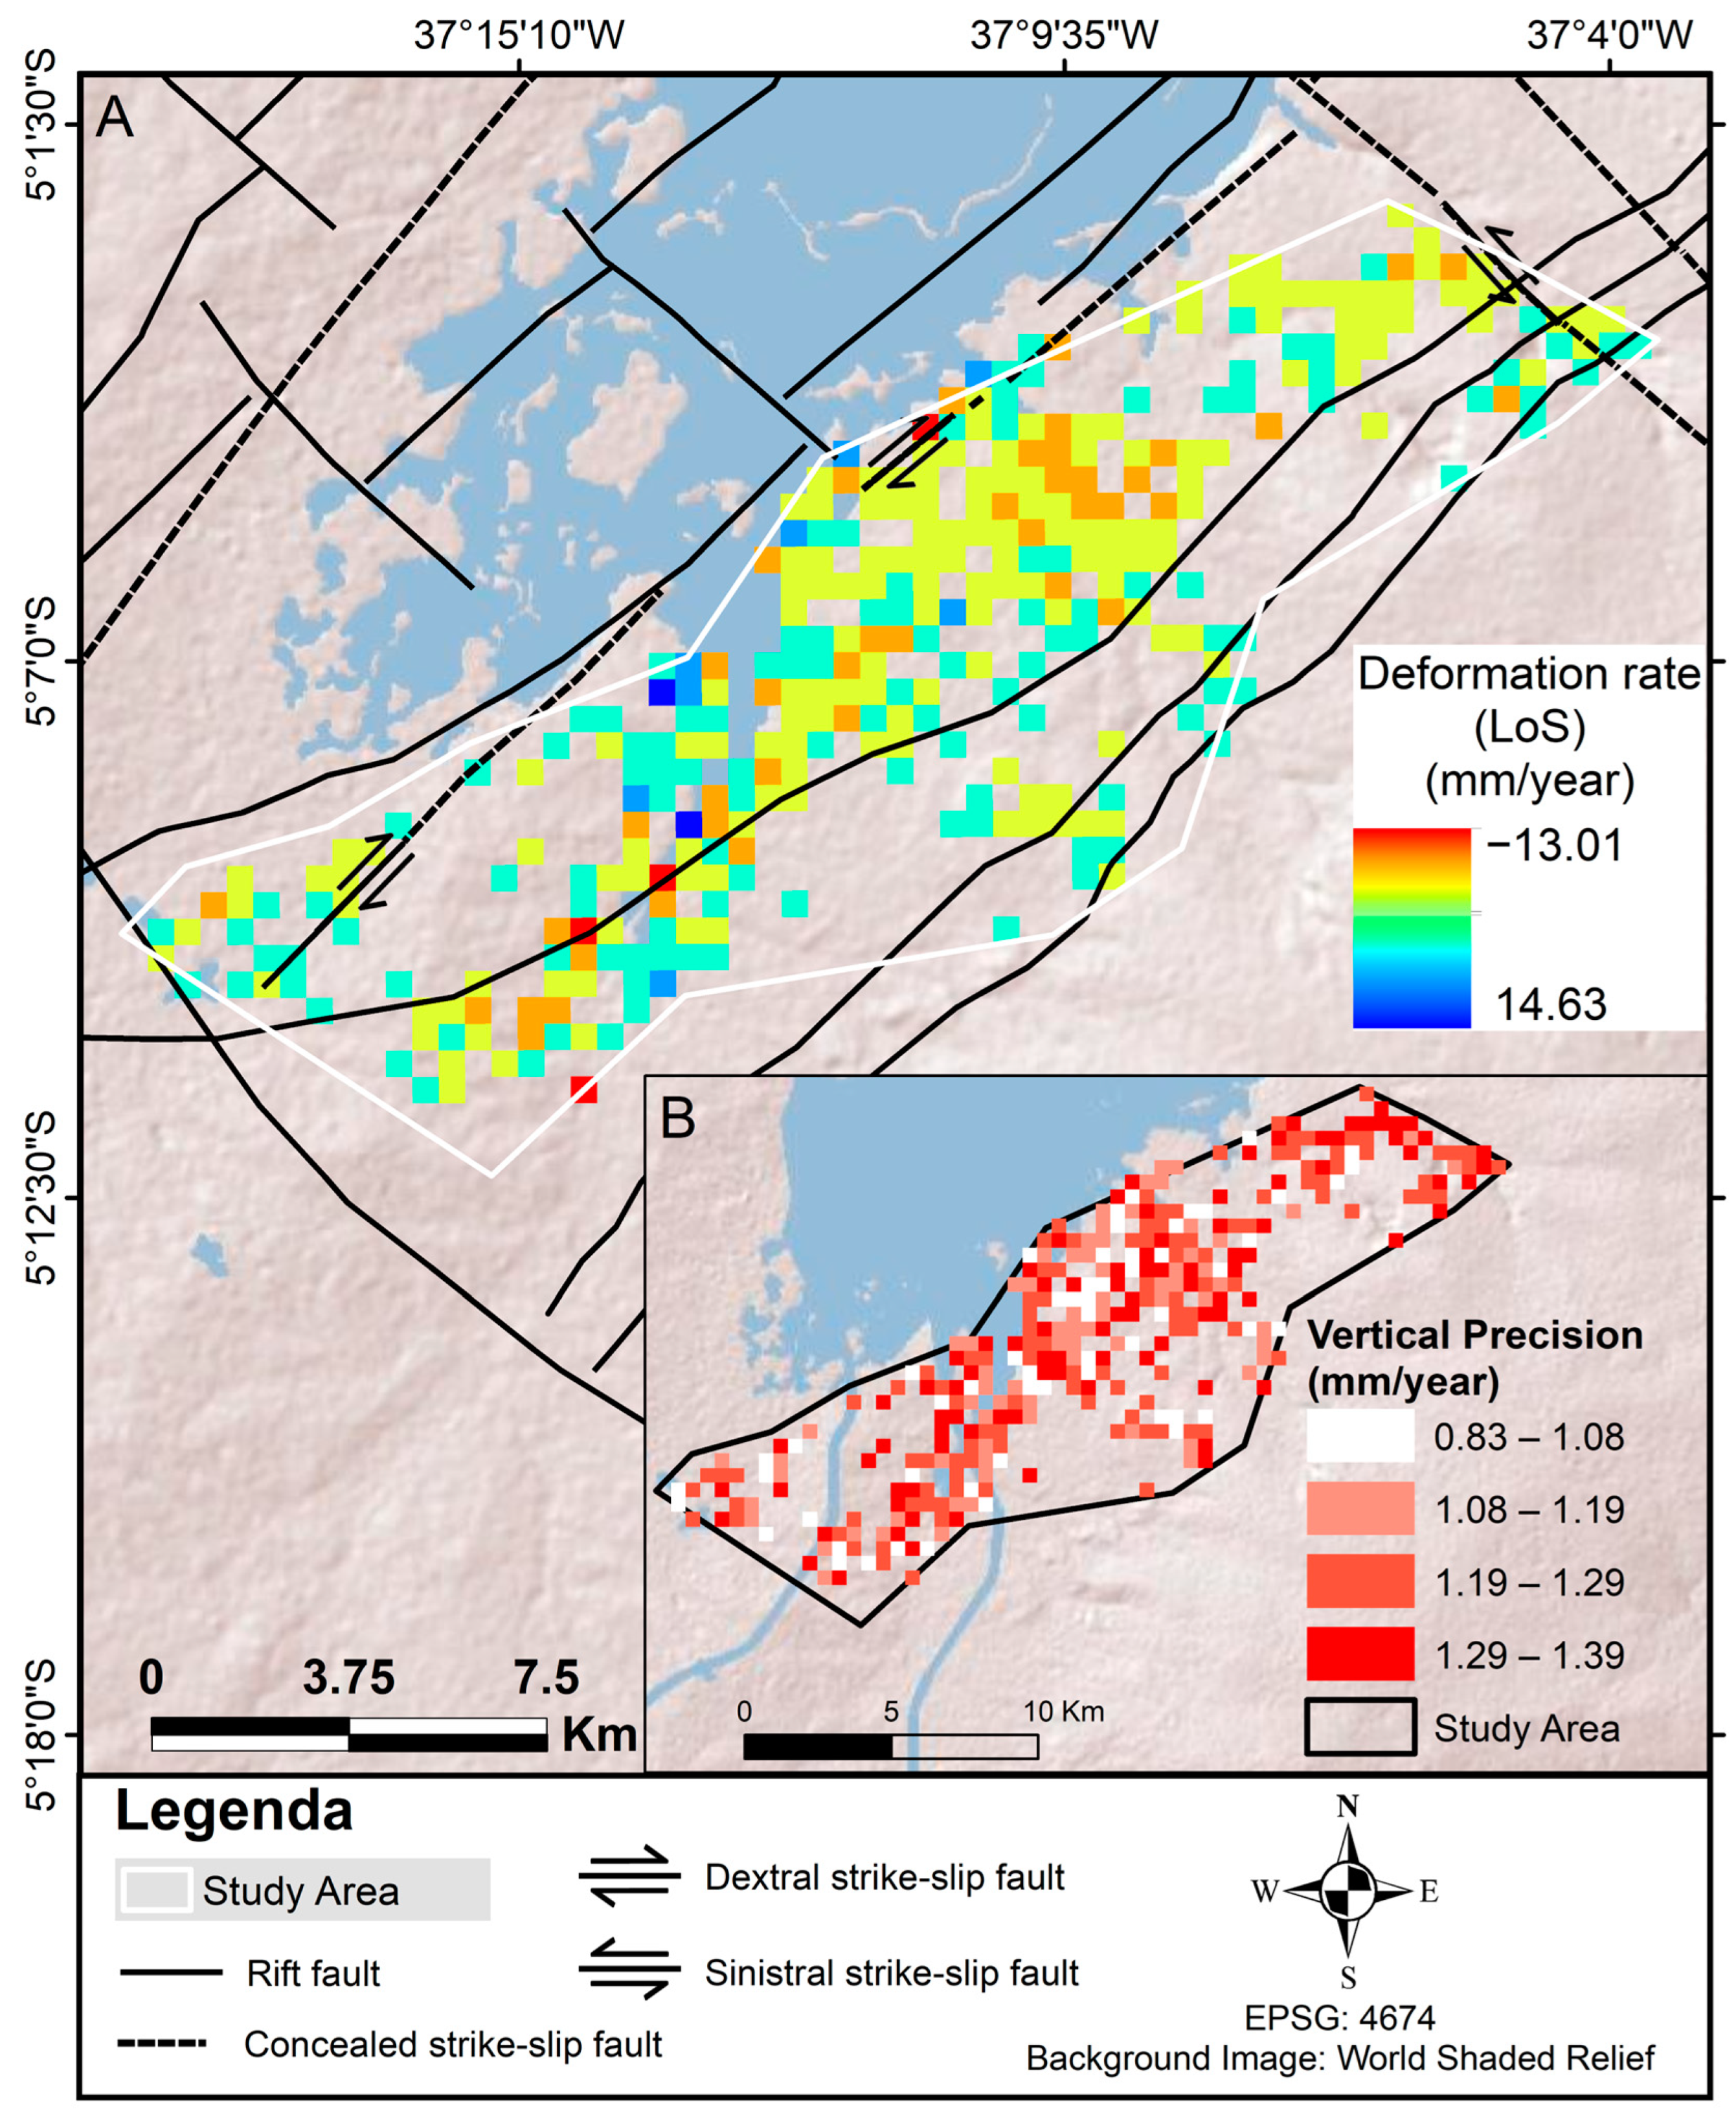
Figure 8), deformation analysis of the Canto do Amaro region was also performed based on the mean velocity values of PS points inserted into 500 × 500 m grids. The zone-based analysis provided a synoptic perspective of the data (
Figure 10A), revealing variations in deformation velocity, oscillating between −13.01 mm/year and 14.63 mm/year, with an average velocity of −0.65 mm/year. The vertical accuracy of the data varies from 0.83 mm/year to 1.39 mm/year, with the least accurate measurements observed in areas characterized by dense vegetation cover and along the margins of water resources (
Figure 10B).
The upper boundaries of subsidence and uplift, highlighted in the
Figure 10A as red and blue grids, are respectively linked to areas bordering water resources. In this manner, while there is a geospatial correlation between certain deformational areas and geological structures, it is apparent that extreme deformation values are fundamentally associated with sedimentation and erosion processes along water body margins.
Thus, upon excluding deformation points susceptible to influences from variations in areas along water margins, there is an alteration in the deformation range within the study area to −8.61 mm/year to 9.40 mm/year. Consequently, these results highlight low deformation rates in Canto do Amaro between 23 July 2020 and 21 December 2021.
Considering the low deformation rates observed during the analyzed period, a qualitative evaluation of deformation was undertaken, as areas with subsidence or uplift processes. Based on the mean deformation value per grid, roughly 61.25% of the deformational dataset relates to subsidence movements (
Figure 11). In such manner, the study area was delimited by subsidence (SUB) and uplift (UP) accumulation areas, represented in
Figure 11 by red and blue polygons, respectively.
SUB1 is situated within the alluvial channel deposits (N4ac), marine-fluvial deposits (N34fm), and the biomicrites from Jandaira Formation (K2jbm). This region is close to the area marked as STA1 in
Figure 8, indicating a zone where subsidence processes occur. These surface subsidence processes could potentially be related to the movements across the rift and transcurrent faults positioned nearby this area. SUB2 and SUB3 cover predominantly the ancient alluvial deposits (N3a) and demonstrate a dense network of subsidence deformation vectors, indicating a block-lowering trend in these areas. These two subsidence areas are bordered by dextral strike-slip and rift faults, exhibiting a similarly structural context as observed in SUB1.
Regarding uplifting processes, UP1 displays a gathering of vectors characterized by this phenomenon (
Figure 11), positioning itself at the interface between the lithologies of the Jandaíra Formation (K2jbm), alluvial channel deposits (N4ac), and the ancient alluvial sedimentary deposits (N3a). The uplifting zone UP1 exhibits geospatial correlation with geological structures; furthermore, this area lies adjacent to the uplifting UTA1 zone (
Figure 8), positioned within the eastern sector of Mossoro municipality. On the other hand, UP2 is positioned near the margins of water resources. As a result, surface elevation movements in UP2 can be affected by sedimentation dynamics, leading to potentially ambiguous deformational data.
4.3. Geospatial Statistic Production Analysis
The surface deformation was also analyzed in accordance with the geospatial correlation and the wells’ production data. Utilizing the quantitative data associated with each analysis grid, the correlation between deformational averages, the mean and sum statistics of water, gas, and oil production were derived, as highlighted in
Table 2 and
Table 3. For this purpose, the Pearson correlation matrix was applied, providing insights into the degree of linear correlation between pairs of quantitative variables. In the Pearson correlation matrix, values of −1 and 1 indicate, respectively, a perfect negative correlation and perfect positive correlation, while 0 suggests no correlation between the variables [
39].
In this manner, as noted in
Table 2, the average deformational velocity values and the sum of oil, water, and gas production per grid demonstrate low correlation values. The correlation coefficient between the mean deformational values of PS and the total oil production per grid is 0.02. This result indicates that locally there is no interdependence between the highest surface deformation velocities and the grids with the highest accumulations of oil production. Similarly, the water and gas production sums do not exhibit linear associations with the deformational means, considering the correlation values of −0.09 and 0.06, respectively.
There is a moderate positive correlation of 0.41 between the accumulation of gas and oil production per grid. Furthermore, the correlation matrix of the
Table 2 reveals a strong positive association of 0.75 between the sums of oil and water productions per grid. This outcome indicates a notable trend of simultaneous growth in the accumulated values of oil and water production, suggesting a potential interdependence between these variables.
The correlations between the production and deformation mean values (
Table 3) demonstrate similar results to those obtained for the analyses regarding the sum of productions. Thus, there is no strong association between the zones with the highest production means and the areas with the highest values of deformations mean. The linear decorrelation between the parameters is evidenced by the low values obtained in the Pearson correlation matrix. As demonstrated in
Table 3, the correlation results are approximately 0.04, −0.08, and 0.05 for oil, water, and gas production, respectively.
In contrast, there is a positive correlation of 0.89 between the gas and oil mean production, suggesting a strong trend of simultaneous linear increase between the gas and oil production mean values. There is a moderate positive correlation of 0.27 between the average water and oil production, suggesting a moderate tendency for simultaneous increase between the water and oil production mean values.
5. Discussion
The low values of interferometric coherence may be associated with the spatial resolution and the frequency of the Sentinel-1A sensor (C-band), which has low penetration in canopies due to its wavelength [
40]. Changes in surface and vegetation content negatively influence the interferometric coherence value, causing temporal decorrelation [
40,
41], consequently reducing the number of persistent points. Therefore, the presence of vegetation from the Caatinga biome, which exhibits high seasonal variability of biomass [
21], combined with the limited penetration and resolution of the Sentinel-1 sensor, has negatively influenced the stability of backscattering over time.
The use of sensors with higher spatial resolutions in future works could enable the acquisition of persistent points in the areas of suppressed vegetation where the producing wells are installed. Moreover, the utilization of sensors with longer wavelengths, such as those in L-bands, offers an alternative for analyses with increased PS density in the CAM, given the superior response of this wavelength in vegetated areas [
42].
The deformational data obtained for the CAM region demonstrate deformation velocities ranging from −20.93 mm/year to 14.63 mm/year, with the maximum peaks of uplift and subsidence, this behavior can be caused by erosion and sedimentation processes along water resource margins associated to rainy season as well. (
Figure 9). Furthermore, the mean velocity per grid reveals deformation rates ranging from −8.61 mm/year to 9.40 mm/year if quadrants with noisy points (areas near water resources) are eliminated. This deformation rate shows be lower when compared to deformational findings from other studies conducted in oil fields areas [
3,
43,
44].
Although oil and gas production processes might be the primary instigators of subsidence and uplift events in petroleum fields [
3]. However, the production data in CAM did not exhibit geospatial association with surface deformation during the investigated period. This finding was based on the analysis of correlation coefficients between grids containing deformation and production information. Hence, the low correlation values depicted in
Table 2 and
Table 3 imply a negligible relationship between productive and deformational variables. Therefore, over the period from July 2020 to December 2021, production in the CAM wells does not appear to be correlated with the occurrence of abrupt deformational events.
However, the deformation vectors indicate a geospatial correlation with geological structures, with clusters of subsidence and uplift vectors occurring in regions covered by rift fault and strike-slip faults (
Figure 10). The Northeast of Brazil has one of the most seismically active areas in South America, with most seismic activity occurrences near the PB [
45]. Thus, these findings suggest a relationship between surface movements and tectonic mechanisms. Recent studies similarly correlate deformational events to the movement or reactivation of geological structures in other oil and gas production areas [
46,
47].
6. Conclusions
This study demonstrated the potentials and limitations of the PS technique using Sentinel-1 data by applying it to the deformation monitoring of the onshore oil field of Canto do Amaro—RN. Using 42 Sentinel-1 images captured between 23 July 2020 and 21 December 2021, the deformation velocity in the sensor’s line of sight within the study area was accurately determined at the millimeter scale.
The PSI technique offered a comprehensive overview of surface movement processes in the Canto do Amaro region. Nevertheless, the PSI processing result in a low deformation point density in areas overlapped by Caatinga vegetation, due to volumetric decorrelation. In this manner, the reduced quantity of persistent points stemmed from the low resolution and signal penetration of the Sentinel-1 sensor.
The LOS deformation velocity maps predominantly depict the presence of low deformation velocities within the study area. The most significant deformation rates are observed in the areas adjacent to water resources, suggesting that the highest deformations are linked to the erosive and sedimentary processes typical of these environments.
The analysis of public data on water, gas, and oil production in the CAM did not reveal direct geospatial associations with peak deformation zones. Statistical analysis of these data highlights that there is no interdependence between the zones of highest production in the CAM and the areas of pronounced deformation.
The structural geology data indicate a geospatial correlation between rift and transcurrent faults with the deformation vectors of subsidence and uplift. Thus, the deformational data generated for the CAM area suggest geospatial correlations between certain uplift and subsidence events driven by tectonic movements.
In future research endeavors, it is suggested to use SAR sensors with longer wavelengths, such as L-band radars, allowing for the increased penetration of microwave signals in vegetated areas. Employing sensors with longer wavelengths could offer increased point density in the shrubby Caatinga-covered regions, thereby enhancing deformation analysis in these areas. The study analyzed two years of Sentinel-1; it would be interesting to investigate a longer survey taking in account the oil exploitation data available. The use of GNSS geodetic and/or topographic levelling data could be interesting for numeric validation of the deformation measurements, which was not available in our test site during this research. Moreover, the use of sensors with enhanced spatial resolution could provide better densities of persistent points in clear-cut regions, where production wells are situated. Additionally, it is suggested to analyze and correlate fluid injection data with deformational information in the CAM.

 ,
, 


