Editorial

Towards an Integrated Global Land Cover Monitoring and Mapping System

1
Laboratory of Geo-Information Science and Remote Sensing, Wageningen University, Droevendaalsesteeg 3, 6708 PB Wageningen, The Netherlands
2
Ecosystem Services and Management Program, International Institute for Applied Systems Analysis (IIASA), Schlossplatz 1, 2361 Laxenburg, Austria
*
Author to whom correspondence should be addressed.
Remote Sens. 2016, 8(12), 1036; https://doi.org/10.3390/rs8121036
Submission received: 9 December 2016 / Revised: 9 December 2016 / Accepted: 13 December 2016 / Published: 20 December 2016
(This article belongs to the Special Issue Validation and Inter-Comparison of Land Cover and Land Use Data)

Abstract

:
Global land cover mapping has evolved in a number of ways over the past two decades including increased activity in the areas of map validation and inter-comparison, which is the main focus of this Special Issue in Remote Sensing. Here we describe the major trends in global land cover mapping that have occurred, followed by recent advances as exemplified by the papers in the Special Issue. Finally, we consider what the future holds for global land cover mapping.

1. Trends in Global Land Cover Mapping

Global-scale land cover provides essential information for policy development and scientific applications such as climate modeling, food security, carbon assessment, biodiversity and environmental modeling [1]. Global-scale land cover mapping has therefore been of interest to many researchers over the last two decades. After the initial attempts at producing a global land cover (GLC) map at a one degree resolution using remote sensing [2], a number of different medium-resolution (300–1000 m) GLC maps have been developed [3,4,5,6]. This has, in turn, led to the production of integrated or hybrid maps [7,8], which are based on exploiting the strengths of individual GLC maps. With continued advancements in remote sensing data and technology, more GLC maps are currently being produced. Here we summarize the trends in available GLC maps with respect to spatial, thematic and temporal properties, along with their accuracy assessments and user considerations.
In the last five years, at least 14 GLC maps have been produced, which accounts for more than half of the currently available GLC products. Figure 1 summarizes the trends in the production of GLC maps over the last two decades.

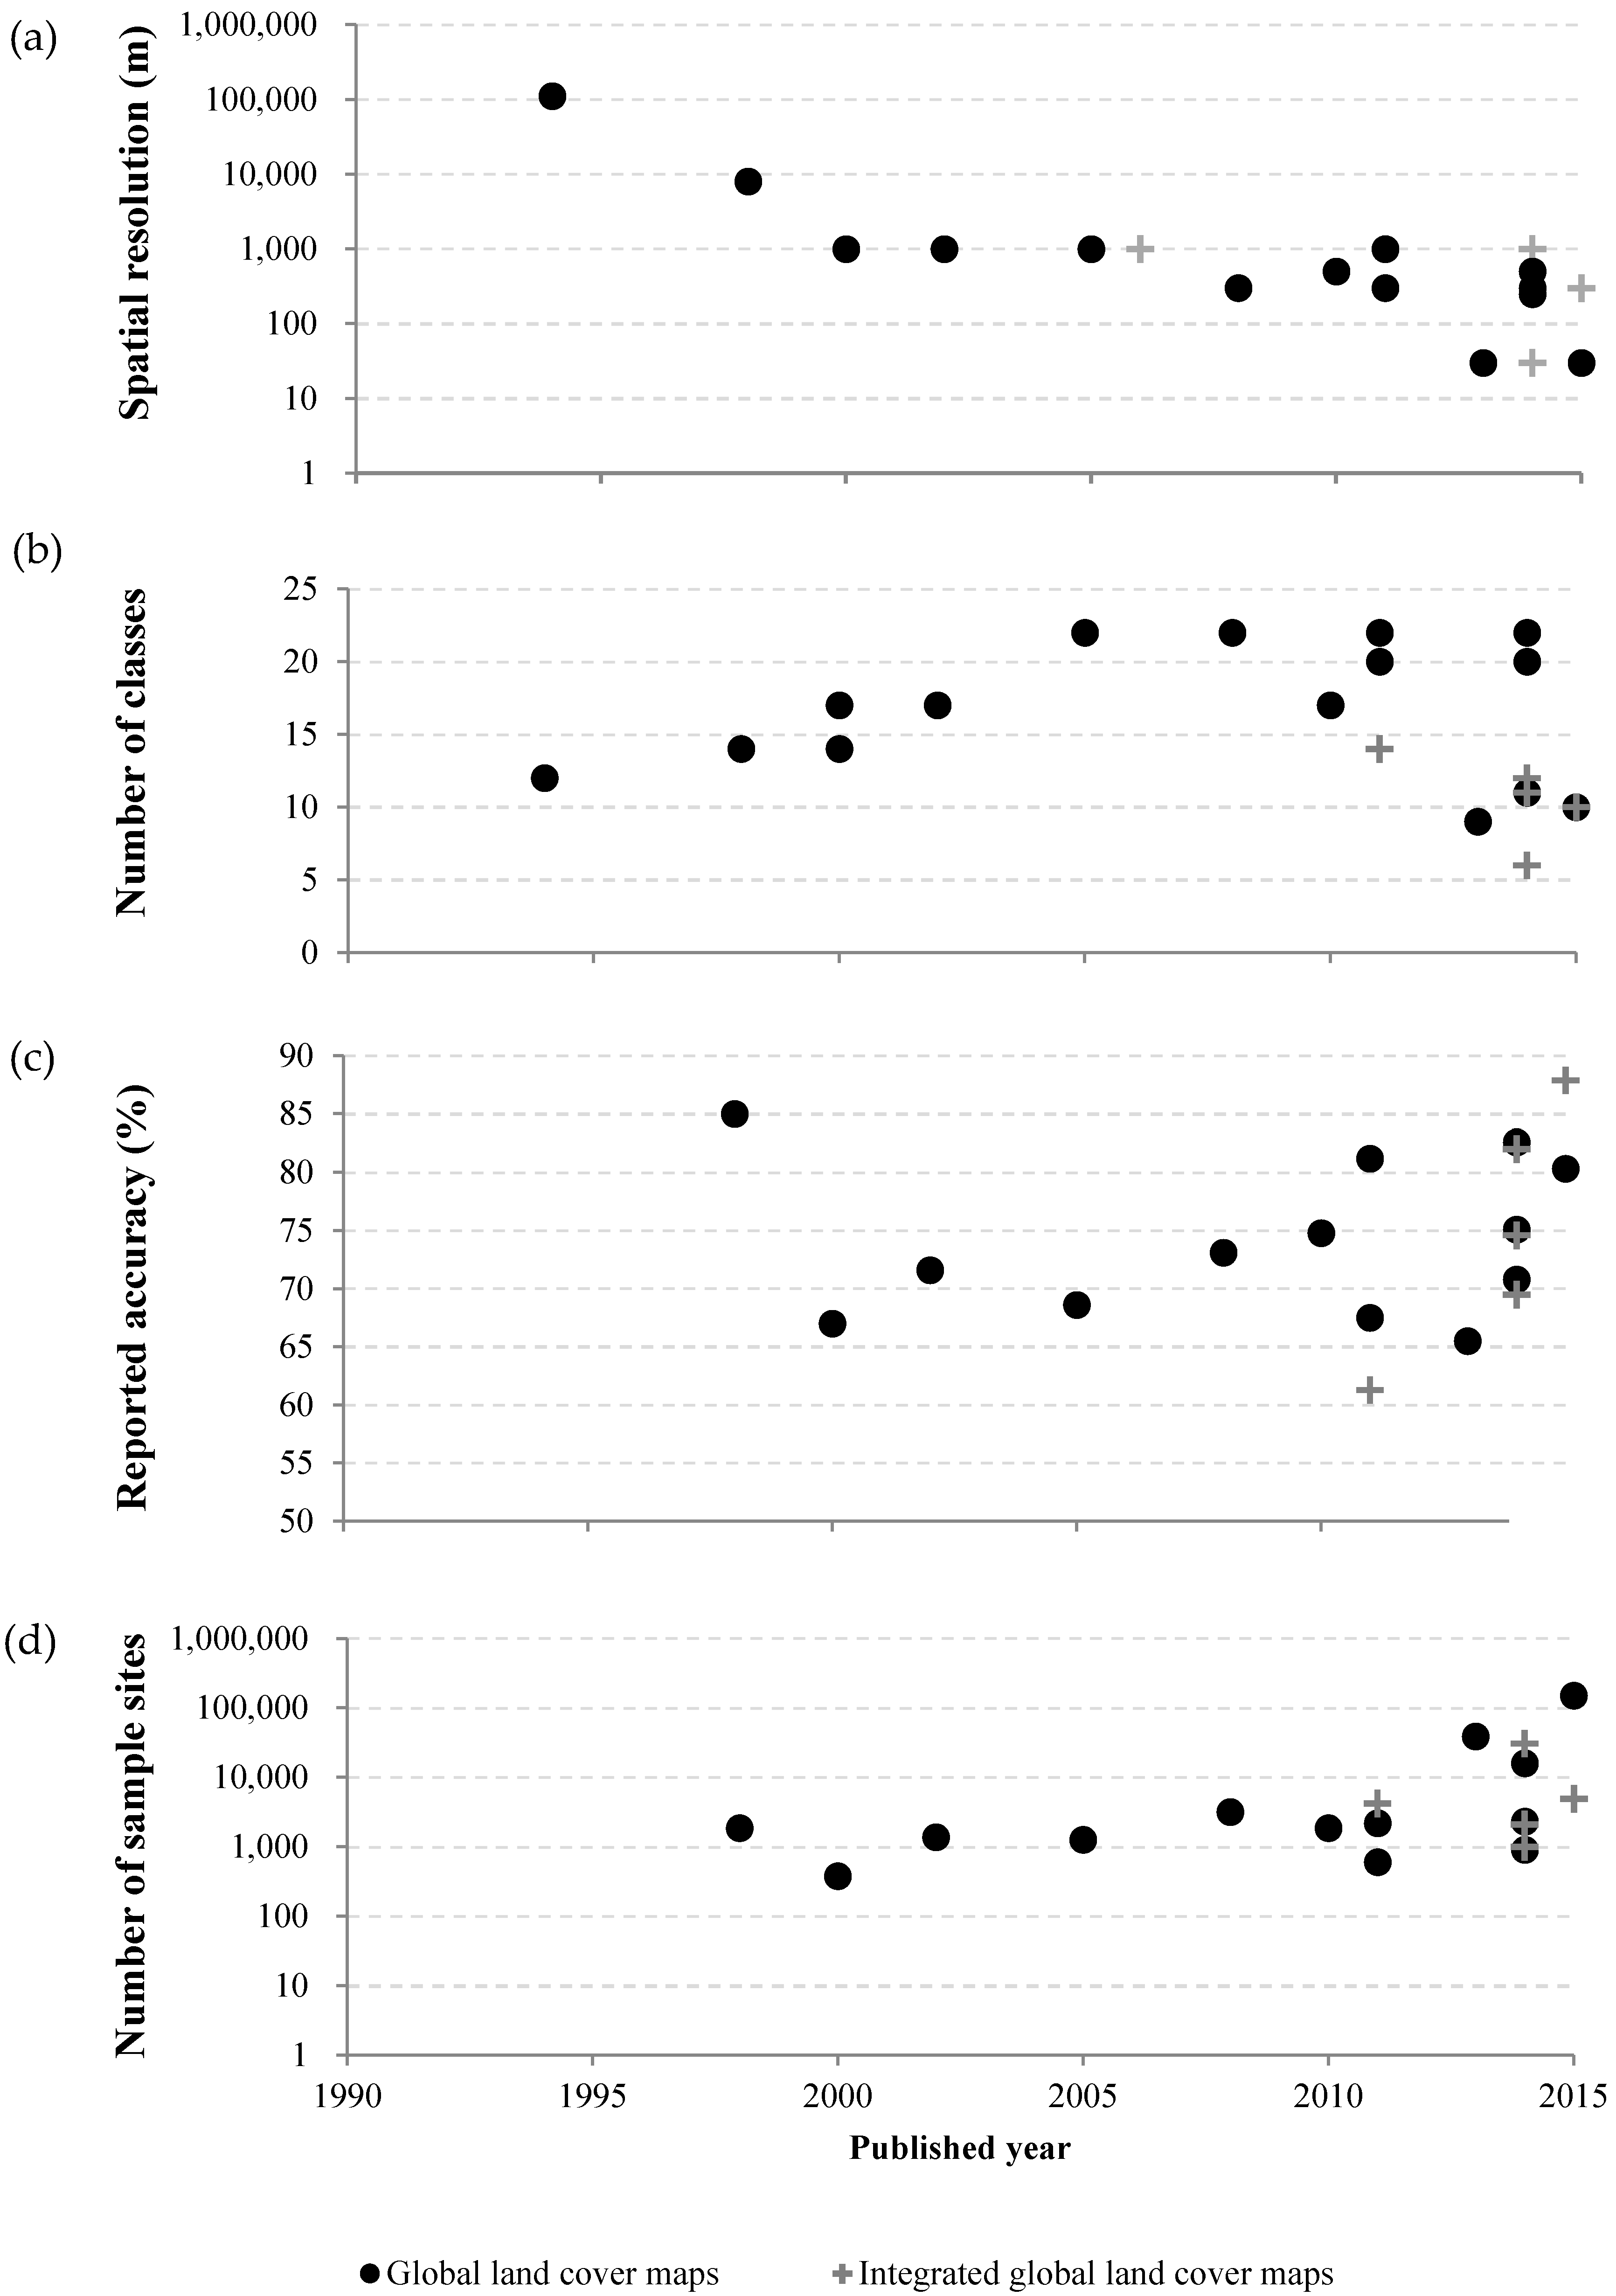
1.1. Progressing towards Higher Resolution in GLC Mapping

As can be seen from Figure 1a, which shows the spatial resolution of GLC maps with respect to their published year, there is a clear a trend in GLC maps being produced at a higher resolution. Open satellite archives have played an important role in this trend, in particular the release of the Landsat archive, which has led to high-resolution (i.e., 30 m) GLC maps such as FROM-GLC and Globeland30 [9,10]. The developments in large data processing and storage have also contributed to producing higher spatial resolution GLC maps with relative ease.
Furthermore, medium-resolution times series data continue to play a significant role in GLC mapping due to their high temporal frequency and their ability to characterize vegetation phenology [11]. Such mapping efforts tend to use multiple years of data rather than a single year to avoid the inter-annual variability in land cover conditions [6]. Progress in the time series analysis of medium- and high-resolution satellite data underpins “faster” map production processes and will eventually allow near-real-time updating to land cover mapping.

1.2. Land Cover Classification System (LCCS) as the Main Language for the Characterization of Land Cover Classes

In terms of thematic detail, the number of land cover classes characterized in GLC maps increased until 2010 (Figure 1b). The first GLC maps were produced with different classification schemes, which resulted in map comparison problems due to differences in legend definitions [12,13]. This issue has been addressed through the joint harmonization efforts of international communities such as the FAO (Food and Agriculture Organization of the United Nations) and GOFC-GOLD (Global Observation for Forest Cover and Land Dynamics) [14]. As a result, the Land Cover Classification System (LCCS) developed by FAO has been suggested as a common land cover language for building land cover legends [15]. Joint harmonization activities have been conducted to translate the legends of GLC maps in a consistent way using LCCS [14,16]. These activities have shaped the thematic representation of more recent GLC maps since many are now using LCCS-based legends. Figure 1b also shows two diverging trends in the number of mapped classes since 2011 as medium-resolution GLC maps continue to have more detailed thematic information (20–22 classes), while more recent spatial resolution maps and integrated maps tend to have fewer land cover classes.
More recently, the EAGLE (EIONET Action Group on Land Monitoring in Europe where EIONET is European Environmental Information and Observation Network) concept has been proposed [17], which is to some degree similar to LCCS but is more rigid in the differentiation between land cover and land use and promotes the mapping of continuous attributes rather than specific, defined classes.

1.3. Broader and Denser Temporal Coverage for GLC Mapping

Figure 1 refers to the published year of the GLC maps rather than their target years. In terms of target year, apart from the maps generated around the year 1993, GLC maps are mostly focused on LC representation in 2000, 2005 and 2010. Ongoing progress is being made to create GLC maps for the year 2015 as well as historically for 1990 [18]. The Global Land Cover Facility (GLCF) and the Land Cover-Climate Change Initiative (LC-CCI) projects also provide GLC maps on an annual basis. With continued progress in time series analyses, near-real-time updates in land cover mapping are also foreseen in the near future.

1.4. Independent Map Validation Has Become Commonplace

The accuracy of earlier GLC maps such as the map produced by the University of Maryland [19] was not assessed, but over the last 15 years, accuracy assessment has become commonplace. This is the result of the joint efforts of international communities such as the GOFC-GOLD and the CEOS WGCV (Committee on Earth Observation Satellites Working Group on Calibration and Validation) to promote independent map validation [20]. As part of such joint efforts, community consensus on protocols for good practices regarding map validation has been published [21,22], and these protocols have been followed in subsequent map validation activities. In addition to the use of a validation dataset independent from the calibration datasets, accuracy assessment efforts should be conducted by an institution/entity that is not included in the mapping activities.
In terms of reported map accuracies (Figure 1c), except for the 8-km-resolution map of DeFries, et al. [2], who reported an overall accuracy range of 81.4% to 90.3%, the maps produced before 2011 have a reported accuracy of around 70%–75% (Figure 1c). Maps produced since 2011 have accuracies ranging from 61% to 87%. Including the integrated GLC maps, at least six maps were reported to have an overall accuracy of 80% or more. This could suggest a slight increasing trend in the reported accuracy (Figure 1c). However, considering the progress made in satellite data acquisition, new sensors and improved algorithms, this increase is not significant. Map validation activities have also focused on assessing maps from the perspective of map users [12,23] as well as on investigation of the spatial variation in GLC map accuracies [7,8]. Note that the reported accuracies of the GLC maps (Figure 1c) are not directly comparable due to differences in thematic detail and validation strategies utilized such as the reference sample size and the accuracy calculation, e.g., the employment of the area weighted accuracy.

1.5. Reference Data Collection: Community and Crowd Together

Figure 1d shows the number of reference sample sites used for assessing the accuracy of GLC maps. With increased availability of remote sensing data, more sample sites have been used for assessing map accuracies. For example, Landsat-based GLC maps were assessed using more than 30,000 sample sites [9,10]. Crowd-based reference data collection efforts have also enabled an increase in the number of sample sites used for accuracy assessment, e.g., through initiatives such as the Degree Confluence Project, which collects reference data based on photographs and site descriptions gathered by volunteers who visit confluence points of latitude and longitude [24], and the Geo-Wiki platform, which collects global- and regional-scale reference data for LC through interpretation of satellite data or photographs by volunteers [25]. Reference data for a large number of sample sites have been collected via Geo-Wiki, which have then been used to assess global-scale maps and generate hybrid LC maps [8,26,27]. More recently, the Geo-Wiki platform has been extended to LACO-Wiki, which is an online land cover and land use validation platform and aims at creating a community around the sharing of reference datasets globally [28]. The possibilities of using other VGI (Volunteered Geographic Information) data sources such as geo-tagged photographs and OpenStreetMap are also being tested for map validation purposes [29,30,31].
To benefit from previous efforts on reference data collection, the GLC map validation community has made some reference datasets accessible to the public through the GOFC-GOLD and International Steering Committee for Global Mapping [32,33]. The notion of making the best use of available reference datasets has been highlighted by Olofsson et al. [34] while the reusability of available reference datasets has been assessed in [35]. These accessible datasets have been further used in map calibration and validation activities [7,23].

1.6. User Engagement in GLC Mapping and Validation

As GLC maps are used for a variety of applications, the requirements and perspectives of various sets of users have been considered in the map development process. For example, the IGBP-DIScover and the LC-CCI maps have been developed taking the requirements of the climate, earth system and biogeochemical modeling communities into account [6,36]. Moreover, the MODIS Collection 5 maps was developed with five different legends to address the thematic requirements of different users [5]. Map accuracy assessment, as well as map integration, has also been conducted by taking the perspectives and needs of specific users into account [37,38,39].

2. Advances in Global Land Cover and Land Use Mapping

This Special Issue on validation and inter-comparison of land cover and land use data highlights some of the latest advances in global/regional land cover and land use mapping. The papers can be broadly divided into three areas of research: map comparison and uncertainty; data fusion; and quantification of land use and land cover change.

2.1. Map Comparison and Uncertainty

As mentioned above, there are now many GLC maps available. Thus, users are confronted with a choice regarding which product to use for their specific application. Previous research has highlighted the spatial disagreement when different GLC maps are compared with one another [12] but this issue deserves continued attention. The paper by Castilla et al. [40] finds similar patterns, i.e., when comparing four different national maps of broad forest type to assess burned areas in Canada, quite different results were obtained and the conclusion was that none of the available maps is currently good enough for applications such as carbon accounting. Moreover, the authors recognize the need to produce pixel-level uncertainty so that that it can be propagated in spatial models that use land cover as a covariate. Continuing on this theme, the paper by Quaife and Cripps [41] utilizes a Bayesian approach and a Monte Carlo sampling scheme to map the pixel-level uncertainty of the GlobCover 2009 land cover product. From a user perspective, these types of uncertainty maps provide valuable information for understanding the current limitations of GLC maps, particularly those classes and spatial locations with the highest uncertainties. Then in the paper by Montesano et al. [42], the authors demonstrated how uncertainty could be decreased in the Landsat mapping of tree cover in the Taiga-Tundra ecotone by using more accurate reference data for calibration and validation, i.e., from LiDAR and high-resolution spaceborne imagery. Better uncertainty estimates of tree cover were produced from the validation process by reducing the systematic errors. This paper also represents one of many examples of Landsat-based land cover mapping that are now appearing as a result of the opening up of the Landsat archive.

2.2. Data Fusion: Sensors and Land Cover Products

Another area where advancements in global land cover and land use mapping are taking place is in terms of data fusion, i.e., the fusion or integration of existing land cover maps [7,43] and sensor fusion [44]. In the paper by Tsendbazar et al. [7], five different integration methods were compared to create an integrated GLC map. The results showed improvements ranging from 4.5% to 13% over individual GLC maps when evaluated against a reference data set. The best result was obtained for the regression kriging method. A different set of data fusion methods were tested in the paper by Lesiv et al. [43], which showed that geographically weighted regression outperformed other methods in creating a hybrid global forest cover map, particularly in those regions where the input maps disagree. The paper by Lamarche et al. [45] outlines the development of a new global water mask at a 150 m resolution to meet the needs of European Space Agency’s (ESA) LC-CCI, integrating multiple individual radar and optical water body and auxiliary data sets. The resulting product was shown to be more accurate than the individual input datasets used in its development.
In contrast, the paper by Joshi et al. [44] is a comprehensive meta-study of 112 applications that have fused optical and radar data for land cover and land use mapping and monitoring. The authors found that the majority of applications were focused on land cover, with less than 50% of the studies addressing land use. Of those that did address land use, two-thirds considered the advantages of fusing optical and radar data, where most studies reported tangible benefits. This indicates a very promising area for future research in land use. However, it should also be noted that only five of the studies addressed land use and land cover change, so there has been more emphasis on mapping compared to land change monitoring in the recent studies of sensor fusion.

2.3. Quantification of Land Use and Land Cover Change

The monitoring of land use and land cover change is critical for understanding how different pressures on existing landscapes are evolving, and in order to be able to prevent future changes that could negatively impact the environment. The quantification of land cover and land use change is tackled in the paper by Comber et al. [46], who outline some statistical approaches for quantifying and visualizing land use and land cover transitions between multiple regions and how these might be used in the development of different land management strategies. Demonstrated using National Trust land use data in the United Kingdom, these approaches could be applied at global scales.

3. A Framework for an Integrated Land Monitoring System

Current developments in GLC mapping and monitoring are expected to progress towards more innovative and operational products in the near future. This is inevitable due to (1) the continued importance of GLC monitoring and (2) developments in technological innovations.

3.1. Land Cover Mapping in a Big Data Era

Innovative developments in satellite missions are contributing to improvements in remotely sensed data in terms of the spatial, temporal and spectral domains. The recently launched Sentinel-1 and -2 missions from the ESA now openly provide higher-resolution (10–20 m) optical and radar data with revisit times of a few days [47]. Monitoring large regions using higher-resolution (<10 m) data is foreseen with satellite missions such as SPOT-5, Rapid-Eye and Planet [48,49]. In addition, the openly accessible Landsat-8 continues to provide continuity to more than 40 years of Landsat land imaging data, and is still one of the main data sources for land monitoring. These developments in higher-resolution satellite data sources support a new era of mapping global land cover at a 10–30 m resolution. With the production of Landsat-based land cover and tree cover products [9,50], this new era has already been initiated. Furthermore, continental-scale land cover mapping based on Sentinel-1 and -2 data at 10–20 m resolution is planned as part of the LC-CCI project [18].
Many global land cover mapping activities rely largely on medium spatial resolution and high temporal resolution data as dense time series satellite data are vital for assessing intra- and inter-annual variability in land cover. The continuity of these types of satellite data is important and recent satellite developments contribute towards this aim. These include the Sentinel-3 sensor, which provides high temporal resolution optical and radar data with around 300 m spatial resolution, and the Proba-V mission, which provides daily observations of land surface and vegetation at a 100 m to 1 km resolution [51]. In addition, methodological progress in time series analyses of satellite data opens up possibilities for large-scale monitoring of land cover change and near-real-time change detection [52,53].
High spatial resolution data (e.g., Landsat and Sentinel-1 and -2) and high temporal resolution data (e.g., Sentinel-3 and Proba-V) can be integrated to provide innovative high spatial and temporal resolution data for land cover observations. However, processing global-scale data at high spatial and temporal resolutions creates major challenges in handling and analyzing these “big data”, which have volumes that are magnitudes higher than the current data volume used for GLC mapping. One of the solutions to this can be the new Data Cube architecture by Geoscience Australia and the CEOS, which stores data in “data cubes”, i.e., a time series multi-dimensional stack of spatially aligned pixels used for efficient data access and analysis [54]. These data cubes can be ingested by analysis-ready data products by space agencies with the aim to support a myriad of applications by reducing data preparation time, allowing time series stacking and analyses, and increasing the interoperability of datasets. The CEOS Data Cube infrastructure will become a commonly used free and open-source software toolset that can be set according to data user needs (e.g., spatial region, time period, data layers and grid projection).

3.2. Benefitting from Other Data Sources

With the current data-rich era of earth observation, mapping land cover at the global scale based on single sensor data is feasible to a certain extent. However, to improve GLC mapping, integrating with other data sources is beneficial. An integrated land monitoring system can therefore be created by integrating/fusing earth observation data and other datasets at different levels. This can be done with different data sources. Firstly, ancillary data sets that can help to characterize land cover at a global scale can be integrated in the chosen classification methods, e.g., biophysical parameters (e.g., Leaf Area Index, albedo), available data on water bodies, burned areas, snow area extent, and topographic data can be integrated, particularly if the ancillary datasets have a high accuracy.
Secondly, land monitoring efforts should build upon the success of two decades’ worth of experience and knowledge from GLC mapping efforts. Based on this, the focus should be on improvement in areas where the thematic accuracy of the respective maps was insufficient. At this level, the aim can be combining the individual strengths of the various land cover maps to create an improved global land cover product. Such existing land cover maps can be integrated using different strategies: (i) prior to the classification (e.g., as a mask); (ii) within the classification process (e.g., as a prior probability); and (iii) as a post-processing step (e.g., decision process based on the respective class probabilities).
Thirdly, reference datasets for land cover map calibration and validation can also be integrated in the classification algorithm to improve map quality [7,8]. Capitalizing on volunteered geographic information is also an active way of collecting large amounts of reference datasets that are based on volunteers using high-resolution satellite images, geo-tagged photographs and OpenStreetMap [29,30,31]. Data will also become available in the near future from the new EU-funded LandSense citizen observatory. With increased availability and ease in obtaining reference datasets for map calibration and the facility of analysis-ready data, specific land cover maps can be generated on demand. Map users can also integrate their available training data to fine-tune the classification, fulfilling their requirements.

3.3. Operational Mapping of Land Cover and Land Cover Change

National and international institutions have been collectively working towards continuous and operational monitoring of global land cover. For example, the Land Cover Institute of the USGS (United States Geological Survey) has been an active operational land cover agency at the national and global scale [55]. In collaboration with the GLCF research center of the University of Maryland, Landsat-based global tree cover, water and bare ground maps have been produced. The GLCF has also been active in creating GLC maps since 1998, which have been based on AVHRR (Advanced Very High Resolution Radiometer) data and, more recently, MODIS, to produce annual GLC maps [56]. The National Geomatics Center of China (NGCC) has produced Landsat-based GLC maps for 2000 and 2010 and further aim to create a GLC map for 2015 [57]. The LC-CCI project of UCL (Catholic University of Louvain) Geomatics has produced three GLC maps for the 2000–2010 period and aims to expand the temporal coverage by producing annual maps beyond this period [18]. The Copernicus Global Land Operations Lot1 (CGLOPS-1) project of the Copernicus Global Land Service aims to produce operational yearly updated GLC maps based on Proba-V 100 m resolution data [58].
The involvements of these institutions also extend to global-scale monitoring of land cover change. The global forest change database at a 30 m resolution developed by Hansen, et al. [59] is certainly a major milestone for operational monitoring of global land cover change. Differences between Globeland30 2000 and 2010 maps are being used to describe changes in cropland at a global scale [60]. Yearly GLC maps will be delivered by the LC-CCI project in December 2016, thus highlighting changes in the main land cover types [18].

Acknowledgments

This work was supported by the EU FP7 funded ERC grant CrowdLand (No. 617754), the ESA funded Land Cover_CCI (No. 4000109875/14/I-NB), the JRC funded CGLOPS1 (No. FWC199494) and the Horizon2020 LandSense (No. 689812) projects.

Author Contributions

M.H., L.S. and N.T. wrote the editorial while S.F. provided valuable suggestions and made edits to the paper.

Conflicts of Interest

The authors declare no conflicts of interest.

Abbreviations

The following abbreviations are used in this manuscript:
AVHRRAdvanced Very High Resolution Radiometer
CEOSCommittee on Earth Observation Satellites
CGLOPSCopernicus Global Land Operations
EOearth observation
ESAEuropean Space Agency
FAOFood and Agriculture Organization of the United Nations
GLCglobal land cover
GLCFGlobal Land Cover Facility
GOFC-GOLDGlobal Observation for Forest Cover and Land Dynamics
IGBPInternational Global Biosphere Project
LC-CCILand Cover-Climate Change Initiative
LCCSLand Cover Classification System
NGCCNational Geomatics Centre of China
UCLCatholic University of Louvain
WGCVWorking Group on Calibration & Validation

References

  1. Verburg, P.H.; Neumann, K.; Nol, L. Challenges in using land use and land cover data for global change studies. Glob. Chang. Biol. 2011, 17, 974–989. [Google Scholar] [CrossRef] [Green Version]
  2. DeFries, R.; Hansen, M.; Townshend, J.; Sohlberg, R. Global land cover classifications at 8 km spatial resolution: The use of training data derived from Landsat imagery in decision tree classifiers. Int. J. Remote Sens. 1998, 19, 3141–3168. [Google Scholar] [CrossRef]
  3. Bartholomé, E.; Belward, A. GLC2000: A new approach to global land cover mapping from earth observation data. Int. J. Remote Sens. 2005, 26, 1959–1977. [Google Scholar] [CrossRef]
  4. Arino, O.; Leroy, M.; Ranera, F.; Gross, D.; Bicheron, P.; Nino, F.; Brockman, C.; Defourny, P.; Vancutsem, C.; Achard, F. GlobCover—A global land cover service with MERIS. In Proceedings of the Envisat Symposium 2007, Montreux, Switzerland, 23–27 April 2007; pp. 23–27.
  5. Friedl, M.A.; Sulla-Menashe, D.; Tan, B.; Schneider, A.; Ramankutty, N.; Sibley, A.; Huang, X.M. MODIS Collection 5 global land cover: Algorithm refinements and characterization of new datasets. Remote Sens. Environ. 2010, 114, 168–182. [Google Scholar] [CrossRef]
  6. Land Cover CCI. CCI-LC Product User Guide; UCL-Geomatics: Louvain-la-Neuve, Belgium, 2014. [Google Scholar]
  7. Tsendbazar, N.E.; de Bruin, S.; Fritz, S.; Herold, M. Spatial accuracy assessment and integration of global land cover datasets. Remote Sens. 2015, 7, 15804–15821. [Google Scholar] [CrossRef]
  8. See, L.; Schepaschenko, D.; Lesiv, M.; McCallum, I.; Fritz, S.; Comber, A.; Perger, C.; Schill, C.; Zhao, Y.; Maus, V.; et al. Building a hybrid land cover map with crowdsourcing and geographically weighted regression. ISPRS J. Photogramm. Remote Sens. 2015, 103, 48–56. [Google Scholar] [CrossRef] [Green Version]
  9. Chen, J.; Chen, J.; Liao, A.; Cao, X.; Chen, L.; Chen, X.; He, C.; Han, G.; Peng, S.; Lu, M. Global land cover mapping at 30m resolution: A pok-based operational approach. ISPRS J. Photogramm. Remote Sens. 2015, 103, 7–27. [Google Scholar] [CrossRef]
  10. Gong, P.; Wang, J.; Yu, L.; Zhao, Y.; Zhao, Y.; Liang, L.; Niu, Z.; Huang, X.; Fu, H.; Liu, S.; et al. Finer resolution observation and monitoring of global land cover: First mapping results with Landsat TM and ETM+ data. Int. J. Remote Sens. 2013, 34, 2607–2654. [Google Scholar] [CrossRef]
  11. Friedl, M.A.; McIver, D.K.; Hodges, J.C.F.; Zhang, X.Y.; Muchoney, D.; Strahler, A.H.; Woodcock, C.E.; Gopal, S.; Schneider, A.; Cooper, A. Global land cover mapping from MODIS: Algorithms and early results. Remote Sens. Environ. 2002, 83, 287–302. [Google Scholar] [CrossRef]
  12. Fritz, S.; See, L. Identifying and quantifying uncertainty and spatial disagreement in the comparison of global land cover for different applications. Glob. Chang. Biol. 2008, 14, 1057–1075. [Google Scholar] [CrossRef]
  13. Fritz, S.; See, L. Comparison of land cover maps using fuzzy agreement. Int. J. Geogr. Inf. Sci. 2005, 19, 787–807. [Google Scholar] [CrossRef]
  14. Herold, M.; Mayaux, P.; Woodcock, C.E.; Baccini, A.; Schmullius, C. Some challenges in global land cover mapping: An assessment of agreement and accuracy in existing 1 km datasets. Remote Sens. Environ. 2008, 112, 2538–2556. [Google Scholar] [CrossRef]
  15. Di Gregorio, A. Land Cover Classification System: Classification Concepts and User Manual: LCCS; Food and Agriculture Organization of the United Nations: Rome, Italy, 2005. [Google Scholar]
  16. Herold, M.; Hubald, R.; Di Gregorio, A. Translating and Evaluating Land Cover Legends Using the UN Land Cover Classification System (LCCS); GOFC-GOLD Report Series, No. 43; Land Cover Project Office: Jena, Germany, 2009. [Google Scholar]
  17. Arnold, S.; Kosztra, B.; Banko, G.; Smith, G.; Hazeu, G.; Bock, M.; Valcarcel Sanz, N. The EAGLE concept—A vision of a future European land monitoring framework. In Proceedings of the 33rd EARSeL Symposium towards Horizon, Matera, Italy, 3–6 June 2013.
  18. Land Cover Climate Change Initiative. Climate Change Initiative: Land Cover Newsletter; Land Cover Climate Change Initiative: Louvain-La-Neuve, Belgium, 2016; p. 4. [Google Scholar]
  19. Hansen, M.; DeFries, R.; Townshend, J.; Sohlberg, R. Global land cover classification at 1 km spatial resolution using a classification tree approach. Int. J. Remote Sens. 2000, 21, 1331–1364. [Google Scholar] [CrossRef]
  20. Mora, B.; Tsendbazar, N.E.; Herold, M.; Arino, O. Global land cover mapping: Current status and future trends. In Land Use and Land Cover Mapping in Europe; Manakos, I., Braun, M., Eds.; Springer: Dordrecht, The Netherlands, 2014; pp. 11–30. [Google Scholar]
  21. Strahler, A.H.; Boschetti, L.; Foody, G.M.; Friedl, M.A.; Hansen, M.C.; Herold, M.; Mayaux, P.; Morisette, J.T.; Stehman, S.V.; Woodcock, C.E. Global Land Cover Validation: Recommendations for Evaluation and Accuracy Assessment of Global Land Cover Maps; European Communities: Luxembourg, 2006; Volume 51. [Google Scholar]
  22. Olofsson, P.; Foody, G.M.; Stehman, S.V.; Woodcock, C.E. Making better use of accuracy data in land change studies: Estimating accuracy and area and quantifying uncertainty using stratified estimation. Remote Sens. Environ. 2013, 129, 122–131. [Google Scholar] [CrossRef]
  23. Tsendbazar, N.E.; de Bruin, S.; Mora, B.; Schouten, L.; Herold, M. Comparative assessment of thematic accuracy of GLC maps for specific applications using existing reference data. Int. J. Appl. Earth Observ. Geoinf. 2016, 44, 124–135. [Google Scholar] [CrossRef]
  24. Iwao, K.; Nishida, K.; Kinoshita, T.; Yamagata, Y. Validating land cover maps with degree confluence project information. Geophys. Res. Lett. 2006, 33, L23404. [Google Scholar] [CrossRef]
  25. See, L.; Fritz, S.; Perger, C.; Schill, C.; McCallum, I.; Schepaschenko, D.; Duerauer, M.; Sturn, T.; Karner, M.; Kraxner, F. Harnessing the power of volunteers, the Internet and Google Earth to collect and validate global spatial information using Geo-Wiki. Technol. Forecast. Soc. Chang. 2015, 98, 324–335. [Google Scholar] [CrossRef] [Green Version]
  26. Schepaschenko, D.; See, L.; Lesiv, M.; McCallum, I.; Fritz, S.; Salk, C.; Moltchanova, E.; Perger, C.; Shchepashchenko, M.; Shvidenko, A.; et al. Development of a global hybrid forest mask through the synergy of remote sensing, crowdsourcing and fao statistics. Remote Sens. Environ. 2015, 162, 208–220. [Google Scholar] [CrossRef]
  27. Fritz, S.; See, L.; McCallum, I.; You, L.; Bun, A.; Moltchanova, E.; Duerauer, M.; Albrecht, F.; Schill, C.; Perger, C.; et al. Mapping global cropland and field size. Glob. Chang. Biol. 2015, 21, 1980–1992. [Google Scholar] [CrossRef] [PubMed] [Green Version]
  28. See, L.; Perger, C.; Hofer, M.; Weichselbaum, J.; Dresel, C.; Fritz, S. Laco-Wiki: An open access online portal for land cover validation. ISPRS Ann. Photogramm. Remote Sens. Spat. Inf. Sci. 2015, II-3/W5, 167–171. [Google Scholar] [CrossRef]
  29. Fonte, C.C.; Bastin, L.; See, L.; Foody, G.M.; Lupia, F. Usability of VGI for validation of land cover maps. Int. J. Geogr. Inf. Sci. 2015, 29, 1269–1291. [Google Scholar] [CrossRef]
  30. Antoniou, V.; Fonte, C.C.; See, L.; Estima, J.; Arsanjani, J.J.; Lupia, F.; Minghini, M.; Foody, G.M.; Fritz, S. Investigating the feasibility of geo-tagged photographs as sources of land cover input data. ISPRS Int. J. Geo-Inf. 2016, 5, 64. [Google Scholar] [CrossRef]
  31. Estima, J.; Painho, M. Exploratory analysis of openstreetmap for land use classification. In Proceedings of the Second ACM SIGSPATIAL International Workshop on Crowdsourced and Volunteered Geographic Information, Orlando, FL, USA, 5 November 2013; ACM: Orlando, FL, USA, 2013. [Google Scholar]
  32. Global Observations of Forest and Land Cover Dynamics (GOFC-GOLD). GOFC-GOLD Reference Data Portal. Available online: http://www.gofcgold.wur.nl/sites/gofcgold_refdataportal.php (accessed on 22 Octobter 2014).
  33. Tateishi, R.; Hoan, N.T.; Kobayashi, T.; Alsaaideh, B.; Tana, G.; Phong, D.X. Production of global land cover data—GLCNMO2008. J. Geogr. Geol. 2014, 6. [Google Scholar] [CrossRef]
  34. Olofsson, P.; Stehman, S.V.; Woodcock, C.E.; Sulla-Menashe, D.; Sibley, A.M.; Newell, J.D.; Friedl, M.A.; Herold, M. A global land-cover validation data set, part I: Fundamental design principles. Int. J. Remote Sens. 2012, 33, 5768–5788. [Google Scholar] [CrossRef]
  35. Tsendbazar, N.; De Bruin, S.; Herold, M. Assessing global land cover reference datasets for different user communities. ISPRS J. Photogramm. Remote Sens. 2015, 103, 93–114. [Google Scholar] [CrossRef]
  36. Loveland, T.; Reed, B.; Brown, J.; Ohlen, D.; Zhu, Z.; Yang, L.; Merchant, J. Development of a global land cover characteristics database and IGBP discover from 1 km AVHRR data. Int. J. Remote Sens. 2000, 21, 1303–1330. [Google Scholar] [CrossRef]
  37. Jung, M.; Henkel, K.; Herold, M.; Churkina, G. Exploiting synergies of global land cover products for carbon cycle modeling. Remote Sens. Environ. 2006, 101, 534–553. [Google Scholar] [CrossRef]
  38. Tuanmu, M.-N.; Jetz, W. A global 1-km consensus land-cover product for biodiversity and ecosystem modelling. Glob. Ecol. Biogeogr. 2014, 23, 1031–1045. [Google Scholar] [CrossRef]
  39. DeFries, R.; Los, S. Implications of land-cover misclassification for parameter estimates in global land-surface models: An example from the simple biosphere model (SiB2). Photogramm. Eng. Remote Sens. 1999, 65, 1083–1088. [Google Scholar]
  40. Castilla, G.; Rodrigue, S.; Skakun, R.; Hall, R. Four national maps of broad forest type provide inconsistent answers to the question of what burns in Canada. Remote Sens. 2016, 8, 539. [Google Scholar] [CrossRef]
  41. Quaife, T.; Cripps, E. Bayesian analysis of uncertainty in the GlobCover 2009 land cover product at climate model grid scale. Remote Sens. 2016, 8, 314. [Google Scholar] [CrossRef]
  42. Montesano, P.; Neigh, C.; Sexton, J.; Feng, M.; Channan, S.; Ranson, K.; Townshend, J. Calibration and validation of landsat tree cover in the taiga−tundra ecotone. Remote Sens. 2016, 8, 551. [Google Scholar] [CrossRef]
  43. Lesiv, M.; Moltchanova, E.; Schepaschenko, D.; See, L.; Shvidenko, A.; Comber, A.; Fritz, S. Comparison of data fusion methods using crowdsourced data in creating a hybrid forest cover map. Remote Sens. 2016, 8, 261. [Google Scholar] [CrossRef]
  44. Joshi, N.; Baumann, M.; Ehammer, A.; Fensholt, R.; Grogan, K.; Hostert, P.; Jepsen, M.; Kuemmerle, T.; Meyfroidt, P.; Mitchard, E.; et al. A review of the application of optical and radar remote sensing data fusion to land use mapping and monitoring. Remote Sens. 2016, 8, 70. [Google Scholar] [CrossRef]
  45. Lamarche, C.; Santoro, M.; Bontemps, S.; d’Andrimont, R.; Radoux, J.; Giustarini, L.; Brockmann, C.; Militzer, J.; Defourny, P.; Arino, O. Compilation and validation of sar and optical data sets for a complete and global map of inland/ocean water tailored to the climate modeling community. Remote Sens. 2016, in press. [Google Scholar]
  46. Comber, A.; Balzter, H.; Cole, B.; Fisher, P.; Johnson, S.; Ogutu, B. Methods to quantify regional differences in land cover change. Remote Sens. 2016, 8, 176. [Google Scholar] [CrossRef]
  47. ESA. Overview of Sentinel Satellites. Available online: http://www.esa.int/Our_Activities/Observing_the_Earth/Copernicus/Overview4 (accessed on 22 January 2016).
  48. Satellite Imaging Corporation. Rapideye Satellite Sensor (5m). Available online: http://www.satimagingcorp.com/satellite-sensors/other-satellite-sensors/rapideye/ (accessed on 5 November 2016).
  49. Marshall, W.; Boshuizen, C. Planet labs’ remote sensing satellite system. In Proceedings of the 27th Small Satellite Conference, Logan, UT, USA, 10–15 August 2013.
  50. Sexton, J.O.; Song, X.-P.; Feng, M.; Noojipady, P.; Anand, A.; Huang, C.; Kim, D.-H.; Collins, K.M.; Channan, S.; Dimiceli, C. Global, 30-m resolution continuous fields of tree cover: Landsat-based rescaling of MODIS vegetation continuous fields with lidar-based estimates of error. Int. J. Digit. Earth 2013, 6, 427–448. [Google Scholar] [CrossRef]
  51. VITO. The Proba-V Instrument. Available online: http://www.esa.int/Our_Activities/Space_Engineering_Technology/Proba_Missions/Overview2 (accessed on 3 May 2016).
  52. Zhu, Z.; Woodcock, C.E. Automated cloud, cloud shadow, and snow detection in multitemporal Landsat data: An algorithm designed specifically for monitoring land cover change. Remote Sens. Environ. 2014, 152, 217–234. [Google Scholar] [CrossRef]
  53. Verbesselt, J.; Hyndman, R.; Newnham, G.; Culvenor, D. Detecting trend and seasonal changes in satellite image time series. Remote Sens. Environ. 2010, 114, 106–115. [Google Scholar] [CrossRef]
  54. Australian Geoscience Data Cube (AGDC). Available online: http://www.datacube.org.au/ (accessed on 3 June 2016).
  55. USGS-Land Cover Institute (USGS-LCI). Land Cover Insitute. Available online: http://landcover.usgs.gov/index.php (accessed on 3 June 2016).
  56. Global Land Cover Facility. Available online: http://glcf.umd.edu/ (accessed on 3 June 2016).
  57. Jun, C.; Ban, Y.; Li, S. China: Open access to earth land-cover map. Nature 2014, 514, 434. [Google Scholar] [CrossRef] [PubMed]
  58. Copernicus Global Land Operations. Dynamic land cover: Copernicus global land service. In Proceedings of the 2016 GEO BON Open Science Conference & All Hands Meeting, Leipzig, Germany, 4–8 July 2016.
  59. Hansen, M.C.; Potapov, P.V.; Moore, R.; Hancher, M.; Turubanova, S.A.; Tyukavina, A.; Thau, D.; Stehman, S.V.; Goetz, S.J.; Loveland, T.R.; et al. High-resolution global maps of 21st-century forest cover change. Science 2013, 342, 850–853. [Google Scholar] [CrossRef] [PubMed]
  60. Wu, W.; Hu, Q.; Lu, M.; Chen, D. Framing global cropland dynamics during 2000–2010. In Proceedings of the 2016 GLP Open Science Meeting, Beijing, China, 24–27 October 2016.
Figure 1. Trends in GLC mapping: (a) spatial resolution; (b) number of classes; (c) accuracy; and (d) number of sample sites in the reference database.
Remotesensing 08 01036 g001

