Identifying Droughts Affecting Agriculture in Africa Based on Remote Sensing Time Series between 2000–2016: Rainfall Anomalies and Vegetation Condition in the Context of ENSO


Abstract
1. Introduction
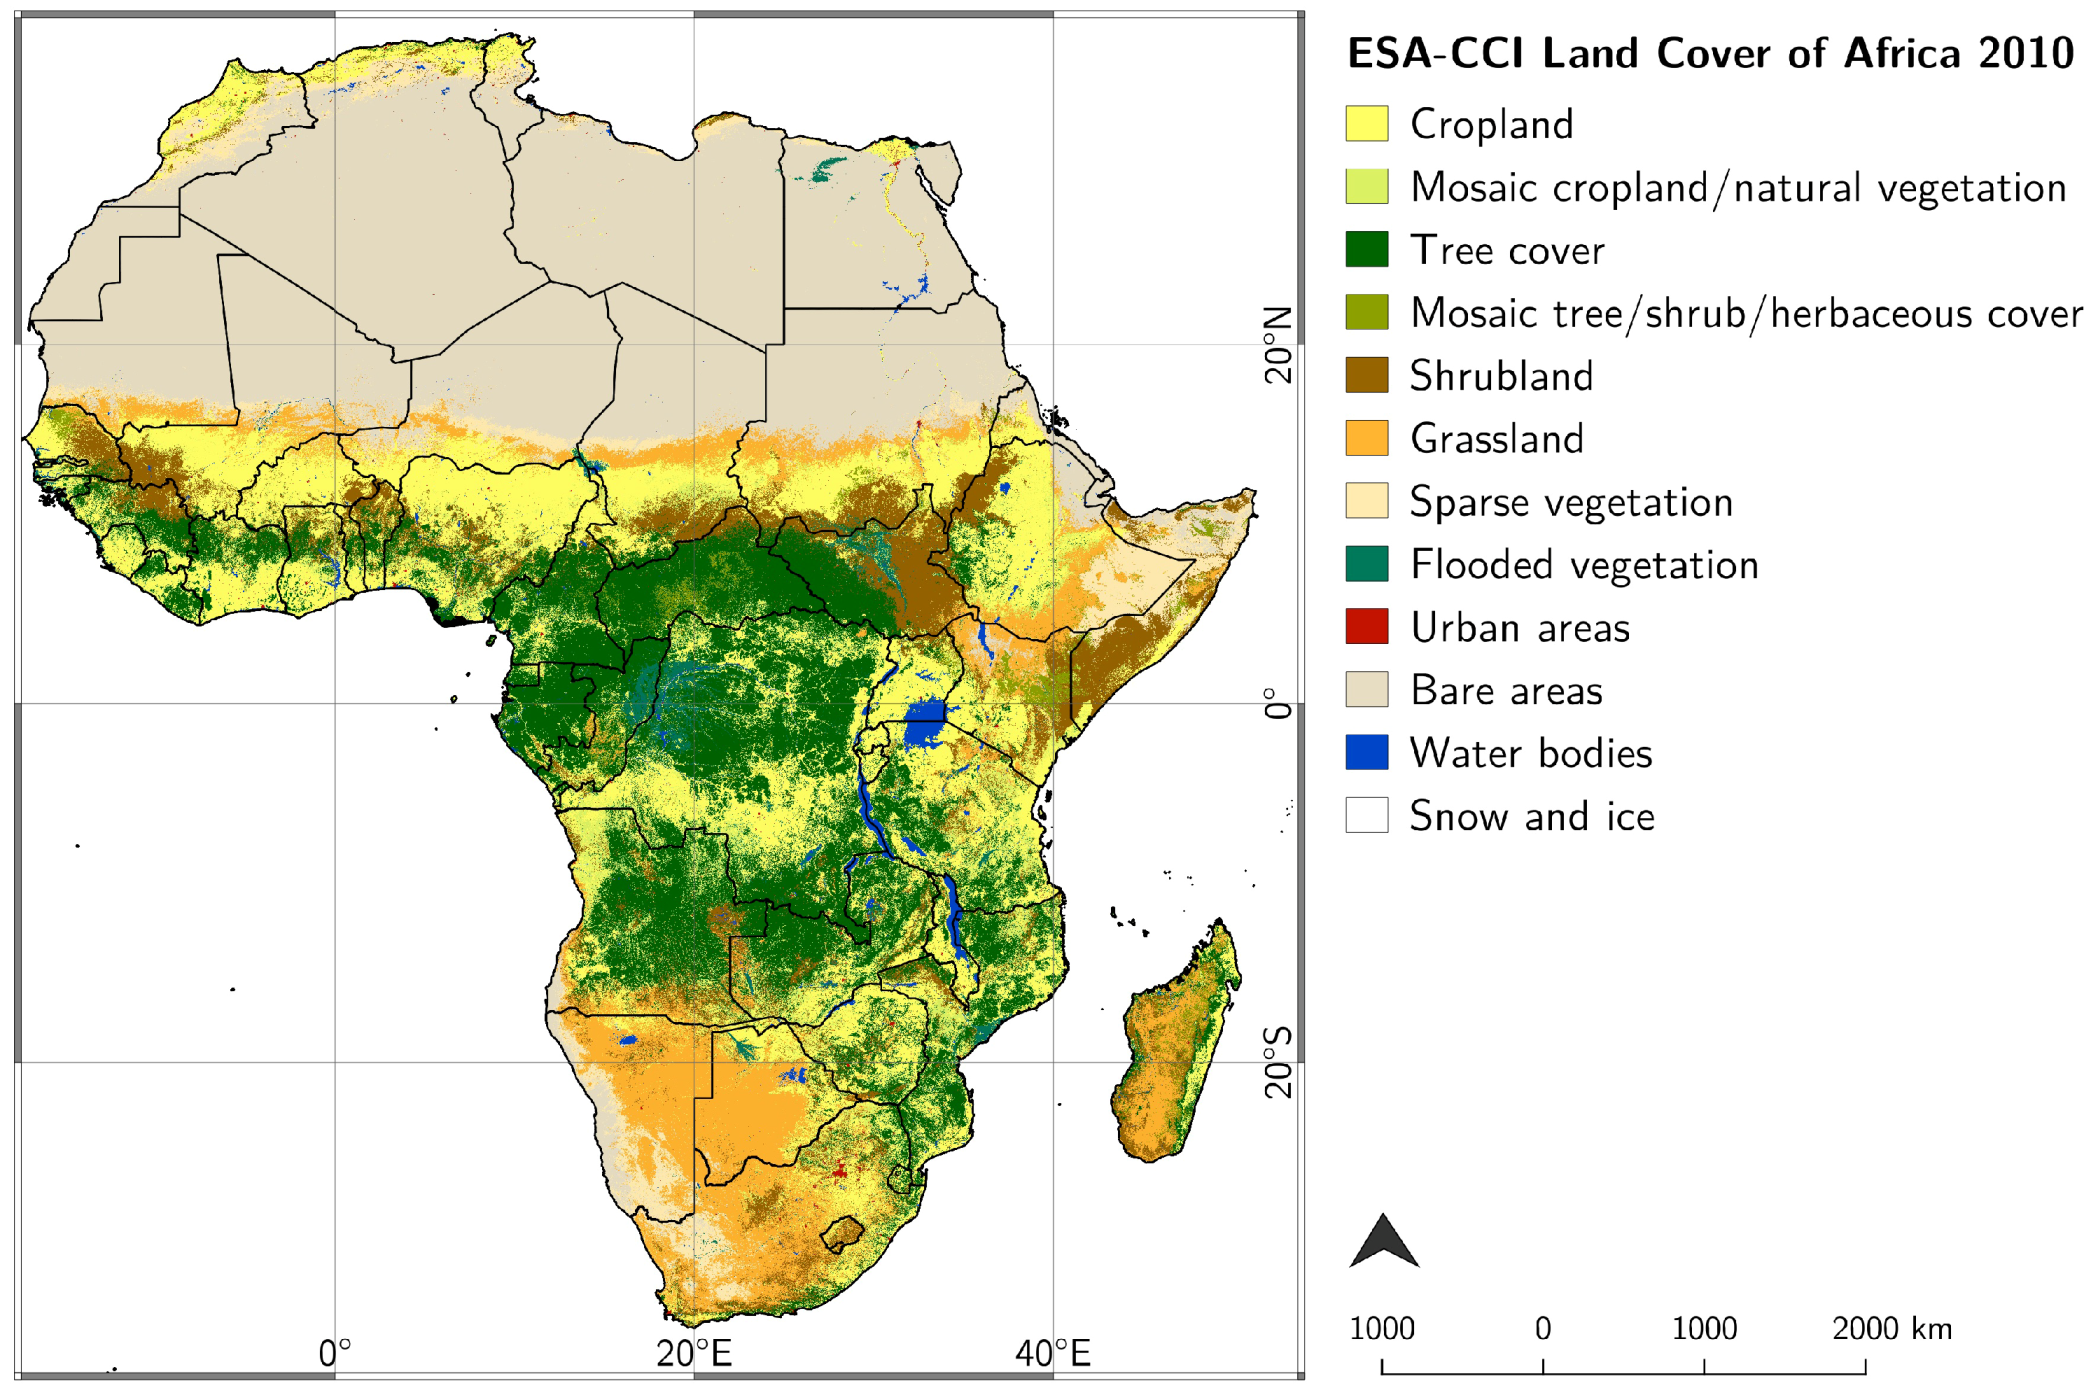
2. Study Area
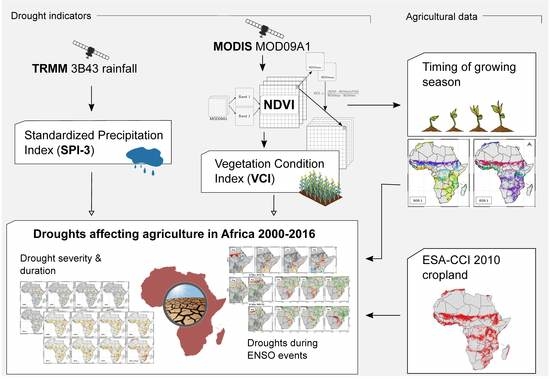
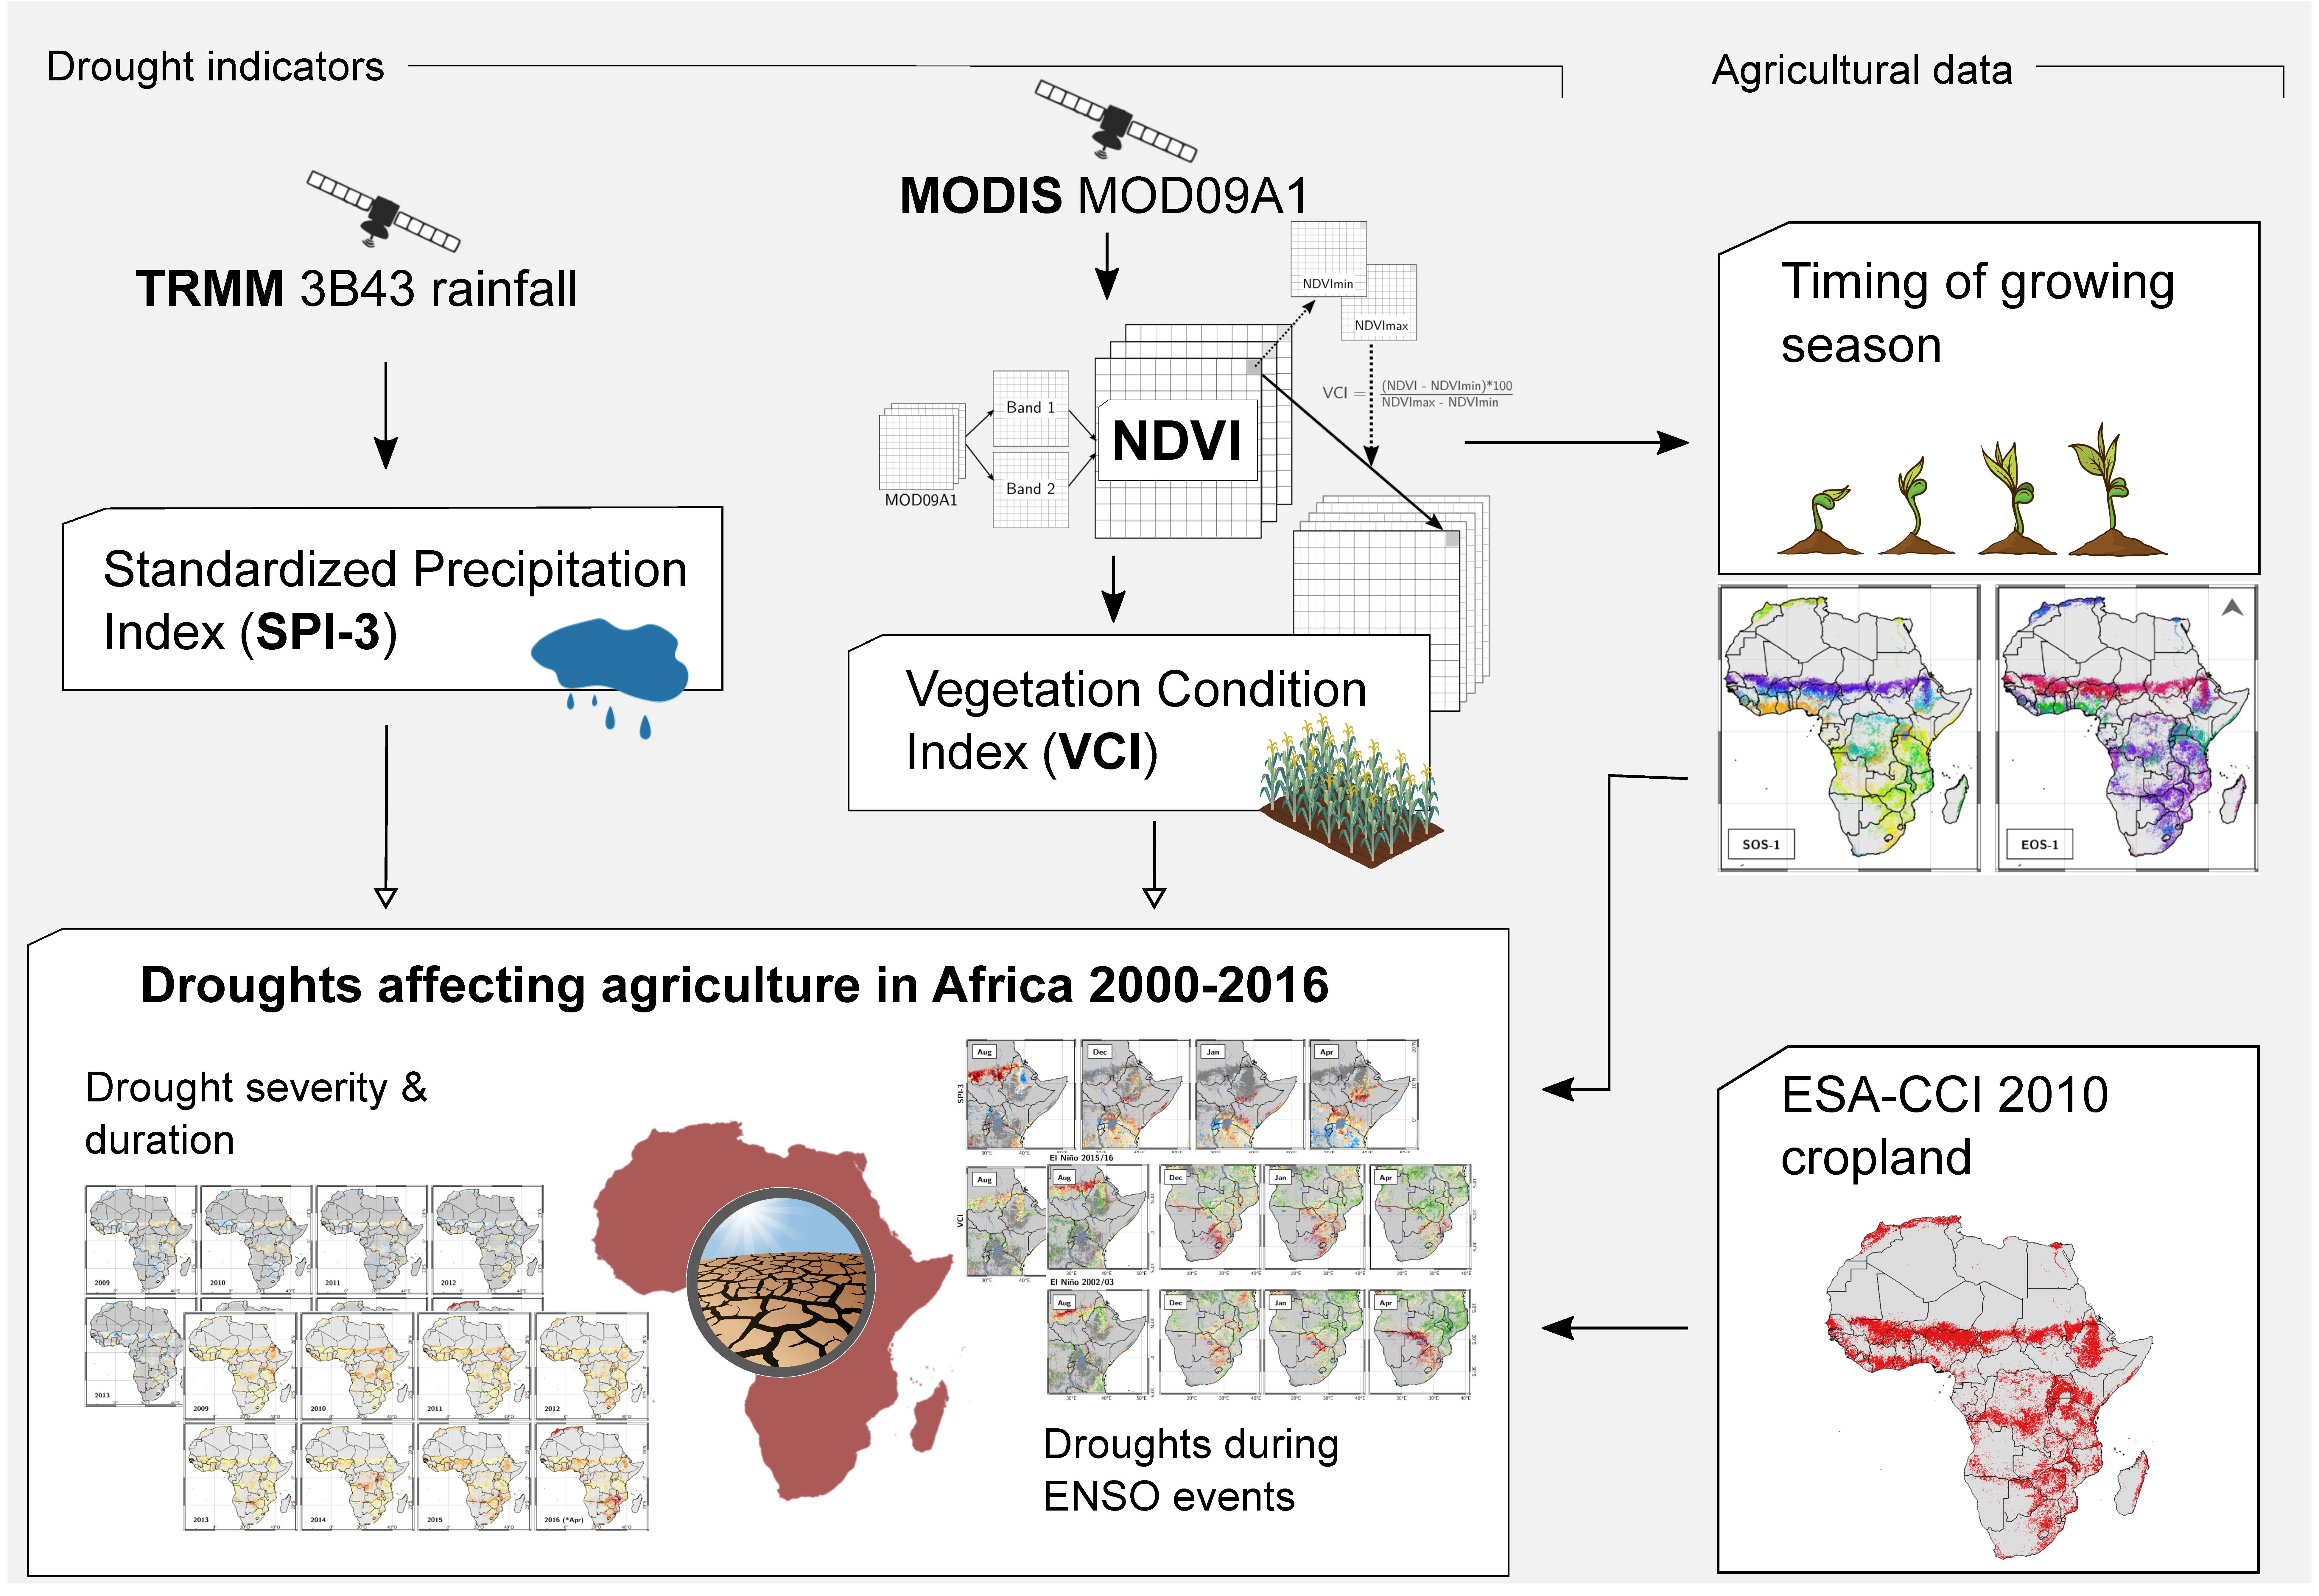
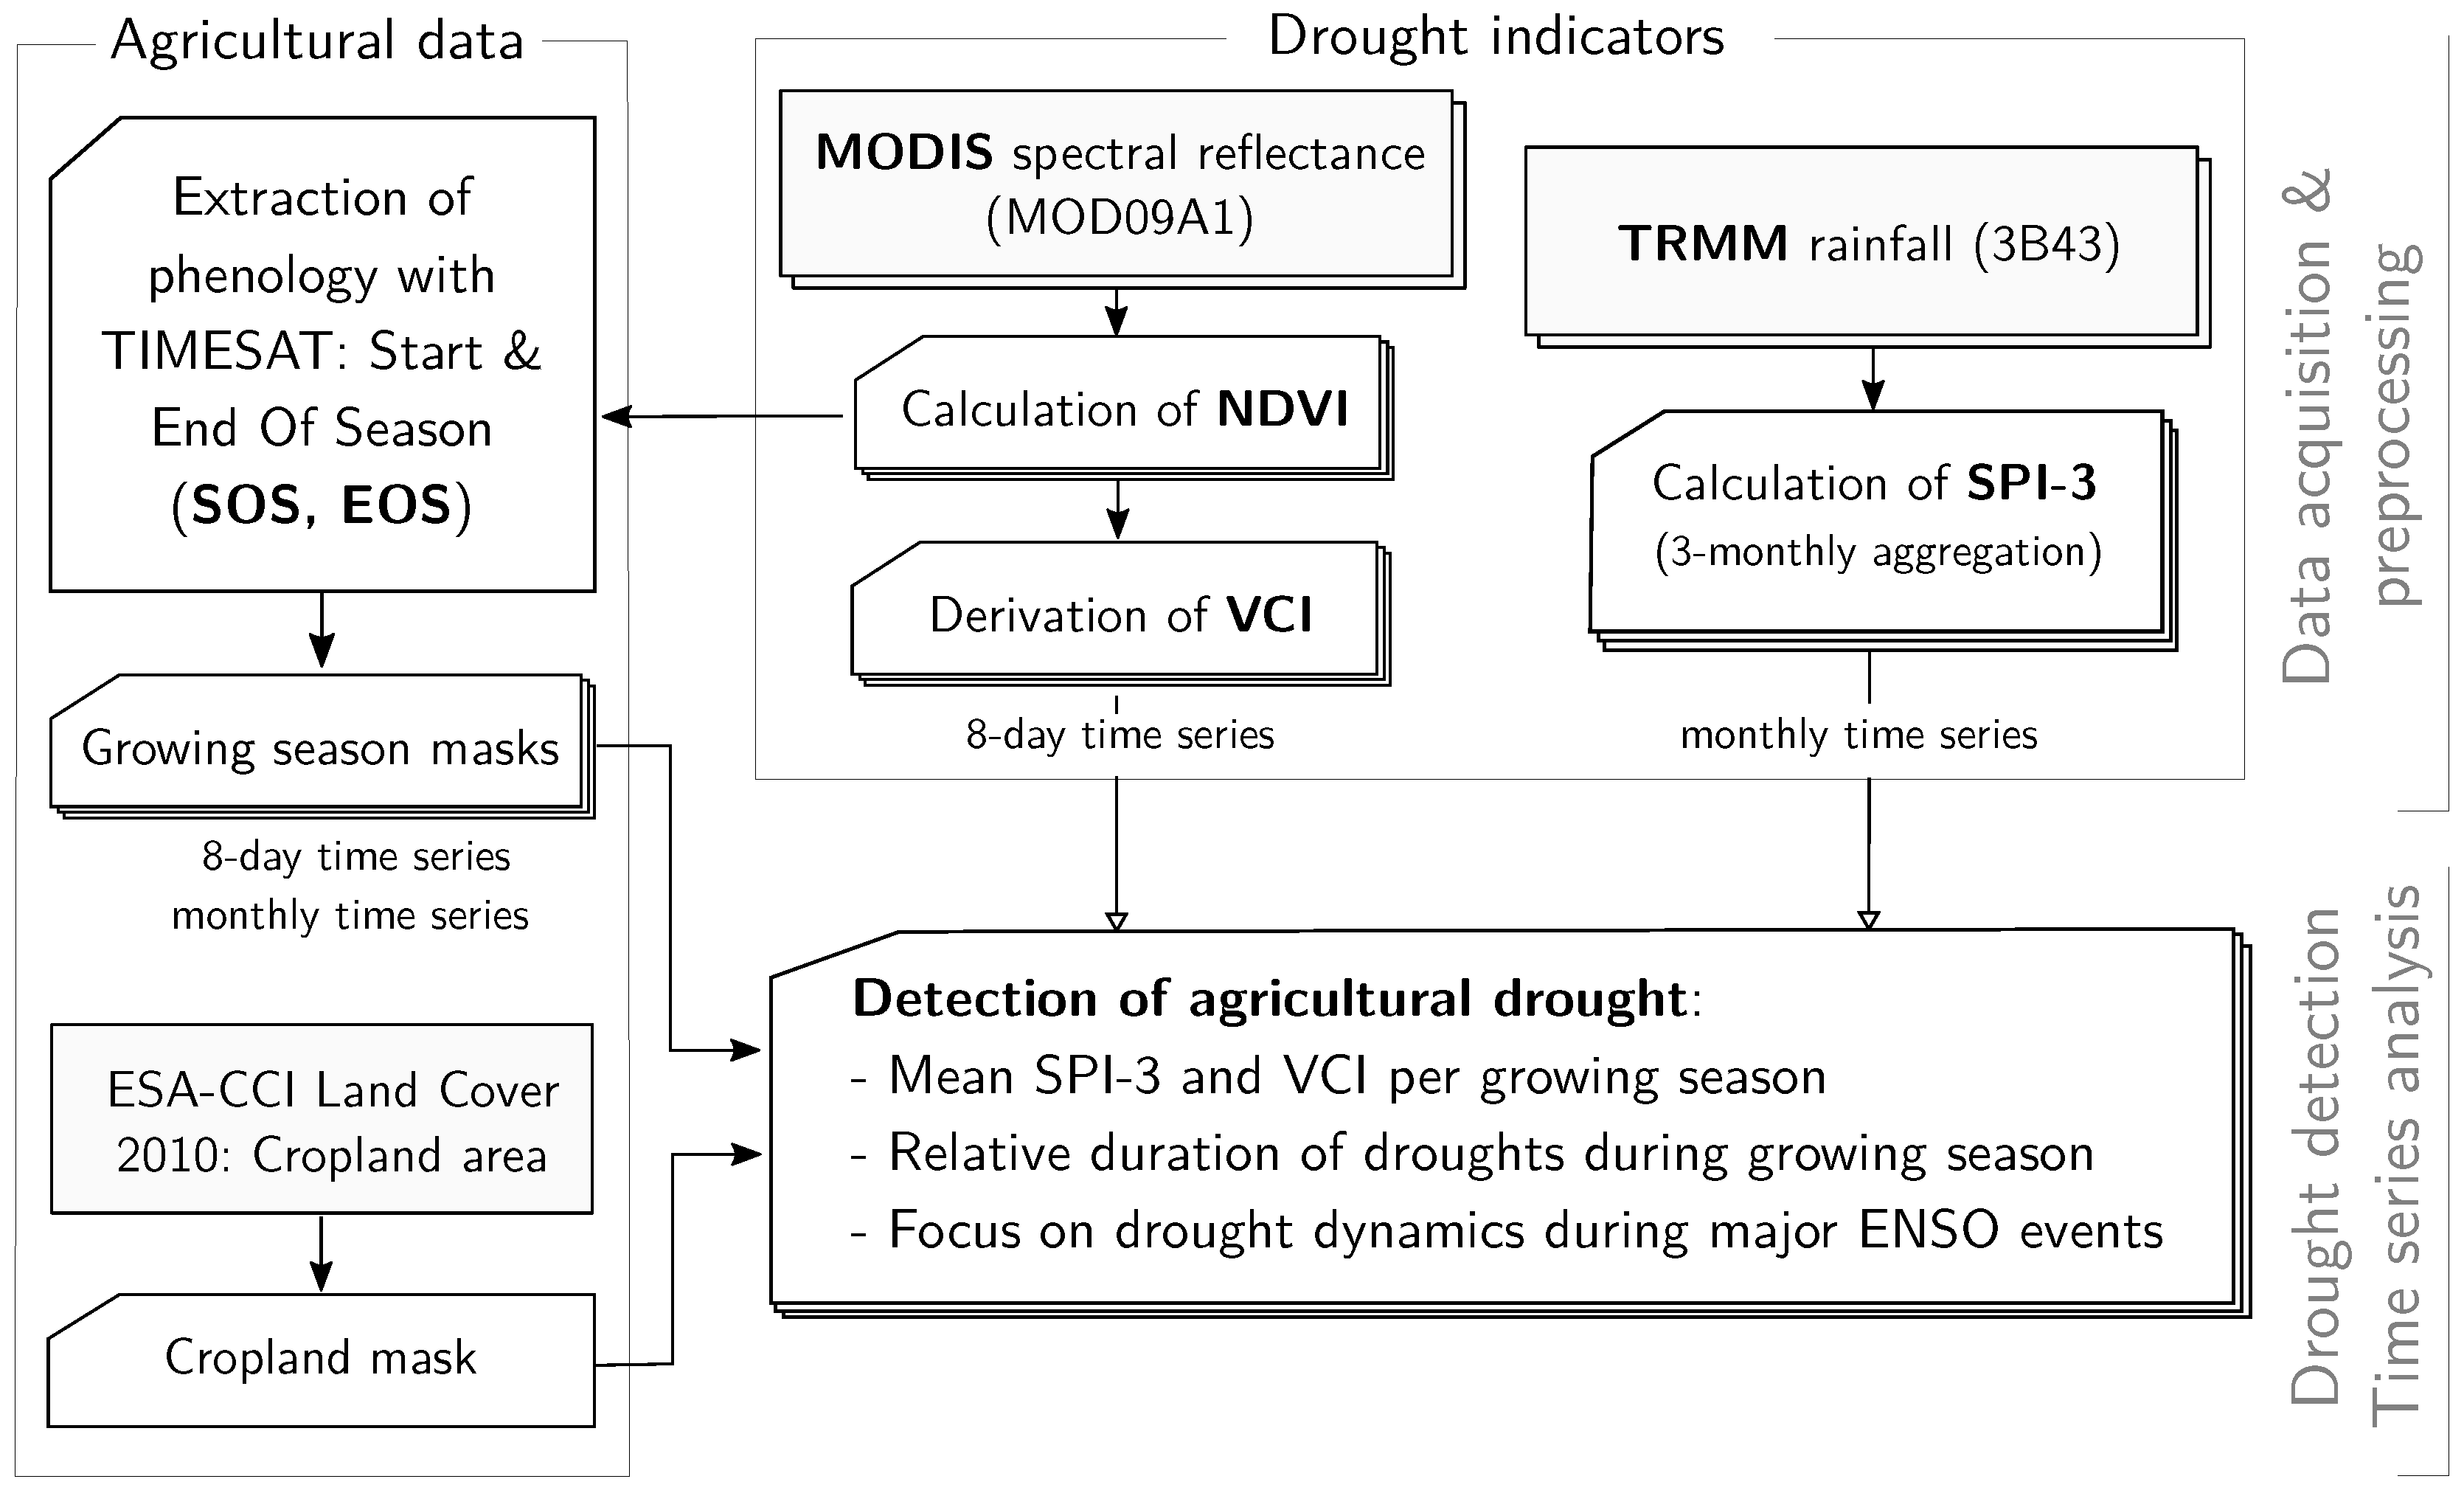
3. Materials and Methods
3.1. MODIS Data and Calculation of NDVI and VCI
3.2. TRMM Data and Derivation of SPI
3.3. Ancillary Data
3.4. Extraction of Average Growing Season with TIMESAT
3.5. Detection of Agriculturally Relevant Droughts
4. Results
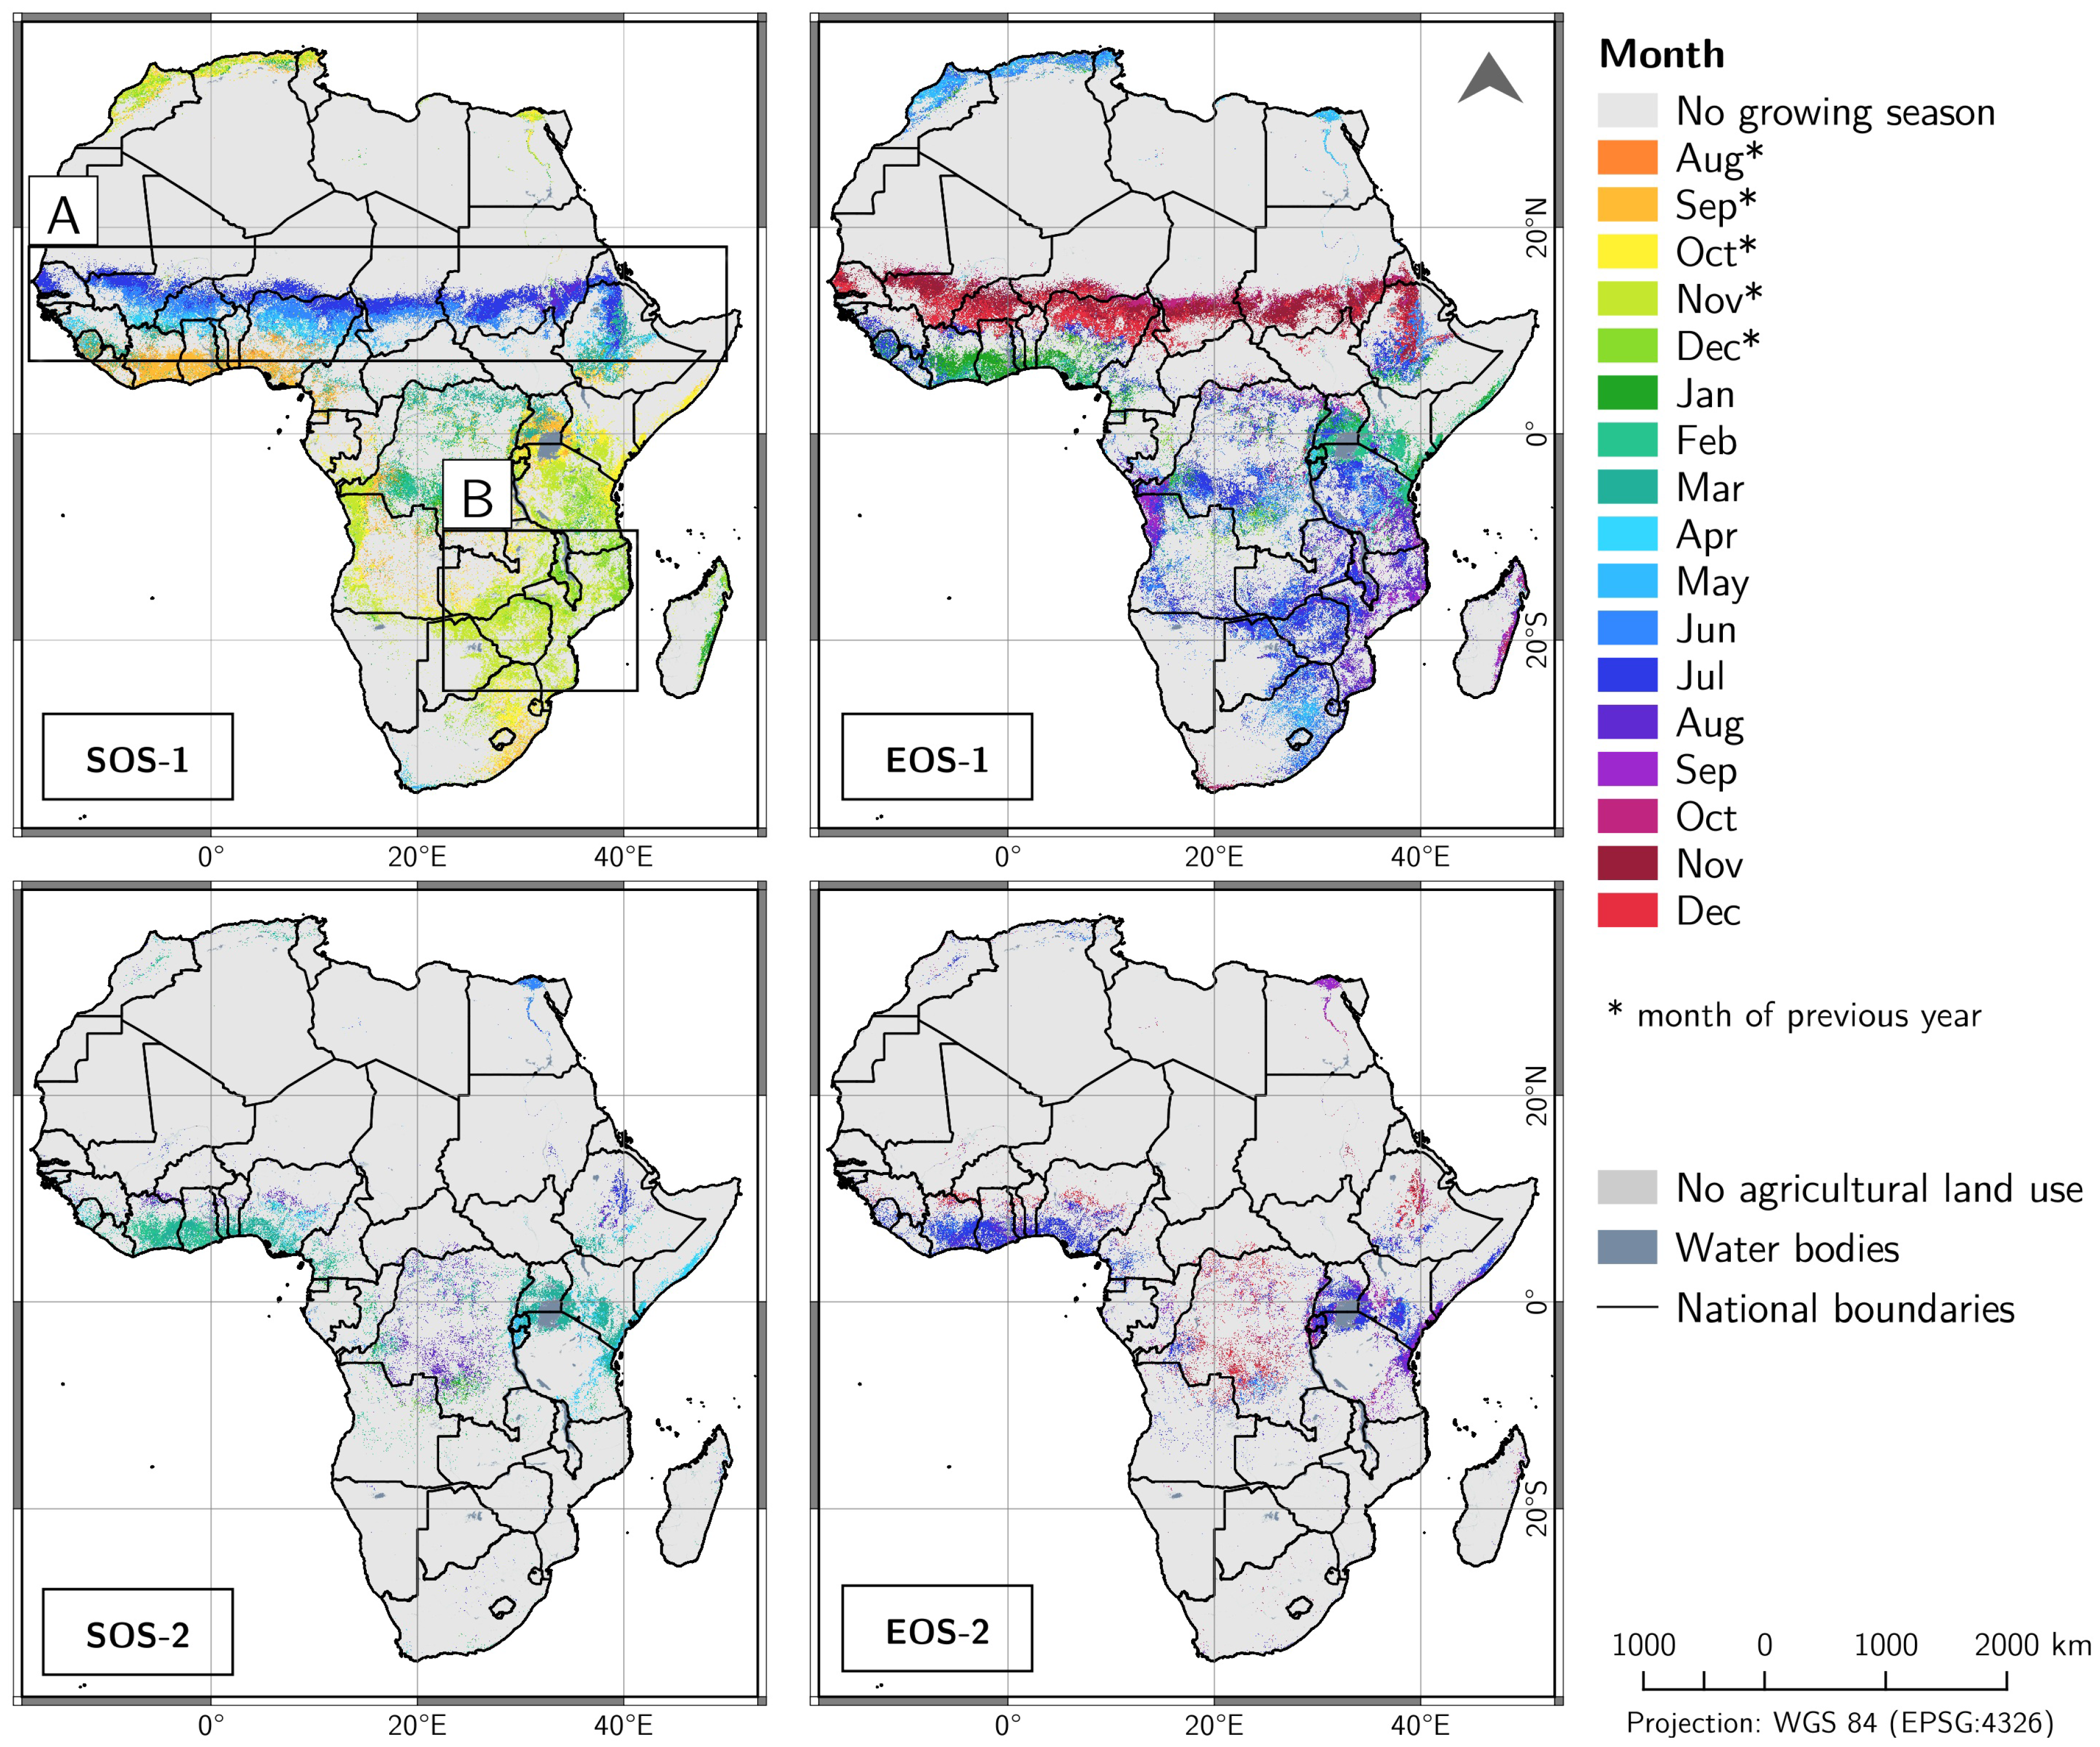
4.1. Timing of Average Growing Season
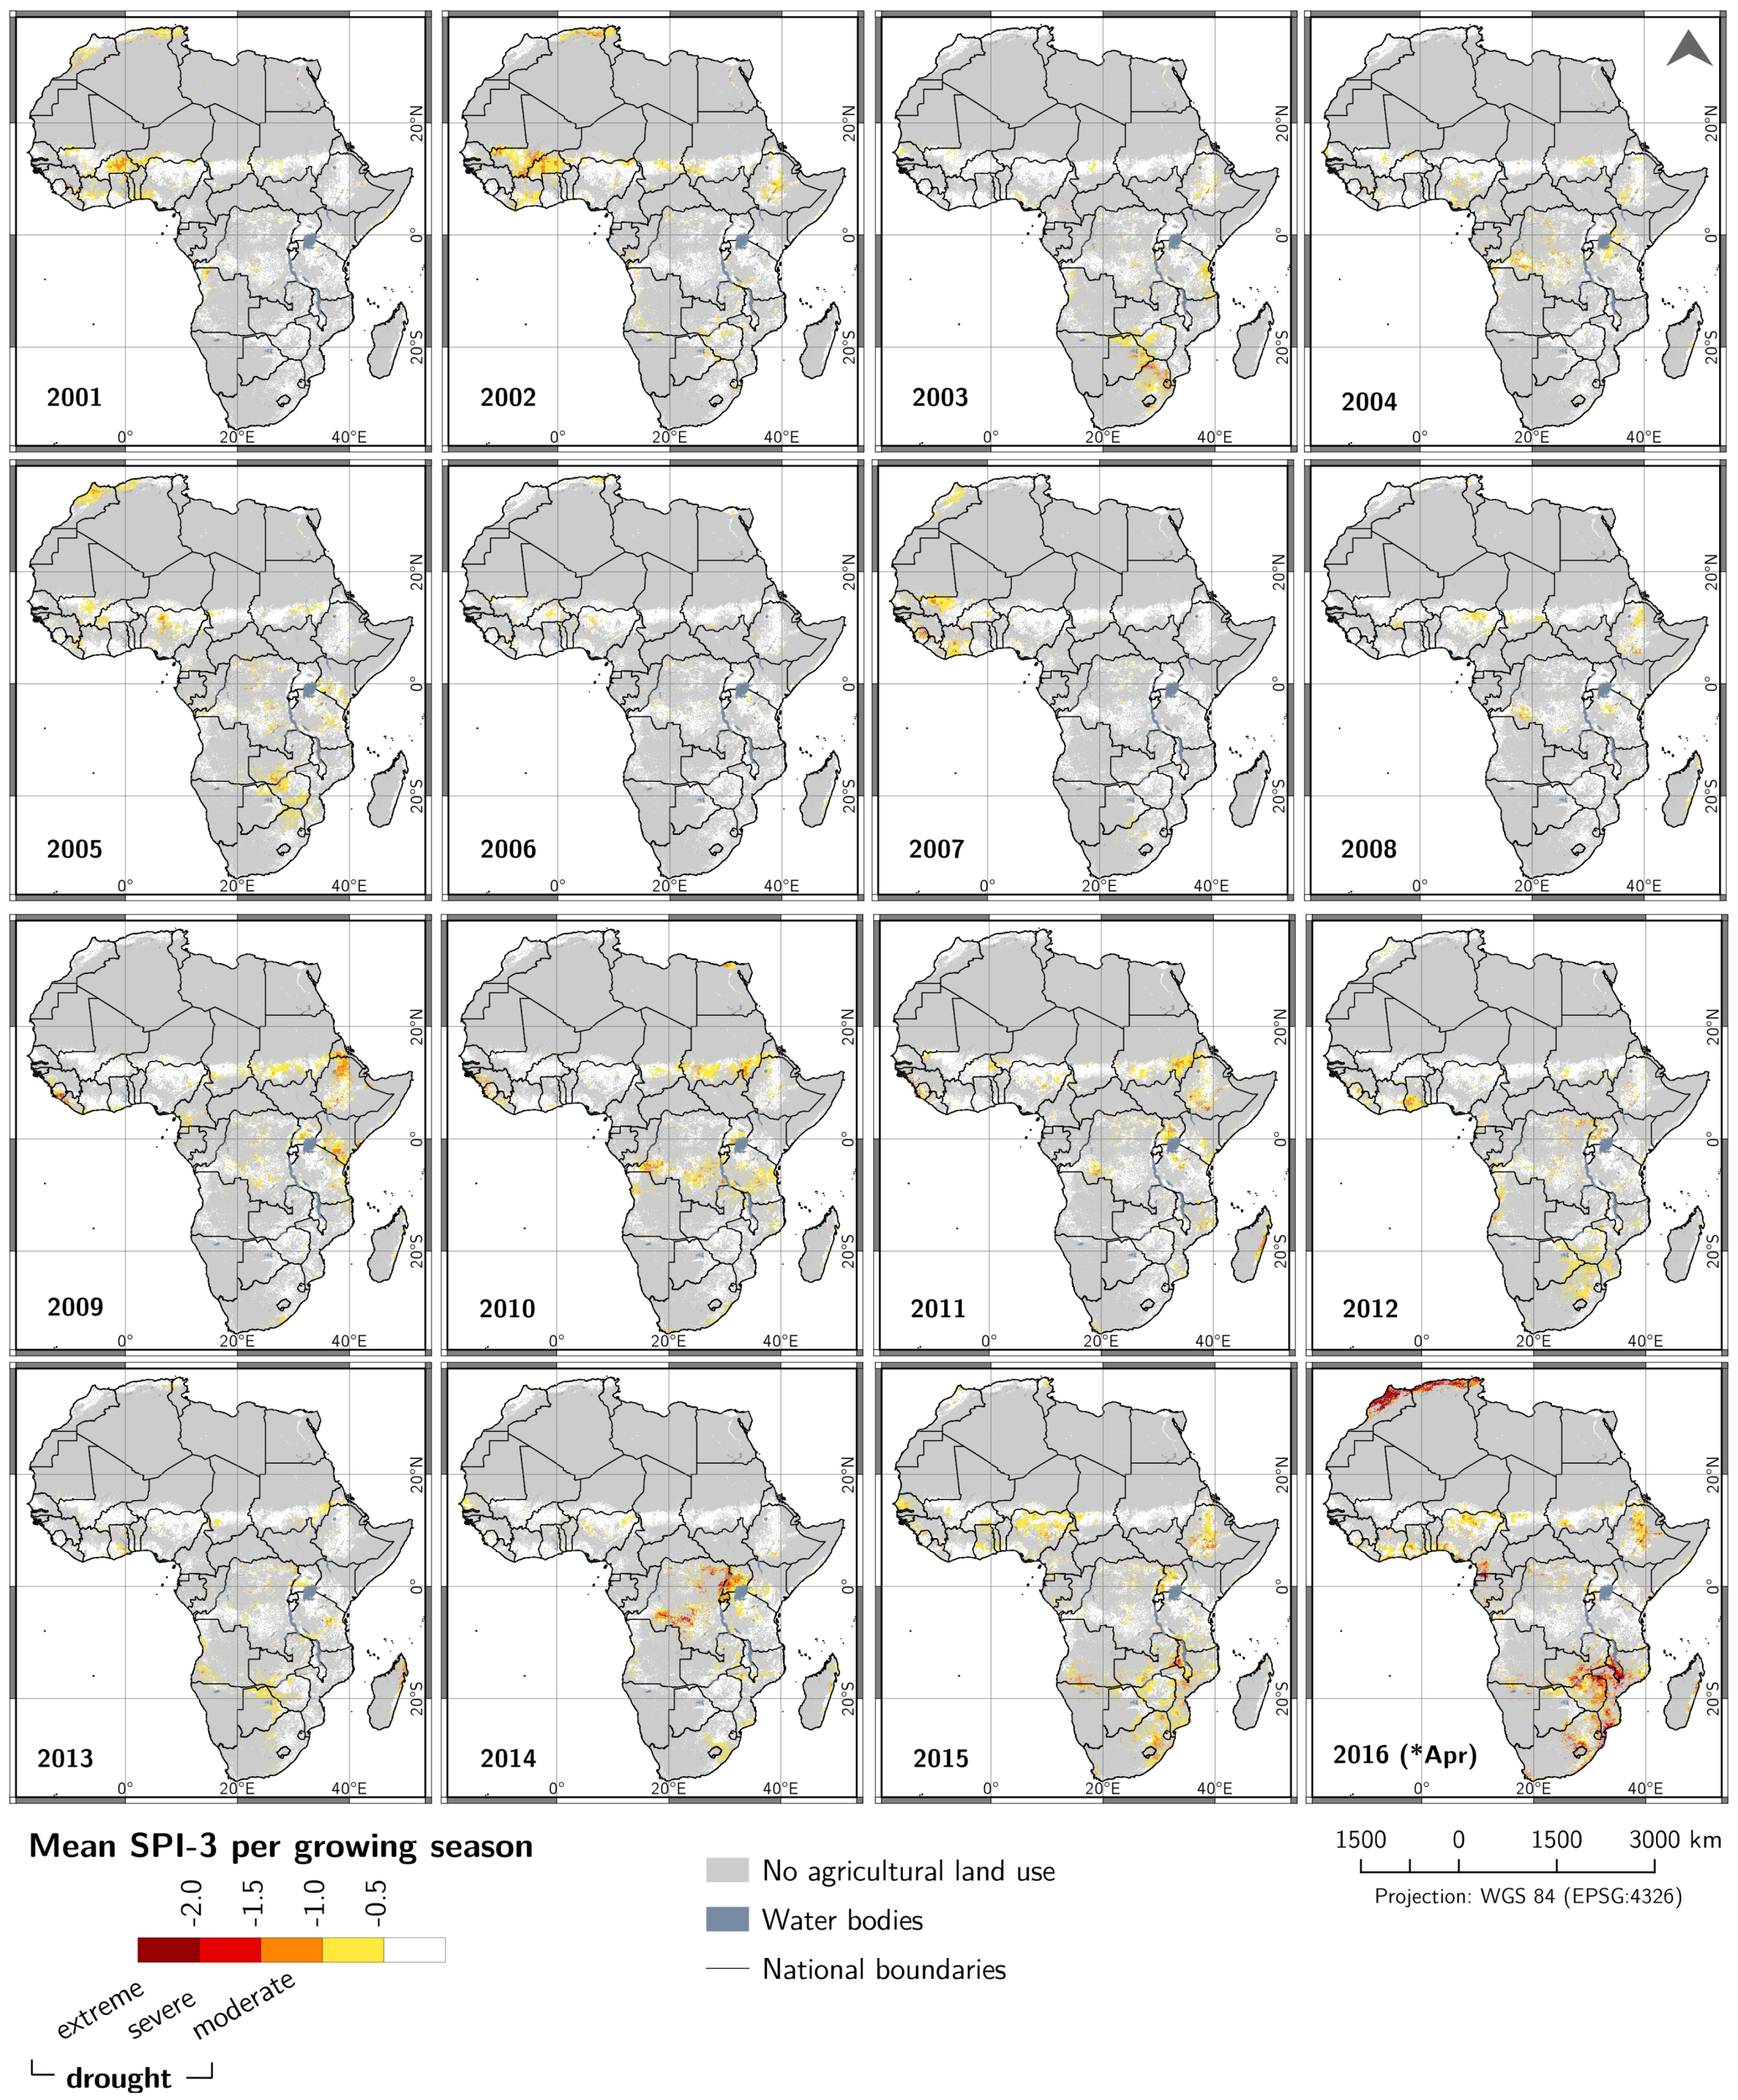
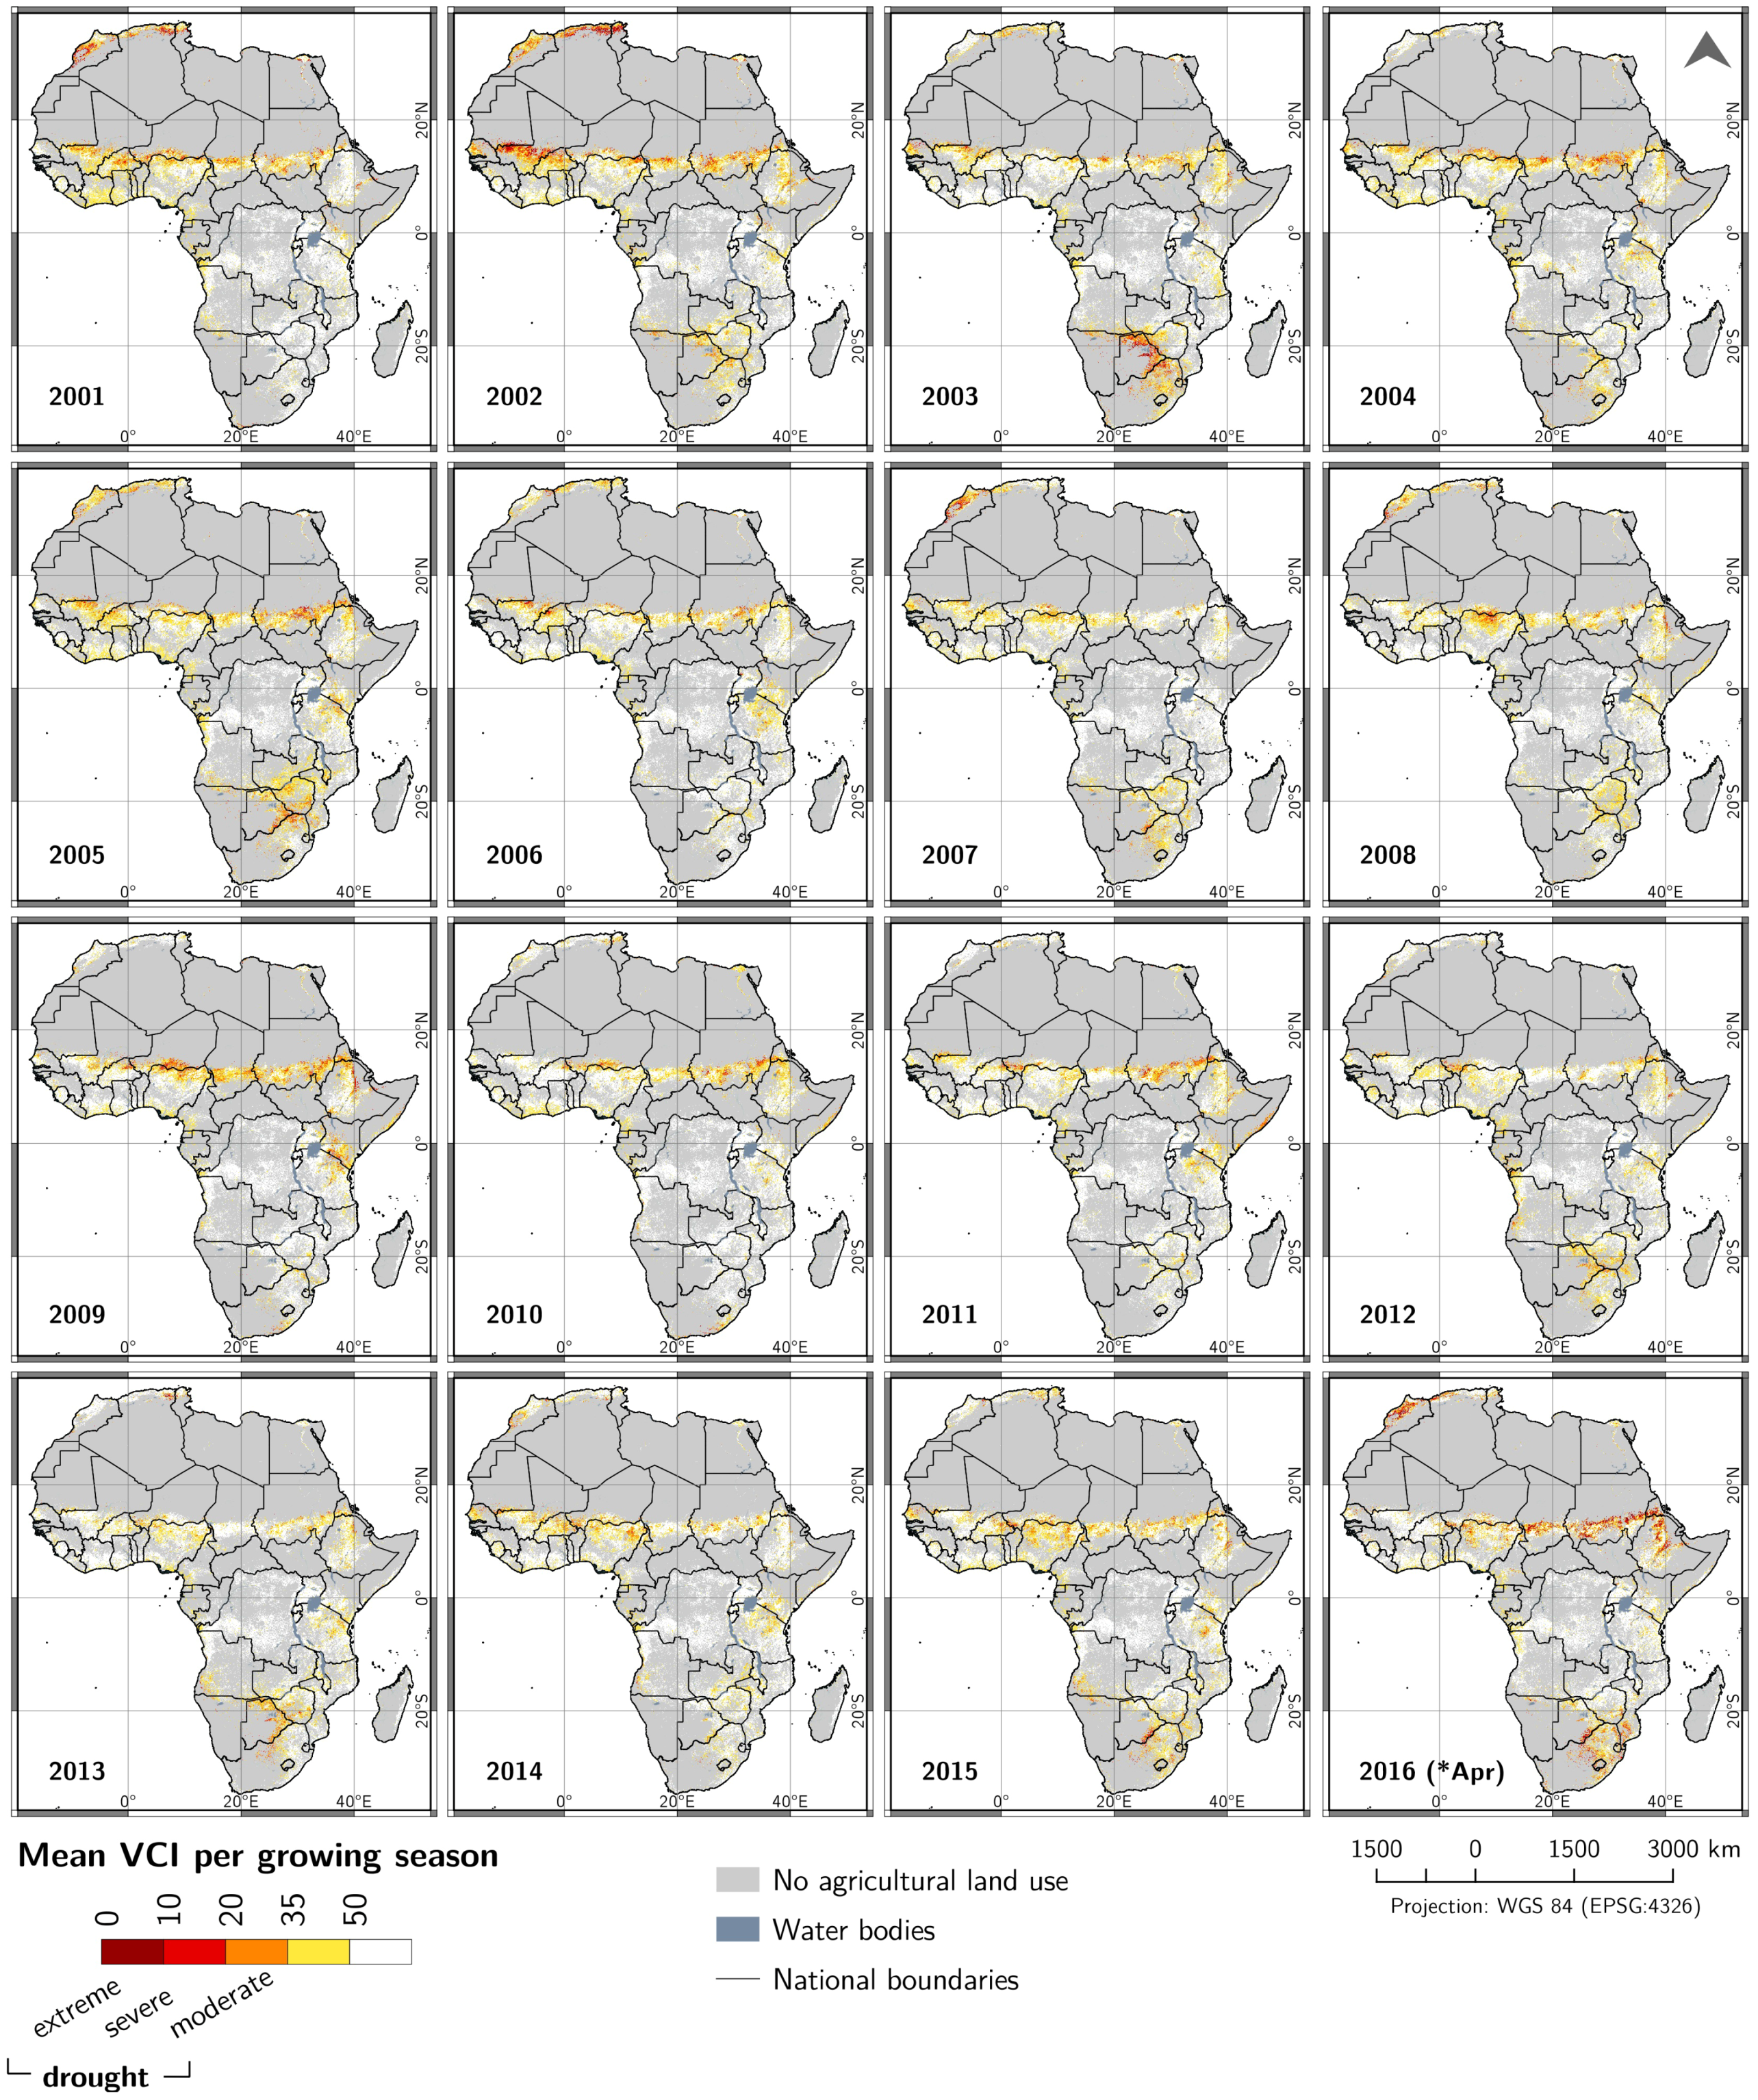
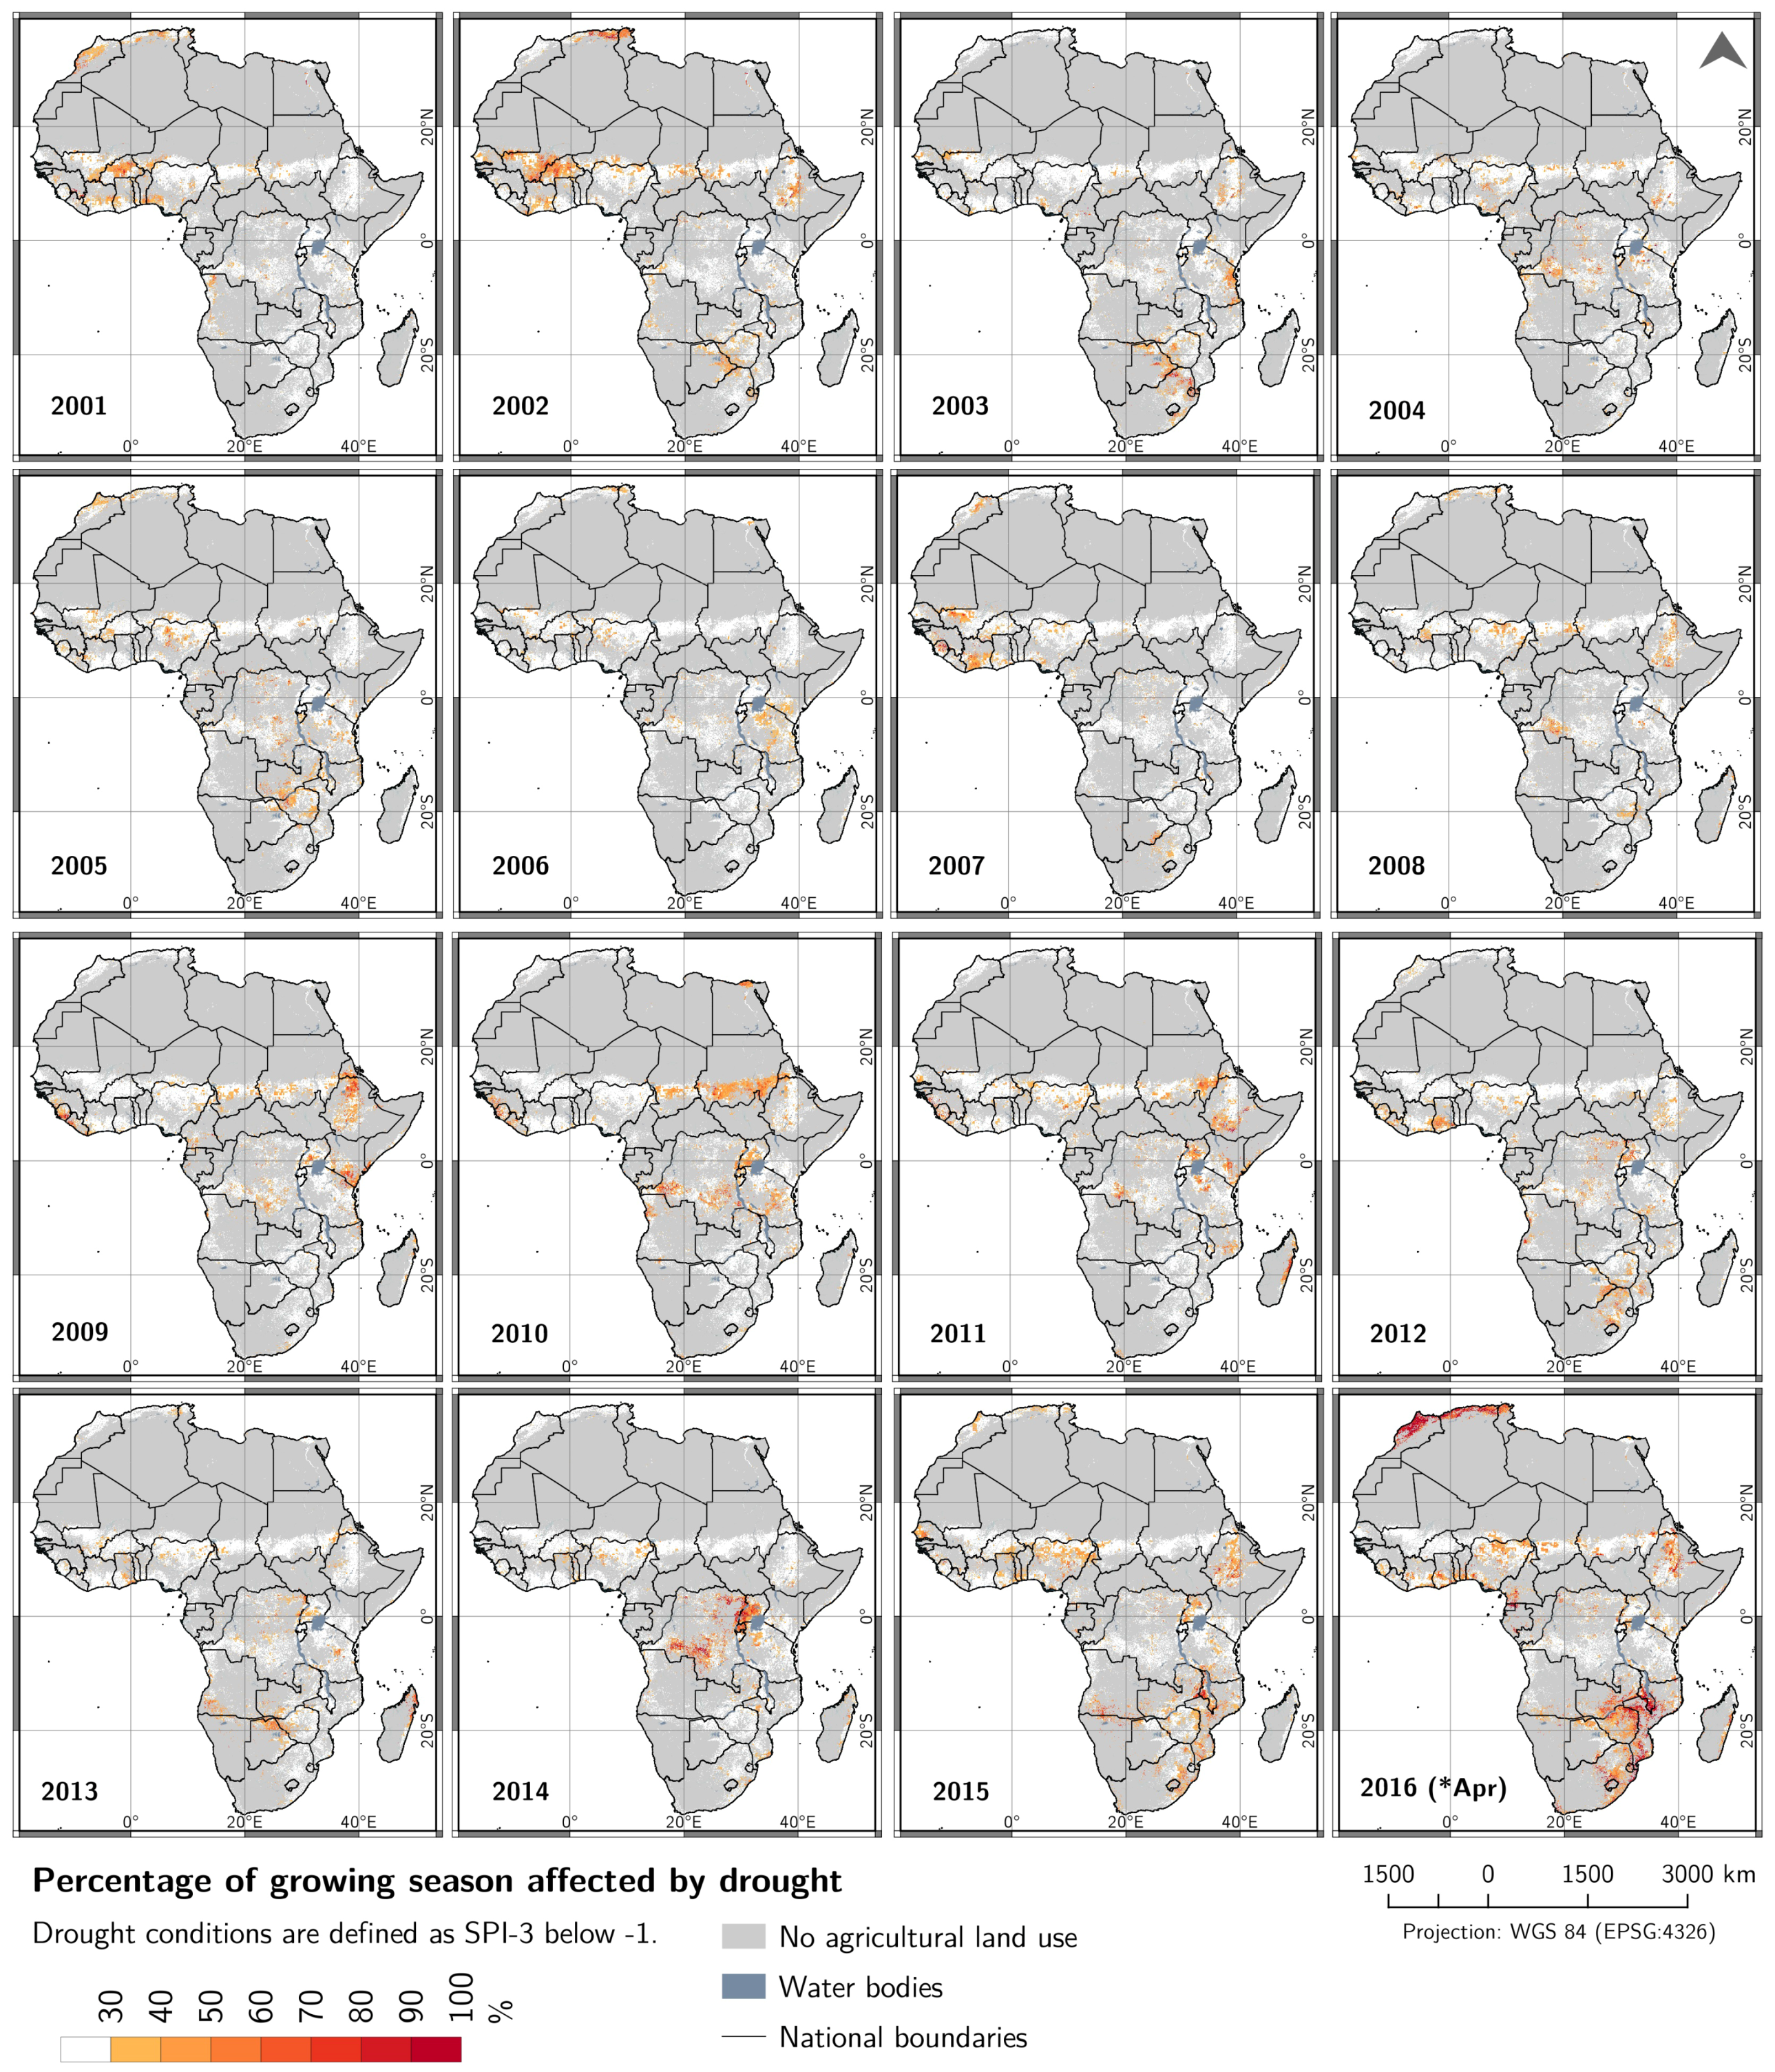
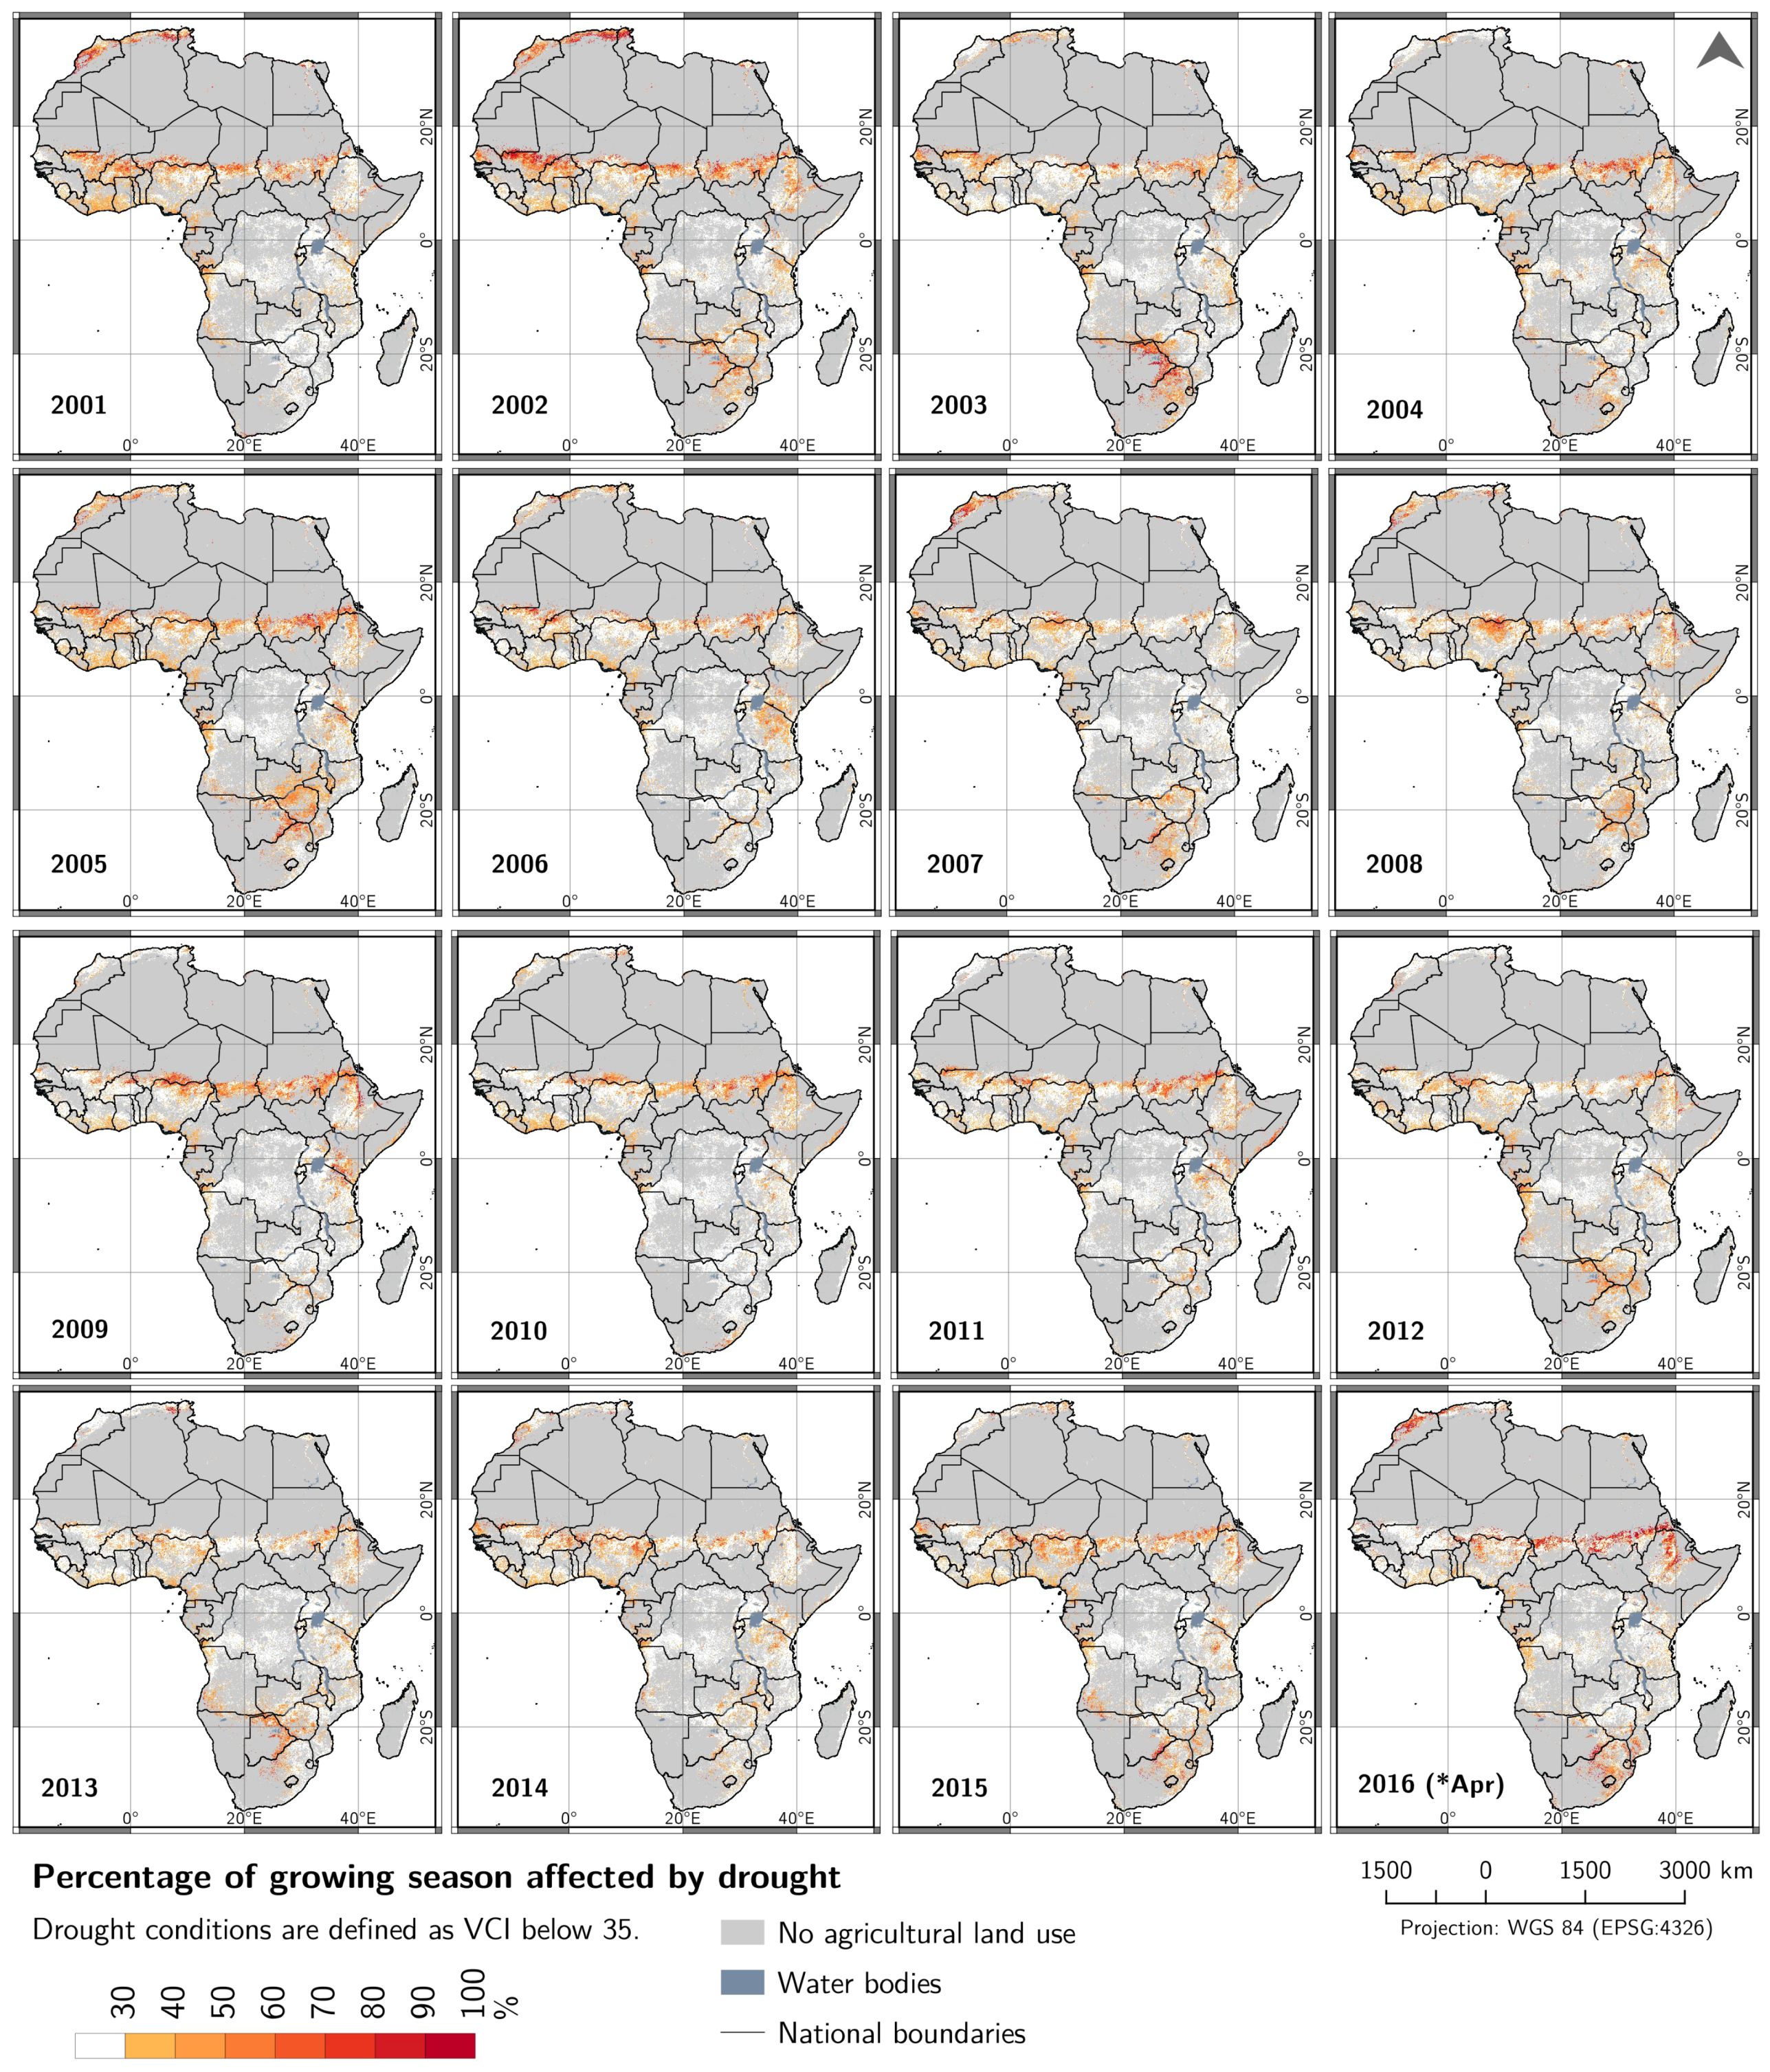
4.2. Spatio-Temporal Patterns of Agriculturally Relevant Droughts over Africa
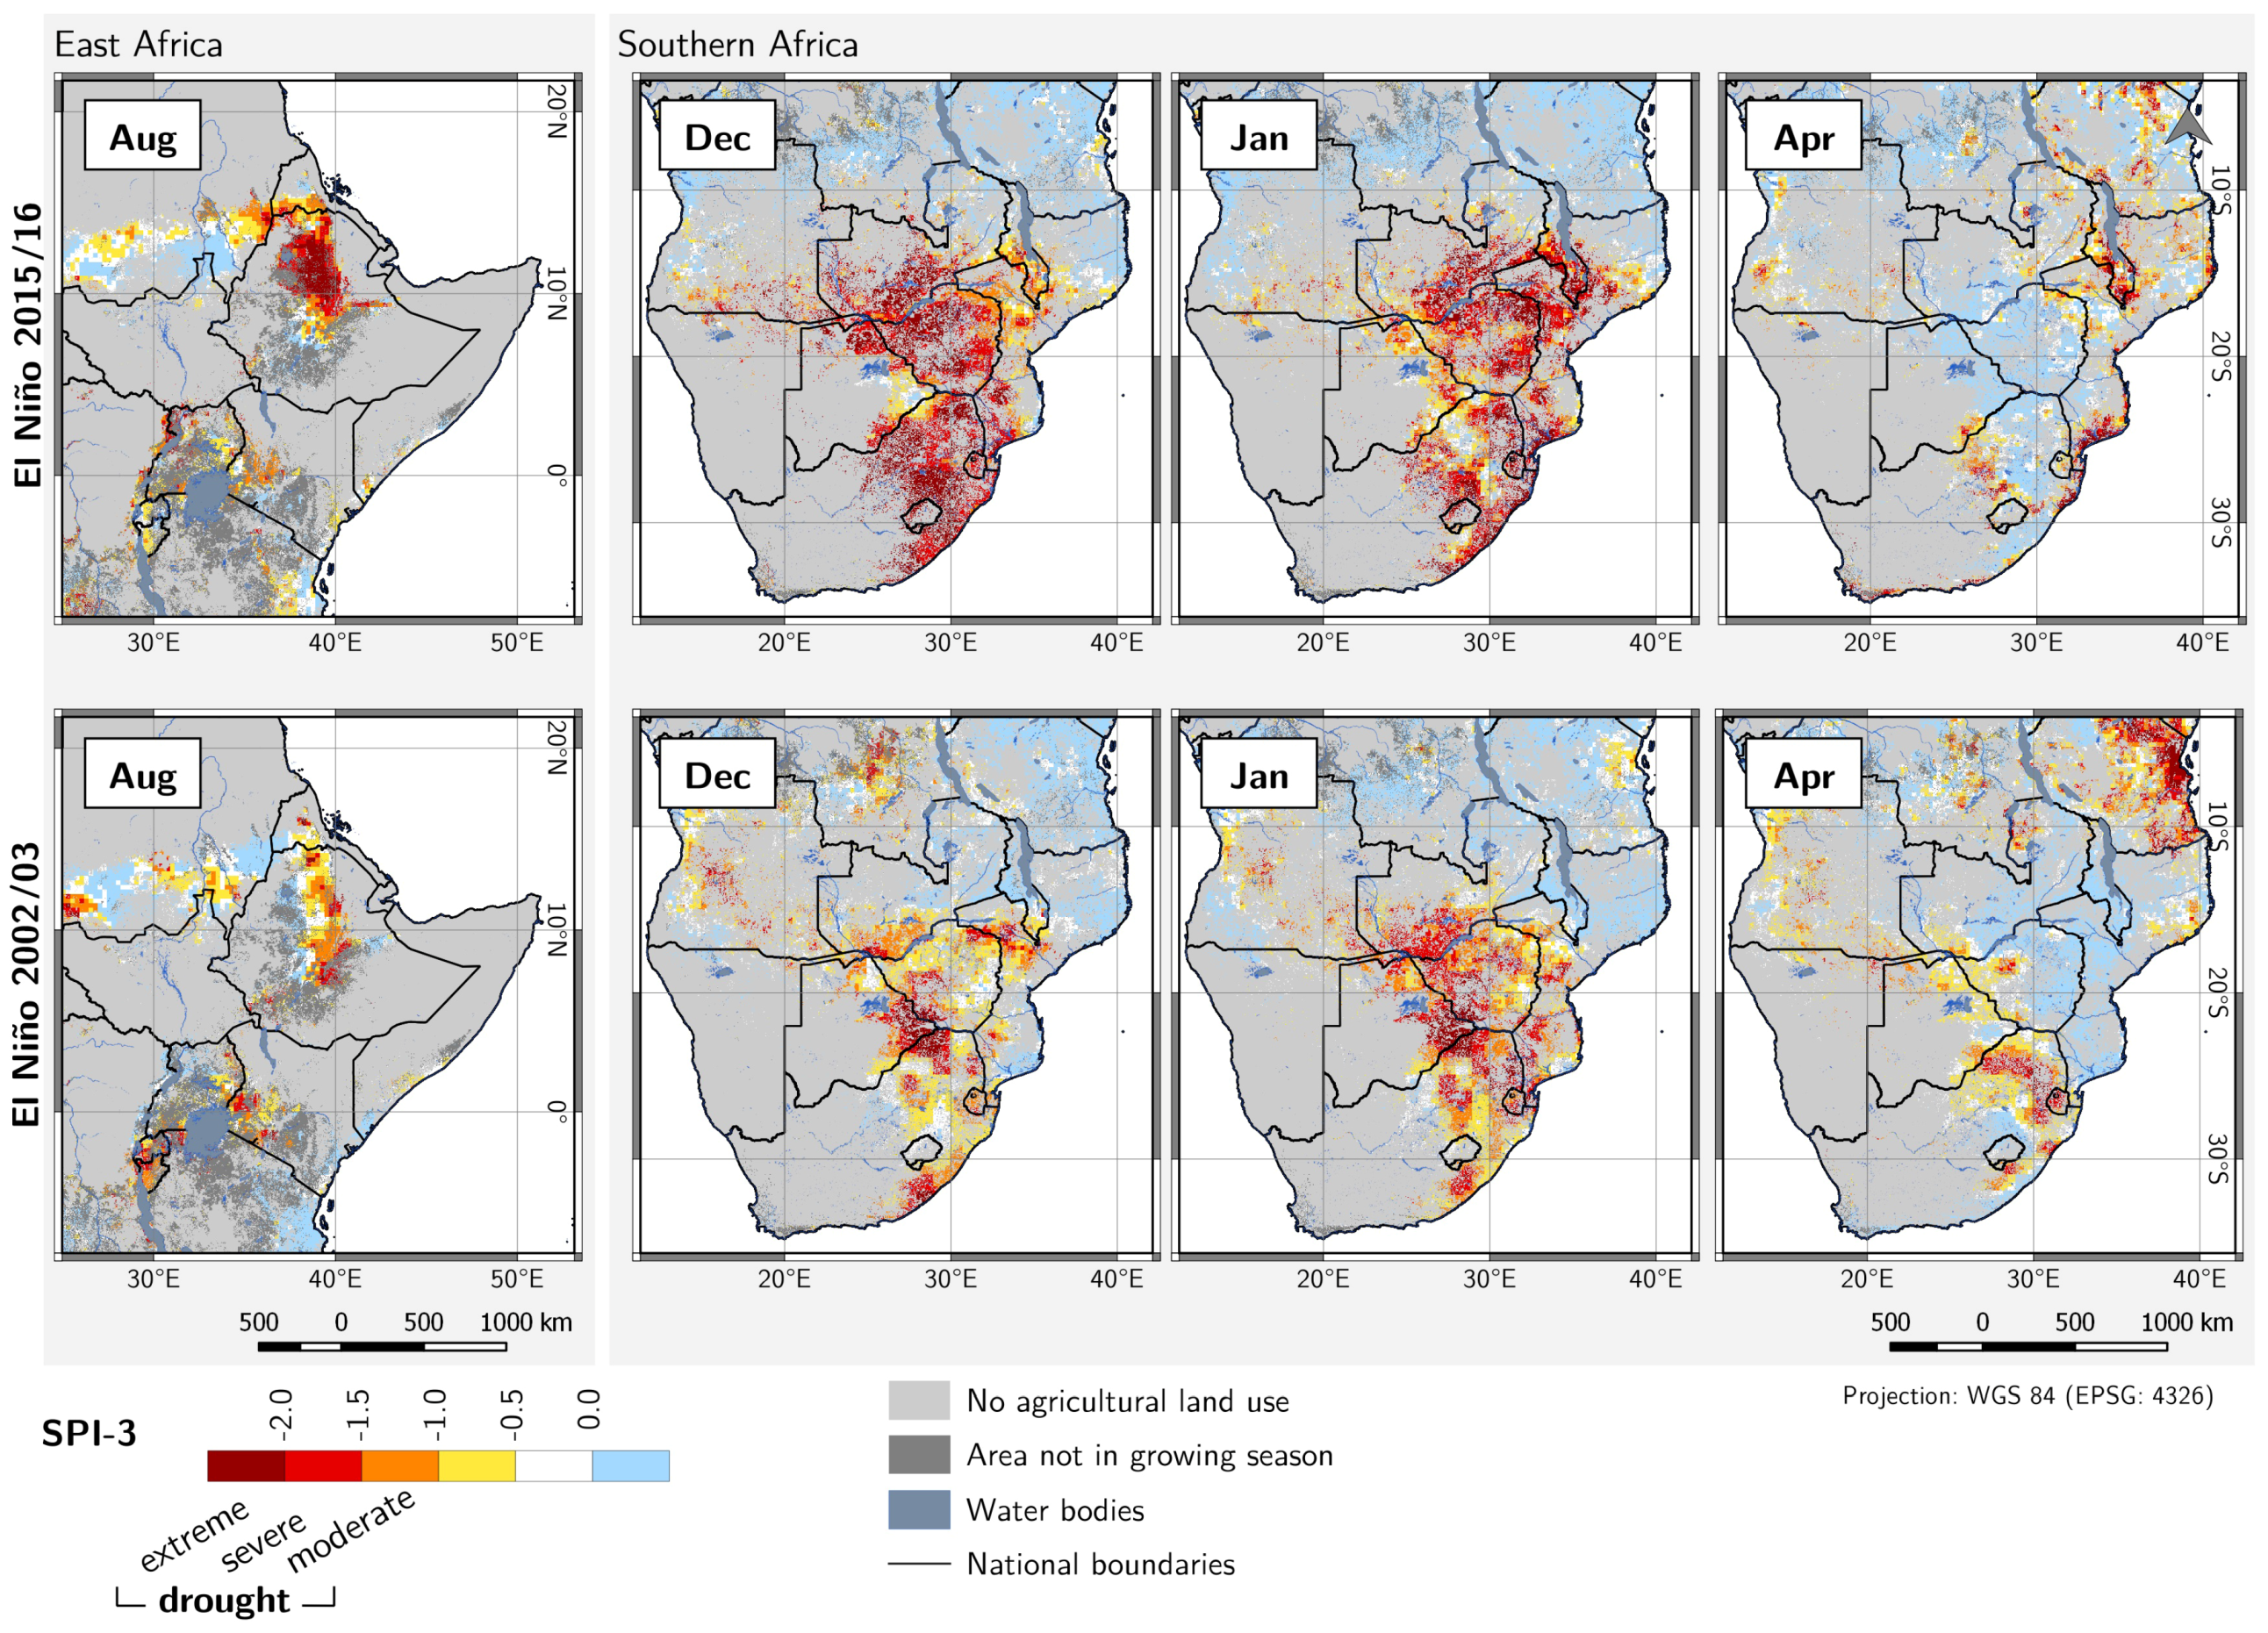
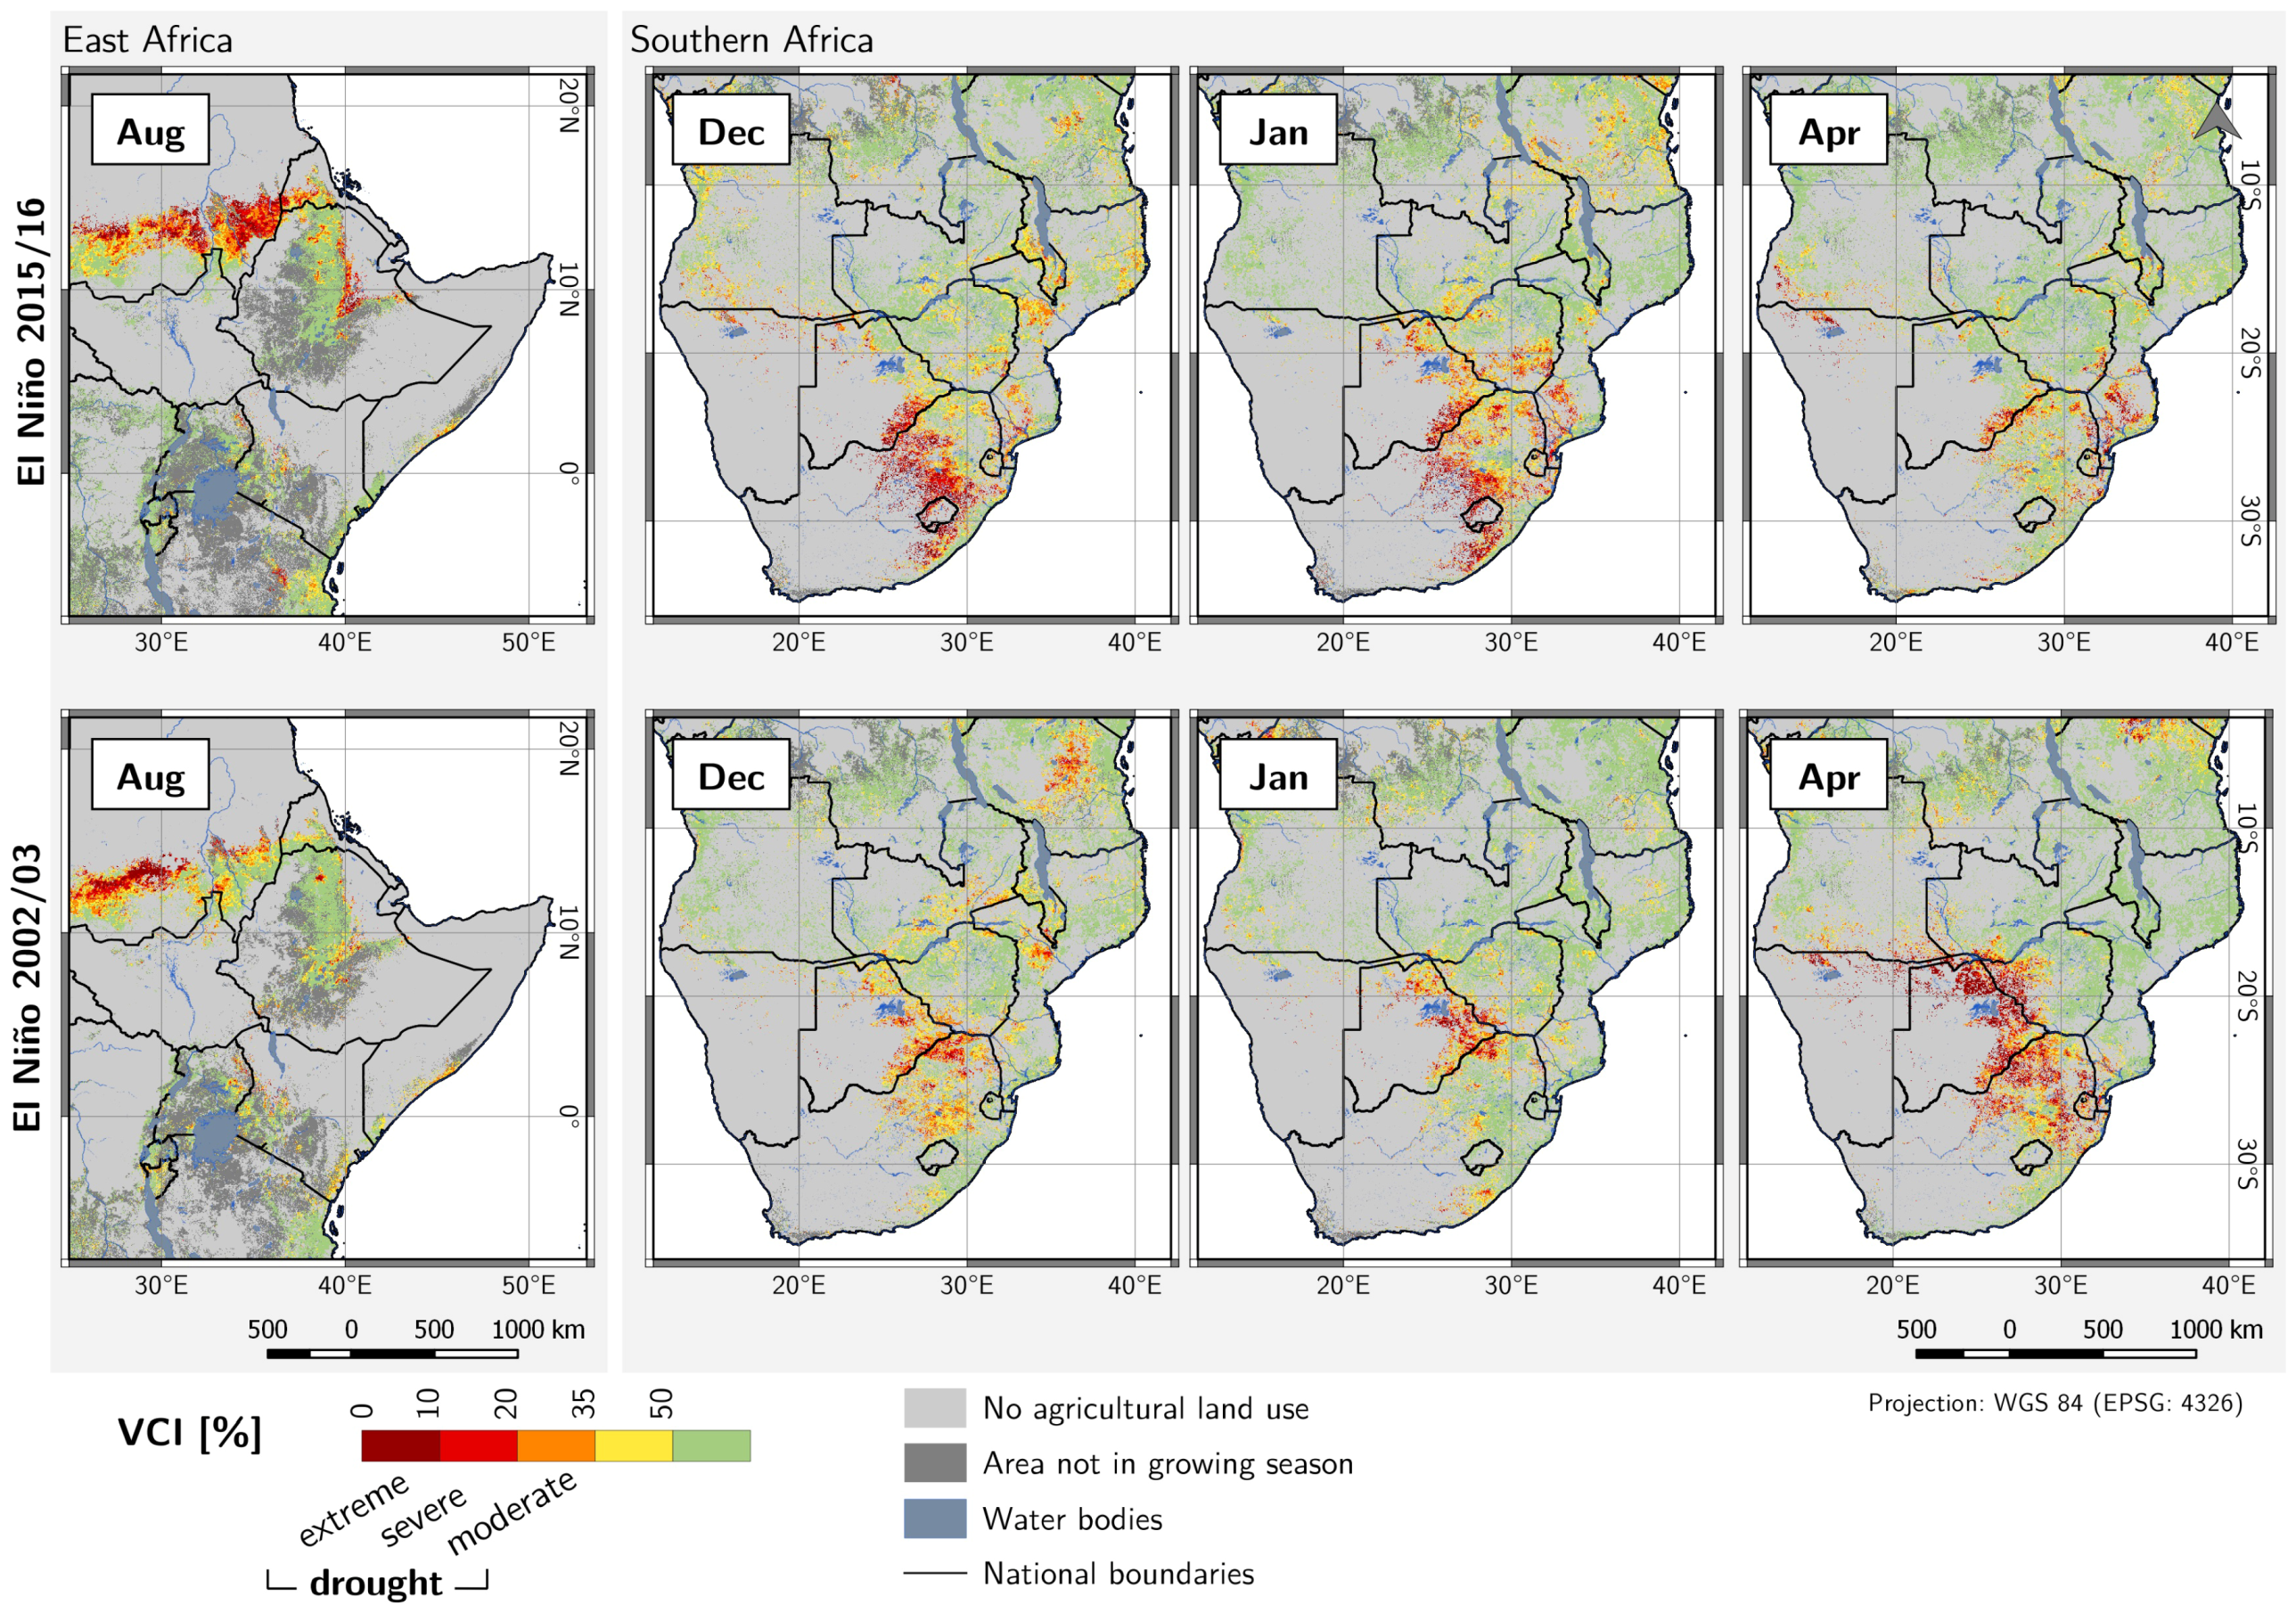
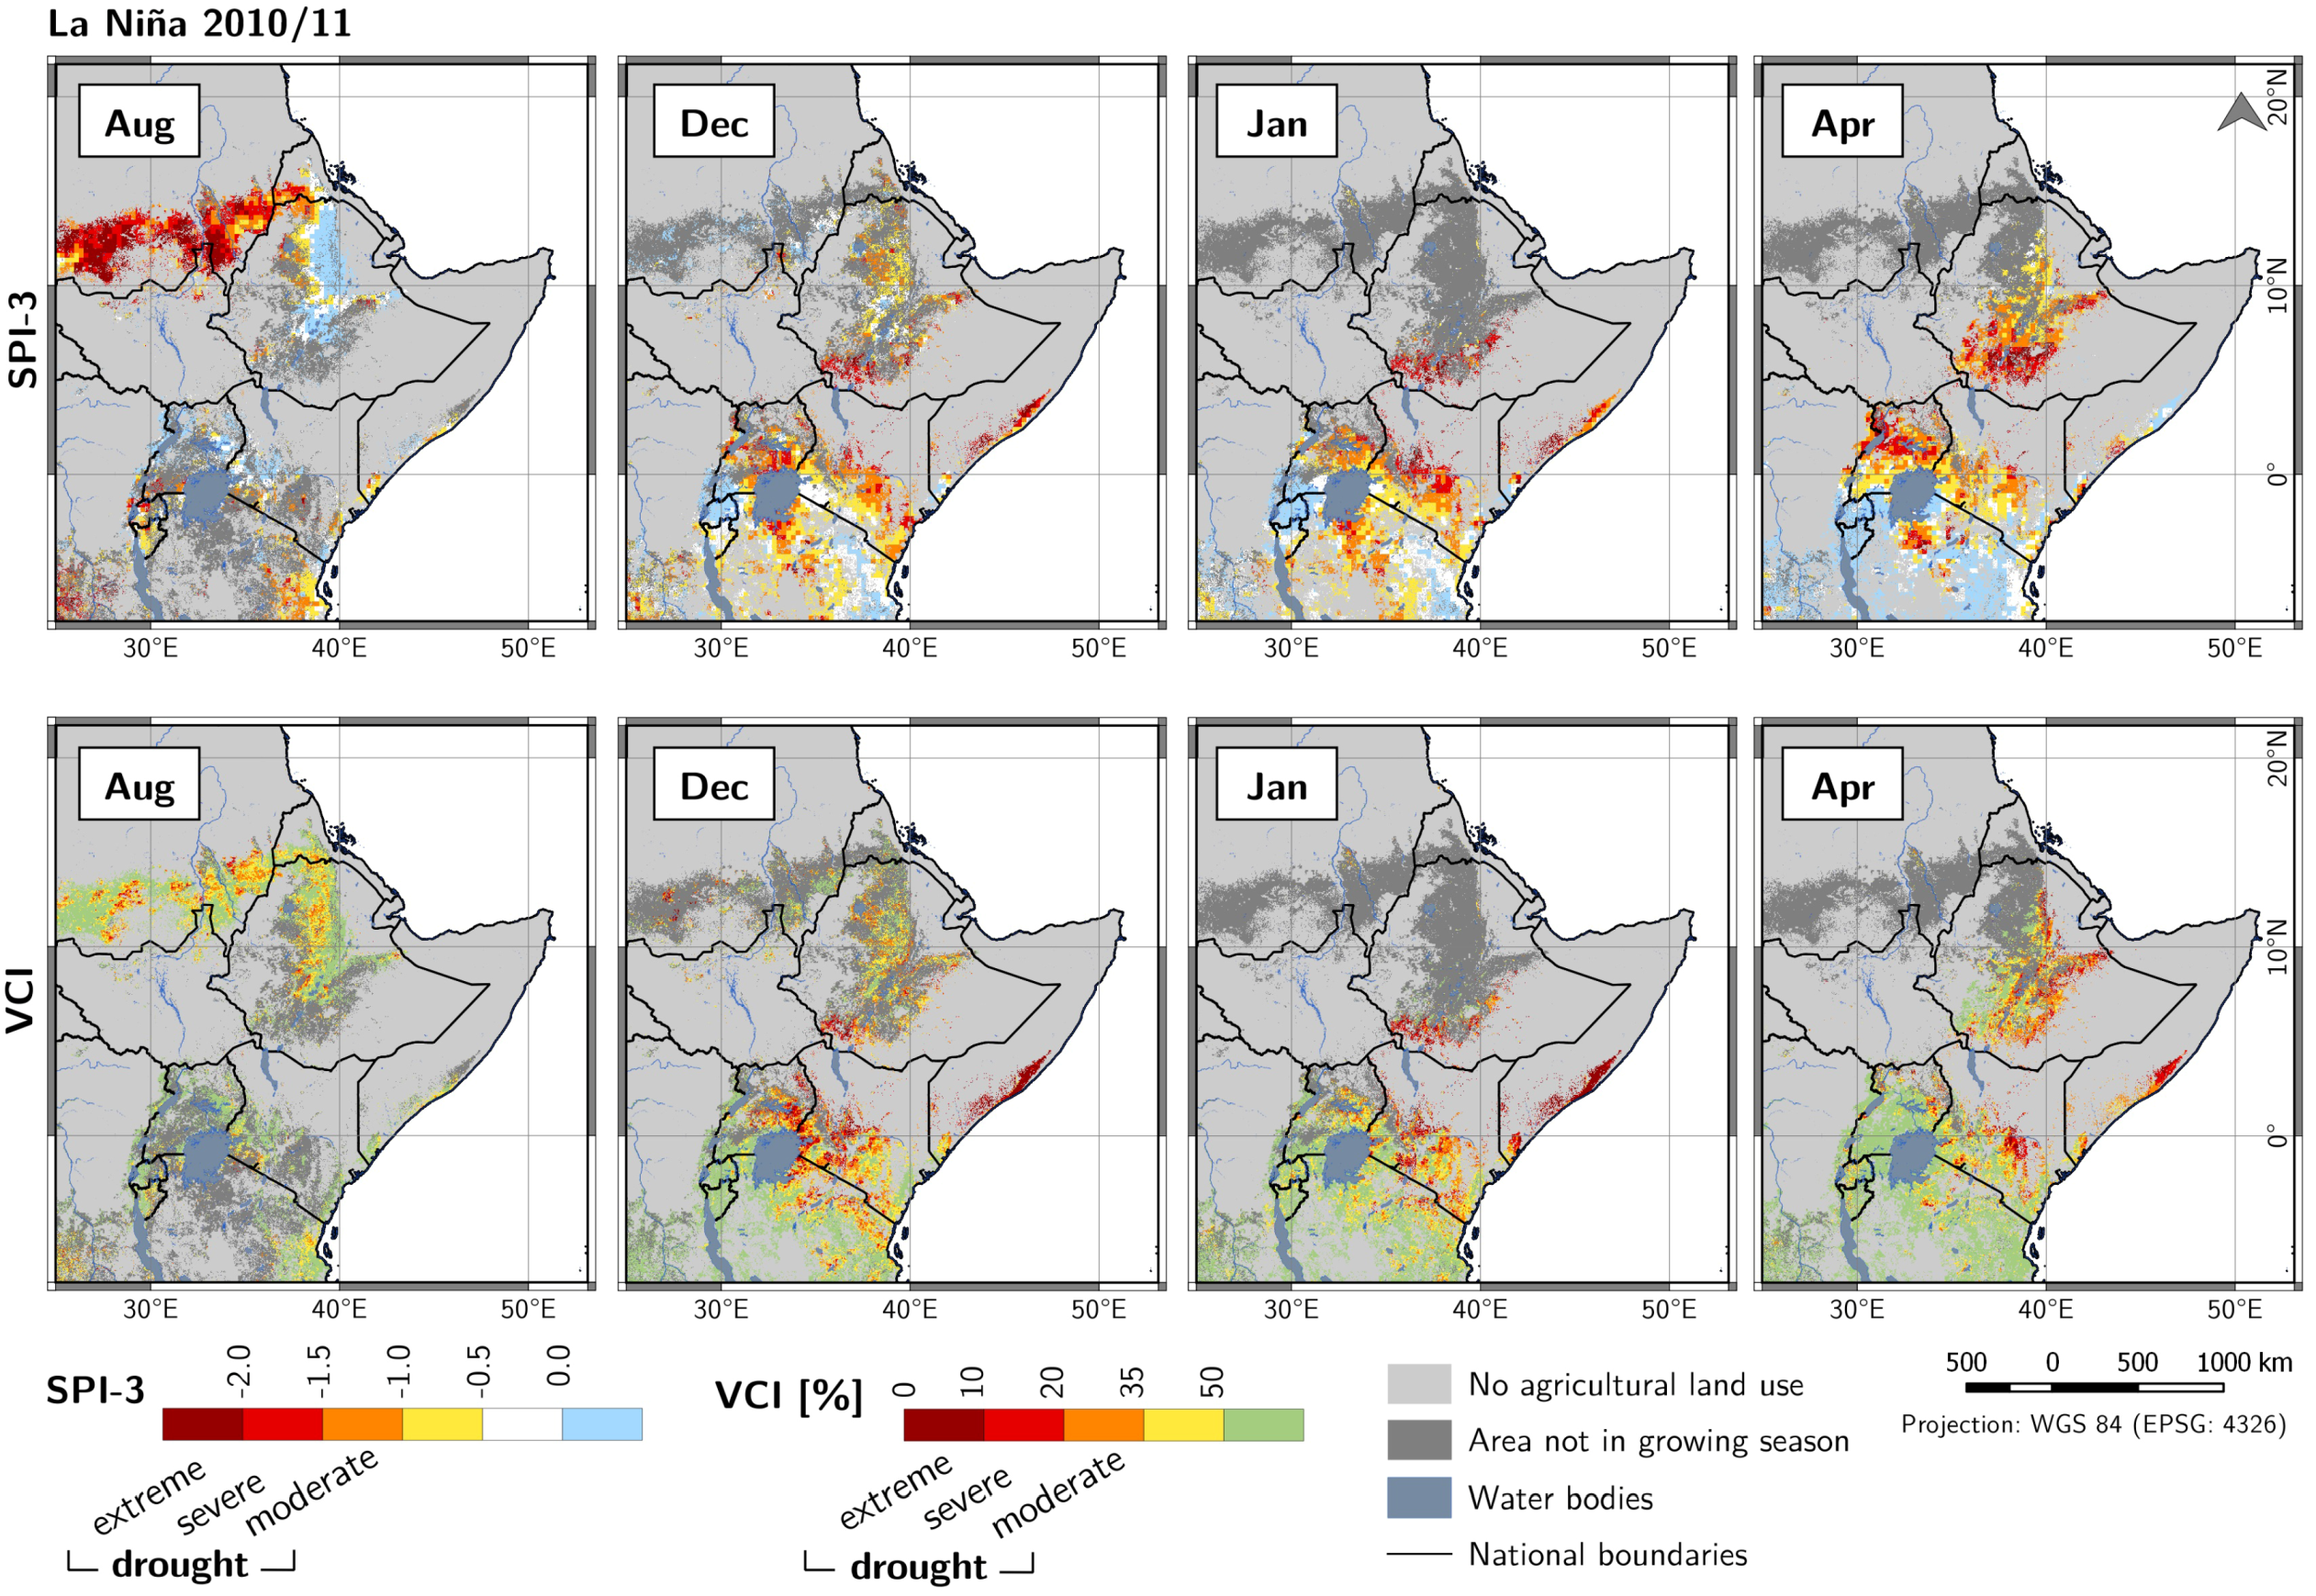
4.3. Agricultural Droughts during El Niño-Southern Oscillation (ENSO) Events
4.4. Drought-Affected Cropland and Agricultural Production
5. Discussion
5.1. Monitoring Agricultural Droughts over Africa
5.2. Comparison of SPI-3 and VCI
5.3. Spatio-Temporal Variability of Agricultural Droughts during ENSO Events
5.4. Potential and Limitations
6. Conclusions
Acknowledgments
Author Contributions
Conflicts of Interest
References
- Schubert, S.D.; Stewart, R.E.; Wang, H.; Barlow, M.; Berbery, E.H.; Cai, W.; Hoerling, M.P.; Kanikicharla, K.K.; Koster, R.D.; Lyon, B.; et al. Global meteorological drought: A synthesis of current understanding with a focus on sst drivers of precipitation deficits. J. Clim. 2016, 29, 3989–4019. [Google Scholar] [CrossRef]
- Van Loon, A.F. Hydrological drought explained. Wiley Interdiscip. Rev. Water 2015, 2, 359–392. [Google Scholar] [CrossRef]
- Dai, A. Drought under global warming: A review. Wiley Interdiscip. Rev. Clim. Chang. 2011, 2, 45–65. [Google Scholar] [CrossRef]
- Masih, I.; Maskey, S.; Mussá, F.E.F.; Trambauer, P. A review of droughts on the African continent: A geospatial and long-term perspective. Hydrol. Earth Syst. Sci. 2014, 18, 3635–3649. [Google Scholar] [CrossRef]
- Jaramillo, F.; Destouni, G. Local flow regulation and irrigation raise global human water consumption and footprint. Science 2015, 350, 1248–1251. [Google Scholar] [CrossRef] [PubMed]
- Hao, Z.; AghaKouchak, A.; Nakhjiri, N.; Farahmand, A. Global integrated drought monitoring and prediction system. Sci. Data 2014, 1. [Google Scholar] [CrossRef] [PubMed]
- Rosenzweig, C.; Hillel, D. Climate Variability and the Global Harvest: Impacts of El Niño and Other Oscillations on Agroecosystems; Oxford University Press: New York, NY, USA, 2008. [Google Scholar]
- Guha-Sapir, D.; Below, R.; Hoyois, P. EM-DAT: The CRED/OFDA International Disaster Database. Université Catholique de Louvain, 2016. Available online: www.emdat.be (accessed on 2 November 2016).
- Propastin, P.; Fotso, L.; Kappas, M. Assessment of vegetation vulnerability to ENSO warm events over Africa. Int. J. Appl. Earth Obs. Geoinf. 2010, 12S, S83–S89. [Google Scholar] [CrossRef]
- Food and Agriculture Organization of the United Nations (FAO). El Niño Set to Have a Devastating Impact on Southern Africa’s Harvests and Food Security. Joint Statement by FAO, EC-JRC, FEWS NET andWFP. 2016. Available online: http://www.fao.org/news/story/en/item/382932/icode/ (accessed on 10 January 2017).
- Naumann, G.; Dutra, E.; Barbosa, P.; Pappenberger, F.; Wetterhall, F.; Vogt, J.V. Comparison of drought indicators derived from multiple data sets over Africa. Hydrol. Earth Syst. Sci. 2014, 18, 1625–1640. [Google Scholar] [CrossRef]
- Rojas, O.; Vrieling, A.; Rembold, F. Assessing drought probability for agricultural areas in Africa with coarse resolution remote sensing imagery. Remote Sens. Environ. 2011, 115, 343–352. [Google Scholar] [CrossRef]
- Meroni, M.; Verstraete, M.M.; Rembold, F.; Urbano, F.; Kayitakire, F. A phenology-based method to derive biomass production anomalies for food security monitoring in the Horn of Africa. Int. J. Remote Sens. 2014, 35, 2472–2492. [Google Scholar] [CrossRef]
- Eerens, H.; Haesen, D.; Rembold, F.; Urbano, F.; Tote, C.; Bydekerke, L. Image time series processing for agriculture monitoring. Environ. Model. Softw. 2014, 53, 154–162. [Google Scholar] [CrossRef]
- Steinemann, A.C.; Hayes, M.J.; Cavalcanti, L.F. Drought Indicators and Triggers. In Drought and Water Crises: Science, Technology, and Management Issues; Wilhite, D.A., Ed.; Taylor & Francis: Boca Raton, FL, USA, 2005; Chapter 4; pp. 71–92. [Google Scholar]
- Zargar, A.; Sadiq, R.; Naser, B.; Khan, F.I. A review of drought indices. Environ. Rev. 2011, 19, 333–349. [Google Scholar] [CrossRef]
- Svoboda, M.; LeComte, D.; Hayes, M.; Heim, R.; Gleason, K.; Angel, J.; Rippey, B.; Tinker, R.; Palecki, M.; Stooksbury, D.; et al. The drought monitor. Bull. Am. Meteorol. Soc. 2002, 83, 1181–1190. [Google Scholar]
- Deng, M.X.; Di, L.P.; Han, W.G.; Yagci, A.L.; Peng, C.M.; Heo, G. Web-service-based Monitoring and Analysis of Global Agricultural Drought. Photogramm. Eng. Remote Sens. 2013, 79, 929–943. [Google Scholar] [CrossRef]
- Senay, G.B.; Velpuri, N.M.; Bohms, S.; Budde, M.; Young, C.; Rowland, J.; Verdin, J.P. Drought Monitoring and Assessment : Remote Sensing and Modeling Approaches for the Famine Early Warning Systems Network. Hydro-Meteorol. Hazards Risks Disasters 2015, 233–262. [Google Scholar] [CrossRef]
- Sheffield, J.; Wood, E.F.; Chaney, N.; Guan, K.; Sadri, S.; Yuan, X.; Olang, L.; Amani, A.; Ali, A.; Demuth, S.; et al. A drought monitoring and forecasting system for sub-sahara african water resources and food security. Bull. Am. Meteorol. Soc. 2014, 95, 861–882. [Google Scholar] [CrossRef]
- Knauer, K.; Gessner, U.; Dech, S.; Kuenzer, C. Remote sensing of vegetation dynamics in West Africa. Int. J. Remote Sens. 2014, 35, 6357–6396. [Google Scholar] [CrossRef]
- Karlson, M.; Ostwald, M. Remote sensing of vegetation in the Sudano-Sahelian zone: A literature review from 1975 to 2014. J. Arid Environ. 2016, 124, 257–269. [Google Scholar] [CrossRef]
- Mbow, C.; Brandt, M.; Ouedraogo, I.; de Leeuw, J.; Marshall, M. What four decades of earth observation tell us about land degradation in the Sahel? Remote Sens. 2015, 7, 4048–4067. [Google Scholar] [CrossRef]
- Anderson, W.B.; Zaitchik, B.F.; Hain, C.R.; Anderson, M.C.; Yilmaz, M.T.; Mecikalski, J.; Schultz, L. Towards an integrated soil moisture drought monitor for East Africa. Hydrol. Earth Syst. Sci. 2012, 16, 2893–2913. [Google Scholar] [CrossRef]
- AghaKouchak, A. A multivariate approach for persistence-based drought prediction: Application to the 2010–2011 East Africa drought. J. Hydrol. 2015, 526, 127–135. [Google Scholar] [CrossRef]
- Dutra, E.; Magnusson, L.; Wetterhall, F.; Cloke, H.L.; Balsamo, G.; Boussetta, S.; Pappenberger, F. The 2010–2011 drought in the Horn of Africa in ECMWF reanalysis and seasonal forecast products. Int. J. Climatol. 2013, 33, 1720–1729. [Google Scholar] [CrossRef]
- Brown, M.E.; Funk, C.C. Early Warning of Food Security Crises in Urban Areas: The Case of Harare, Zimbabwe, 2007. In Geospatial Techniques in Urban Hazard and Disaster Analysis; Springer: Dordrecht, The Netherlands; New York, NY, USA, 2010; pp. 229–241. [Google Scholar]
- Mutowo, G.; Chikodzi, D. Remote sensing based drought monitoring in Zimbabwe. Disaster Prev. Manag. 2014, 23, 549–659. [Google Scholar] [CrossRef]
- Rouault, M.; Richard, Y. Intensity and spatial extent of droughts in southern Africa. Geophys. Res. Lett. 2005, 32, 2–5. [Google Scholar] [CrossRef]
- Chisadza, B.; Tumbare, M.J.; Nyabeze, W.R.; Nhapi, I. Linkages between local knowledge drought forecasting indicators and scientific drought forecasting parameters in the Limpopo River Basin in Southern Africa. Int. J. Disaster Risk Reduct. 2015, 12, 226–233. [Google Scholar] [CrossRef]
- Naumann, G.; Barbosa, P.; Carrao, H.; Singleton, A.; Vogt, J. Monitoring drought conditions and their uncertainties in Africa using TRMM data. J. Appl. Meteorol. Climatol. 2012, 51, 1867–1874. [Google Scholar] [CrossRef]
- Vicente-Serrano, S.M.; Cabello, D.; Tomás-Burguera, M.; Martín-Hernández, N.; Beguería, S.; Azorin-Molina, C.; Kenawy, A.E. Drought variability and land degradation in semiarid regions: Assessment using remote sensing data and drought indices (1982–2011). Remote Sens. 2015, 7, 4391–4423. [Google Scholar] [CrossRef]
- Meque, A.; Abiodun, B.J. Simulating the link between ENSO and summer drought in Southern Africa using regional climate models. Clim. Dyn. 2015, 44, 1881–1900. [Google Scholar] [CrossRef]
- Anyamba, A.; Tucker, C.J.; Mahoney, R. From El Niño to La Niña: Vegetation response patterns over east and southern Africa during the 1997–2000 period. J. Clim. 2002, 15, 3096. [Google Scholar] [CrossRef]
- Crétat, J.; Richard, Y.; Pohl, B.; Rouault, M.; Reason, C.; Fauchereau, N. Recurrent daily rainfall patterns over South Africa and associated dynamics during the core of the austral summer. Int. J. Climatol. 2012, 32, 261–273. [Google Scholar] [CrossRef]
- Philippon, N.; Martiny, N.; Camberlin, P.; Hoffman, M.T.; Gond, V. Timing and patterns of the ENSO signal in Africa over the last 30 years: Insights from Normalized Difference Vegetation Index Data. J. Clim. 2014, 27, 2509–2532. [Google Scholar] [CrossRef]
- Jones, A.; Breuning-Madsen, H.; Brossard, M.; Dampha, A.; Deckers, J.; Dewitte, O.; Gallali, T.; Hallett, S.; Jones, R.; Kilasara, M.; et al. Soil Atlas of Africa; Publications Office of the European Union: Luxembourg, 2013. [Google Scholar]
- Peel, M.C.; Finlayson, B.L.; McMahon, T.A. Updated world map of the Köppen-Geiger climate classification. Meteorol. Z. 2007, 15, 259–263. [Google Scholar]
- UNEP. Africa: Atlas of Our Changing Environment; United Nations Environment Programme: Nairobi, Kenya, 2008. [Google Scholar]
- European Space Agency (ESA) CCI Land Cover. Land Cover Maps: Three Global LC Maps for the 2000, 2005 and 2010 Epochs. 2014. Available online: https://www.esa-landcover-cci.org/?q=node/158 (accessed on 16 March 2017).
- Vermote, E. MOD09A1 MODIS/Terra Surface Reflectance 8-Day L3 Global 500 m SIN Grid V006. NASA EOSDIS Land Processes DAAC; 2015. Available online: https://lpdaac.usgs.gov/node/804 (accessed on 6 August 2016).
- Tucker, C.J. Red and photographic infrared linear combinations for monitoring vegetation. Remote Sens. Environ. 1979, 8, 127–150. [Google Scholar] [CrossRef]
- Kogan, F.N. Remote sensing of weather impacts on vegetation in non-homogeneous areas. Int. J. Remote Sens. 1990, 11, 1405–1419. [Google Scholar] [CrossRef]
- Kogan, F.; Sullivan, J. Development of global drought-watch system using NOAA/AVHRR data. Adv. Space Res. 1993, 13, 219–222. [Google Scholar] [CrossRef]
- Thenkabail, P.S.; Gamage, M.S.D.N.; Smakhtin, V.U. The Use of Remote-Sensing Data for Drought Assessment and Monitoring in Southwest Asia. Int. Water Manag. Inst. Res. Rep. 2004, 85, 1–22. [Google Scholar]
- Unganai, L.S.; Kogan, F.N. Drought Monitoring and Corn Yield Estimation in Southern Africa from AVHRR Data. Remote Sens. Environ. 1998, 63, 219–232. [Google Scholar] [CrossRef]
- McKee, T.B.; Doesken, N.J.; Kleist, J. The relationship of drought frequency and duration to time scales. In Proceedings of the AMS 8th Conference on Applied Climatology, Anaheim, CA, USA, 17–22 January 1993; pp. 179–184. [Google Scholar]
- Huffman, G.J.; Bolvin, D.T.; Nelkin, E.J.; Wolff, D.B.; Adler, R.F.; Gu, G.; Hong, Y.; Bowman, K.P.; Stocker, E.F. The TRMM Multisatellite Precipitation Analysis (TMPA): Quasi-Global, Multiyear, Combined-Sensor Precipitation Estimates at Fine Scales. J. Hydrometeorol. 2007, 8, 38–55. [Google Scholar] [CrossRef]
- Tropical Rainfall Measuring Mission (TRMM). TRMM (TMPA/3B43) Rainfall Estimate L3 1 Month 0.25 Degree ×0.25 Degree V7, Greenbelt, MD, Goddard Earth Sciences Data and Information Services Center (GES DISC). 2011. Available online: http://disc.gsfc.nasa.gov/datacollection/TRMM_3B43_7.html (accessed on 6 August 2016).
- World Meteorologic Organization (WMO). Standardized Precipitation Index User Guide; Svoboda, M., Hayes, M., Wood, D., Eds.; WMO-No. 1090; WMO: Geneva, Switzerland, 2012. [Google Scholar]
- Keyantash, J.; National Center for Atmospheric Research Staff. The Climate Data Guide: Standardized Precipitation Index (SPI). 2016. Available online: https://climatedataguide.ucar.edu/climate-data/standardized-precipitation-index-spi (accessed on 19 November 2016).
- Asadi Zarch, M.A.; Sivakumar, B.; Sharma, A. Droughts in a warming climate: A global assessment of Standardized precipitation index (SPI) and Reconnaissance drought index (RDI). J. Hydrol. 2015, 526, 183–195. [Google Scholar] [CrossRef]
- R Core Team. R: A Language and Environment for Statistical Computing; R Foundation for Statistical Computing: Vienna, Austria, 2013; Available online: https://www.R-project.org (accessed on 8 November 2016).
- Food and Agriculture Organization of the United Nations (FAO). Food and Agriculture Organization Corporate Statistical Database (FAOSTAT): Crop Statistics. 2016. Available online: http://www.fao.org/faostat/en/#data (accessed on 29 October 2016).
- Eklundh, L.; Jönsson, P. TIMESAT: A Software Package for Time-Series Processing and Assessment of Vegetation Dynamics. In Remote Sensing Time Series; Kuenzer, C., Dech, S., Wagner, W., Eds.; Springer: Cham, Switzerland, 2015; Chapter 7; pp. 141–158. [Google Scholar]
- Savitzky, A.; Golay, M.J.E. Smoothing and Differentiation of Data by Simplified Least Squares Procedures. Anal. Chem. 1964, 36, 1627–1639. [Google Scholar] [CrossRef]
- Kogan, F.N. Application of vegetation index and brightness temperature for drought detection. Adv. Space Res. 1995, 15, 91–100. [Google Scholar] [CrossRef]
- Gebrehiwot, T.; Veen, A.V.D.; Maathuis, B. Spatial and temporal assessment of drought in the Northern highlands of Ethiopia. Int. J. Appl. Earth Obs. Geoinf. 2011, 13, 309–321. [Google Scholar] [CrossRef]
- Klisch, A.; Atzberger, C. Operational drought monitoring in Kenya using MODIS NDVI time series. Remote Sens. 2016, 8, 267. [Google Scholar] [CrossRef]
- Viste, E.; Korecha, D.; Sorteberg, A. Recent drought and precipitation tendencies in Ethiopia. Theor. Appl. Climatol. 2013, 112, 535–551. [Google Scholar] [CrossRef]
- Rulinda, C.M.; Dilo, A.; Bijker, W.; Stein, A. Characterising and quantifying vegetative drought in East Africa using fuzzy modelling and NDVI data. J. Arid Environ. 2012, 78, 169–178. [Google Scholar] [CrossRef]
- Mussá, F.E.F.; Zhou, Y.; Maskey, S.; Masih, I.; Uhlenbrook, S. Groundwater as an emergency source for drought mitigation in the Crocodile River catchment, South Africa. Hydrol. Earth Syst. Sci. 2015, 19, 1093–1106. [Google Scholar] [CrossRef]
- Jayanthi, H.; Husak, G.J.; Funk, C.; Magadzire, T.; Chavula, A.; Verdin, J.P. Modeling rain-fed maize vulnerability to droughts using the standardized precipitation index from satellite estimated rainfallamp—Southern Malawi case study. Int. J. Disaster Risk Reduct. 2013, 4, 71–81. [Google Scholar] [CrossRef]
- Du, L.; Tian, Q.; Yu, T.; Meng, Q.; Jancso, T.; Udvardy, P.; Huang, Y. A comprehensive drought monitoring method integrating MODIS and TRMM data. Int. J. Appl. Earth Obs. Geoinf. 2013, 23, 245–253. [Google Scholar] [CrossRef]
- Herrmann, S.M.; Anyamba, A.; Tucker, C.J. Recent trends in vegetation dynamics in the African Sahel and their relationship to climate. Glob. Environ. Chang. 2005, 15, 394–404. [Google Scholar] [CrossRef]
- Sepulcre-Canto, G.; Horion, S.; Singleton, A.; Carrao, H.; Vogt, J. Development of a Combined Drought Indicator to detect agricultural drought in Europe. Nat. Hazards Earth Syst. Sci. 2012, 12, 3519–3531. [Google Scholar] [CrossRef]
- Siebert, S.; Henrich, V.; Frenken, K.; Burke, J. Global Map of Irrigation Areas Version 5. Rheinische Friedrich-Wilhelms-University, Bonn, Germany/Food and Agriculture Organization of the United Nations: Rome, Italy, 2013. Available online: http://www.fao.org/nr/water/aquastat/irrigationmap/ (accessed on 25 July 2017).
- Hayes, M.J.; Svoboda, M.D.; Wardlow, B.D.; Anderson, M.C.; Kogan, F. Drought Monitoring Historical and Current Perspectives. In Remote Sensing of Drought: Innovative Monitoring Approaches; Wardlow, B.D., Anderson, M.C., Verdin, J.P., Eds.; CRC Press: Boca Raton, FL, USA, 2012; Chapter 1; pp. 1–19. [Google Scholar]
- Hawinkel, P.; Thiery, W.; Lhermitte, S.; Swinnen, E.; Verbist, B.; Van Orshoven, J.; Muys, B. Vegetation response to precipitation variability in East Africa controlled by biogeographical factors. J. Geophys. Res. Biogeosci. 2016, 121, 2422–2444. [Google Scholar] [CrossRef]
- Niang, I.; Ruppel, M.A.; Abdrabo, A.; Essel, C.; Lennard, J.; Padgham, J.; Urquhart, P. Africa. Climate Change 2014: Impacts, Adaptation, and Vulnerability. Part B: Regional Aspects. Contribution of Working Group II to the Fifth Assessment Report of the Intergovernmental Panel on Climate Change; Barros, V., Field, C., Dokken, D.J., Mastrandrea, M., Mach, K., Bilir, T., Chatterjee, M., Ebi, K., Estrada, Y., Genova, R., et al., Eds.; Cambridge University Press: Cambridge, UK; New York, NY, USA, 2014; pp. 1199–1265. [Google Scholar]
- Richard, Y.; Trzaska, S.; Roucou, P.; Rouault, M. Modification of the southern African rainfall variability/ ENSO relationship since the late 1960s. Clim. Dyn. 2000, 16, 883–895. [Google Scholar] [CrossRef]
- Indeje, M.; Semazzi, F.H.M.; Ogallo, L.J. ENSO signals in East African rainfall seasons. Int. J. Climatol. 2000, 20, 19–46. [Google Scholar] [CrossRef]
- Preethi, B.; Sabin, T.P.; Adedoyin, J.A.; Ashok, K. Impacts of the ENSO Modoki and other Tropical Indo-Pacific Climate-Drivers on African Rainfall. Sci. Rep. 2015, 5, 16653. [Google Scholar] [CrossRef] [PubMed]
- Ropelewski, C.F.; Halpert, M.S. Global and Regional Scale Precipitation Patterns Associated with the El Niño/Southern Oscillation. Mon. Weather Rev. 1987, 115, 1606–1626. [Google Scholar] [CrossRef]
- Yang, X.; DelSole, T. Systematic comparison of enso teleconnection patterns between models and observations. J. Clim. 2012, 25, 425–446. [Google Scholar] [CrossRef]
- Kuenzer, C.; Zhao, D.; Scipal, K.; Sabel, D.; Naeimi, V.; Bartalis, Z.; Hasenauer, S.; Mehl, H.; Dech, S.; Wagner, W. El Niño southern oscillation influences represented in ERS scatterometer-derived soil moisture data. Appl. Geogr. 2009, 29, 463–477. [Google Scholar] [CrossRef]
- Manatsa, D.; Mushore, T.; Lenouo, A. Improved predictability of droughts over southern Africa using the standardized precipitation evapotranspiration index and ENSO. Theor. Appl. Climatol. 2017, 127, 259–274. [Google Scholar] [CrossRef]
- Ratnam, J.V.; Behera, K.; Masumoto, Y.; Yamagata, T. Remote Effects of El Niño and Modoki Events on the Austral Summer Precipitation of Southern Africa. J. Clim. 2014, 27, 3802–3815. [Google Scholar] [CrossRef]
- Rojas, O.; Li, Y.; Cumani, R. Understanding the Drought Impact of El Niño on the Global Agricultural Areas: An Assessment Using FAO’s Agricultural Stress Index (ASI); FAO: Rome, Italy, 2014. [Google Scholar]
- Maisongrande, P.; Duchemin, B.; Dedieu, G. VEGETATION/SPOT: An operational mission for the Earth monitoring; presentation of new standard products. Int. J. Remote Sens. 2004, 25, 9–14. [Google Scholar] [CrossRef]
- Dierckx, W.; Sterckx, S.; Benhadj, I.; Livens, S.; Duhoux, G.; Achteren, T.V.; Francois, M.; Mellab, K.; Saint, G. PROBA-V mission for global vegetation monitoring: Standard products and image quality. Int. J. Remote Sens. 2014, 35, 2589–2614. [Google Scholar] [CrossRef]
- U.S. Geological Survey (USGS). Remote Sensing Phenology. NDVI from AVHRR; 2015. Available online: https://phenology.cr.usgs.gov/ndvi_avhrr.php (accessed on 10 January 2017).
- Dinku, T.; Ceccato, P.; Grover-Kopec, E.; Lemma, M.; Connor, S.J.; Ropelewski, C.F. Validation of satellite rainfall products over East Africa’s complex topography. Int. J. Remote Sens. 2007, 28, 1503–1526. [Google Scholar] [CrossRef]


| Dataset | TRMM 3B43 (V7) | MODIS MOD09A1 (V6) | ESA CCI-LC 2010 |
|---|---|---|---|
| Variable | Precipitation rate (mm/h) | Surface reflectance | Land Cover classification |
| Source | TRMM, gauge analysis | MODIS | MERIS and SPOT-Vegetation |
| Temporal coverage | 1 January 1998 to present | 26 February 2000 to present | 2008–2012 |
| Spatial coverage | 50 S to 50N | Global | Global |
| Temporal resolution | 1 month | 8 days (composite) | no time series |
| Spatial resolution | × | 500 m | 300 m |
| Data format | netCDF | HDF | GeoTIFF |
| Drought Category | SPI Range | VCI Range (%) |
|---|---|---|
| Extreme drought | SPI ≤ −2 | VCI < 10 |
| Severe drought | −2 < SPI ≤ −1.5 | 10 ≤ VCI ≤ 20 |
| Moderate drought | −1.5 < SPI ≤ −1 | 20 < VCI < 35 |
| No drought | SPI > −1 | VCI ≥ 35 |
| Region | Years | Countries * Affected by Drought Based on | |
|---|---|---|---|
| Rainfall Anomalies | Vegetation Condition | ||
| (Relative Duration of SPI-3 <−1) | (Relative Duration of VCI < 35) | ||
| Eastern Africa | 2000/2001 | ER ET KE SD SO SS | |
| 2001/2002 | ER ET SD | ER ET KE SD SS TA | |
| 2002/2003 | ER ET KE TA | ER ET SD SS KE TA | |
| 2003/2004 | BI ET SD TA | ER ET KE SD SO SS TA | |
| 2004/2005 | BI KE SD SO TA | ER ET KE SD SS TA | |
| 2005/2006 | KE TA | ER ET KE SD SO TA UG | |
| 2006/2007 | SO | ET SD | |
| 2007/2008 | ET KE TA | ER ET KE SO SD TA | |
| ER ET KE SD SO SS UG TA | ER ET KE SD SO SS TA | ||
| 2009/2010 | BI ER RW SD SO SS UG TA | ER ET SD SO SS TA | |
| ER ET KE SD SO SS UG TA | ER ET KE SD SO TA | ||
| 2011/2012 | ET SD SS UG TA | ER ET KE SD SO TA | |
| 2012/2013 | ER SD SS TA UG | ER ET SD SS TA | |
| 2013/2014 | KE RW UG TA | KE SD SO TA | |
| 2014/2015 | ER ET KE UG TA | ER ET KE SD SO TA | |
| 2015/2016 | ER ET KE RW SD SO UG | ER ET SD | |
| Southern Africa | 2000/2001 | AO | AO NA ZA |
| 2001/2002 | AO BW SZ ZA ZW | BW MZ NA ZA ZM ZW | |
| BW NA SZ ZA ZM ZW | BW NA SZ ZA ZM ZW | ||
| 2003/2004 | AO MW SZ | AO BW ZA | |
| BW MW MZ ZM ZW | AO BW MW MZ NA ZA ZM ZW | ||
| 2005/2006 | BW MZ ZA | ||
| 2006/2007 | BW LS ZA | BW LS MZ NA ZA ZW | |
| 2007/2008 | MG MZ ZW | BW MW MZ ZM ZW | |
| 2008/2009 | MG MZ | MZ ZA ZW | |
| 2009/2010 | AO MZ NA ZA | AO ZA | |
| 2010/2011 | MG MW MZ ZA | MZ ZW | |
| 2011/2012 | AO BW LS MZ ZA ZW | AO BW MZ ZW | |
| 2012/2013 | AO BW MG NA ZM ZW | AO BW MW NA ZA ZM ZW | |
| 2013/2014 | MG MZ ZA ZM | MW MZ ZM ZW | |
| AO BW LS MW MZ NA ZA ZM ZW | AO BW LS MW MZ NA SZ ZA ZW | ||
| AO BW LS MG MW MZ NA SZ ZA ZM ZW | BW LS MZ NA SZ ZA ZW | ||
| Years | Countries * Affected by Drought | |
|---|---|---|
| Eastern Africa | Southern Africa | |
| 2000/2001 | MZ SZ ZW | |
| 2001/2002 | UG | LS MW |
| 2002/2003 | RW | MG MZ |
| 2003/2004 | RW | |
| 2004/2005 | RW UG | |
| 2005/2006 | MG MW | |
| 2006/2007 | RW | SZ |
| 2007/2008 | UG | LS MW |
| 2008/2009 | BI | MZ |
| 2009/2010 | MG ZW | |
| 2010/2011 | BI | |
| 2011/2012 | KE TA | MW |
| 2012/2013 | ||
| 2013/2014 | NA | |
| 2014/2015 | MG | |
| 2015/2016 | SS | |
© 2017 by the authors. Licensee MDPI, Basel, Switzerland. This article is an open access article distributed under the terms and conditions of the Creative Commons Attribution (CC BY) license (http://creativecommons.org/licenses/by/4.0/).
Share and Cite
Winkler, K.; Gessner, U.; Hochschild, V. Identifying Droughts Affecting Agriculture in Africa Based on Remote Sensing Time Series between 2000–2016: Rainfall Anomalies and Vegetation Condition in the Context of ENSO. Remote Sens. 2017, 9, 831. https://doi.org/10.3390/rs9080831
Winkler K, Gessner U, Hochschild V. Identifying Droughts Affecting Agriculture in Africa Based on Remote Sensing Time Series between 2000–2016: Rainfall Anomalies and Vegetation Condition in the Context of ENSO. Remote Sensing. 2017; 9(8):831. https://doi.org/10.3390/rs9080831
Chicago/Turabian StyleWinkler, Karina, Ursula Gessner, and Volker Hochschild. 2017. "Identifying Droughts Affecting Agriculture in Africa Based on Remote Sensing Time Series between 2000–2016: Rainfall Anomalies and Vegetation Condition in the Context of ENSO" Remote Sensing 9, no. 8: 831. https://doi.org/10.3390/rs9080831
APA StyleWinkler, K., Gessner, U., & Hochschild, V. (2017). Identifying Droughts Affecting Agriculture in Africa Based on Remote Sensing Time Series between 2000–2016: Rainfall Anomalies and Vegetation Condition in the Context of ENSO. Remote Sensing, 9(8), 831. https://doi.org/10.3390/rs9080831