Effects of Different Types of Front-of-Pack Labelling Information on the Healthiness of Food Purchases—A Randomised Controlled Trial


 , ,
, ,  , , ,
, , ,
Abstract
:1. Introduction
2. Participants and Methods
2.1. Participants
2.2. Recruitment
2.3. Run-in
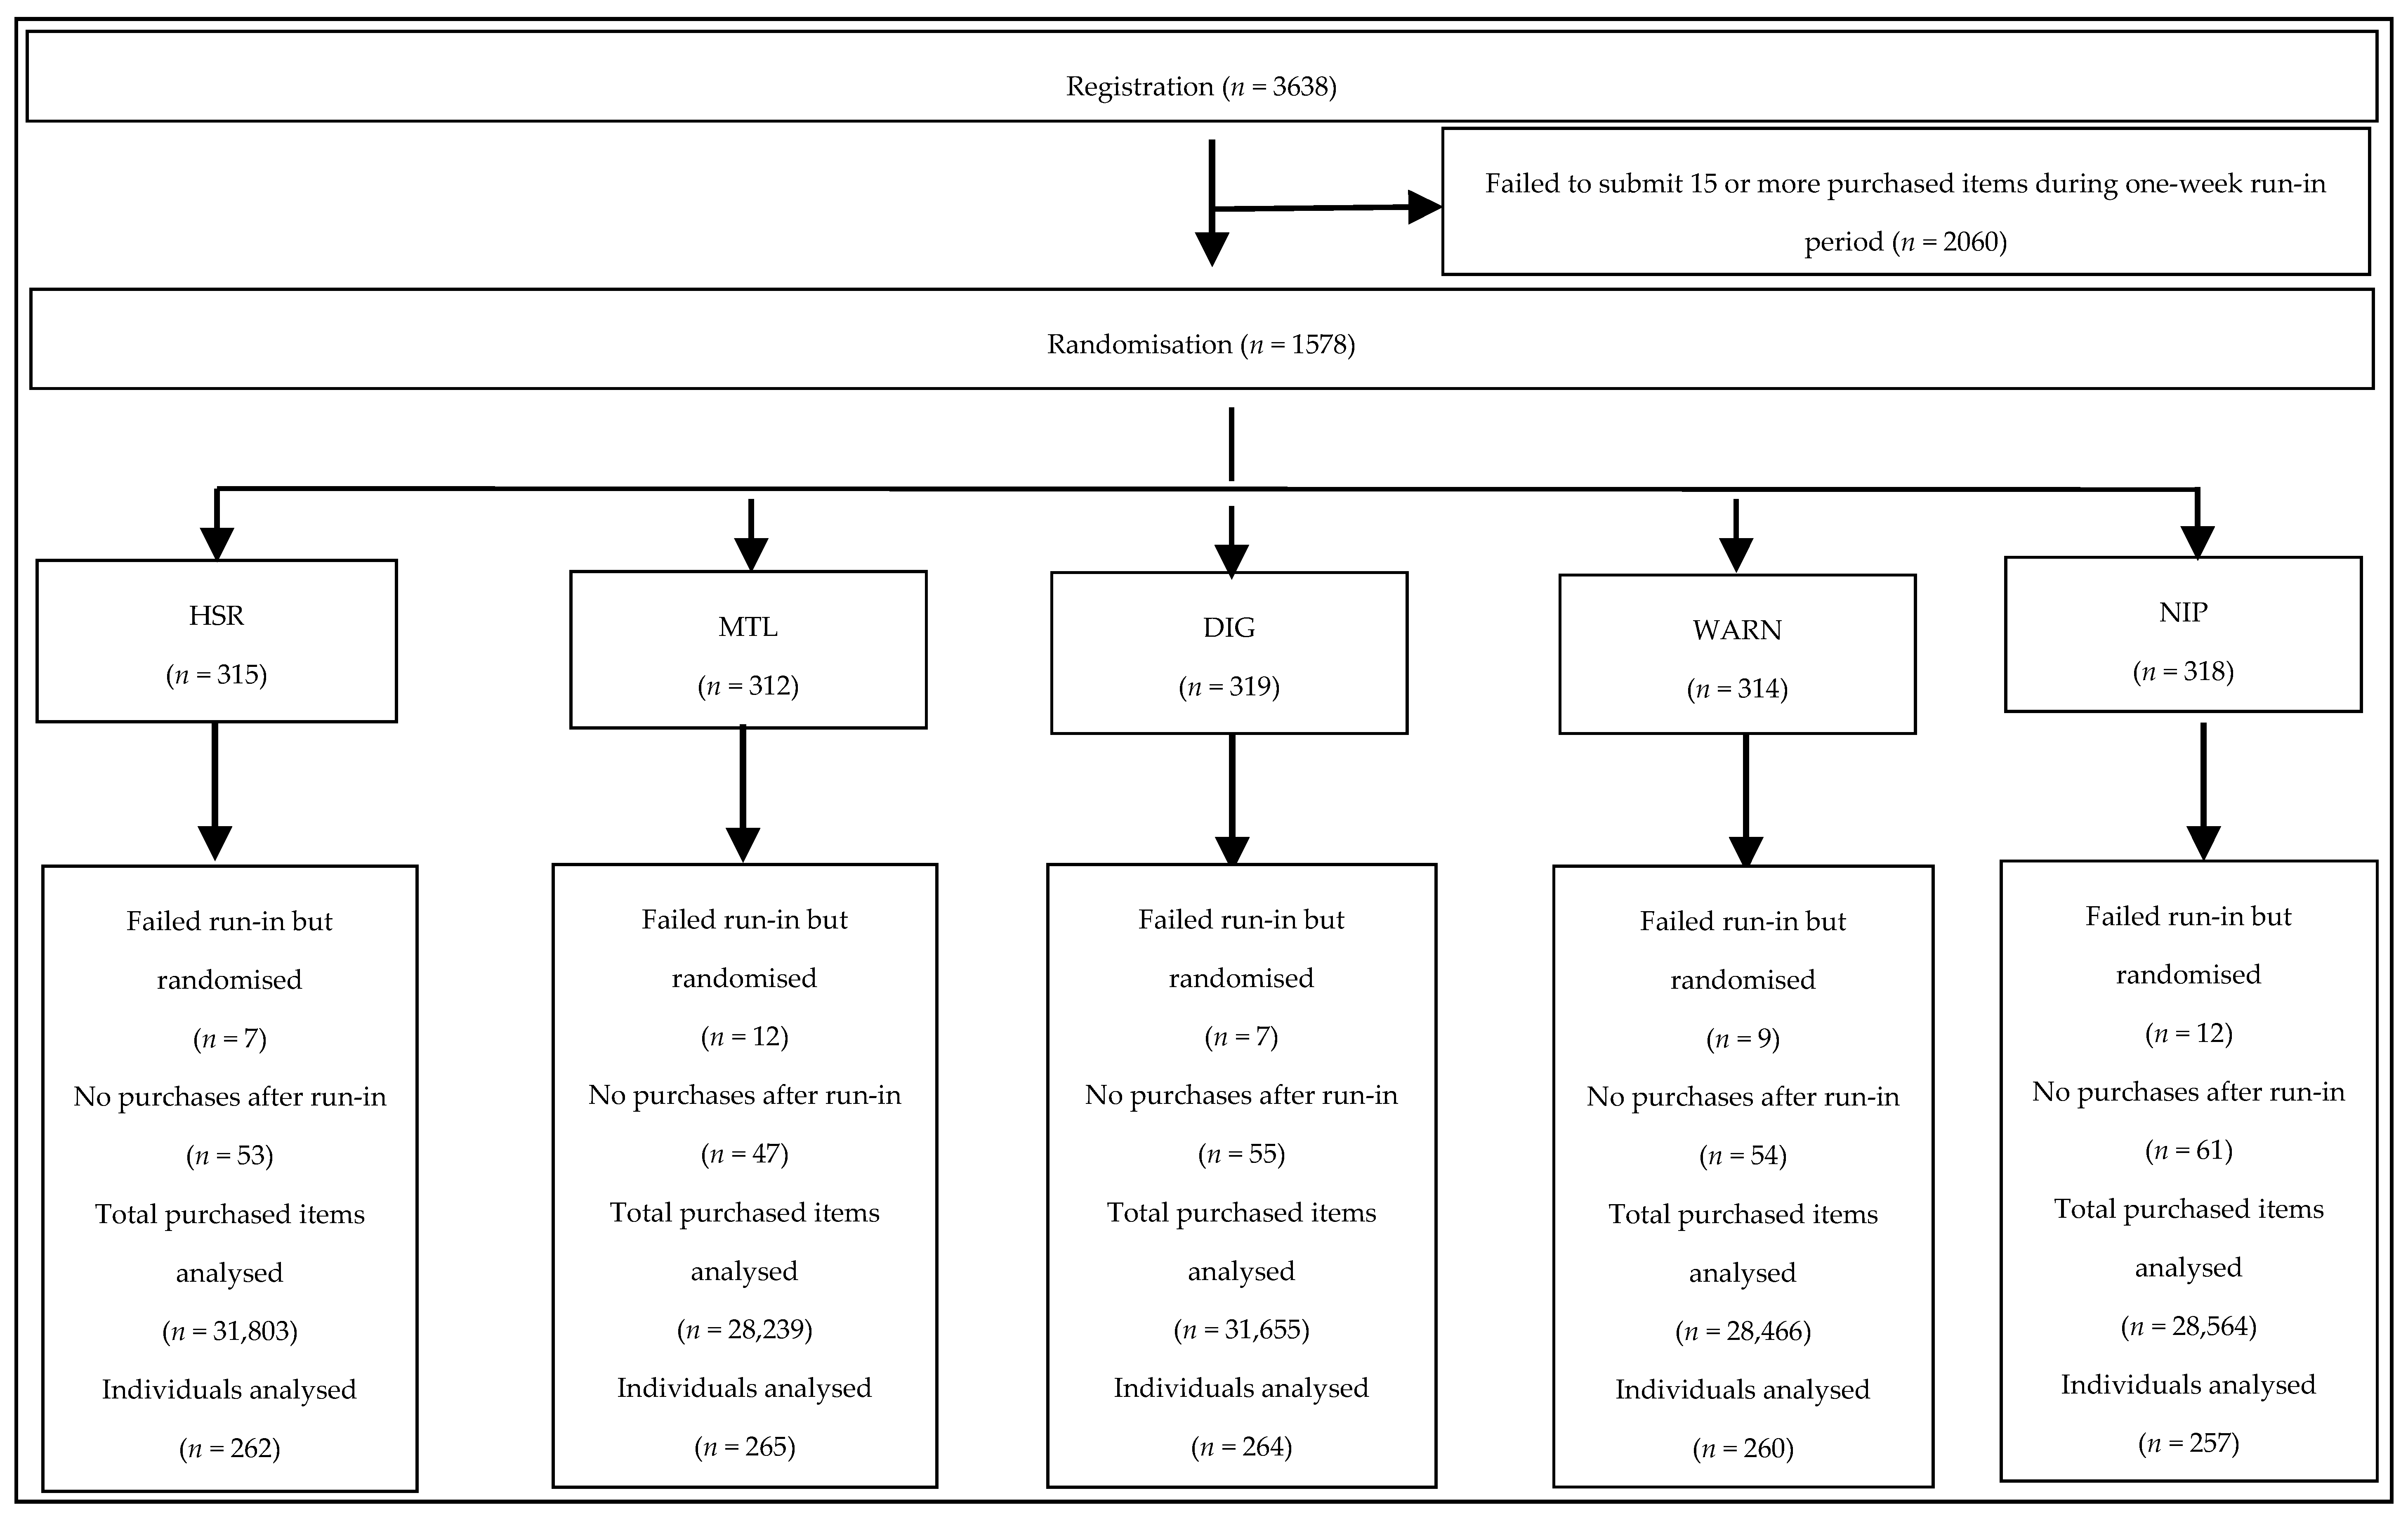
2.4. Randomisation
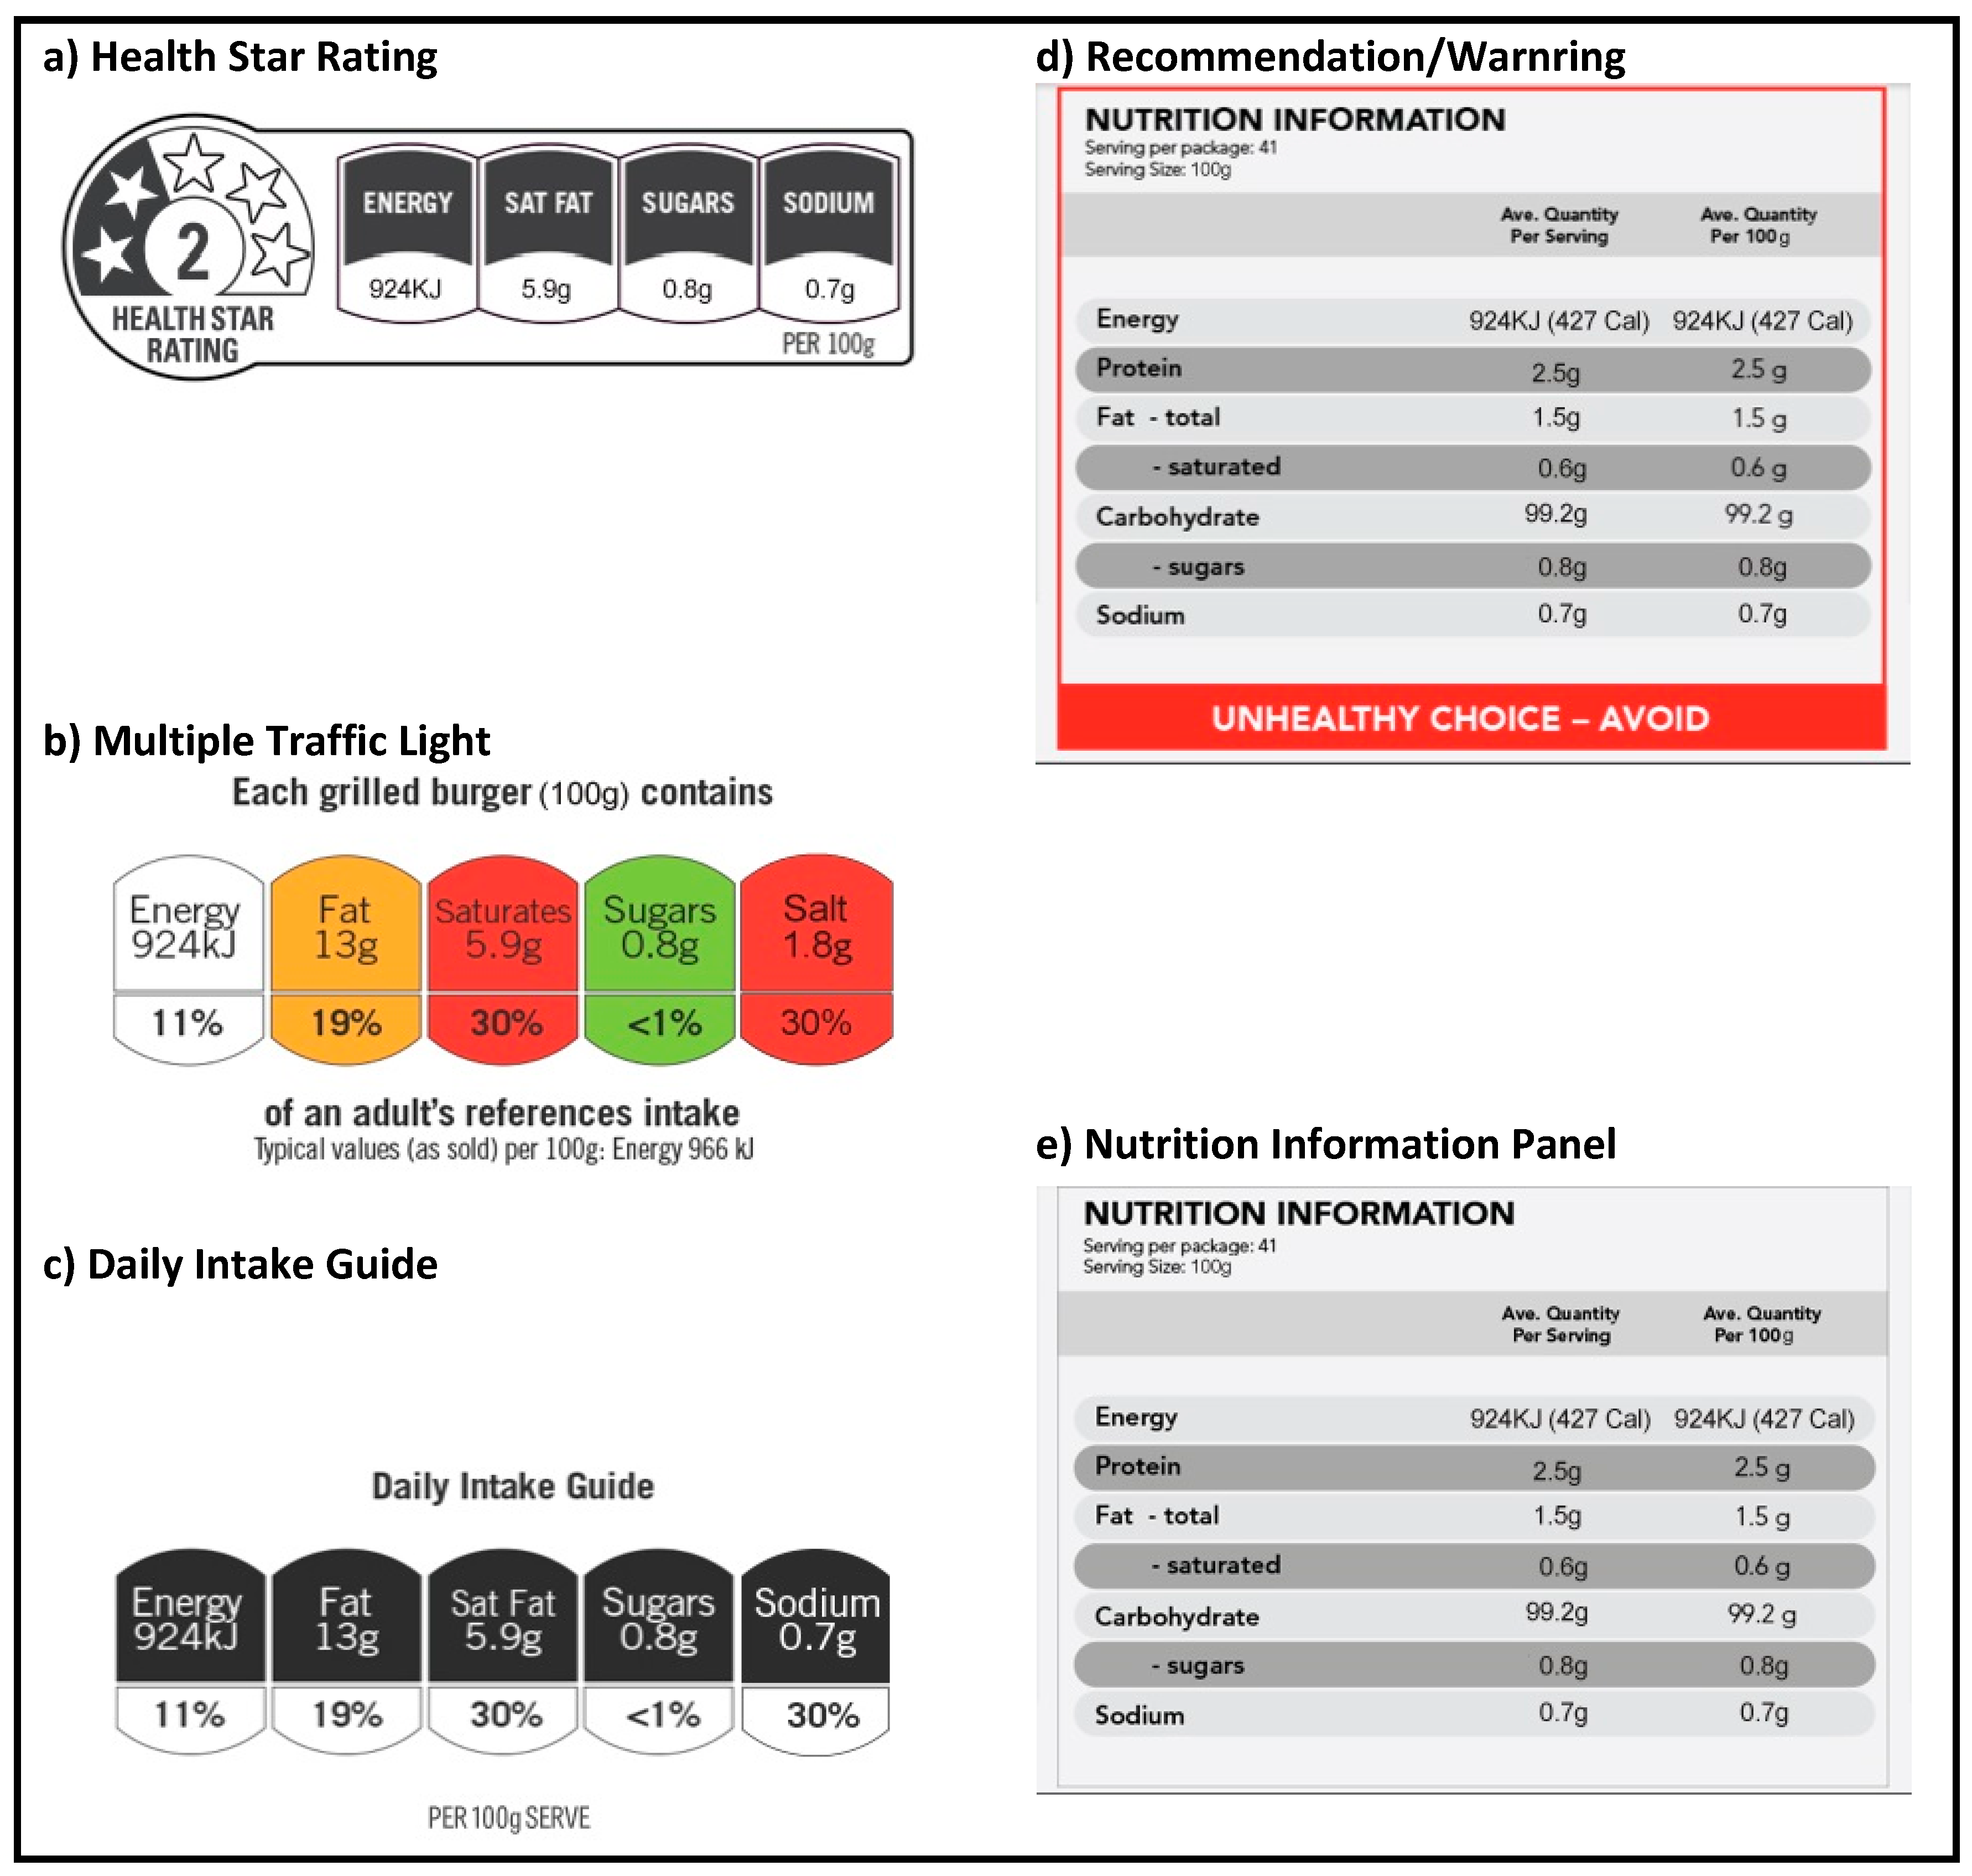
2.5. Intervention and Control
2.6. Data Collection and Follow-Up
2.7. Outcomes
2.8. Ethics
2.9. Statistics
3. Results
3.1. Use of the Smartphone Application and Provision of Follow-Up Data
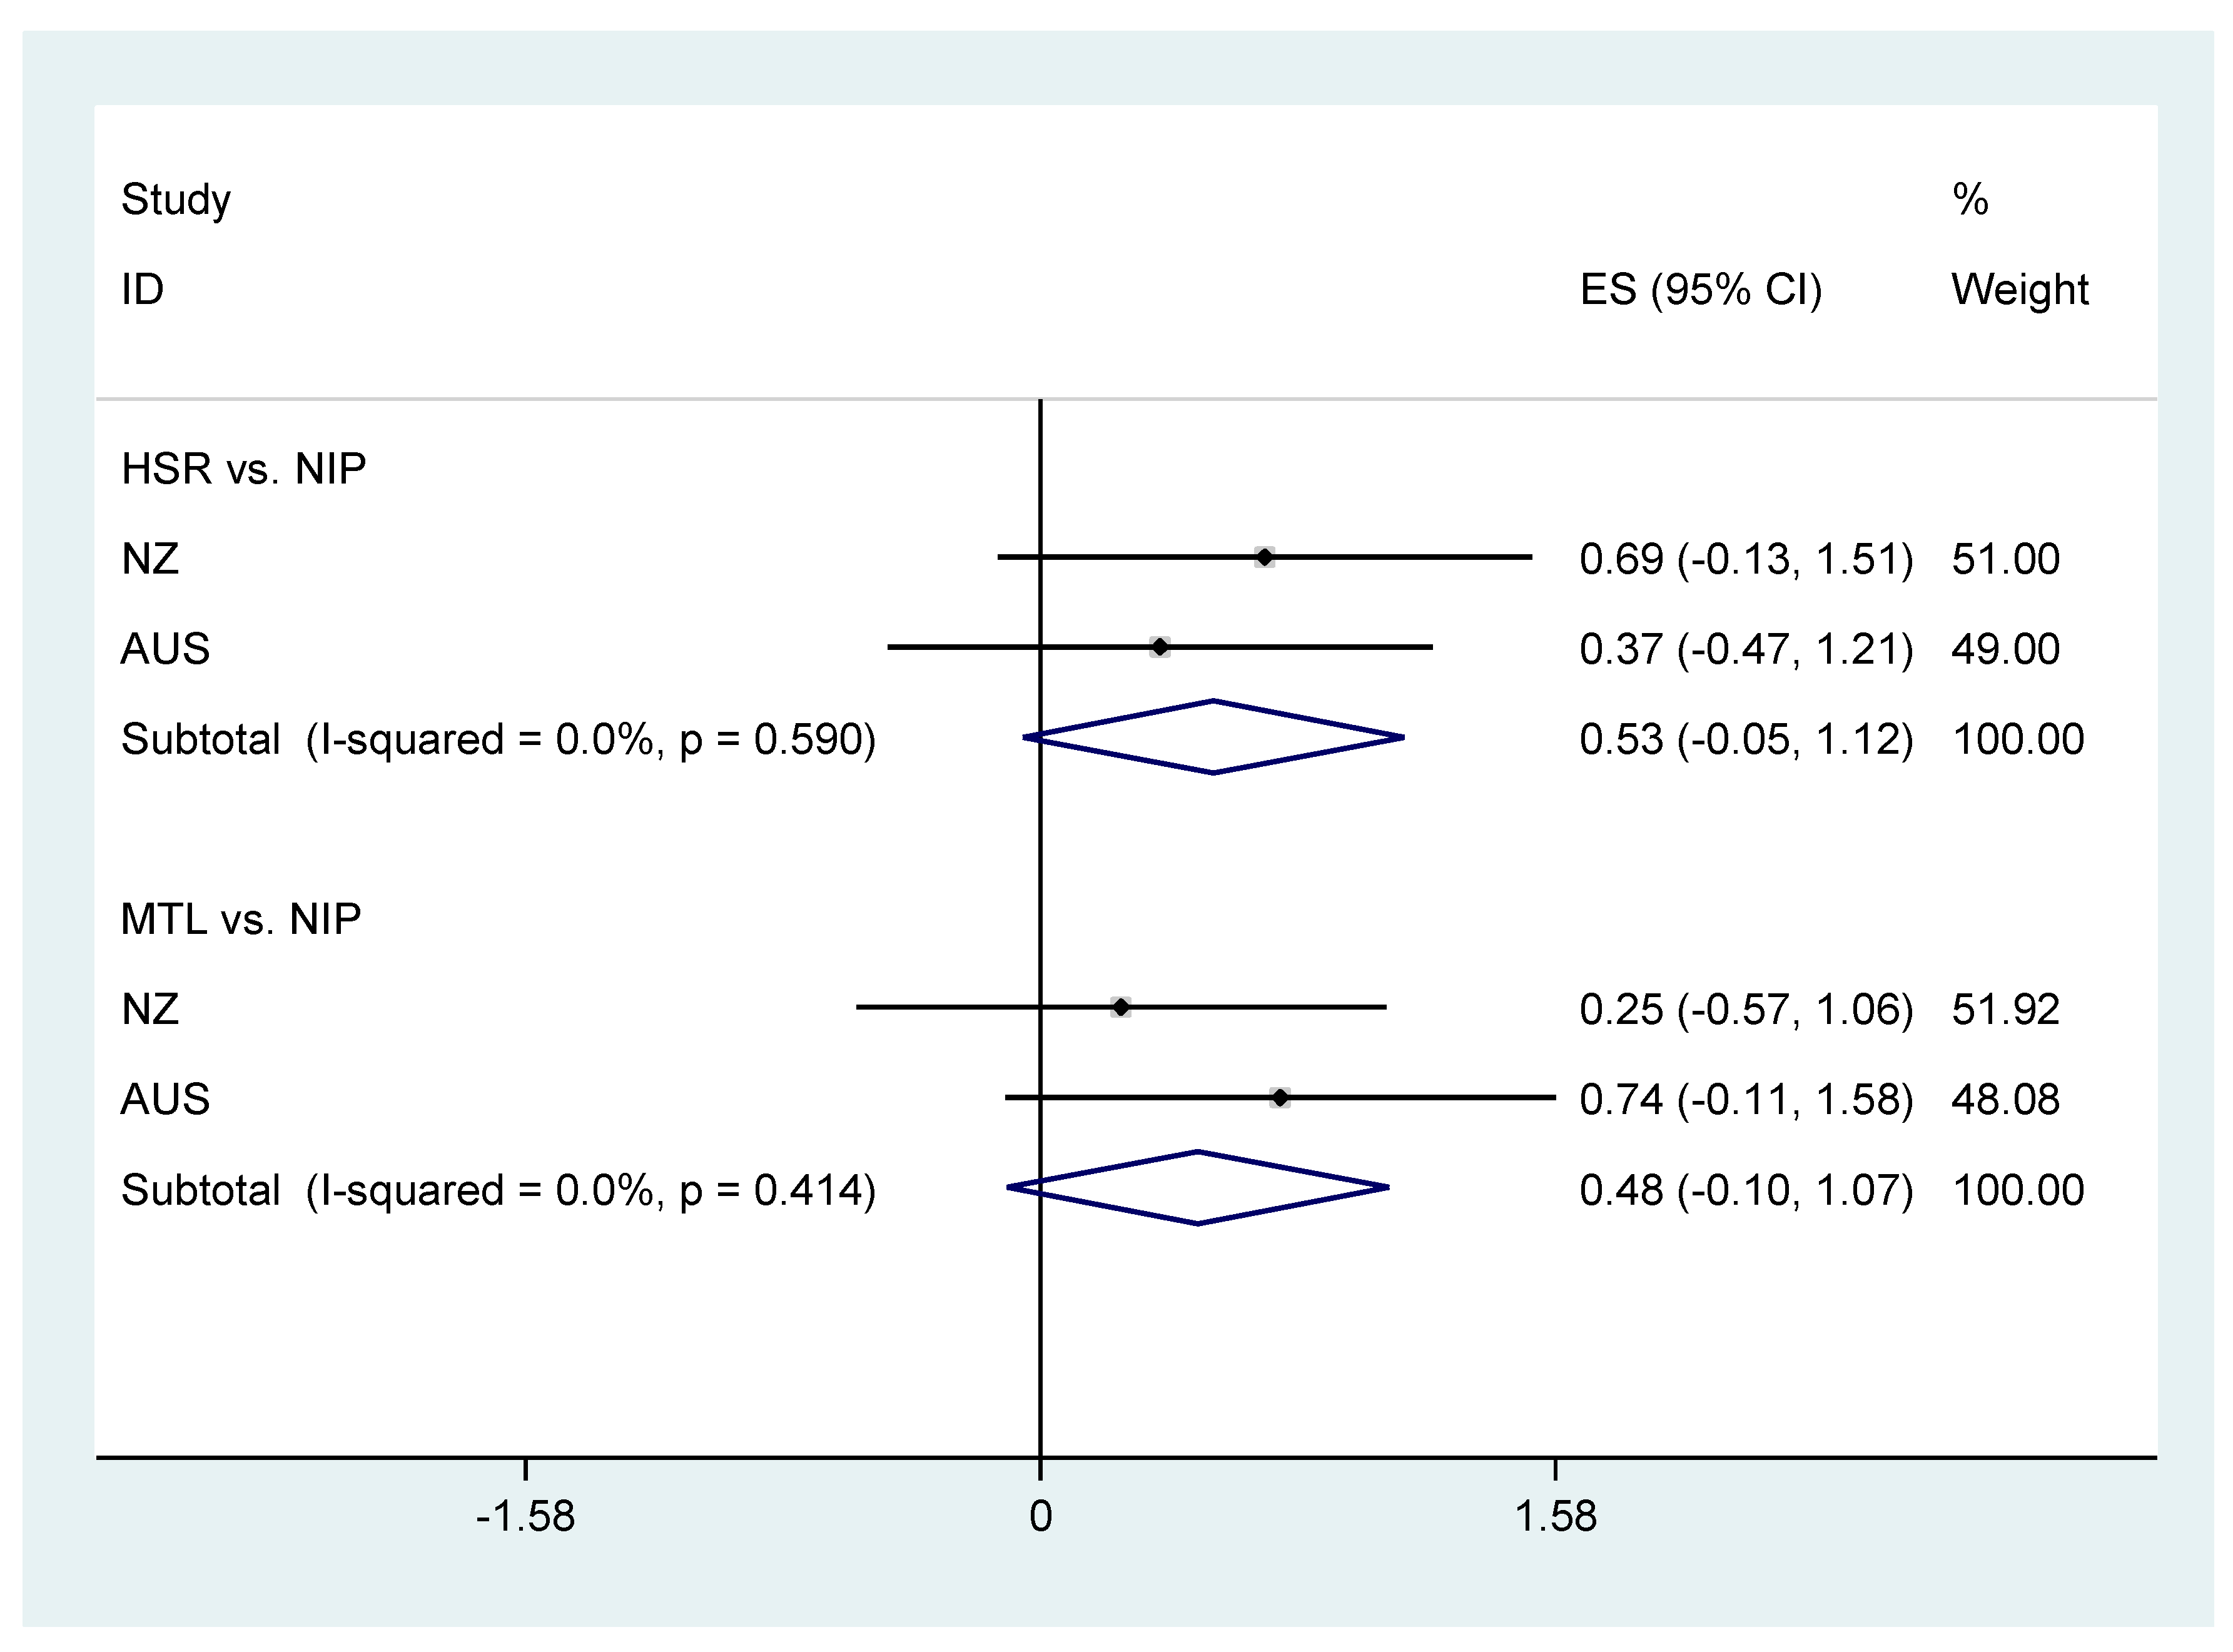
3.2. Healthiness of Food Purchases
3.3. Perceptions of the Labelling Systems
4. Discussion
4.1. Strengths and Weaknesses of the Trial
4.2. The Findings in Context
5. Conclusions and Implications
Acknowledgments
Author Contributions
Conflicts of Interest
Abbreviations
| CI | Confidence Interval |
| DIG | Daily Intake Guides |
| HSR | Health Star Rating |
| MTL | Multiple Traffic Light Labels |
| NIP | Nutrition Information Panel |
| WARN | Recommendations/Warnings |
References
- World Health Organization. Global Action Plan for the Prevention and Treatment of Noncommunicable Diseases 2013–2020; World Health Organization: Geneva, Switzerland, 2013. [Google Scholar]
- Beaglehole, R.; Bonita, R.; Alleyne, G.; Horton, R.; Li, L.; Lincoln, P.; Mbanya, J.C.; McKee, M.; Moodie, R.; Nishtar, S.; et al. UN High-Level Meeting on Non-Communicable Diseases: Addressing four questions. Lancet 2011, 378, 449–455. [Google Scholar] [CrossRef]
- Siegrist, M.; Leins-Hess, R.; Keller, C. Which front-of-pack nutrition label is the most efficient one? The results of an eye-tracker study. Food Qual. Preference 2015, 39, 183–190. [Google Scholar] [CrossRef]
- Young, L.; Swinburn, B. Impact of the Pick the Tick food information programme on the salt content of food in New Zealand. Health Promot. Int. 2002, 17, 13–19. [Google Scholar] [CrossRef] [PubMed]
- Williams, P.; McMahon, A.; Boustead, R. A case study of sodium reduction in breakfast cereals and the impact of the Pick the Tick food information program in Australia. Health Promot. Int. 2003, 18, 51–56. [Google Scholar] [CrossRef] [PubMed]
- European Food Information Council. Global Update on Nutrition Labelling; European Food Information Council: Brussels, Belgium, 2015. [Google Scholar]
- Campos, S.; Doxey, J.; Hammond, D. Nutrition labels on pre-packaged foods: A systematic review. Public Health Nutr. 2011, 14, 1496–1506. [Google Scholar] [CrossRef] [PubMed]
- Department of Health. Guide to Creating a Front of Pack (FoP) Nutrition Label for Pre-Packed Products Sold through Retail Outlets; Department of Health: London, UK, 2013.
- Food Standards Australia New Zealand. Guide for Industry to the Health Star Rating Calculator (HSRC); Food Standards Australia New Zealand: Canberra, Australia, 2015.
- Rahkovsky, I.; Lin, B.-H.; Lin, C.-T.J.; Lee, J.-Y. Effects of the Guiding Stars Program on purchases of ready-to-eat cereals with different nutritional attributes. Food Policy 2013, 43, 100–107. [Google Scholar] [CrossRef]
- Australia Food and Grocery Council. Daily Intake Guide Labelling Canberra 2012. Available online: http://www.afgc.org.au/our-expertise/health-nutrition-and-scientific-affairs/labelling/ (accessed on 23 November 2017).
- Pettigrew, S.; Talati, Z.; Miller, C.; Dixon, H.; Kelly, B.; Ball, K. The types and aspects of front-of-pack food labelling schemes preferred by adults and children. Appetite 2017, 109, 115–123. [Google Scholar] [CrossRef] [PubMed]
- Trieu, K.; Neal, B.; Hawkes, C.; Dunford, E.; Campbell, N.; Rodriguez-Fernandez, R.; Legetic, B.; McLaren, L.; Barberio, A.; Webster, J. Salt Reduction Initiatives around the World—A Systematic Review of Progress towards the Global Target. PLoS ONE 2015, 10, e0130247. [Google Scholar] [CrossRef] [PubMed]
- Grunert, K.G.; Wills, J.M. A review of European research on consumer response to nutrition information on food labels. J. Public Health 2007, 15, 385–399. [Google Scholar] [CrossRef]
- Volkova, E.; Ni Mhurchu, C. The Influence of Nutrition Labeling and Point-of-Purchase Information on Food Behaviours. Curr. Obes. Rep. 2015, 4, 19–29. [Google Scholar] [CrossRef] [PubMed]
- Cecchini, M.; Warin, L. Impact of food labelling systems on food choices and eating behaviours: A systematic review and meta-analysis of randomized studies. Obes. Rev. Off. J. Int. Assoc. Study Obes. 2016, 17, 201–210. [Google Scholar] [CrossRef] [PubMed]
- Crosetto, P.; Muller, L.; Ruffieux, B. Helping consumers with a front-of-pack label: Numbers or colors?: Experimental comparison between Guideline Daily Amount and Traffic Light in a diet-building exercise. J. Econ. Psychol. 2016, 55 (Suppl. C), 30–50. [Google Scholar] [CrossRef]
- Aschemann-Witzel, J.; Grunert, K.G.; van Trijp, H.C.; Bialkova, S.; Raats, M.M.; Hodgkins, C.; Wasowicz-Kirylo, G.; Koenigstorfer, J. Effects of nutrition label format and product assortment on the healthfulness of food choice. Appetite 2013, 71, 63–74. [Google Scholar] [CrossRef] [PubMed]
- Watson, W.L.; Kelly, B.; Hector, D.; Hughes, C.; King, L.; Crawford, J.; Sergeant, J.; Chapman, K. Can front-of-pack labelling schemes guide healthier food choices? Australian shoppers’ responses to seven labelling formats. Appetite 2014, 72, 90–97. [Google Scholar] [PubMed]
- Arrua, A.; Machin, L.; Curutchet, M.R.; Martinez, J.; Antunez, L.; Alcaire, F.; Gimenez, A.; Ares, G. Warnings as a directive front-of-pack nutrition labelling scheme: Comparison with the Guideline Daily Amount and traffic-light systems. Public Health Nutr. 2017, 20, 2308–2317. [Google Scholar] [CrossRef] [PubMed]
- Sacks, G.; Rayner, M.; Swinburn, B. Impact of front-of-pack ‘traffic-light’ nutrition labelling on consumer food purchases in the UK. Health Promot. Int. 2009, 24, 344–352. [Google Scholar] [CrossRef] [PubMed]
- Sacks, G.; Tikellis, K.; Millar, L.; Swinburn, B. Impact of ‘traffic-light’ nutrition information on online food purchases in Australia. Aust. N. Z. J. Public Health 2011, 35, 122–126. [Google Scholar] [CrossRef] [PubMed]
- Sutherland, L.A.; Kaley, L.A.; Fischer, L. Guiding stars: The effect of a nutrition navigation program on consumer purchases at the supermarket. Am. J. Clin. Nutr. 2010, 91, 1090s–1094s. [Google Scholar] [CrossRef] [PubMed]
- Dunford, E.; Trevena, H.; Goodsell, C.; Ng, K.H.; Webster, J.; Millis, A.; Goldstein, S.; Hugueniot, O.; Neal, B. FoodSwitch: A Mobile Phone App to Enable Consumers to Make Healthier Food Choices and Crowdsourcing of National Food Composition Data. JMIR mHealth uHealth 2014, 2, e37. [Google Scholar] [CrossRef] [PubMed]
- Ni Mhurchu, C.; Volkova, E.; Jiang, Y.; Eyles, H.; Michie, J.; Neal, B.; Blakely, T.; Swinburn, B.; Rayner, M. Effects of interpretive nutrition labels on consumer food purchases: The Starlight randomized controlled trial. Am. J. Clin. Nutr. 2017, 105, 695–704. [Google Scholar] [CrossRef] [PubMed]
- Hammond, D. Health warning messages on tobacco products: A review. Tob. Control 2011, 20, 327–337. [Google Scholar] [CrossRef] [PubMed]
- Cobb, L.K.; Appel, L.J.; Anderson, C.A.M. Strategies to Reduce Dietary Sodium Intake. Curr. Treat. Opt. Cardiovasc. Med. 2012, 14, 425–434. [Google Scholar] [CrossRef] [PubMed]
- Maubach, N.; Hoek, J.; Mather, D. Interpretive front-of-pack nutrition labels. Comparing competing recommendations. Appetite 2014, 82, 67–77. [Google Scholar] [CrossRef] [PubMed]
- Hamlin, R.P.; McNeill, L.S.; Moore, V. The impact of front-of-pack nutrition labels on consumer product evaluation and choice: An experimental study. Public Health Nutr. 2015, 18, 2126–2134. [Google Scholar] [CrossRef] [PubMed]
- Herpen, E.V.; Hieke, S.; van Trijp, H.C. Inferring Product Healthfulness from Nutrition Labelling: The Influence of Reference Points. Appetite 2013. [Google Scholar] [CrossRef] [PubMed]


| n | MTL (312) | DIG (319) | HSR (315) | WARN (314) | NIP (318) | All (1578) | |
|---|---|---|---|---|---|---|---|
| Age, years (mean ± SD) | 1575 | 38.5 ± 11.5 | 38.2 ± 10.9 | 37.7 ± 11.2 | 36.9 ± 11.3 | 38.2 ± 11.1 | 37.9 ± 11.2 |
| Female (%) | 1578 | 263 (84.3) | 275 (86.2) | 262 (83.2) | 265 (84.4) | 257 (80.8) | 1322 (83.8) |
| Household income (A$) (n, %) | 1431 | ||||||
| <$50,000 | 45 (14.4) | 59 (18.5) | 51 (16.2) | 50 (15.9) | 53 (16.7) | 258 (16.3) | |
| $50,000–$100,000 | 119 (38.1) | 99 (31.0) | 113 (35.9) | 110 (35.0) | 107 (33.6) | 548 (34.7) | |
| >$100,000 | 123 (39.4) | 127 (39.8) | 119 (37.8) | 125 (39.8) | 131 (41.2) | 625 (39.6) | |
| Highest level of education (n, %) | 1578 | ||||||
| Primary/Secondary | 57 (18.3) | 78 (24.5) | 81 (25.7) | 64 (20.4) | 64 (20.1) | 344 (21.8) | |
| Tertiary | 167 (53.5) | 149 (46.7) | 148 (47.0) | 160 (51.0) | 167 (52.5) | 791 (50.1) | |
| Post-graduate | 86 (27.6) | 90 (28.2) | 83 (26.3) | 89 (28.3) | 84 (26.4) | 432 (27.4) | |
| None of the above | 2 (0.6) | 2 (0.6) | 3 (1.0) | 1 (0.3) | 3 (0.9) | 11 (0.7) | |
| Employment status (n, %) | 1578 | ||||||
| Full Time | 133 (42.6) | 128 (40.1) | 131 (41.6) | 134 (42.7) | 130 (40.9) | 656 (41.6) | |
| Part Time | 89 (28.5) | 88 (27.6) | 87 (27.6) | 92 (29.3) | 86 (27.0) | 442 (28.0) | |
| Other/Unemployed | 90 (28.8) | 103 (32.3) | 97 (30.8) | 88 (28.0) | 102 (32.1) | 480 (30.4) | |
| Prior use of FoodSwitch (n, %) | 1578 | 24 (7.6) | 28 (8.8) | 21 (6.7) | 20 (6.4) | 23 (7.2) | 116 (7.4) |
| Number in household (mean ± SD) | 1578 | 3.2 ± 1.4 | 3.1 ± 1.4 | 3.2 ± 1.4 | 3.0 ± 1.3 | 3.2 ± 1.4 | 3.2 ± 1.4 |
| Number in household under 18 (mean ± SD) | 1529 | 1.0 ± 1.1 | 1.1 ± 1.2 | 1.0 ± 1.2 | 0.9 ± 1.1 | 1.1 ± 1.2 | 1.0 ± 1.2 |
| HSR vs. MTL | p Non-Inferiority p Superiority | HSR vs. DIG | p Non-Inferiority p Superiority | HSR vs. WARN | p Non-Inferiority p Superiority | |
|---|---|---|---|---|---|---|
| Primary outcome | ||||||
| Mean transformed nutrient profile score | −0.37 (−1.20, 0.46) | <0.001 0.38 | 0.68 (−0.14, 1.50) | <0.001 0.10 | −0.51 (−1.33, 0.32) | <0.001 0.23 |
| Secondary outcomes | ||||||
| Mean total sugar g/100 g | 0.41 (−0.43, 1.25) | 0.05 0.34 | −0.12 (−0.95, 0.71) | 0.002 0.77 | 0.10 (−0.74, 0.94) | 0.01 0.82 |
| Mean sodium mg/100 g | 13 (−16, 41) | 0.09 0.39 | 23 (−5, 51) | 0.25 0.11 | 12 (−16, 41) | 0.08 0.39 |
| Mean saturated g/100 g | 0.11 (−0.27, 0.48) | 0.02 0.58 | −0.21 (−0.58, 0.15) | <0.001 0.26 | −0.05 (−0.42, 0.32) | 0.001 0.80 |
| Mean energy content kJ/100 g | 25 (−10, 61) | <0.001 0.17 | −7 (−43, 28) | <0.001 0.68 | 8 (−28, 44) | <0.001 0.66 |
| Mean spend/4 weeks (A$) | 0.03 (−0.12, 0.19) | <0.001 0.67 | 0.06 (−0.09, 0.22) | <0.001 0.45 | −0.02 (−0.18, 0.14) | <0.001 0.83 |
| MTL vs. NIP | p Superiority | DIG vs. NIP | p Superiority | HSR vs. NIP | p Superiority | WARN vs. NIP | p Superiority | |
|---|---|---|---|---|---|---|---|---|
| Primary outcome | ||||||||
| Mean transformed Nutrient Profile Score | 0.74 (−0.11, 1.58) | 0.09 | −0.31 (−1.15, 0.52) | 0.46 | 0.37 (−0.47, 1.21) | 0.39 | 0.87 (0.03, 1.72) | 0.04 |
| Secondary outcomes | ||||||||
| Mean total sugar g/100 g | −0.89 (−1.74, −0.03) | 0.04 | −0.35 (−1.20, 0.49) | 0.41 | −0.48 (−1.33, 0.37) | 0.27 | −0.57 (−1.43, 0.28) | 0.19 |
| Mean sodium mg/100 g | −2 (−31, 28) | 0.91 | −12 (−41, 17) | 0.41 | 11 (−18, 40) | 0.47 | −2 (−31, 28) | 0.91 |
| Mean saturated fat g/100 g | −0.30 (−0.68, 0.08) | 0.12 | 0.02 (−0.35, 0.39) | 0.92 | −0.19 (−0.57, 0.18) | 0.31 | −0.14 (−0.52, 0.23) | 0.45 |
| Mean energy content kJ/100 g | −26 (−63, 11) | 0.16 | 7 (−29, 43) | 0.71 | −1 (−37, 36) | 0.98 | −8 (−45, 28) | 0.65 |
| Mean spend/4 weeks (A$) | 0.11 (−0.05, 0.27) | 0.17 | 0.08 (−0.07, 0.24) | 0.29 | 0.14 (−0.01, 0.30) | 0.07 | 0.16 (0.002, 0.32) | 0.05 |
| HSR vs. MTL | p Non-Inferiority p Superiority | HSR vs. DIG | p Non-Inferiority p Superiority | HSR vs. WARN | p Non-Inferiority p Superiority | |
|---|---|---|---|---|---|---|
| Current nutrition knowledge after using the study app | 0.36 (−0.03, 0.75) | <0.001 0.07 | 0.44 (0.06, 0.82) | <0.001 0.02 | 0.25 (−0.13, 0.64) | <0.001 0.20 |
| How useful were the nutrition labels shown in the app | −0.01 (−0.52, 0.50) | <0.001 0.97 | 0.76 (0.26, 1.26) | <0.001 0.003 | 0.07 (−0.43, 0.58) | <0.001 0.78 |
| How easy to understand were the labels shown in the app | 0.62 (0.19, 1.05) | <0.001 0.005 | 1.02 (0.60, 1.44) | <0.001 <0.001 | 0.22 (−0.21, 0.64) | <0.001 0.32 |
| How useful would it be to have those labels printed on every food package | 0.44 (−0.001, 0.88) | <0.001 0.05 | 0.70 (0.27, 1.13) | <0.001 0.002 | 0.43 (−0.003, 0.87) | <0.001 0.05 |
© 2017 by the authors. Licensee MDPI, Basel, Switzerland. This article is an open access article distributed under the terms and conditions of the Creative Commons Attribution (CC BY) license (http://creativecommons.org/licenses/by/4.0/).
Share and Cite
Neal, B.; Crino, M.; Dunford, E.; Gao, A.; Greenland, R.; Li, N.; Ngai, J.; Ni Mhurchu, C.; Pettigrew, S.; Sacks, G.; et al. Effects of Different Types of Front-of-Pack Labelling Information on the Healthiness of Food Purchases—A Randomised Controlled Trial. Nutrients 2017, 9, 1284. https://doi.org/10.3390/nu9121284
Neal B, Crino M, Dunford E, Gao A, Greenland R, Li N, Ngai J, Ni Mhurchu C, Pettigrew S, Sacks G, et al. Effects of Different Types of Front-of-Pack Labelling Information on the Healthiness of Food Purchases—A Randomised Controlled Trial. Nutrients. 2017; 9(12):1284. https://doi.org/10.3390/nu9121284
Chicago/Turabian StyleNeal, Bruce, Michelle Crino, Elizabeth Dunford, Annie Gao, Rohan Greenland, Nicole Li, Judith Ngai, Cliona Ni Mhurchu, Simone Pettigrew, Gary Sacks, and et al. 2017. "Effects of Different Types of Front-of-Pack Labelling Information on the Healthiness of Food Purchases—A Randomised Controlled Trial" Nutrients 9, no. 12: 1284. https://doi.org/10.3390/nu9121284