Collecting Evidence to Inform Salt Reduction Policies in Argentina: Identifying Sources of Sodium Intake in Adults from a Population-Based Sample

 ,
, 
Abstract
:1. Introduction
2. Materials and Methods
2.1. Design and Population
2.2. Ethical Statement
2.3. Dietary Assessment
2.4. Covariables
2.5. Data Analysis
3. Results
3.1. Characteristics of the Sample
3.2. Sodium Intake from Processed Foods
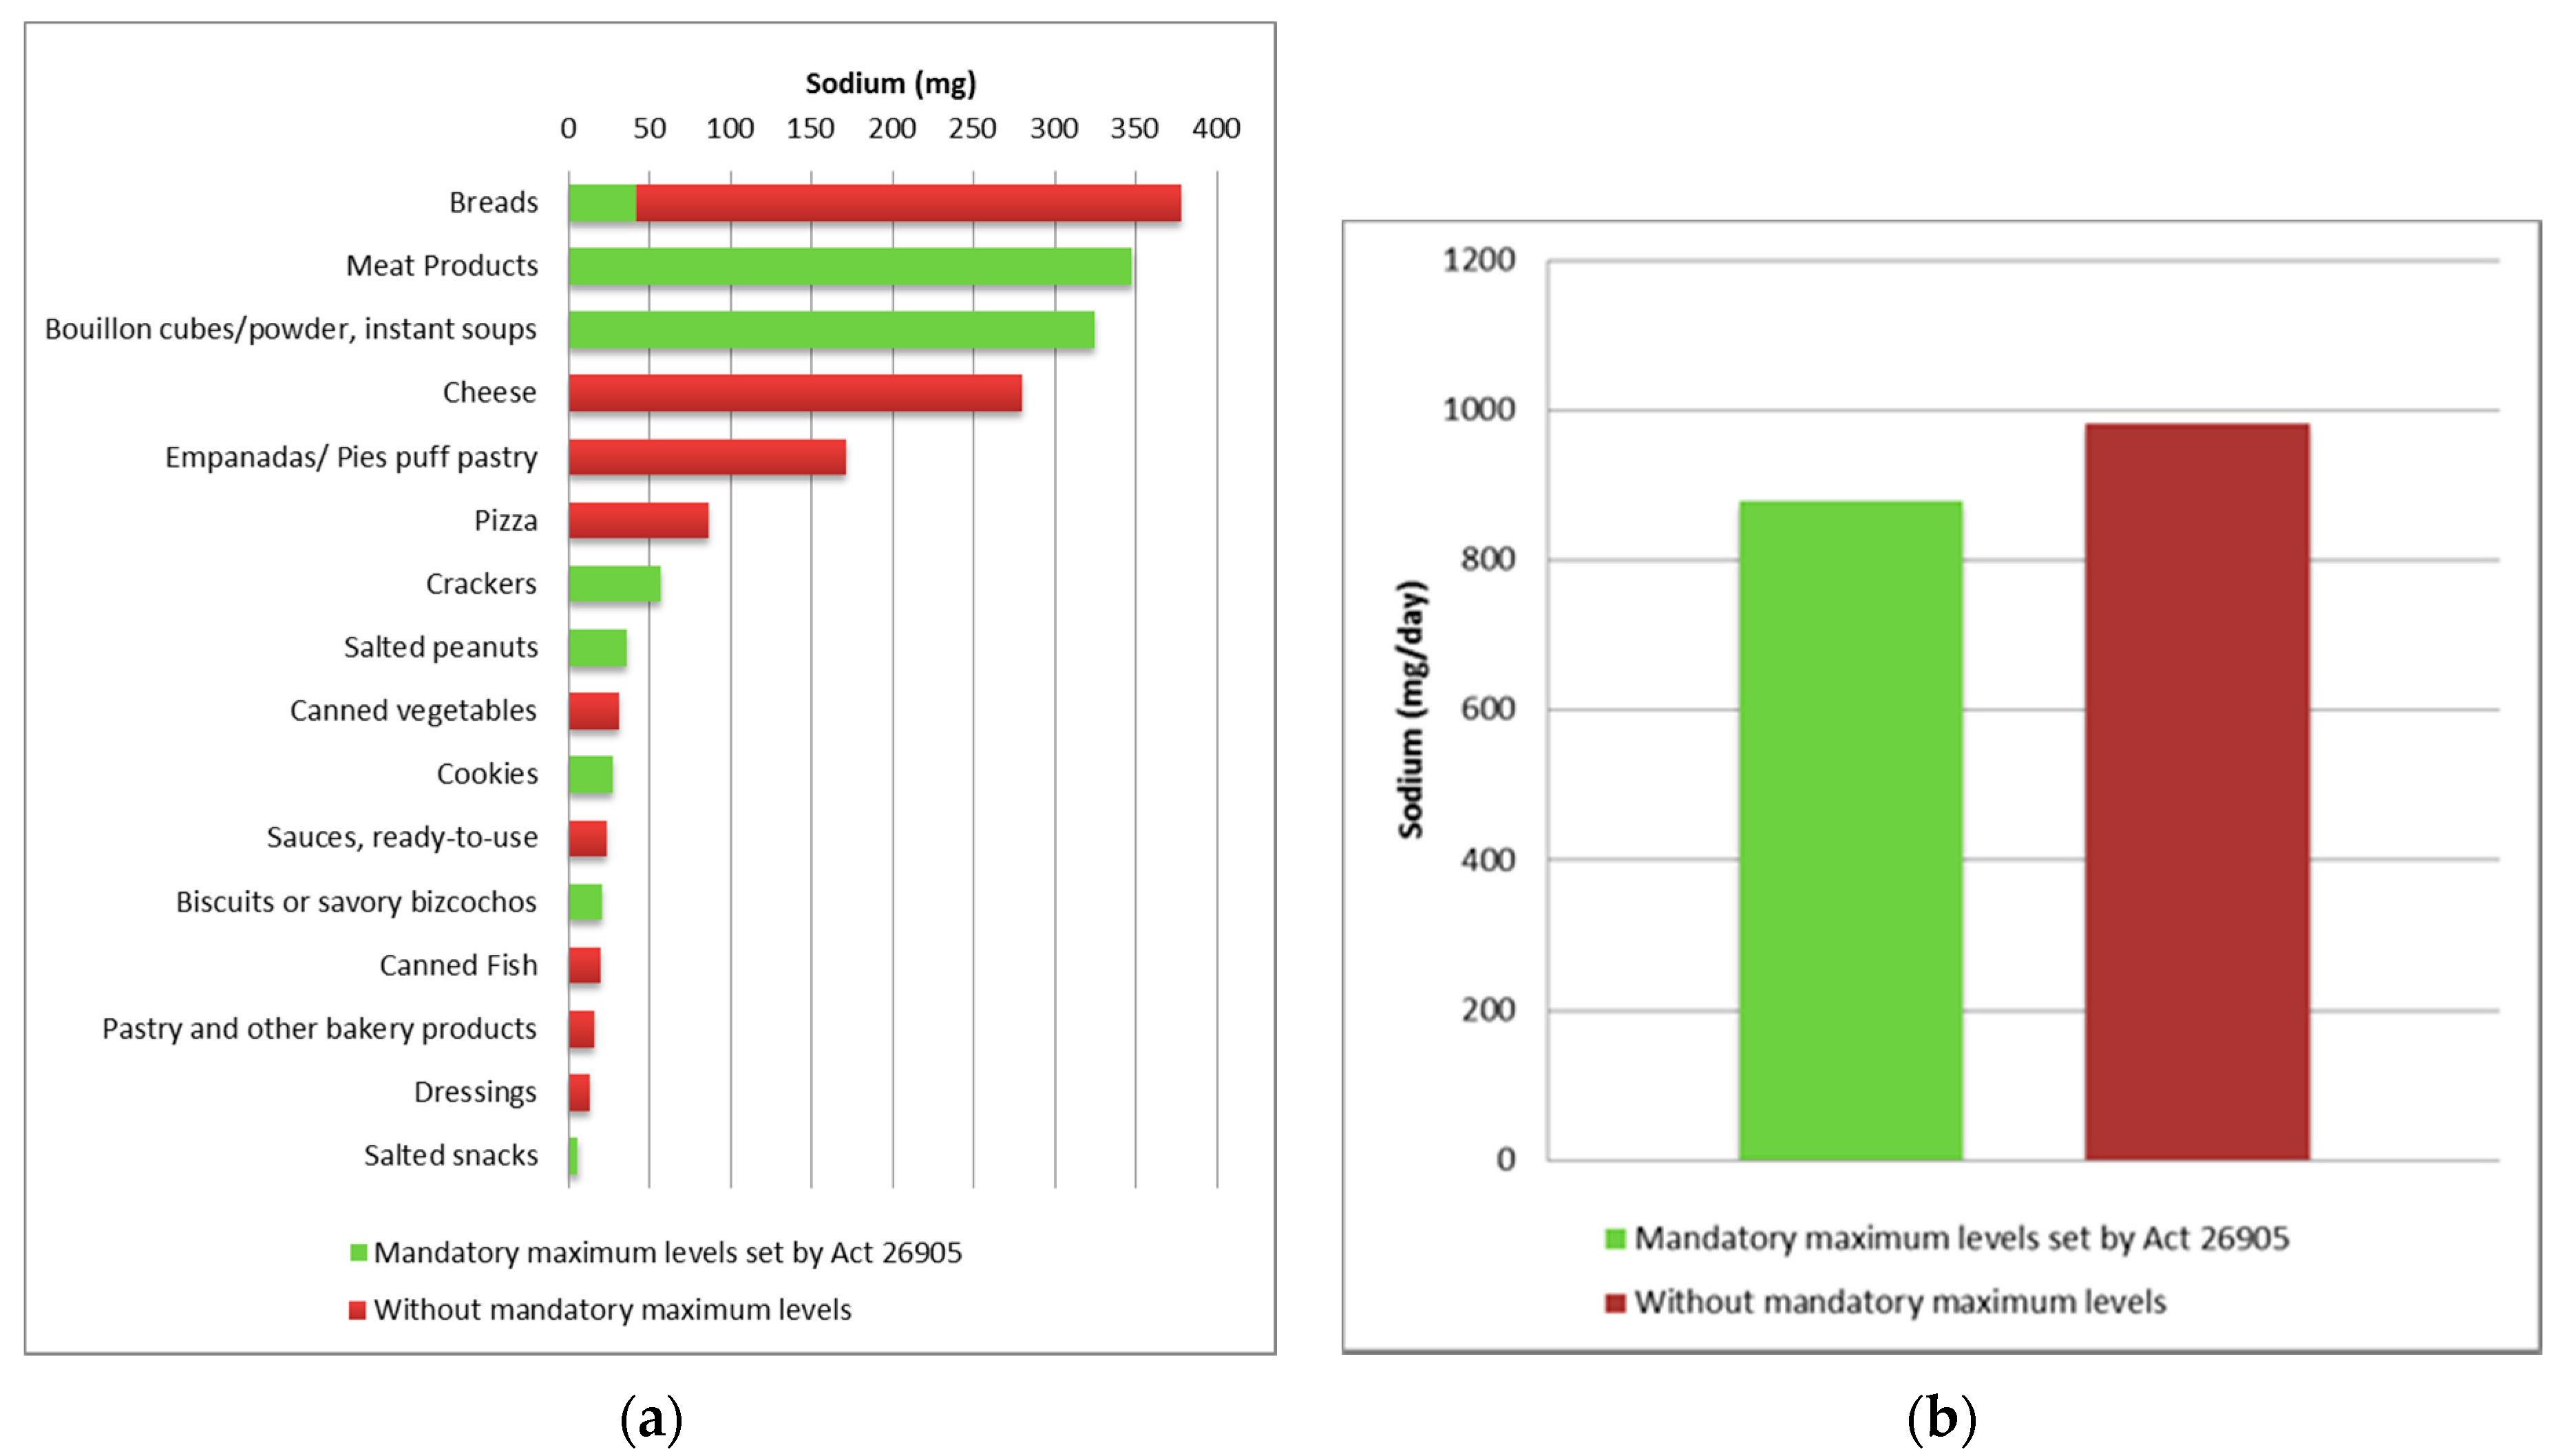
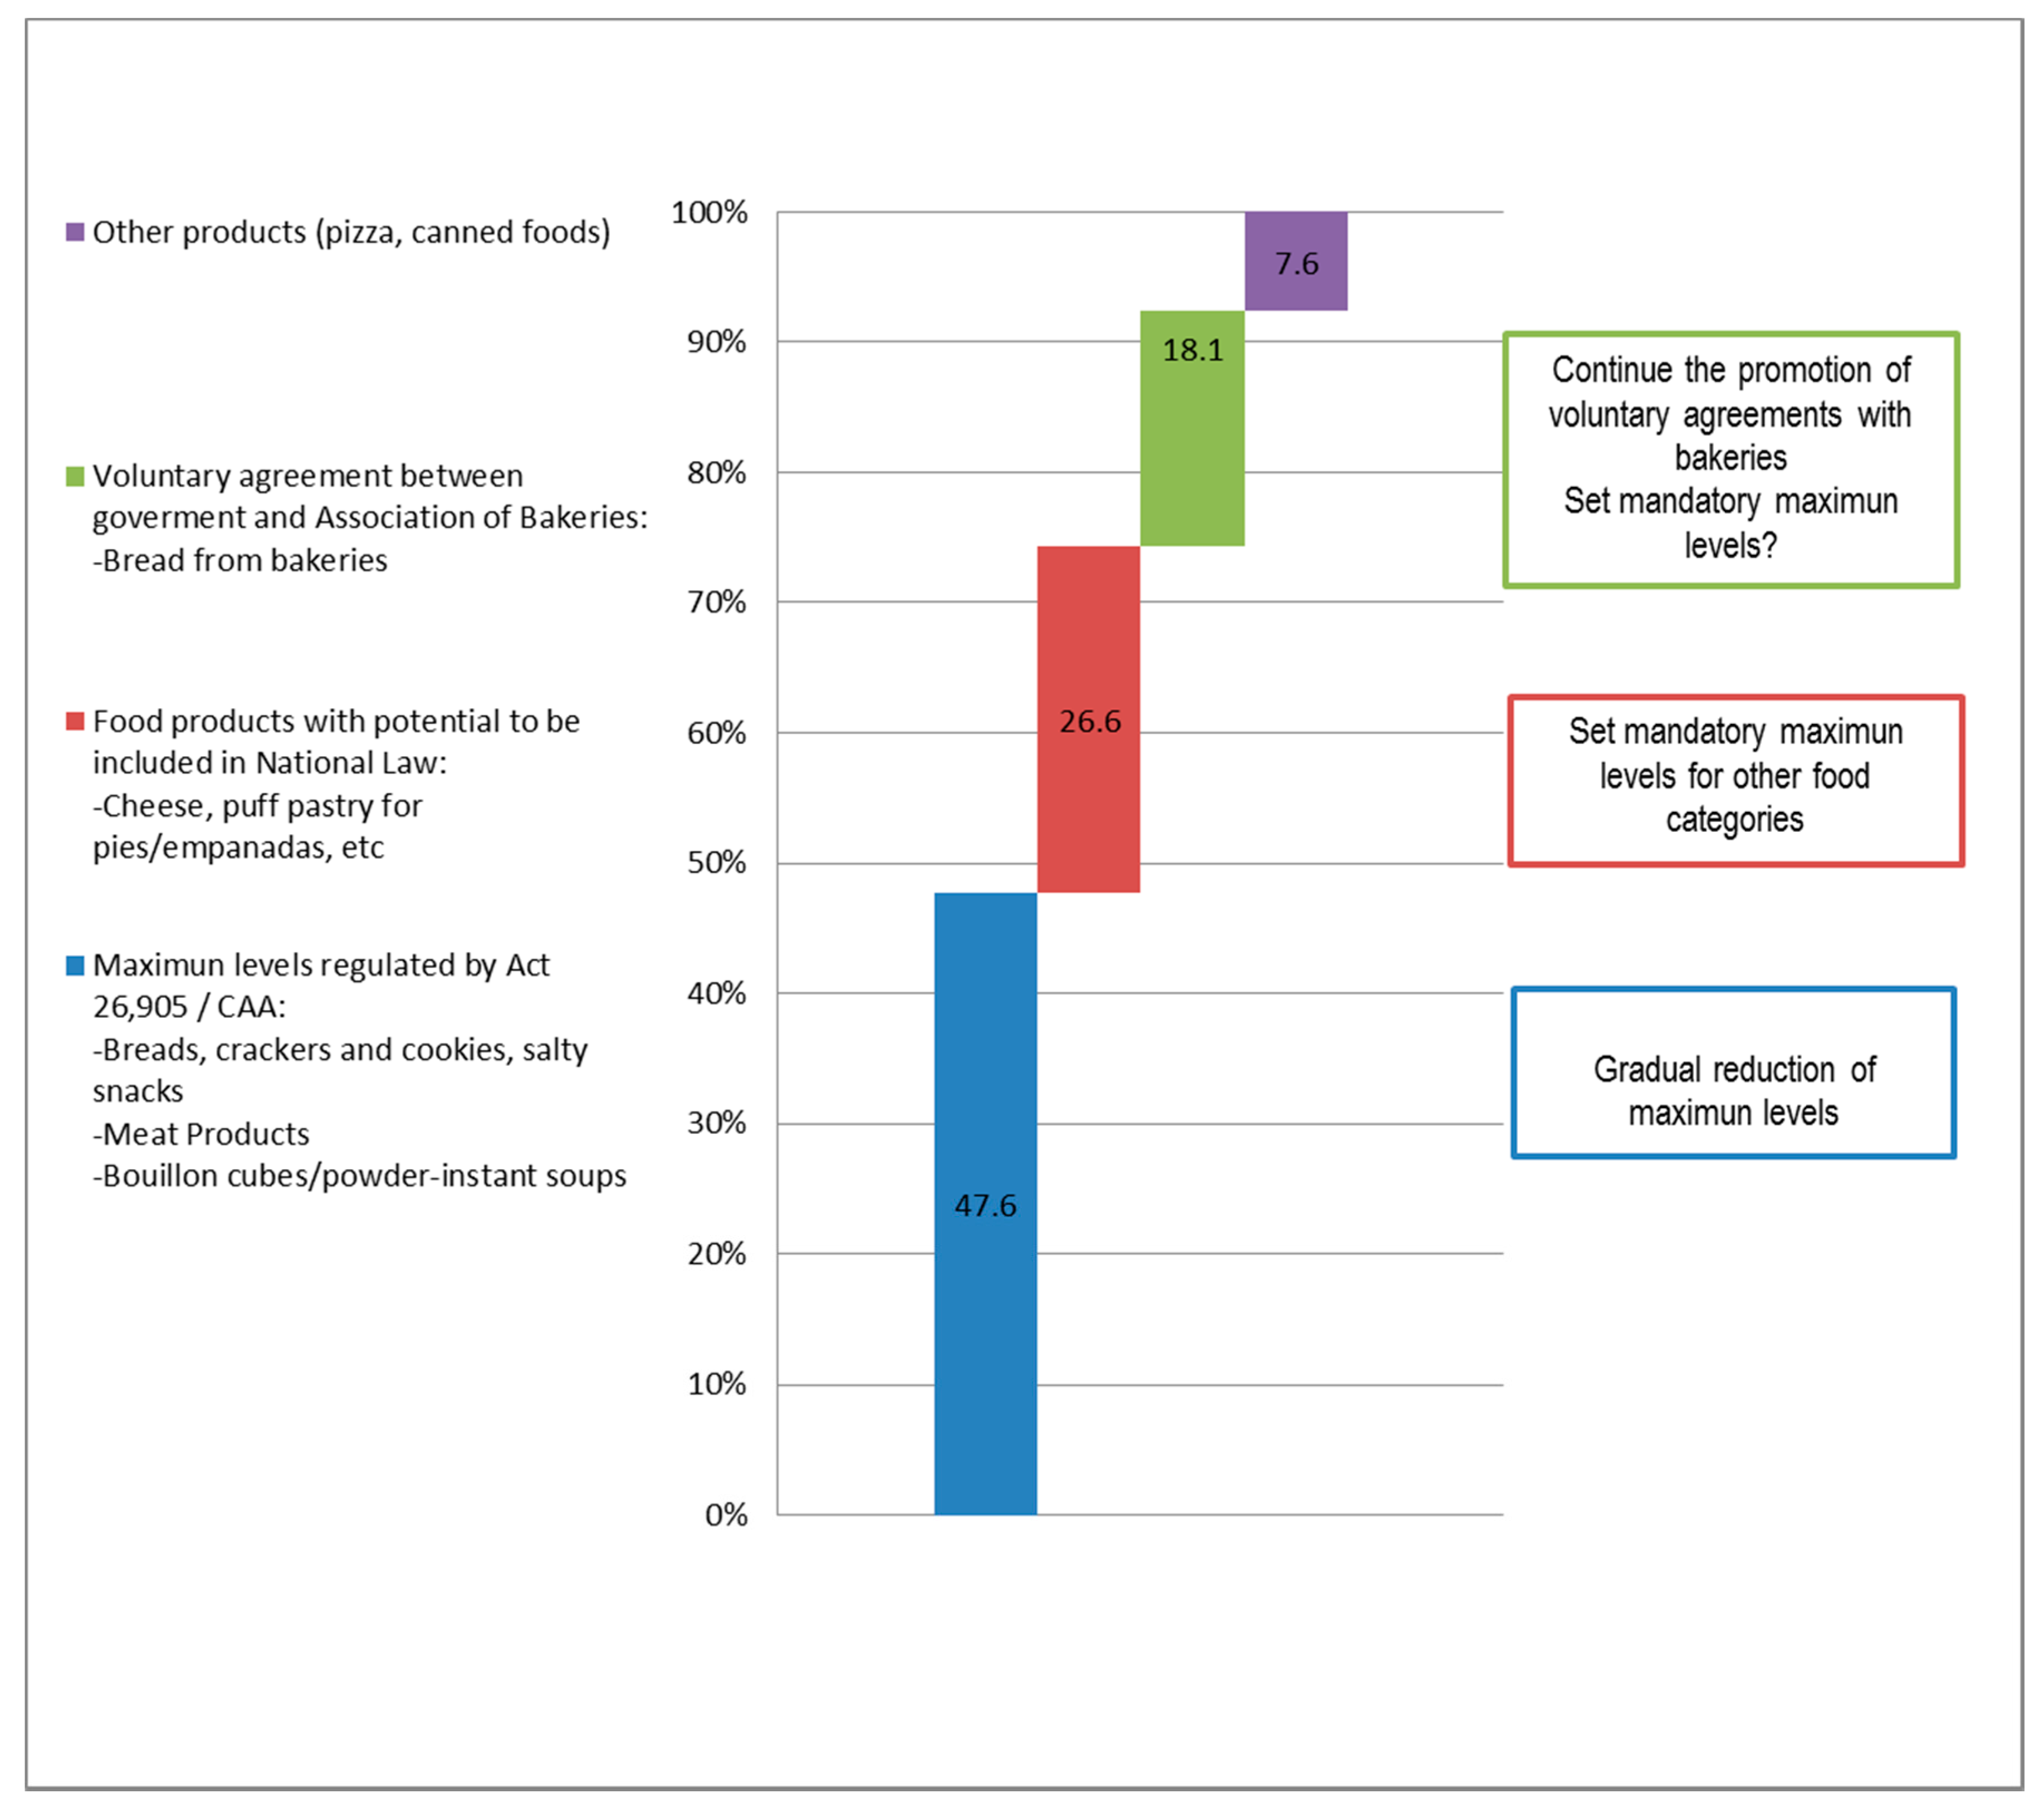
3.3. Main Sources of Sodium Among Processed Food Groups and Food Categories Affected by the Current Legislation (National Act 26.905)
3.4. Use of Discretionary Salt
4. Discussion
5. Conclusions
Supplementary Materials
Acknowledgments
Author Contributions
Conflicts of Interest
References
- WHO. Preventing Chronic Disease: A Vital Investment; World Health Organization: Geneva, Switzerland, 2005. [Google Scholar]
- WHO. Global Status Report on Noncommunicable Diseases 2010; World Health Organization: Geneva, Switzerland, 2011. [Google Scholar]
- Murray, C.J.; Lauer, J.A.; Hutubessy, R.C.; Niessen, L.; Tomijima, N.; Rodgers, A.; Lawes, C.M.; Evans, D.B. Effectiveness and costs of interventions to lower systolic blood pressure and cholesterol: A global and regional analysis on reduction of cardiovascular-disease risk. Lancet 2003, 361, 717–725. [Google Scholar] [CrossRef]
- Bibbins-Domingo, K.; Chertow, G.M.; Coxson, P.G.; Moran, A.; Lightwood, J.M.; Pletcher, M.J.; Goldman, L. Projected effect of dietary salt reductions on future cardiovascular disease. N. Engl. J. Med. 2010, 362, 590–599. [Google Scholar] [CrossRef] [PubMed]
- Natalidad y Mortalidad 2014. Síntesis Estadística 1. Available online: http://www.deis.msal.gov.ar/wp-content/uploads/2016/05/Sintesis-estadistica-Nro1.pdf (accessed on 10 February 2017).
- Rubinstein, A.; Colantonio, L.; Bardach, A.; Caporale, J.; Marti, S.G.; Kopitowski, K.; Alcaraz, A.; Gibbons, L.; Augustovski, F.; Pichon-Riviere, A. Estimation of the burden of cardiovascular disease attributable to modifiable risk factors and cost-effectiveness analysis of preventative interventions to reduce this burden in Argentina. BMC Public Health 2010, 10, 627. [Google Scholar] [CrossRef] [PubMed]
- Ministerio de Salud de la Nación. Tercera Encuesta Nacional de Factores de Riesgo Para Enfermedades No Transmisibles, 1st ed.; Ministerio de Salud de la Nación, Instituto Nacional de Estadísticas y Censos: Buenos Aires, Argentina, 2015.
- Ferrante, D.; Apro, N.; Ferreira, V.; Virgolini, M.; Aguilar, V.; Sosa, M.; Perel, P.; Casas, J. Feasibility of salt reduction in processed foods in Argentina. Rev. Panam. Salud Publ. 2011, 29, 69–75. [Google Scholar] [CrossRef]
- WHO. Strategies to Monitor and Evaluate Population Sodium Consumption and Sources of Sodium in the Diet: Report of a Joint Technical Meeting Convened by Who and the Government of Canada; World Health Organization (WHO): Geneva, Switzerland, 2011. [Google Scholar]
- Ministry of Health. Menos sal más Vida (Less Salt More Life). Available online: http://www.msal.gob.ar/ent/index.php/informacion-para-ciudadanos/menos-sal--vida (accessed on 10 March 2016).
- National Act 26.905. Consumo de Sodio. Valores Máximos; El Senado y Cámara de Diputados de la Nación Argentina reunidos en Congreso: Buenos Aires, Argentina, 2013.
- Resolución Conjunta 137/10 y 941/10; Secretaría de Políticas Regulación e Institutos; Secretaría de Agricultura Ganadería y Pesca: Buenos Aires, Argentina, 2010.
- Ministerio de Salud de la Nación. Estrategia Piloto Para Reducir el Consumo de Sal en la Provincia de la Pampa; Ministerio de Salud: Buenos Aires, Argentina, 2013.
- Ferrante, D.; Virgolini, M. Encuesta nacional de factores de riesgo 2005: Resultados principales: Prevalencia de factores de riesgo de enfermedades cardiovasculares en la Argentina. Rev. Argent Cardiol. 2007, 75, 20–29. [Google Scholar]
- Daniels, S.R.; Linetzky, B.; Konfino, J.; King, A.; Virgolini, M.; Laspiur, S. Encuesta nacional de factores de riesgo 2009: Evolución de la epidemia de enfermedades crónicas no transmisibles en argentina. Estudio de corte transversal. Rev. Argent Salud Públ. 2011, 2, 34–41. [Google Scholar]
- Peña, L.; Bergesio, L.; Discacciati, V.; Majdalani, M.P.; Elorriaga, N.; Mejía, R. Actitudes y comportamientos acerca del consumo de sodio y grasas trans en Argentina. Rev. Argent Salud Públ. 2015, 6, 7–13. [Google Scholar]
- Sanchez, G.; Peña, L.; Varea, S.; Mogrovejo, P.; Goetschel, M.L.; Montero-Campos Mde, L.; Mejia, R.; Blanco-Metzler, A. Knowledge, perceptions, and behavior related to salt consumption, health, and nutritional labeling in Argentina, Costa Rica, and Ecuador. Rev. Panam. Salud Publ. 2012, 32, 259–264. [Google Scholar]
- Allemandi, L.; Tiscornia, M.V.; Ponce, M.; Castronuovo, L.; Dunford, E.; Schoj, V. Sodium content in processed foods in Argentina: Compliance with the national law. Cardiovasc. Diagn. Ther. 2015, 5, 197–206. [Google Scholar] [PubMed]
- Rubinstein, A.L.; Irazola, V.E.; Calandrelli, M.; Elorriaga, N.; Gutierrez, L.; Lanas, F.; Manfredi, J.A.; Mores, N.; Olivera, H.; Poggio, R.; et al. Multiple cardiometabolic risk factors in the southern cone of Latin America: A population-based study in Argentina, Chile, and Uruguay. Int. J. Cardiol. 2015, 183C, 82–88. [Google Scholar] [CrossRef] [PubMed]
- Rubinstein, A.L.; Irazola, V.E.; Poggio, R.; Bazzano, L.; Calandrelli, M.; Lanas Zanetti, F.T.; Manfredi, J.A.; Olivera, H.; Seron, P.; Ponzo, J.; et al. Detection and follow-up of cardiovascular disease and risk factors in the southern cone of Latin America: The CESCAS I study. BMJ Open 2011, 1, 1–6. [Google Scholar] [CrossRef] [PubMed]
- Mejia, R. Assesing the Impact of Current National Policies to Reduce Salt and Ans-Fatty Acids in Argentina. IDRC Project Final Technical Report; CEDES: Buenos Aires, Argentina, 2015. [Google Scholar]
- Suarez, M.M.; Lopez, L.B. Alimentacion Saludable. Guia Practica Para su Realizacion; Libreria Editorial Akadia: Buenos Aires, Argentina, 2005. [Google Scholar]
- Vázquez, M.; Witriw, A. Modelos Visuales de Alimentos & Tablas de Relación Peso/Volumen. Buenos Aires, Argentina, 1997. [Google Scholar]
- Allemandi, L.; Garipe, L.; Schoj, V.; Pizarro, M.; Tambussi, A. Análisis del contenido de sodio y grasas trans de los alimentos industrializados en Argentina. Rev. Argent Salud Públ. 2013, 4, 14–19. [Google Scholar]
- Elorriaga, N.; Bardach, A.E.; Defago, M.D.; Levi, L.; Nessier, M.C.; Irazola, V. Development, implementation and evaluation of tools for decision-making on healthy eating policies in Argentina. In Anuario Becas de Investigación “Carrillo Oñativia” 2012; Ministerio de Salud: Buenos Aires, Argentina, 2016; pp. 250–251. [Google Scholar]
- Ministerio de Salud. Programa Menos sal más vida 2015. Available online: http://www.msal.gob.ar/ent/images/stories/programas/pdf/2015-11_menos-sal-mas-vida_ppt.pdf (accessed on 25 November 2016).
- Mangialavori, G.; Guidet, A.B.; Abeyá-Gilardon, E.; Durán, P.; Kogan, L. Alimentos Consumidos en Argentina. Resultados de la Encuesta Nacional de Nutrición y Salud-ENNyS 2004/5; Ministerio de Salud: Buenos Aires, Argentina, 2012.
- Lezcano, E.P. Analisis de producto: Productos panificados. In Alimentos Argentinos; Ministerio de Agroindustria: Buenos Aires, Argentina, 2011. [Google Scholar]
- Valenzuela, L.K.; Quitral, R.V.; Villanueva, A.B.; Zavala, M.F.; Atalah, S.E. Evaluación del programa piloto de reducción de sal/sodio en el pan en santiago de Chile. Rev. Chil. Nutr. 2013, 40, 119–122. [Google Scholar] [CrossRef]
- Valverde Guillén, M.; Picado Pérez, J. World strategies in salt/sodium reduction in bread. Rev. Costarric. Salud Públ. 2013, 22, 61–67. [Google Scholar]
- Konfino, J.; Mekonnen, T.A.; Coxson, P.G.; Ferrante, D.; Bibbins-Domingo, K. Projected impact of a sodium consumption reduction initiative in Argentina: An analysis from the CVD policy model—Argentina. PLoS ONE 2013, 8, e73824. [Google Scholar] [CrossRef] [PubMed]
- Quader, Z.S.; Patel, S.; Gillespie, C.; Cogswell, M.E.; Gunn, J.P.; Perrine, C.G.; Mattes, R.D.; Moshfegh, A. Trends and determinants of discretionary salt use: National health and nutrition examination survey 2003–2012. Public Health Nutr. 2016, 19, 2195–2203. [Google Scholar] [CrossRef] [PubMed]
- Grimes, C.A.; Riddell, L.J.; Nowson, C.A. The use of table and cooking salt in a sample of Australian adults. Asia Pac. J. Clin. Nutr. 2010, 19, 256–260. [Google Scholar] [PubMed]
- Sutherland, J.; Edwards, P.; Shankar, B.; Dangour, A.D. Fewer adults add salt at the table after initiation of a national salt campaign in the UK: A repeated cross-sectional analysis. Br. J. Nutr. 2013, 110, 552–558. [Google Scholar] [CrossRef] [PubMed]
- Nowson, C.; Lim, K.; Grimes, C.; O’Halloran, S.; Land, M.A.; Webster, J.; Shaw, J.; Chalmers, J.; Smith, W.; Flood, V.; et al. Dietary salt intake and discretionary salt use in two general population samples in Australia: 2011 and 2014. Nutrients 2015, 7, 10501–10512. [Google Scholar] [CrossRef] [PubMed]
- AADYND. Guías Alimentarias Para la Población Argentina, 1st ed.; Asociación Argentina de Dietistas y Nutricionistas; Federación Argentina de Graduados en Nutrición: Buenos Aires, Argentina, 2000. [Google Scholar]
- Ministerio de Salud de la Nación. Guías Alimentarias Para la Población Argentina; Ministerio de Salud: Buenos Aires, Argentina, 2016.
- Vázquez, S.M.B.; Lema, R.S.N.; Contarini, C.A.; Kenten, C.C. Sal y salud, el punto de vista del consumidor argentino obtenido por la técnica de grupos focales. Rev. Chil. Nutr. 2012, 39, 182–190. [Google Scholar] [CrossRef]
- Brown, I.J.; Tzoulaki, I.; Candeias, V.; Elliott, P. Salt intakes around the world: Implications for public health. Int. J. Epidemiol. 2009, 38, 791–813. [Google Scholar] [CrossRef] [PubMed]
- Sarno, F.; Claro, R.M.; Levy, R.B.; Bandoni, D.H.; Monteiro, C.A. Estimativa de consumo de sódio pela população brasileira, 2008–2009. Rev. Saúde Públ. 2013, 47, 571–578. [Google Scholar] [CrossRef]
- Louzada, M.L.D.C.; Martins, A.P.B.; Canella, D.S.; Baraldi, L.G.; Levy, R.B.; Claro, R.M.; Moubarac, J.-C.; Cannon, G.; Monteiro, C.A. Ultra-processed foods and the nutritional dietary profile in Brazil. Rev. Saúde Públ. 2015, 49. [Google Scholar] [CrossRef] [PubMed]
- Pan American Health Organization. Ultra-Processed Food and Drink Products in Latin America: Trends, Impact on Obesity, Policy Implications; PAHO: Washington, DC, USA, 2015. [Google Scholar]
- Doyle, M.E.; Glass, K.A. Sodium reduction and its effect on food safety, food quality, and human health. Compr. Rev. Food Sci. Food Saf. 2010, 9, 44–56. [Google Scholar] [CrossRef]
- Speroni, F.; Szerman, N.; Vaudagna, S.R. High hydrostatic pressure processing of beef patties: Effects of pressure level and sodium tripolyphosphate and sodium chloride concentrations on thermal and aggregative properties of proteins. Innov. Food Sci. Emerg. Technol. 2014, 23, 10–17. [Google Scholar] [CrossRef]
- Dominguez, M.; Kleiman, E.; Vaudagna, S.; Vitale-Gutierrez, J.A.; Masana, M. Escenarios Sobre Exigencias de Calidad e Inocuidad en el Sector Productor de Materias Primas y Alimentos Elaborados en Argentina (2030); Ministerio de Ciencia, Tecnología e Innovación Productiva: Buenos Aires, Argentina, 2017. [Google Scholar]
- The Right to Adequate Food; Fact Sheet No. 34; Office of the United Nations High Commissioner for Human Rights, United Nations Office: Geneva, Switzerland, 2010.


| Characteristics | Discretionary Salt Data (n = 3026) (%) | Short FFQ (n = 2129) (%) |
|---|---|---|
| Female | 62.0 | 61.5 |
| Age | ||
| 35–54 years | 50.4 | 53.1 |
| ≥55 years | 49.5 | 46.9 |
| Education | ||
| ≤7 years | 56.0 | 54.0 |
| 8–12 years | 30.8 | 31.8 |
| >12 years | 13.2 | 14.2 |
| Marital Status 1 | ||
| Married | 67.7 | 68.6 |
| Single, divorced or widowed | 32.3 | 31.4 |
| Health Insurance coverage | 56.0 | 49.0 |
| City | ||
| Bariloche | 46.2 | 42.8 |
| Marcos Paz | 53.8 | 57.2 |
| Lifestyle and clinical characteristics 1,2 | ||
| Low physical activity (<600 MET-minutes/week) | 22.7 | 23.4 |
| Current smoker | 27.2 | 28.4 |
| Overweight (BMI ≥ 25 and < 30 kg/m2) | 37.5 | 36.7 |
| Obesity (BMI ≥ 30 kg/m2) | 36.6 | 37.4 |
| Central Obesity 3 | 49.6 | 48.5 |
| Hypertension 4 | 43.9 | 41.4 |
| Overall (n = 2129) | Female (n = 1310) | Male (n = 819) | |||||||
|---|---|---|---|---|---|---|---|---|---|
| Mean (mg/day) 1 | SE | (95% CI) | Mean (mg/day) | SE | (95% CI) | Mean (mg/day) | SE | (95% CI) | |
| All | 1861 | 33.7 | (1795–1928) | 1651 | 37.6 | (1578–1725) | 2098 | 56.9 | (1987–2210) |
| Age | |||||||||
| <55 y | 1875 | 45 | (1788–1963) | 1675 | 50 | (1577–1772) | 2104 | 76 | (1956–2252) |
| ≥55 y | 1831 | 46 | (1741–1921) | 1604 | 52 | (1503–1705) | 2085 | 77 | (1933–2237) |
| Education | |||||||||
| ≤7 y | 1966 | 48 | (1871–2061) | 1792 | 57 | (1681–1903) | 2147 | 79 | (1991–2302) |
| 8–12 y | 1825 | 61 | (1706–1944) | 1575 | 64 | (1449–1701) | 2139 | 107 | (1930–2349) |
| >12 y | 1691 | 72 | (1550–1831) | 1492 | 77 | (1341–1643) | 1912 | 122 | (1670–2151) |
| Food Groups | Food Intake/Person (g/Day or ml/Day) * Mean (SE) | Estimated Sodium Consumed per Person (mg/Day) Mean (SE) | Percentage of Sodium Provided by Food Category 1 | Maximum Limit Set by Act 26.905 |
|---|---|---|---|---|
| Soups, dressings, canned foods, and other convenience foods | 36.1 | |||
| Bouillon cubes or powder | 60 (1.9) * | 213 (6.9) | 11.5 | Yes |
| Instant soups | 47 (2.1) * | 112 (5) | 6.0 | Yes |
| Puff pastry for pies/quiches | 17 (0.5) | 106 (3.3) | 5.7 | No |
| Puff pastry for empanadas 2 | 10.5 (0.3) | 65 (1.6) | 3.5 | No |
| Pizza | 17.1 (0.4) | 86 (2.2) | 4.6 | No |
| Canned vegetables/legumes | 15 (0.5) | 32 (1.1) | 1.7 | No |
| Canned Fish | 5.8 (0.2) | 20 (0.6) | 1.1 | No |
| Sauces, ready-to-use | 6.1 (0.2) | 24 (0.8) | 1.3 | No |
| Dressings: Mayonnaise, mustard, ketchup, etc. | 1.4 (0.1) | 13 (0.6) | 0.7 | |
| Breads, crackers, cookies | 24.9 | |||
| Bread, French or whole wheat (from bakeries) | 42 (1.5) | 336 (11.7) | 18.1 | No |
| Bread, Sliced or sandwich (packaged) | 5.8 (0.4) | 29 (1.8) | 1.5 | Yes |
| Bread, Vienna, hot dog/hamburger bun (packaged) | 2.9 (0.2) | 14 (1) | 0.7 | Yes |
| Crackers, white or whole wheat (packaged) | 9.1 (0.4) | 57 (2.5) | 3.1 | Yes |
| Cookies (packaged) | 4.1 (0.2) | 12 (0.6) | 0.6 | Yes |
| Filled/sandwich cookies such as Oreo | 6.4 (0.3) | 16 (0.8) | 0.9 | Yes |
| Meat Products | 18.7 | |||
| Vienna sausage | 5 (0.2) | 49 (2.1) | 2.6 | Yes |
| Chorizo/Chorizo sausage/Argentinean sausage | 8.5 (0.3) | 89 (3.1) | 4.8 | Yes |
| Other cold cuts (such as ham, salami, bologna, etc.) | 7.5 (0.2) | 62 (2) | 3.3 | Yes |
| Pre-processed hamburgers | 11.3 (0.5) | 81 (3.6) | 4.4 | Yes |
| Frozen pre-cooked breaded chicken, nuggets or fish | 12.8 (0.5) | 66 (2.8) | 3.5 | Yes |
| Cheeses | 15.0 | |||
| Soft cheeses | 29.1 (1) | 129 (4.4) | 6.9 | No |
| Semi-hard cheeses | 21 (0.7) | 131 (4.5) | 7.0 | No |
| Hard cheese | 2.5 (0.1) | 20 (0.5) | 1.1 | No |
| Pastry, other bakery products, sweets | 2.0 | |||
| Biscuits or savory bizcochos | 2.8 (0.1) | 21 (0.9) | 1.1 | Yes 3 |
| Cakes, pies, muffins, etc. | 2.9 (0.1) | 8 (0.4) | 0.4 | Yes |
| Danish/croissants and other Argentine facturas 4 | 9.2 (0.3) | 5 (0.2) | 0.3 | No |
| Alfajores 5 | 2.9 (0.2) | 3 (0.2) | 0.2 | No |
| Other | 2.7 | |||
| Salted snacks | 0.8 (0) | 6 (0.3) | 0.3 | Yes |
| Salted peanuts | 2.5 (0.1) | 37 (1.6) | 2.0 | Yes |
| Butter/Margarine | 2.1 (0.1) | 3.8 (0.2) | 0.2 | No |
| Characteristics | Overall (n = 3026) | Female (n = 1879) | Male (n = 1147) | ||||||
|---|---|---|---|---|---|---|---|---|---|
| % | SE | (95% CI) | % | SE | (95% CI) | % | SE | (95% CI) | |
| Use of salt in cooking (often or always) | |||||||||
| All | 73.3 | 0.9 | (71.5–75.1) | 72.7 | 1.1 | (70.5–74.9) | 74 | 1.5 | (71.1–76.9) |
| Age | |||||||||
| ≤55 y | 79.4 | 1.2 | (77.2–81.7) | 78.6 | 1.4 | (75.8–81.4) | 80.3 | 1.9 | (76.7–84) |
| >55 y | 61.7 | 1.4 | (59–64.4) | 61.7 | 1.8 | (58.2–65.2) | 61.7 | 2.2 | (57.5–66) |
| Education | |||||||||
| ≤7 y | 70.8 | 1.2 | (68.3–73.2) | 68.9 | 1.6 | (65.8–72.0) | 72.9 | 1.9 | (69–76.7) |
| 8–12 y | 77.6 | 1.5 | (74.6–80.6) | 77.7 | 1.9 | (74.0–81.03) | 77.5 | 2.4 | (72.7–82.3) |
| >12 y | 71.5 | 2.5 | (66.5–76.5) | 72.5 | 3 | (66.6–78.4) | 70.3 | 4.2 | (62.1–78.6) |
| Use of salt at the table (often or always) | |||||||||
| All | 9.9 | 0.7 | (8.5–11.3) | 9.2 | 0.9 | (7.5–10.9) | 10.8 | 1.2 | (8.5–13.1) |
| Age | |||||||||
| ≤55 y | 11.0 | 1.0 | (9.0–12.9) | 10.4 | 1.2 | (8.1–12.8) | 11.6 | 1.6 | (8.4–14.7) |
| >55 y | 8.0 | 0.8 | (6.3–9.6) | 6.8 | 1.0 | (4.8–8.9) | 9.3 | 1.4 | (6.5–12.0) |
| Education | |||||||||
| ≤7 y | 8.6 | 0.9 | (6.8–10.4) | 8 | 1.1 | (5.8–10.2) | 9.3 | 1.5 | (6.4–12.2) |
| 8–12 y | 10.5 | 1.2 | (8.1–13) | 10.1 | 1.6 | (7–13.2) | 11 | 2 | (7.1–14.8) |
| >12 y | 12.5 | 2 | (8.5–16.5) | 10.5 | 2.2 | (6.1–14.9) | 14.8 | 3.5 | (7.9–21.6) |
© 2017 by the authors. Licensee MDPI, Basel, Switzerland. This article is an open access article distributed under the terms and conditions of the Creative Commons Attribution (CC BY) license (http://creativecommons.org/licenses/by/4.0/).
Share and Cite
Elorriaga, N.; Gutierrez, L.; Romero, I.B.; Moyano, D.L.; Poggio, R.; Calandrelli, M.; Mores, N.; Rubinstein, A.; Irazola, V. Collecting Evidence to Inform Salt Reduction Policies in Argentina: Identifying Sources of Sodium Intake in Adults from a Population-Based Sample. Nutrients 2017, 9, 964. https://doi.org/10.3390/nu9090964
Elorriaga N, Gutierrez L, Romero IB, Moyano DL, Poggio R, Calandrelli M, Mores N, Rubinstein A, Irazola V. Collecting Evidence to Inform Salt Reduction Policies in Argentina: Identifying Sources of Sodium Intake in Adults from a Population-Based Sample. Nutrients. 2017; 9(9):964. https://doi.org/10.3390/nu9090964
Chicago/Turabian StyleElorriaga, Natalia, Laura Gutierrez, Iris B. Romero, Daniela L. Moyano, Rosana Poggio, Matías Calandrelli, Nora Mores, Adolfo Rubinstein, and Vilma Irazola. 2017. "Collecting Evidence to Inform Salt Reduction Policies in Argentina: Identifying Sources of Sodium Intake in Adults from a Population-Based Sample" Nutrients 9, no. 9: 964. https://doi.org/10.3390/nu9090964