Article

Comparative Response of the Hepatic Transcriptomes of Domesticated and Wild Turkey to Aflatoxin B1

by
Kent M. Reed
1,*,
Kristelle M. Mendoza
1,
Juan E. Abrahante
2 and
Roger A. Coulombe
3
1
Department of Veterinary and Biomedical Sciences, College of Veterinary Medicine, University of Minnesota, Saint Paul, MN 55108, USA
2
University of Minnesota Informatics Institute, University of Minnesota, Minneapolis, MN 55455, USA
3
Department of Animal, Dairy and Veterinary Sciences, College of Agriculture, Utah State University, Logan, UT 84322, USA
*
Author to whom correspondence should be addressed.
Toxins 2018, 10(1), 42; https://doi.org/10.3390/toxins10010042
Submission received: 29 November 2017 / Revised: 8 January 2018 / Accepted: 10 January 2018 / Published: 13 January 2018
(This article belongs to the Collection Aflatoxins)

Abstract

:
The food-borne mycotoxin aflatoxin B1 (AFB1) poses a significant risk to poultry, which are highly susceptible to its hepatotoxic effects. Domesticated turkeys (Meleagris gallopavo) are especially sensitive, whereas wild turkeys (M. g. silvestris) are more resistant. AFB1 toxicity entails bioactivation by hepatic cytochrome P450s to the electrophilic exo-AFB1-8,9-epoxide (AFBO). Domesticated turkeys lack functional hepatic GST-mediated detoxification of AFBO, and this is largely responsible for the differences in resistance between turkey types. This study was designed to characterize transcriptional changes induced in turkey livers by AFB1, and to contrast the response of domesticated (susceptible) and wild (more resistant) birds. Gene expression responses to AFB1 were examined using RNA-sequencing. Statistically significant differences in gene expression were observed among treatment groups and between turkey types. Expression analysis identified 4621 genes with significant differential expression (DE) in AFB1-treated birds compared to controls. Characterization of DE transcripts revealed genes dis-regulated in response to toxic insult with significant association of Phase I and Phase II genes and others important in cellular regulation, modulation of apoptosis, and inflammatory responses. Constitutive expression of GSTA3 was significantly higher in wild birds and was significantly higher in AFB1-treated birds when compared to controls for both genetic groups. This pattern was also observed by qRT-PCR in other wild and domesticated turkey strains. Results of this study emphasize the differential response of these genetically distinct birds, and identify genes and pathways that are differentially altered in aflatoxicosis.
Key Contribution:
Results of this study support the hypothesis that the greater ability of wild turkeys to detoxify AFB1 is related to higher constitutive expression of GSTA3 coupled with an inherited (genetic) difference in functional expression in domesticated birds. Key differences in GSTA3 expression between the Eastern wild and domesticated turkeys is not unique to these genetic lines but is a broader phenomenon indicating lower fitness in domesticated birds. Results of RNA-seq analysis emphasize the differential response of these genetically distinct birds, demonstrating significant differences in expression of Phase I and Phase II genes and in genes important in toxic response.

1. Introduction

Aflatoxin B1 (AFB1) is a ubiquitous hepatotoxic, hepatocarcinogenic, and immunosuppressive mycotoxin. Poultry and other livestock are exposed to AFB1 by consuming contaminated feed. Many agricultural feed commodities (corn, cottonseed, peanuts, and sorghum) and other foods (figs, tree nuts, and spices) are at especially high risk of being contaminated [1]. AFB1 is practically unavoidable in most feed ingredients, especially corn [2,3,4], and is expected to concomitantly increase with global climate change [5]. Approximately 25% of the world’s annual food supply is contaminated with mycotoxins, and losses attributed to AFB1 are significant to the poultry industry [1].
Poultry are among the most sensitive animals to the toxic effects of AFB1 [6,7]. Domesticated turkeys are among the most sensitive species [8], but wild turkeys are more resistant [9]. Turkey sensitivity is historically important because it was instrumental in the discovery of AFB1 as being responsible for the deaths of domestic turkeys in Europe due to “Turkey X Disease” that was traced to contaminated feed [10]. AFB1 is a potent immunotoxin acting to suppress cell-mediated, humoral, and phagocytic functions in chickens and turkeys [11,12,13]. As a result, it has a wide array of toxic effects, including; reduced feed intake, weight gain, and feed efficiency, and increased mortality, hepatotoxicity, GI hemorrhaging, and susceptibility to bacterial and viral diseases. Embryonic exposure to AFB1 produces dose-related DNA damage [14] and compromised immune response through suppression of humoral and cellular immunity making hatched chicks more susceptible to disease [13]. Thus, in addition to being a potent natural toxin, AFB1 is a powerful “force-multiplier”, amplifying adverse effects of other agents that are detrimental to poultry health.
Aflatoxin B1 toxicity requires bioactivation by hepatic cytochrome P450s (CYPs) to the electrophilic exo-AFB1-8,9-epoxide (AFBO). In the absence of GST activity, AFBO can form adducts that bind to DNA, RNA and other macromolecules, causing immunotoxicity, mutations, and aflatoxicosis [15]. The extreme sensitivity of domesticated turkeys to AFB1 is associated with efficient epoxidation by cytochromes P4501A5 and 3A37 [16], both of which have been cloned, heterologously expressed and functionally characterized [8,17]. Using anti-peptide antibodies, P4501A5 was found to be the dominant bioactivating and metabolizing enzyme at environmentally relevant AFB1 concentrations in turkey liver [8].
While P450-mediated bioactivation plays an important role, the principal determinant of response to AFB1 is the efficiency of detoxification by hepatic glutathione S-transferases (GSTs), most notably alpha class (GSTAs) [18]. The α-GST cluster in turkeys includes six genes, GSTA1.1-A1.3, GSTA2, GSTA3, and GSTA4 [19,20]. Whereas, wild and heritage breed turkeys possess GST-mediated AFBO detoxification activity, livers from domestic turkeys lack detectable activity [20]. Thus, the most likely mechanism for the extreme sensitivity of domestic turkeys is dysfunction in hepatic GSTs, rendering them unable to detoxify AFB1 [21,22,23]. As a result, AFBO forms adducts, which can induce DNA mutations, block transcription and alter translation [24,25].
To understand the response of the domesticated turkey to AFB1 exposure, we initiated study of the hepatic transcriptome following dietary AFB1 challenge. Results of this study identified genes and gene pathways in the liver directly affected by AFB1 [26]. Functional analysis found transcripts significantly dis-regulated by toxicity and affecting pathways of cancer, apoptosis, cell cycle, and lipid regulation. These changes reflect the molecular mechanisms of inflammation, proliferation and liver damage in aflatoxicosis. This study was followed by analysis of spleen tissues from the same birds [27] that found short exposure to AFB1 suppressed innate immune transcripts, especially from antimicrobial genes that are indicative of either increased cytotoxic potential or activation-induced cell death in the spleen during aflatoxicosis.
To better examine the differences between wild and domesticated birds, we developed an in ovo exposure model to provide controlled AFB1 exposure to developing embryos [28]. RNA-seq analysis found AFB1 effects were dependent on both length of exposure and turkey type (domesticated vs. wild), confirming significant differences in the response to AFB1 attributed to genetic background [28]. Transcriptome responses to AFB1 occurred more rapidly in domesticated birds (1 day post-exposure), and led to the up regulation in cell cycle regulators, Nrf2-mediated response genes and coagulation factors. Expression changes in the embryonic liver also suggested cellular responses to oxidative stress and xenobiotics were initiated by AFB1 exposure. In contrast, the response in wild turkey embryos occurred later (five days post-exposure). Combined, these studies demonstrated that GST-mediated hepatic detoxification of AFBO is largely responsible for the differences in resistance between turkey types, but other processes and pathways (i.e., apoptosis, cellular regulation, immune responses) are also important. Whereas, understanding the effects of AFB1 on developing embryos is important in poultry production, the manifestation of AFB1 toxicity is likely to be different in more mature birds with fully developed gastrointestinal systems. The purpose of this study was to compare the hepatic transcriptome response to dietary AFB1 in juvenile (three weeks of age), susceptible (domesticated), and more resistant (wild) turkeys. We hypothesized that transcriptome responses in juvenile birds would reflect the more mature status of the gastrointestinal and antioxidant systems than those of embryos.

2. Results

Liver measurements were collected at the end of the exposure trial to characterize phenotypic effects of AFB1 toxicity. Livers of domesticated (DT) birds (average = 20.54 g) were nearly three times the mass of those from Eastern wild (EW) birds (8.3 g) primarily due to differences in body size (average = 1147.5 g and 396.1 g, respectively). Liver weights of AFB1 turkeys were smaller than those of the control (CNTL) groups. In DT, average liver mass at the conclusion of the trial ranged from 14.76 g to 23.98 g in the AFB1 group (mean = 20.02 ± 2.44 g) and from 17.39 g to 25.11 g in controls (21.00 ± 2.12 g). Although this difference in liver mass was not significant (t-test p = 0.1962), when corrected for body weight (% BW) the livers of birds from the AFB1-treated group were significantly smaller (p = 0.0098). Livers of AFB1-treated EW birds (7.19 ± 1.06 g) were similarly smaller than those of control birds (9.43 ± 1.11 g). This difference was significant for absolute mass (p = 0.0005) and nearly so for % BW (p = 0.0531).
Sequencing of RNA libraries produced over 195 M reads. The number of reads per library ranged from 10.8 M to 14.6 M (average 12.2 M, Table 1). After trimming and filtering, median Q scores were consistently high and ranged from 36.4 to 37.4 among the forward and reverse reads. The number of reads per treatment group was balanced and ranged from 11.5 to 12.7 M, with an average of 12.21 ± 0.5 M. Approximately 91% of the quality-trimmed reads mapped to the annotated turkey gene set (NCBI Annotation 101, Table 1). This percentage was consistent across treatment groups and the percentage of aligned read pairs exceeded 89.7% (average = 90.8%); the majority of reads (average = 85.3%) mapped concordantly (Table 1). Based on mapping, the estimated mean library insert was 191.7 bp.
Principal component analysis (PCA) of normalized read counts visualized variation among the treatment groups (Figure 1). Groups clustered distinctly according to treatment (AFB1 versus control) within the first two principal components, accounting for approximately 95% of the observed variation. Hierarchical clustering of groups by Euclidean distance reiterated the relationships shown by PCA (Figure S1). After segregating by AFB1 treatment, groups secondarily cluster by type (domesticated versus wild), with the exception of samples N3L (domesticated) and EW1L (wild) that clustered with the opposite bird type. Significant differences in overall gene counts among groups are shown in the heat map of co-expressed genes.

2.1. Gene Expression

Evidence of expression (mean mapped reads ≥ 1.0 in at least one treatment group) was detected for 19,764 genes (tRNAs excluded), with an average of 17,137.5 genes being detected per group (81.56% of the turkey gene set) (Table S1). Mean read depth was 394.8 reads per gene. When limited to an average number of mapped reads ≥ 3.0, the number of expressed genes ranged from 14,399 to 17,230 among treatment groups (average 15,979.25, Table 1). Distribution of unique and shared expressed genes is illustrated in Figure S2. A total of 14,373 genes (81.2%) was co-expressed among all groups, and the number of co-expressed genes within the EW and DT lines was 14,908 and 14,669, respectively. Each treatment group had distinct sets of uniquely expressed genes, but that number was considerably greater in the AFB1-treatment groups (2169, 12.3%) when compared to controls (300, 1.6%, Table 1 and Table S1).

2.2. Differential Transcriptomic Expression: AFB1 Effects

Table S2 provides the full list of genes showing significant differential expression (DE). DE was observed for 9620 genes (FDR p-value < 0.05, log2FC = −9.670 to 9.358) in wild turkeys exposed to AFB1 when compared to control birds with 4176 genes having |log2FC| > 2.0 (Table 2). Similarly, 11,325 DE genes were observed for the AFB1-treated DT turkeys (FDR p-value < 0.05, log2FC = −14.133 to 12.676) with 4621 genes having |log2FC| > 2.0. The majority of DE genes (3380) were shared in both bird types, with 796 being unique to wild and 1241 unique to the domesticated birds (Figure 2). The majority of DE genes was up regulated by AFB1 treatment in both the wild (2717, 65%) and domesticated birds (2914, 70%). Of the 50 genes showing the greatest fold change with treatment, seven (ANGPTL3 [angiopoietin-like 3], GC [group-specific component (vitamin D binding protein)], LOC104911607 [uncharacterized ncRNA], LOC100541166 [alpha-1-acid glycoprotein 2-like], LOC100542070 [SERPINA1-like, alpha-1-antitrypsin-like], NME4 [NME/NM23 nucleoside diphosphate kinase 4], and TAT [tyrosine aminotransferase]) were shared between the bird types (Table S3). In mammals, ANGPTL3 is in part involved in regulation of lipid and glucose metabolism by inhibiting the lipolysis of triglyceride-rich lipoproteins [29,30]. This transcript was highly down regulated in the AFB1-treated turkeys (log2FC = −7.94 and −14.13 in EW and DT, respectively). Similarly down regulated was GC an important protein in vitamin D transport and storage, actin-scavenging, and enhancement of complement component 5a activity for neutrophils in inflammation and during macrophage activation [31]. Comparison analysis in IPA found the most significant canonical pathways to include “Axonal Guidance Signaling” and “Hepatic Fibrosis/Stellate Cell activation”. Hepatic stellate cells are closely linked to the progression of hepatic fibrosis [32].

2.2.1. Shared DE Genes

Changes in expression of the 3380 shared significant DE genes were highly correlated (r2 = 0.909, F = 0.010, Figure S1) and essentially linear, except for genes with the greatest down regulation where log2FC in the domestic birds tended to be of greater magnitude than observed for the wild birds. This is consistent with a common physiological response to AFB1 exposure. Of the 3380 shared DE genes, 1609 IDs mapped to the G. gallus gene REFLIST and statistical overrepresentation tests (PANTHER) of these shared DE genes found the greatest enrichment in the Biological Process category for “amino acid processes” and “negative regulators of hemostasis and wound healing” (Table S4). Comparison analysis in IPA found the most significant toxicology functions consistent with cellular damage. Categories with the greatest number of included genes included “liver hyperplasia/hyperproliferation” (p = 5.10 × 10−41), “cardiac hypertrophy” (p = 2.91 × 10⁻¹²), “renal necrosis/cell death” (p = 7.78 × 10⁻¹²), and “liver steatosis” (p = 1.75 × 10⁻¹¹). Highest activation (Z) scores were obtained for “Integrin Signaling”, “Rho Family GTPase signaling”, and “NFAT regulation of immune response” pathways.
Only two loci among the 3380 shared significant DE genes showed opposite directional expression changes between wild and domesticated birds. CD96, a T cell-specific receptor, was significantly up regulated in response to AFB1 in the EW birds (log2FC = 3.83) but down regulated in DT (log2FC = −2.15). CD96 may play a role in the adhesive interactions of activated T and NK cells when actively engaging diseased cells within areas of inflammation [33]. A second locus (LOC104911020, serum amyloid A protein-like) was significantly down regulated in response to AFB1 in EW birds (log2FC = −3.99), but up regulated in DT (log2FC = 2.22). Serum amyloid A (SAA) proteins are a family of apolipoproteins produced primarily by the liver and are associated with high-density lipoprotein in plasma [34].

2.2.2. Unique Responses

Although the greatest number of DEGs was shared between the domesticated and wild turkey comparisons, 796 DEGs were uniquely affected in the wild birds exposed to AFB1 in comparison to their controls (Figure 2). Up-regulated genes with the greatest fold change in the EW birds (Table S3) included several transcription factors (DMRT2, FOXF2, HOXD10, HOXA9, HOXD8) and transporters (LOC100548321 [pendrin], SLC13A1, SLC6A18). DEGs with the greatest negative fold change (down regulated) include the cytochrome P450s (LOC100548279 [CYP2K4-like], LOC100546803 [CYP8B1], and LOC100539035 [CYP7A1]), metabolic inhibitors (LOC100542224 [alpha-1-antitrypsin-like], INHBC [inhibin, beta C], LOC104912821 [ovostatin homolog], LOC104915655 [alpha-2-macroglobulin-like]), and several ncRNAs. Of the 796 unique DEGs in the EW comparison, 336 had mapped IDs in G. gallus REFLIST and overrepresentation tests in PANTHER found greatest enrichment in the Biological Process category were genes in the GO classifications of “negative regulation of neurogenesis” (GO:0050768) and “negative regulation of cell development” (GO:0010721) with 5.58- and 5.13-fold enrichment, respectively (Table 3). Effected Cellular Component groups included “elements of the sarcolemma” (GO:0042383) and “proteinaceous extracellular matrix” (GO:0005578) enriched by 7.65- and 3.92-fold, respectively.
A greater number of DEGs (1241) were uniquely affected in the domesticated birds exposed to AFB1, in comparison to their controls. Of the 50 DEGs with the greatest fold change in the domesticated birds, only two were up regulated; SMIM24 (small integral membrane protein 24) and LOC100546964 (cis-aconitate decarboxylase-like) (Table S3). The function of SMIM24 is currently unknown. In humans, cis-aconitate decarboxylase (ACOD1 = IRG1) is highly expressed in mammalian macrophages during inflammation where it catalyzes itaconic acid production [35]. Among the most down-regulated loci in DT were ANGPTL3 (angiopoietin-like 3) which in humans, is expressed predominantly in the liver and functions in angiogenesis, and Fibrinogen (FGA, FGB, and FGG) and other coagulation components like coagulation factor IX (F9). This set of down-regulated DEGs also included LOC100547030 (a cytochrome P450 2W1-like gene). In humans, CYP2W1 is able to metabolically activate several pro-carcinogens, including AFB1, into cytotoxic products [36]. Due to its selective expression, CYP2W1 is suggested as a potential prognostic biomarker in hepatocellular and other carcinomas [37].
GO analysis of the DEGs unique to the domestic turkey liver indicate a number of distinctive responses to AFB1. Of the 1241 DEGs, 636 mapped to IDs in G. gallus REFLIST and overrepresentation tests in PANTHER found the greatest enrichment for biological process categories “organelle fission” (GO:0048285), “oxidation-reduction process” (GO:0055114), and “regulation of immune system process” (GO:0002682) (Table 4). Cellular component categories were enriched for mitochondrial and membrane components.

2.3. Differential Transcriptomic Expression: Eastern Wild vs. Domesticated Turkey

2.3.1. Control

Comparison of the transcriptomes of control EW and DT birds found 774 DEGs (FDR p-value < 0.05, log2FC = −8.826 to 8.213), with 184 having log2FC > 2.0 (Figure 3, Table S5). Of the 184 genes, seven were shared in common in the EW vs. DT AFB1 comparisons (Figure 3). The shared loci included 5 genes up regulated in EW birds (ANGPTL3, CAMK4, LOC100538933 [probable ATP-dependent RNA helicase DDX60], LOC100545362 [ncRNA], LOC104912934 [ncRNA]), and two that were down regulated (LOC104910139 [ncRNA], LOC104915640 [KIAA1755 homolog]) when compared to DT. These shared genes are primarily metabolic and transcriptional regulators. In mammals, ANGPTL3 [angiopoietin-like 3] is a hepatokine involved in regulation of lipid and glucose metabolism and in the regulation of angiogenesis [37], CAMK4 [calcium/calmodulin-dependent protein kinase IV] is implicated in transcriptional regulation in immune and inflammatory responses [39], and DDX60 positively regulates DDX58/RIG-I- and IFIH1/MDA5-dependent type I interferon and interferon inducible gene expression [40].
Of the 177 DEGs unique to the control group birds the majority (69%) were up regulated in the wild birds as compared to the domesticated birds. GO analysis found only a single biological process category (“single-organism process” GO:0044699) enriched among these genes (fold enrichment = 1.66, p-value = 4.15 × 10⁻²). Interestingly, the up-regulated DEGs observed in the control-diet comparison also included glutathione S-transferase A3 (GSTA3). This gene was expressed at a 5.3-fold higher level (log2FC = 2.313) in the EW birds when compared to the DT birds (Figure 4A), suggesting a higher constitutive expression in the former.
The genes showing the greatest positive fold change was the Interferon-inducible iron-sulfur cluster-binding antiviral protein RSAD2, radical S-adenosyl methionine domain containing 2, with log2FC = 8.2 and the interferon alpha-inducible protein 27-like 2B (IFI27L2B, LOC100550948). In mammals, RSAD2 can inhibit a wide range of DNA and RNA viruses, and has also been shown to play a role in CD4+ T-cells activation and differentiation [41], whereas IFI27L2B mediates virus-induced apoptosis [42]. These suggest heightened immune system activity in the wild birds.
Two genes involved in cell cycle control and chromosomal replication were also expressed at a significantly higher level in the wild bird controls. CD1, chromatin licensing and DNA replication factor 1 and MCM3, minichromosome maintenance complex component 3 had log2FC = 2.74 and 2.4, respectively (Table S5). Interestingly several other genes involved “cell cycle control” and “chromosomal replication” were also significantly up regulated in the wild birds, although with log2FC < 2.0 (Table S2). These included CDC45 (cell division cycle 45), DNA2 (DNA replication helicase/nuclease 2), the minichromosome maintenance complex components MCM2, MCM4, MCM5, MCM6, and MCM8, and POLE (DNA polymerase epsilon, catalytic subunit). These together with CD1 and MCM2 were components of the most significant Canonical Pathway identified by IPA (p = 1.1 × 10⁻⁸, ratio 0.25). Genes showing the greatest negative fold change were GYG2 (glycogenin 2), IQCD (IQ Motif Containing Protein D), and LOC100540418 (BPI fold-containing family C protein-like) (Table S5). GYG2 is involved in the initiation reactions of glycogen biosynthesis [43], and IQCD has been shown to interact with the RXR nuclear hormone receptor, and is thought to function as a transcriptional coactivator [44].

2.3.2. AFB1 Treatment

Comparison of the transcriptomes of EW and DT birds fed the AFB1 diet revealed 903 DEGs (FDR p-value < 0.05, log2FC = −7.987 to 9.262), of which, 143 had log2FC > 2.0 (Figure 3, Table S5). Of these 143 DEGs, 136 were unique to the AFB1-treated birds. The majority (76%) of the DEGs were up regulated in EW relative to DT in a similar fashion to that seen for the control-group comparison. Unlike the control-fed groups, GO analysis found the DE genes from the AFB1 between-line comparison highly enriched in several biological process categories (Table 5) including processes related to coagulation, inflammatory response and apoptosis. For example, up regulated in EW relative to DT were three components of the blood clotting factor fibrinogen (FGA, FGB, and FGG) and several other coagulation-related genes (vitamin K-dependent coagulation factor IX (F9), serpin peptidase inhibitor, member 10 (SERPINA10), histidine-rich glycoprotein (HRG), serpin peptidase inhibitor, clade C (antithrombin), member 1 (SERPINC1)). Although down-regulated genes did not show significant enrichment for a particular bioprocess, EW birds may produce less of the pro-inflammatory cytokine IL-17A (LOC100546746).
Expression of many enzymes responsible for xenobiotic metabolism, with an emphasis on those with specificity towards AFB1, was significantly altered by the AFB1 treatment (Table 6). With a few exceptions, AFB1 largely caused down regulation of these genes in both types of turkeys when compared to controls; within the control groups, the number of DEGs was considerably smaller and the magnitude of expression changes was also smaller, but directionally similar. Hepatic expression of CYP and GST genes was typically greater in EW vs. DT. Five cytochrome P450 loci; CYP1A5 (cytochrome P450, family 1, subfamily A, polypeptide 5, log2FC = 2.404), LOC100547030 (cytochrome P450 2W1-like, log2FC = 5.87), LOC100542486 (cytochrome P450 1A4, log2FC = 3.150), LOC100548433 (cytochrome P450 2K1-like, log2FC = 3.025), and LOC104915479 (cytochrome P450 2H1-like, log2FC = 2.135) were among the unique DEGs in the EW vs. DT comparison.
The turkey possesses six α-GST cluster genes, all of which possess detectable enzymatic activities toward prototype substrates in a recombinant expression system [19], unlike hepatic forms. Expression of the GSTAs was significantly altered by AFB1 treatment. With the exception of GSTA3, GSTA1.1, 1.3, 2 and 4 were down regulated, while GSTA3 increased with dietary AFB1 in DT but not EW (log2FC = 1.4667, Table 6). It is noteworthy that GSTA3 expression was significantly higher in EW birds when compared to DT birds for both control (log2FC = 2.3130) and AFB1 (log2FC = 0.9211) group comparisons (Table 6, Figure 4A).
Expression differences in GSTA3 observed in RNA-seq read counts were confirmed by qRT-PCR. GSTA3 expression varied widely among treatment groups with experiment-wise threshold values (ΔCt) ranging from 17.27 to 26.06. Expression of GSTA3 transcripts was significantly higher in AFB1-treated birds than controls for both genetic groups (EW, p = 0.0061 and DT, p = 0.0036). Relative GSTA3 expression was also similarly variable in the other commercial (BB) and wild-type birds (RGW) (Figure 4B) where GSTA3 expression was higher in AFB1-treated birds. This difference, however, was only significant in the BB comparison (p = 0.0015). Relative expression in BB birds was slightly higher than observed in the DT (Nicholas strain) birds and also higher in RGW birds (Rio Grande wild) when compared to EW. This result demonstrates that the differences observed in GSTA3 expression between the EW and DT birds is not unique to these genetic lines but is a broader, wild versus domesticated-bird phenomenon.

3. Discussion

When compared to their domestic relatives, wild turkeys are relatively resistant to aflatoxicosis. This difference is largely due to functional hepatic GSTA-mediated detoxification activity of the bioactive electrophilic AFBO intermediate that is completely lacking in domesticated birds [20]. The present data indicates other pathways may also account for difference in AFB1 susceptibility, such as cellular regulation, modulation of apoptosis, inflammatory responses, and other pathways relevant to AFB1 pathogenesis. The liver is the principal organ of AFB1 bioactivation and detoxification [6,21,22,24,45]. In turkeys, AFB1 causes reduced feed intake, weight gain, and immunological function in a dose-dependent fashion [46,47]. Dietary exposure in poultry causes lipid accumulation, resulting in hepatomegaly and increases in liver:body weight ratios [48,49,50]. During the 14 day exposure, decreased relative liver mass initially occurred in both EW and DT consistent with that observed in chickens [49] and wild turkeys [9].
Numerous significant DEGs occurring in the livers of AFB1-treated birds have potential roles in lipid metabolism or accumulation. AFB1 is known to alter lipid metabolism and increase lipid content resulting in pale or yellowed pigmentation [46]. Dietary AFB1 primarily down regulated several hepatic apolipoprotein genes (cofactors in lipid binding and transport) in the turkey, and dis-regulation of genes, such as ANGTPL3, would have direct effects on lipids. Significant up regulation of ANGTPL3 was observed for both EW and DT birds treated with AFB1. This would likely stimulate synthesis of plasma triglycerides (TG) via the inhibition of lipoprotein lipase (LPL) activity. In both AFB1-treated groups, LPL was significantly down regulated (log2FC = −2.905 and −6.032 in EW and DT birds, respectively). LPL functions in the hydrolysis of triglycerides in lipoproteins and is essential to lipid metabolism and storage. Significant down regulation of LPL was also observed in our previous analyses of AFB1-treated domesticated Orlopp turkeys [26] and decreased expression of LPL occurs in AFB1-treated chickens [50].
As expected, the significant hepatic DEGs included the Phase I and II detoxifying enzymes that we have shown are relevant to AFB1 exposure in turkeys (Table 6). Previous studies have demonstrated efficient epoxidation by hepatic turkey cytochromes CYP1A5 and CYP3A37 [16]. At environmentally-relevant hepatic concentrations (<50 uM) CYP1A5 bioactivates the majority (~98%) of AFB1 [17,21], whereas CYP3A37 predominates at much higher substrate concentrations unlikely to be achieved in the livers of exposed animals [16]. Based on RNA-seq, it is clear that dietary AFB1 significantly down regulated CYP1A5 in both EW and DT birds, but more significantly so in DT. This result is at odds with our earlier findings in another strain of DT (Orlopp) where almost no expression change was observed for CYP1A5 and CYP3A37, and where none of the transcripts associated with CYP genes had significant DE as a result of AFB1 treatment [26]. Significant down regulation of CYP1A5 in response to AFB1 was also observed in ducks, another avian species with high AFB1 susceptibility [51]. Several other P450 genes in addition to 1A5 and 3A37 had significant DE in the present study (Table 6), including both CYP2W1 and CYP2K1. Interestingly, these genes have been shown in other species to activate AFB1 into cytotoxic products [52,53]. We have found CYP2W1-like transcripts to have significant DE in DT embryos challenged with AFB1 [28]. Down regulation of CYP1A5 in both EW and DT birds could affect their overall ability to bioactivate AFB1. However, as this expression change was seen in both bird types, it does not account for the differences seen in AFB1 susceptibility [16].
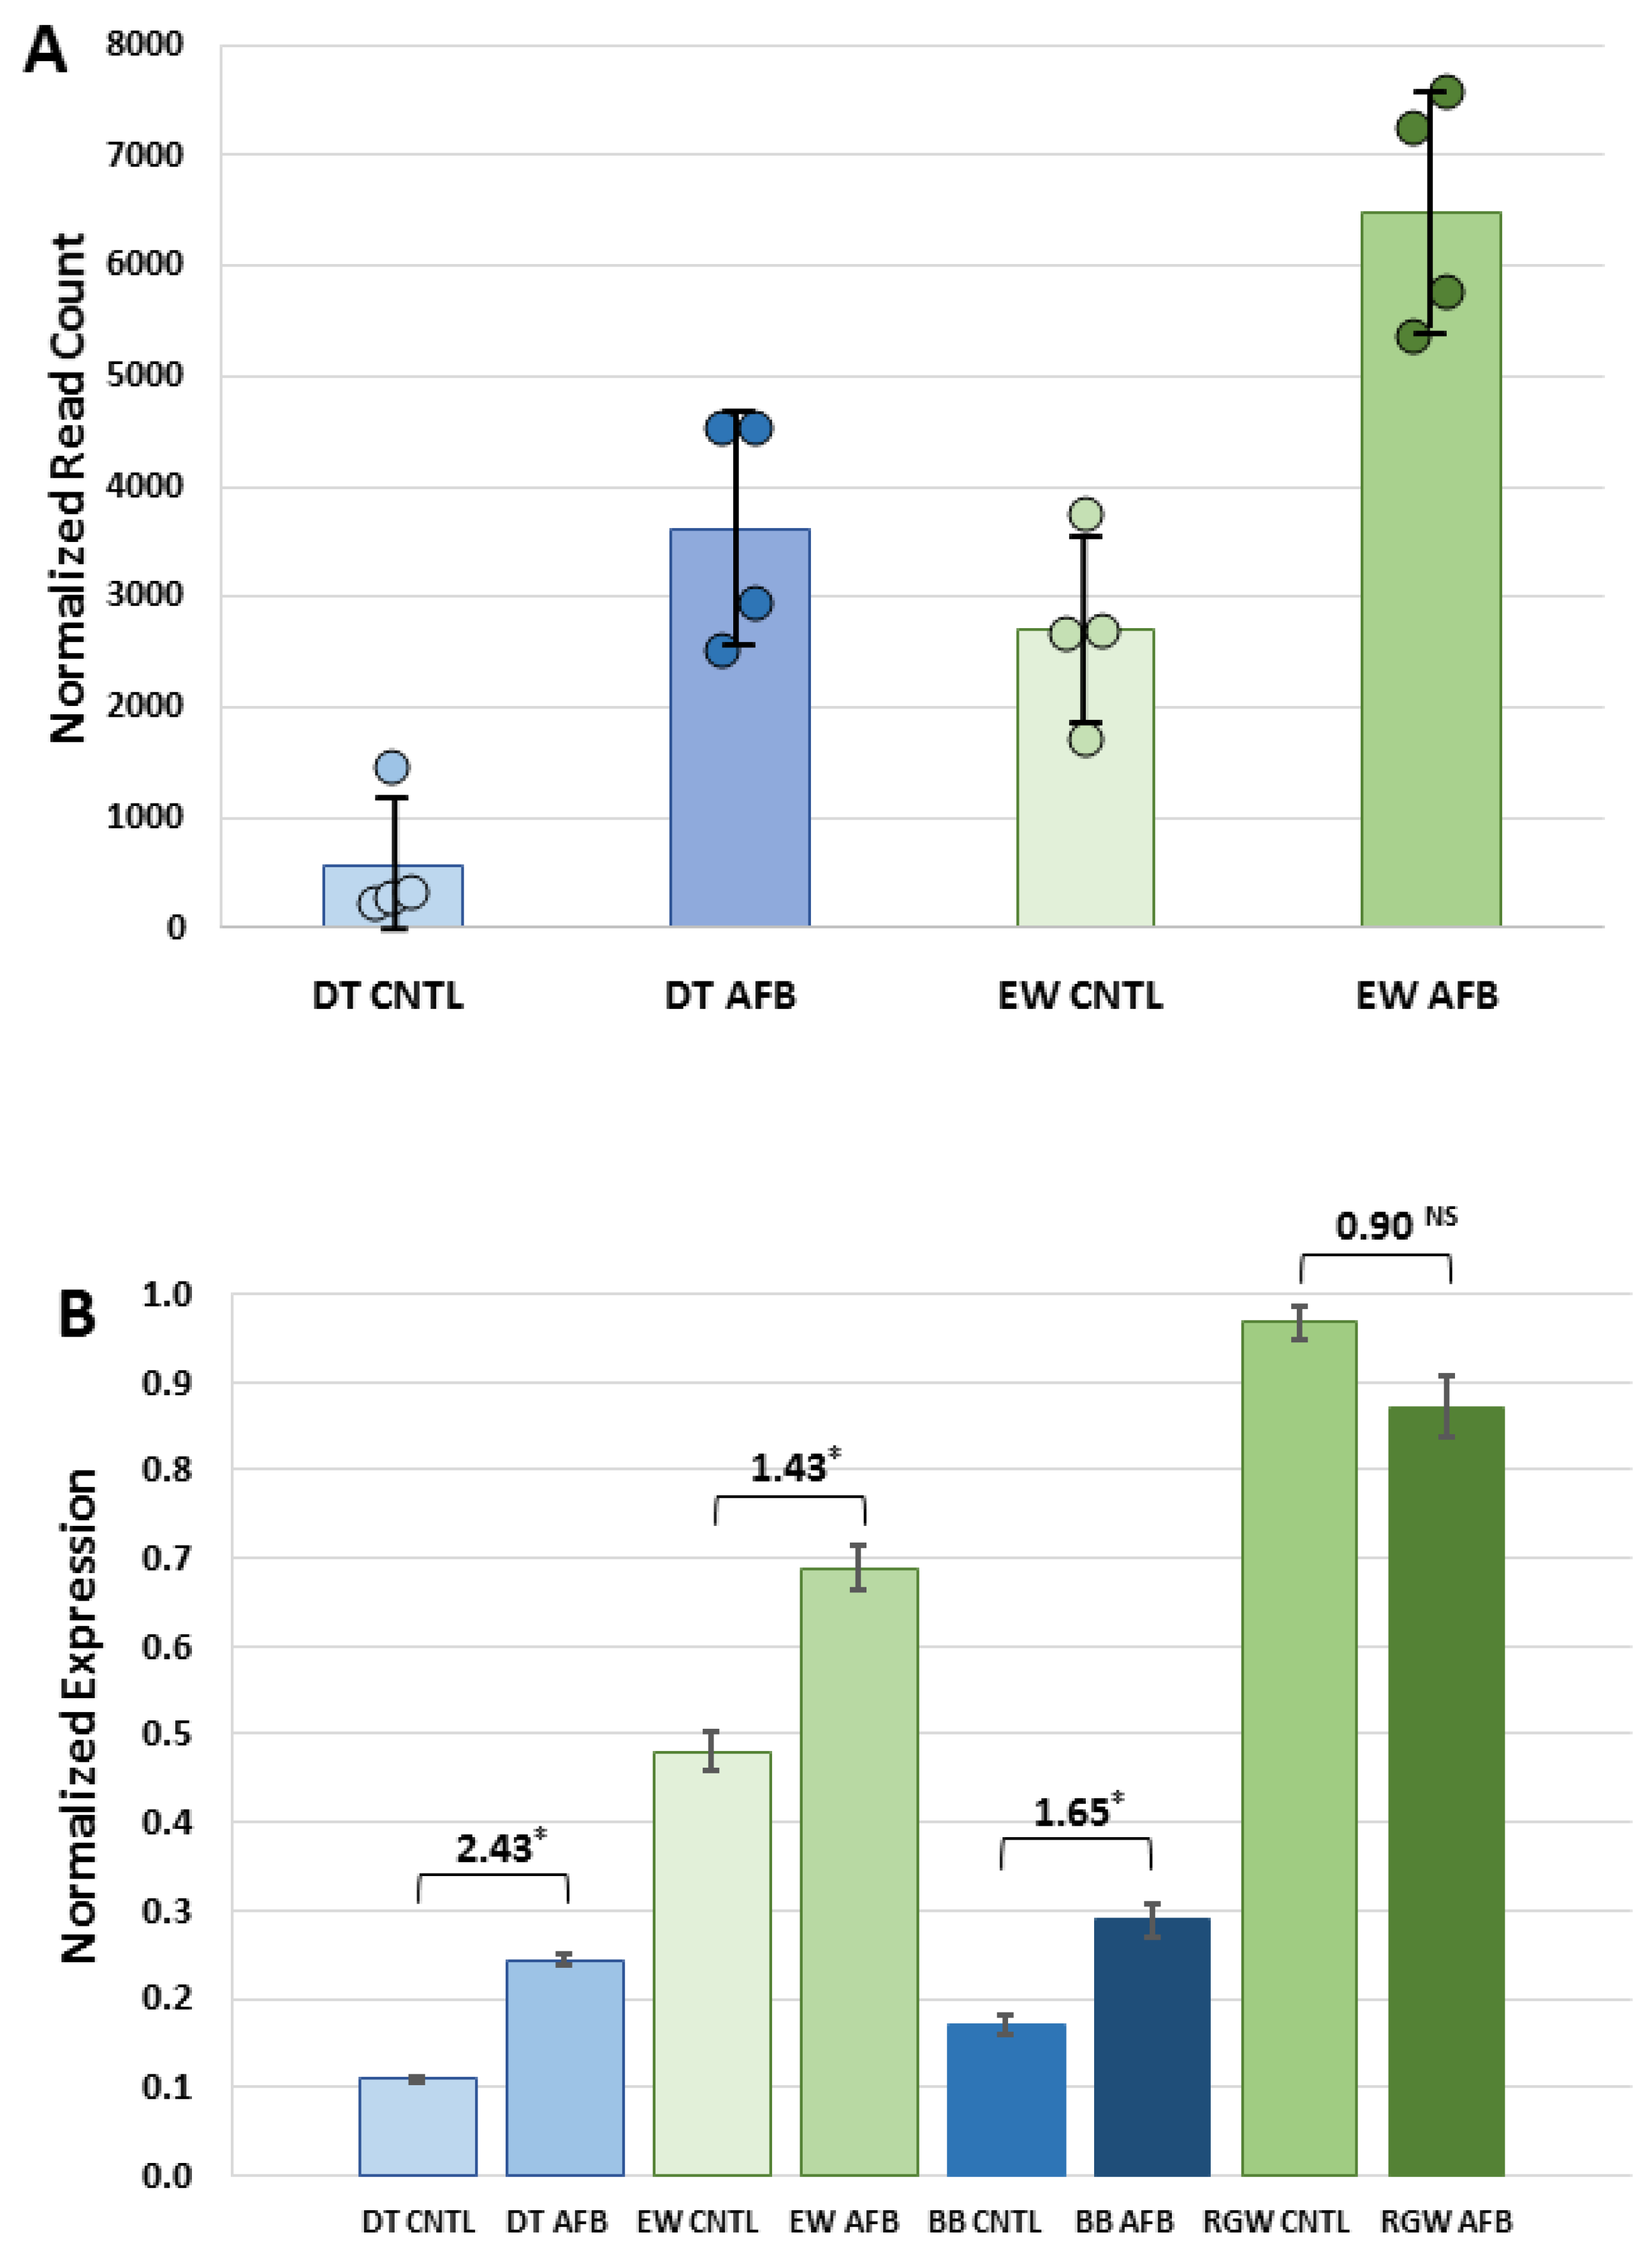
Expression of GSTs with affinity toward AFBO is a known predictor of relative AFB1 resistance [20]. Constitutive expression of GSTA3, the ortholog to the putative AFB1-protective GSTA3 isoform in mice [18] was significantly higher in EW than in DT birds. Dietary AFB1 caused significant down-regulation of hepatic α-class GSTs, with the exception of GSTA3, where increased expression of this isoform was observed in the AFB1-treated DT group. This pattern was also observed in the qRT experiments of other wild (RGW) and domesticated (BB) turkeys. A similar pattern of GSTA3 expression in response to AFB1 was also observed in turkey embryos early after exposure, where small increases were observed in DT [28] and in ducks [51].
Expression of GSTA3 mRNA in turkeys is not correlated with AFB1 sensitivity in that domesticated birds lack hepatic GST-mediated AFBO conjugating activity [19], despite expression of GSTA3. Hepatic cytosols isolated from wild turkeys possess functional AFBO-trapping GSTs [20]. While hepatic GSTs in DT lack detoxification activity, with or without AFB1 treatment, increased GSTA3 expression in DT in response to AFB1 may reflect a greater inflammatory response or perhaps an indicator of hepatocyte injury. Although GSTs are toxicologically important for their role in “trapping” electrophilic intermediates by conjugating with the nucleophilic GSH, they may also play a role in cell signaling through binding of non-substrate ligands to mediate cell proliferation and cell death [54]. Up regulation of GSTAs may also reflect antioxidant functions as AFB1, exposure in poultry can lead to oxidative stress and lipid peroxidation [55,56]. When combined, these results support the hypothesis that the greater ability of wild turkeys to detoxify AFB1 is related to higher constitutive expression of GSTA3, coupled with an inherited (genetic) difference in functional expression in domesticated birds. Expression in these CYP and GSTAs suggests that the physiological response to AFB1 is mediated through genes not experimentally linked in the turkey to AFB1 metabolism.
Up regulation of transcription factors and metabolic inhibitors characterized the shared response to AFB1. Taken together, these are genes that comprise the molecular mechanisms underlying aflatoxicosis. Recurrent themes amongst the many DEGs of AFB1-treated birds are linked by functional analysis to inflammation, apoptosis, the cell cycle (cancer), or lipid regulation, suggesting common underlying regulation. For example, recent studies of AFB1-induced hepatocellular carcinoma have examined regulatory ncRNAs (miRNA and lncRNA) [57,58]. Studies in the rat, another AFB1-susceptible species, have found coincident DE of transcripts that are related to these same functions and specific lncRNAs in hepatocellular carcinomas [59,60]. Our study of miRNA expression in the same turkey liver tissues used in the present study is currently underway (Coulombe, unpublished).
Transcriptome analysis not only includes genes responding to the presence of AFB1, but also reveals genes dis-regulated as a response to toxic insult. Significant up regulation was seen for several vasoactive peptides, including, neuropeptide Y (NPY), somatostatin (SST), substance P (tachykinin, TAC1), and vasoactive intestinal peptide (VIP), suggesting altered sinusoidal blood flow with AFB1 treatment. Also, affected were extracellular matrix proteins including glycoproteins (e.g., HAPLN1 and HAPLN3), protein receptors (KERA, LAMB3, LUM, LRRN2, and LRRN3), proteinase inhibitors (TIMP4), signaling molecules (SFRP1, Wnt6 and 7a), and structural proteins (COL10A1, FRAS1). Expression of the majority of the ADAM metallopeptidases was altered in AFB1 treatment (Table S2). Some of these proteases are thought to be involved in regulating matrix degradation [61]. Unique response in the EW birds was seen in genes that negatively regulate cellular processes, components of the extracellular matrix and accumulation of coagulation factors. DT birds showed greater up regulation of genes responding to inflammation, which was likely due to the reduced ability to detoxify AFBO. Dis-regulation of extracellular matrix proteins is a resulting effect of chronic liver injury [32]. Aflatoxin inhibits cell-mediated immunity in domestic poults [47,62] with the suppression of lymophoblastogenesis [9], T-helper, or cytotoxic T-cell activity [63].
Multiple genes involved in pathways of coagulation (FGA, FGB, FGG, F9, HRG, SERPINA10, and SERPINC1) were expressed at higher levels in EW as compared to DT, where they were among the genes with the highest negative fold change. Lower expression of coagulation factors was also seen in livers of domesticated turkey embryos after just 5 days of exposure to AFB1 [28]. AFB1 has been shown to increase blood clotting times in poultry [64,65] and activities of coagulation factors, such as F9, were reduced by dietary AFB1 in chickens [50,65]. Effects on hemostasis are more dramatic in turkeys than chickens [66]. In comparison, only small non-significant increases in prothrombin times were seen in wild turkeys exposed to AFB1 [9], which is consistent with the gene expression patterns observed in the liver transcriptomes.
In a previous comparison of EW and DT after in ovo exposure [28], we used RNA-seq to examine gene expression responses to AFB1 in the embryonic hepatic transcriptomes and identified gene expression effects dependent on exposure time and turkey type. Most notable in turkey embryos was the more rapid response of the DT, which was likely due to their lack of GST activity towards the AFBO-epoxide. The present study was designed to contrast gene expression responses in the hepatic transcriptome of growing domesticated and wild turkeys during AFB1 exposure. In conclusion, our findings emphasize the differential response of these genetically distinct birds, demonstrating significant differences in expression of Phase I and Phase II genes and in genes important in cellular regulation, modulation of apoptosis, and inflammatory responses. The molecular basis for the differences in AFB1 detoxification observed between EW and DT birds, and the mechanism of GSTA silencing in DT remain under investigation.

4. Materials and Methods

This study used two turkey subspecies previously demonstrated to vary in AFB1-detoxifying GST activity. Eggs from domesticated (DT = Nicholas) and a wild subspecies (Eastern wild = EW, Meleagris gallopavo silvestris) were obtained from Privett Hatchery (Portales, NM, USA) and hatched at Utah State University. Birds were sexed by PCR [67]. Male turkey poults were maintained on an ad libitum standard grow-up soy-based diet and acclimated to the facility for two weeks. At the end of this period, males from each line (n = 8 for EW and n = 10 for DT) were equally assigned to one of two treatment groups and subjected to a short-term AFB1-treatment protocol [21,68]. For the AFB1 treatment, the diet of challenge birds was amended beginning on day 15 with 320 ppb AFB1 (Sigma-Aldrich, Inc., St. Louis, MO, USA) that continued for 14 days. Control birds continued on the standard diet with AFB1 levels below detection limits (<10 ppb), based on testing of 50 g of feed extracted and cleaned using Mycosep 112 AflaZON cleanup columns (Romer Labs., Union, MO, USA), and examined by HPLC. Birds were weighed three times per week and feed and water availability checked daily. At the conclusion of the 14 day challenge period, birds were sacrificed by CO2 asphyxiation and blood collected by cardiac puncture for DNA and serological analysis. Livers were removed, examined, weighed, sampled, and fixed in neutral buffered formalin for histological examination. Portions of the liver tissues infused with RNAlater (ThermoFisher Scientific, Waltham, MA, USA) for RNA-Seq analysis. All of the procedures were under the authority and institutional approval of Utah State University’s Animal Use and Care Committee. Ethical approval code: 2670, Date of approval: 26 September 2016.

4.1. RNA Isolation and Sequencing

Total RNA was isolated from each sample by TRIzol extraction (Ambion, Inc., Foster City, CA), DNase-treated (Turbo DNA-freeTM Kit, Ambion, Inc.), and stored at −80 °C. Initial RNA concentration and quality was assessed by spectrophotometry (Nanodrop 8000). RNA samples were submitted for library preparation and sequencing at the University of Minnesota Genomics Center (UMGC). Replicate samples were sequenced from each treatment group (n = 4). Each sample was quantified by RiboGreen assay (Invitrogen Corp., Carlsbad, CA, USA) and RNA integrity confirmed on a 2100 Bioanalyzer (Aligent Technologies, Santa Clara, CA, USA). Each sample had clear 18S and 28S peak separation on the electropherograms and an average RNA Integrity Number (RIN) of 6.3. Indexed libraries (n = 16) were constructed with 1 μg of total RNA/sample with the TruSeq RNA Sample Preparation Kit version 2 (Illumina, Inc., San Diego, CA, USA) and size selected for approximately 200 bp inserts. Libraries were multiplexed, pooled, and sequenced over two lanes on the HiSeq 2000 using v3 chemistry (Illumina, Inc.) to produce 101-bp paired-end reads. Data are deposited in the NCBI Gene Expression Omnibus (GEO) repository as part of SRA BioProject 346253.

4.2. RNA-seq Data Analyses

Sequence reads were groomed (Trimmomatic, [69]) and quality checked (FastQC, [
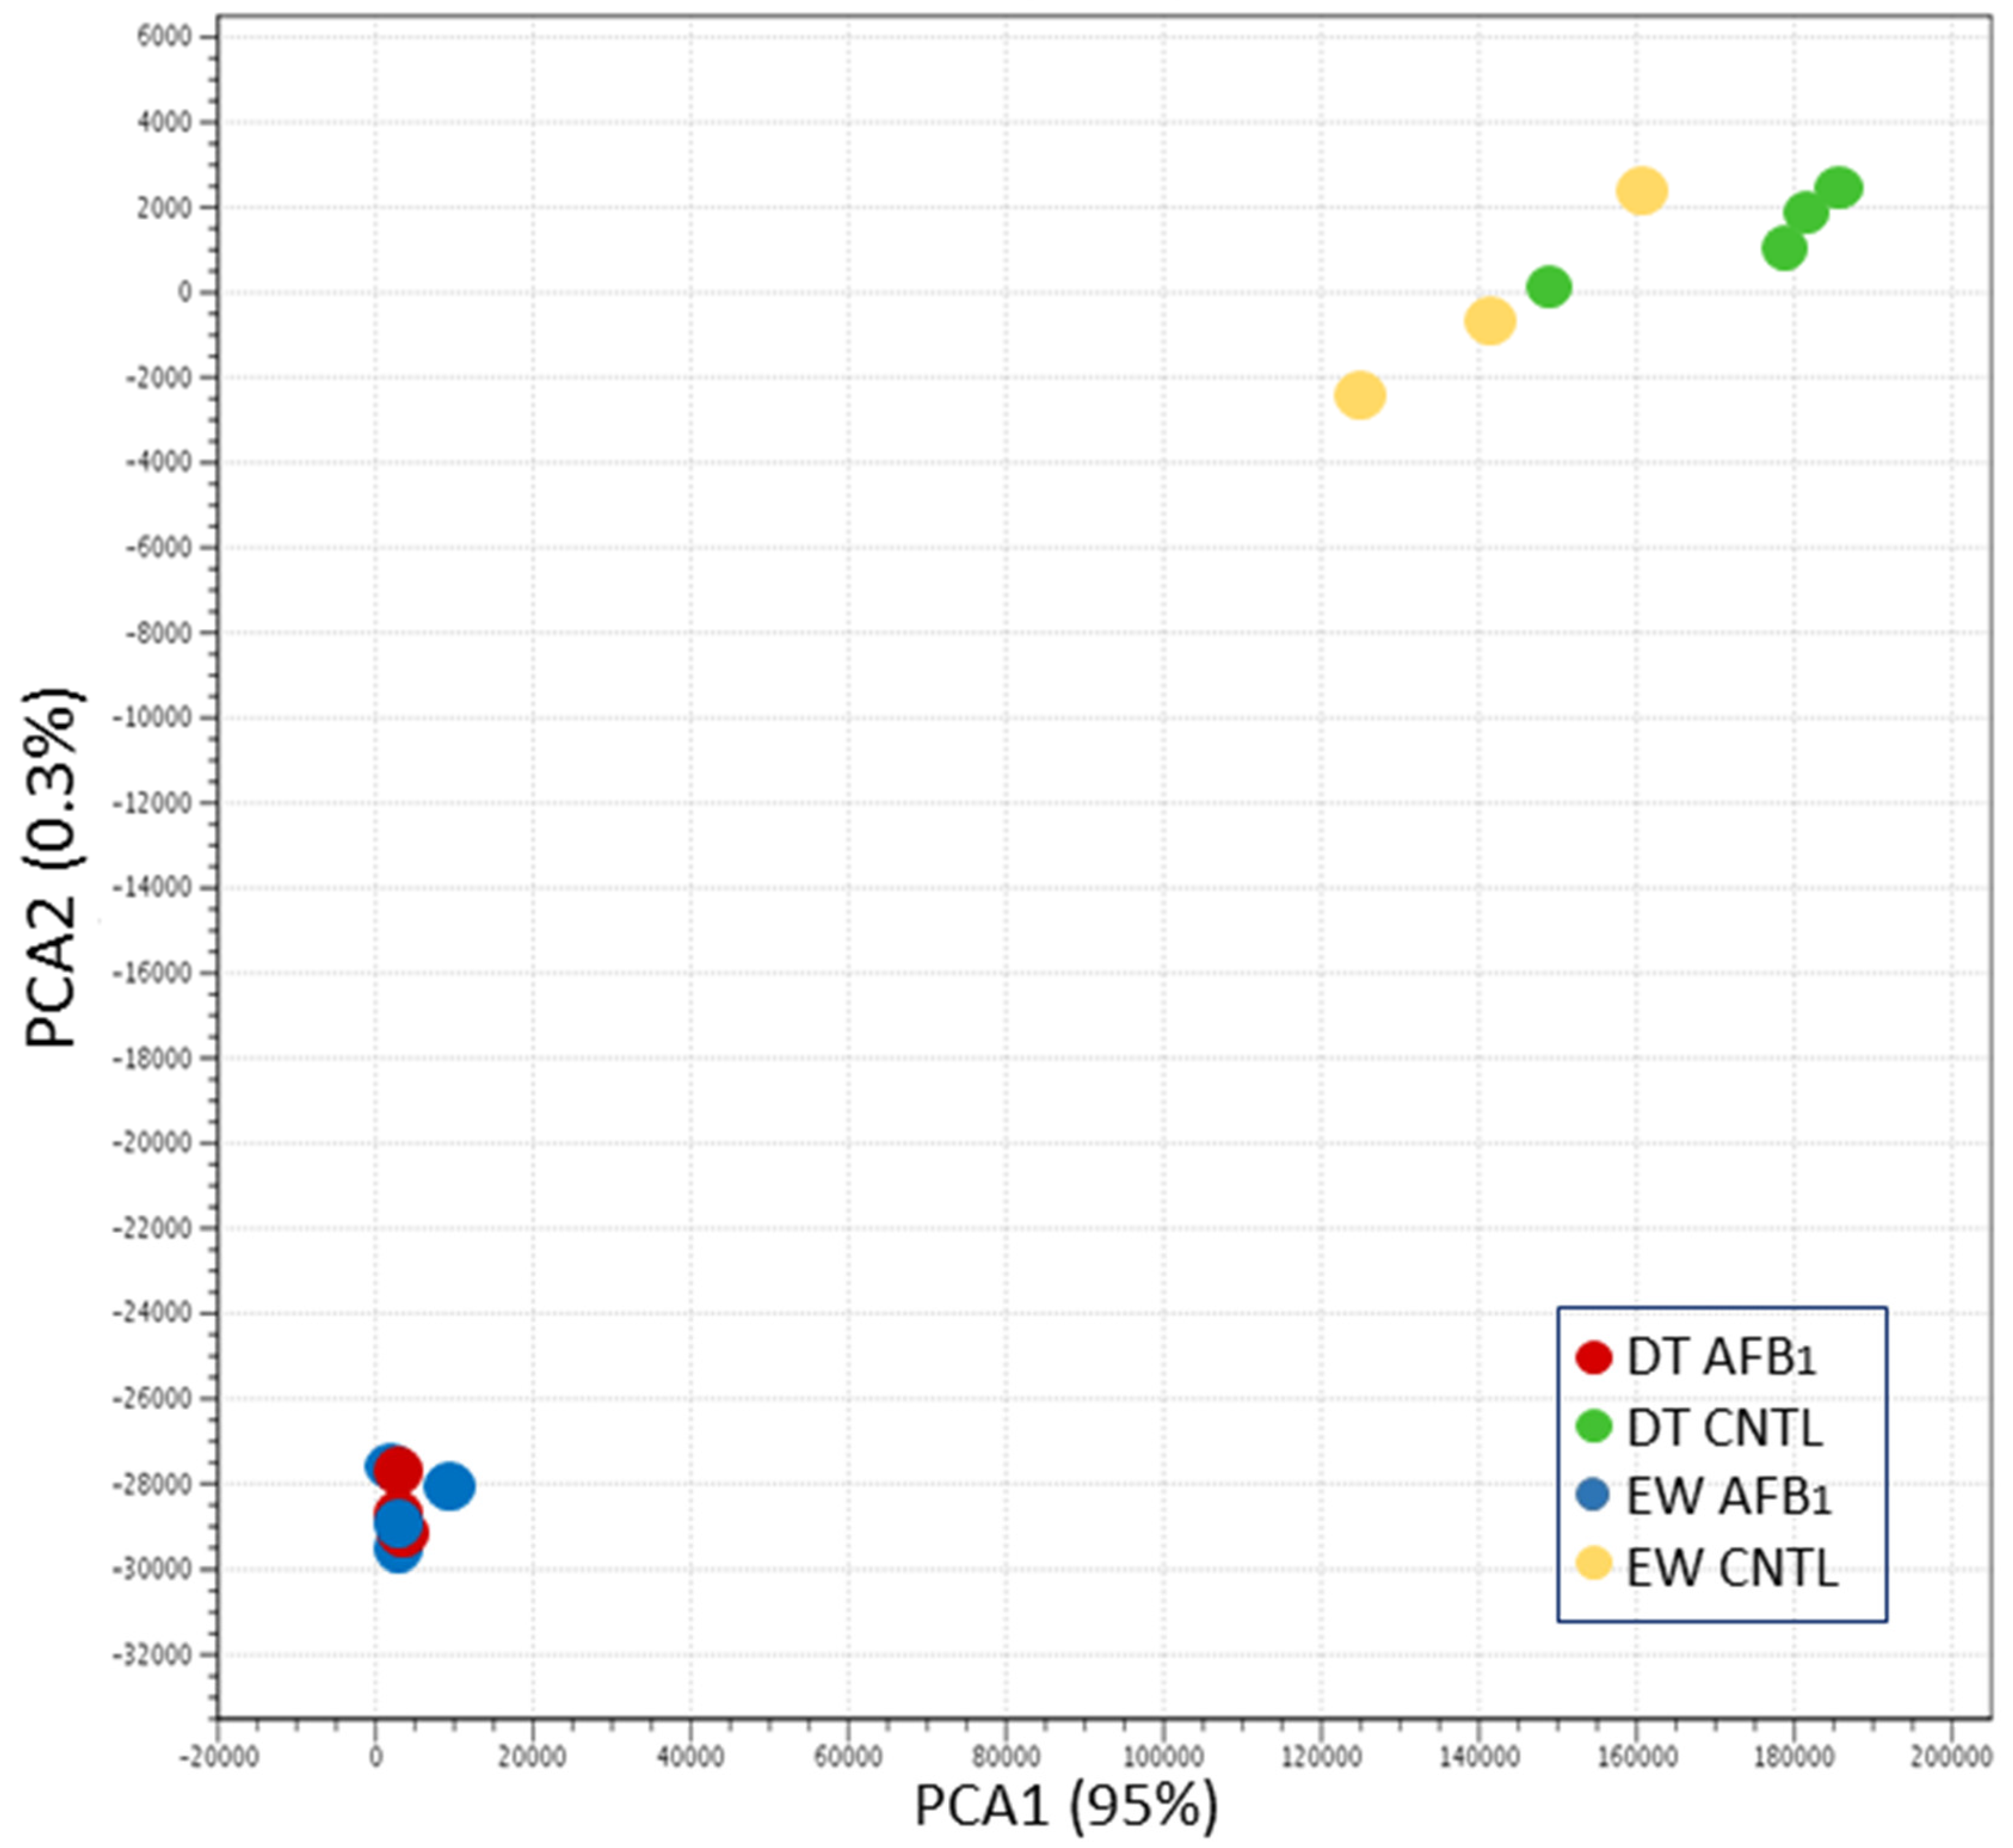
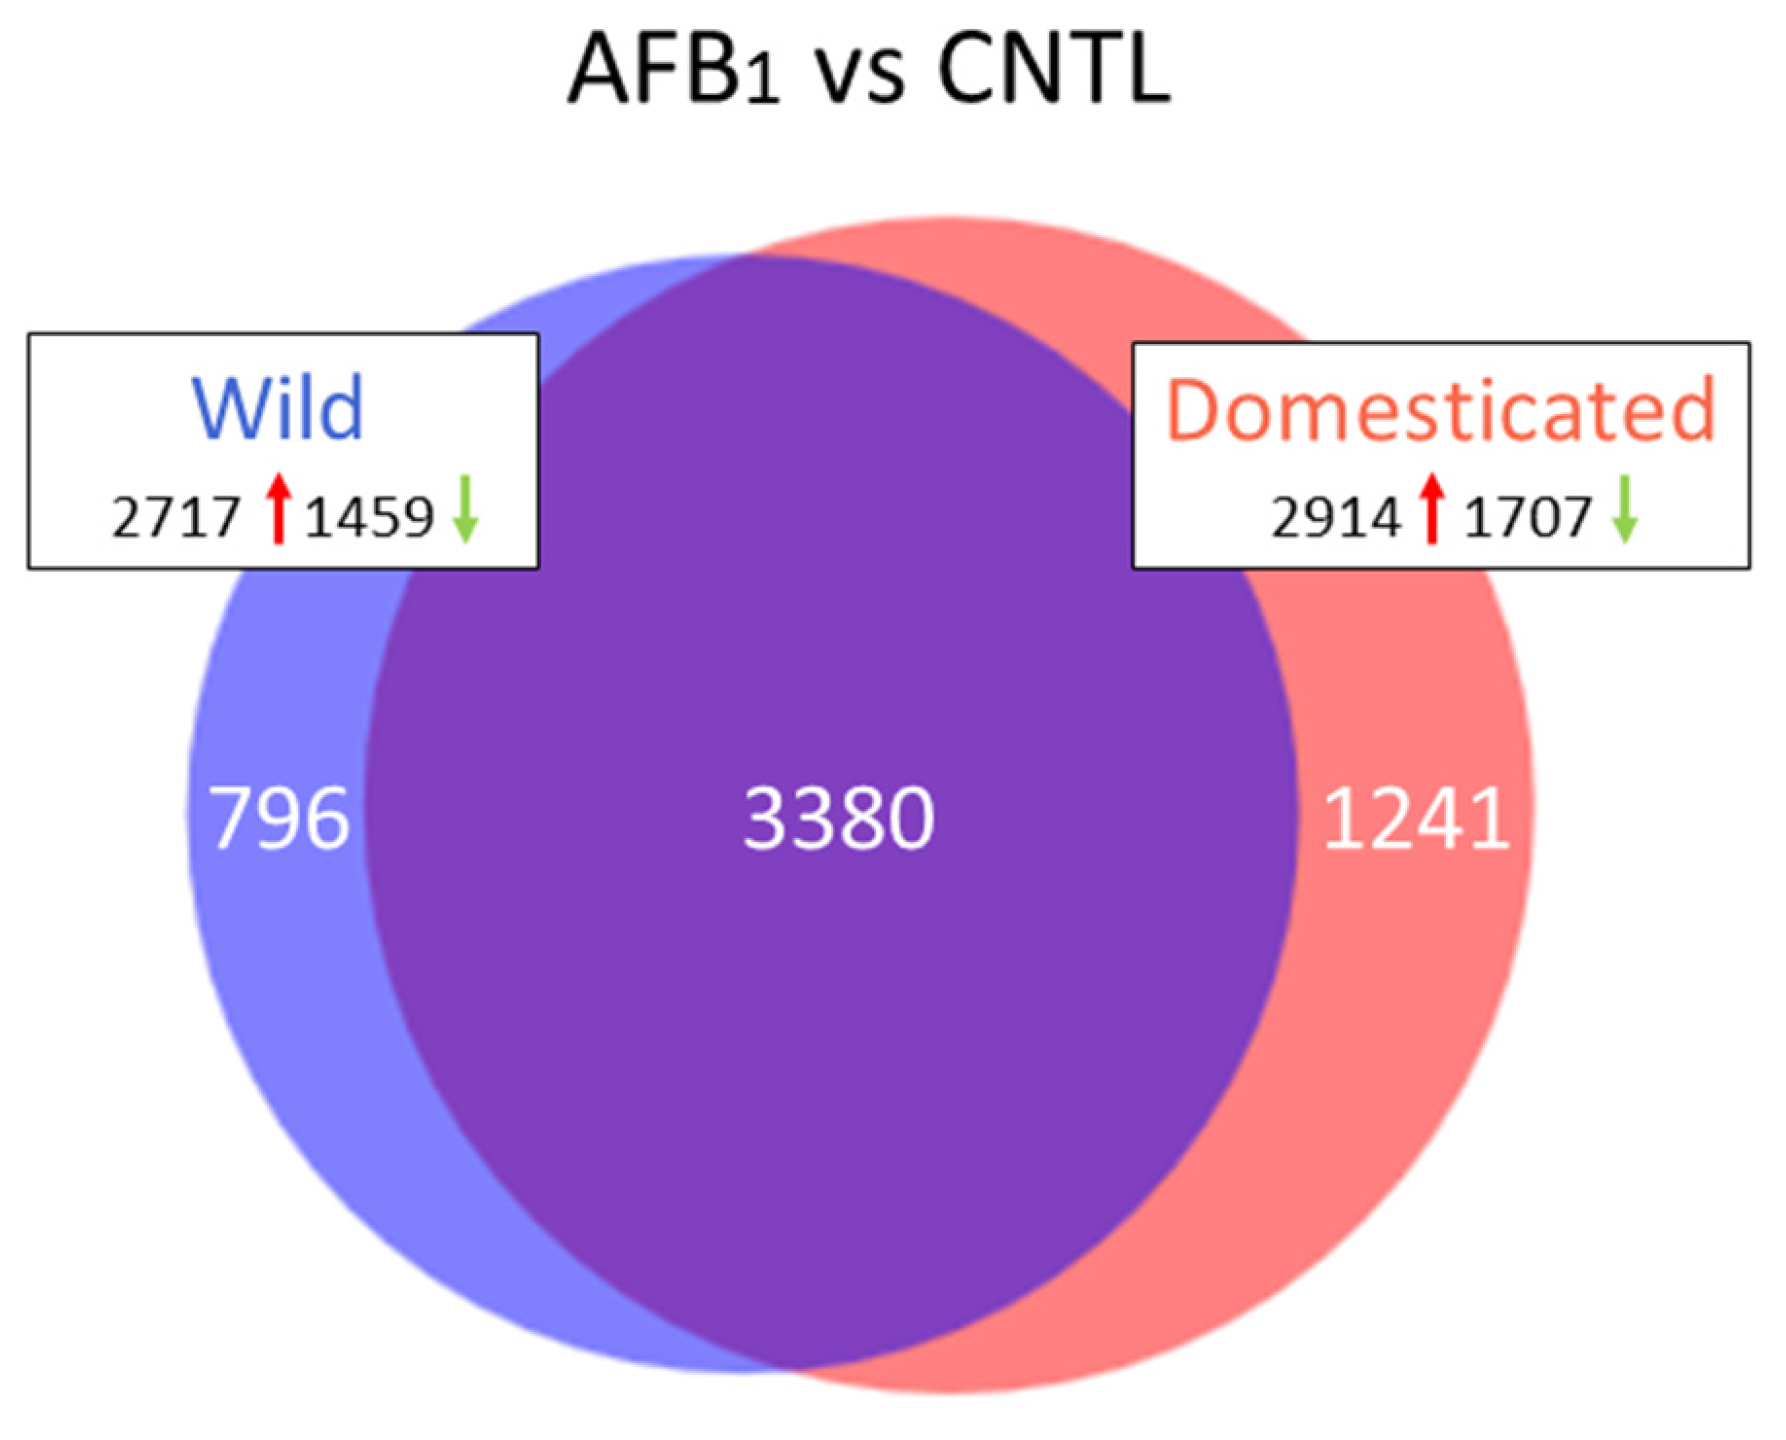
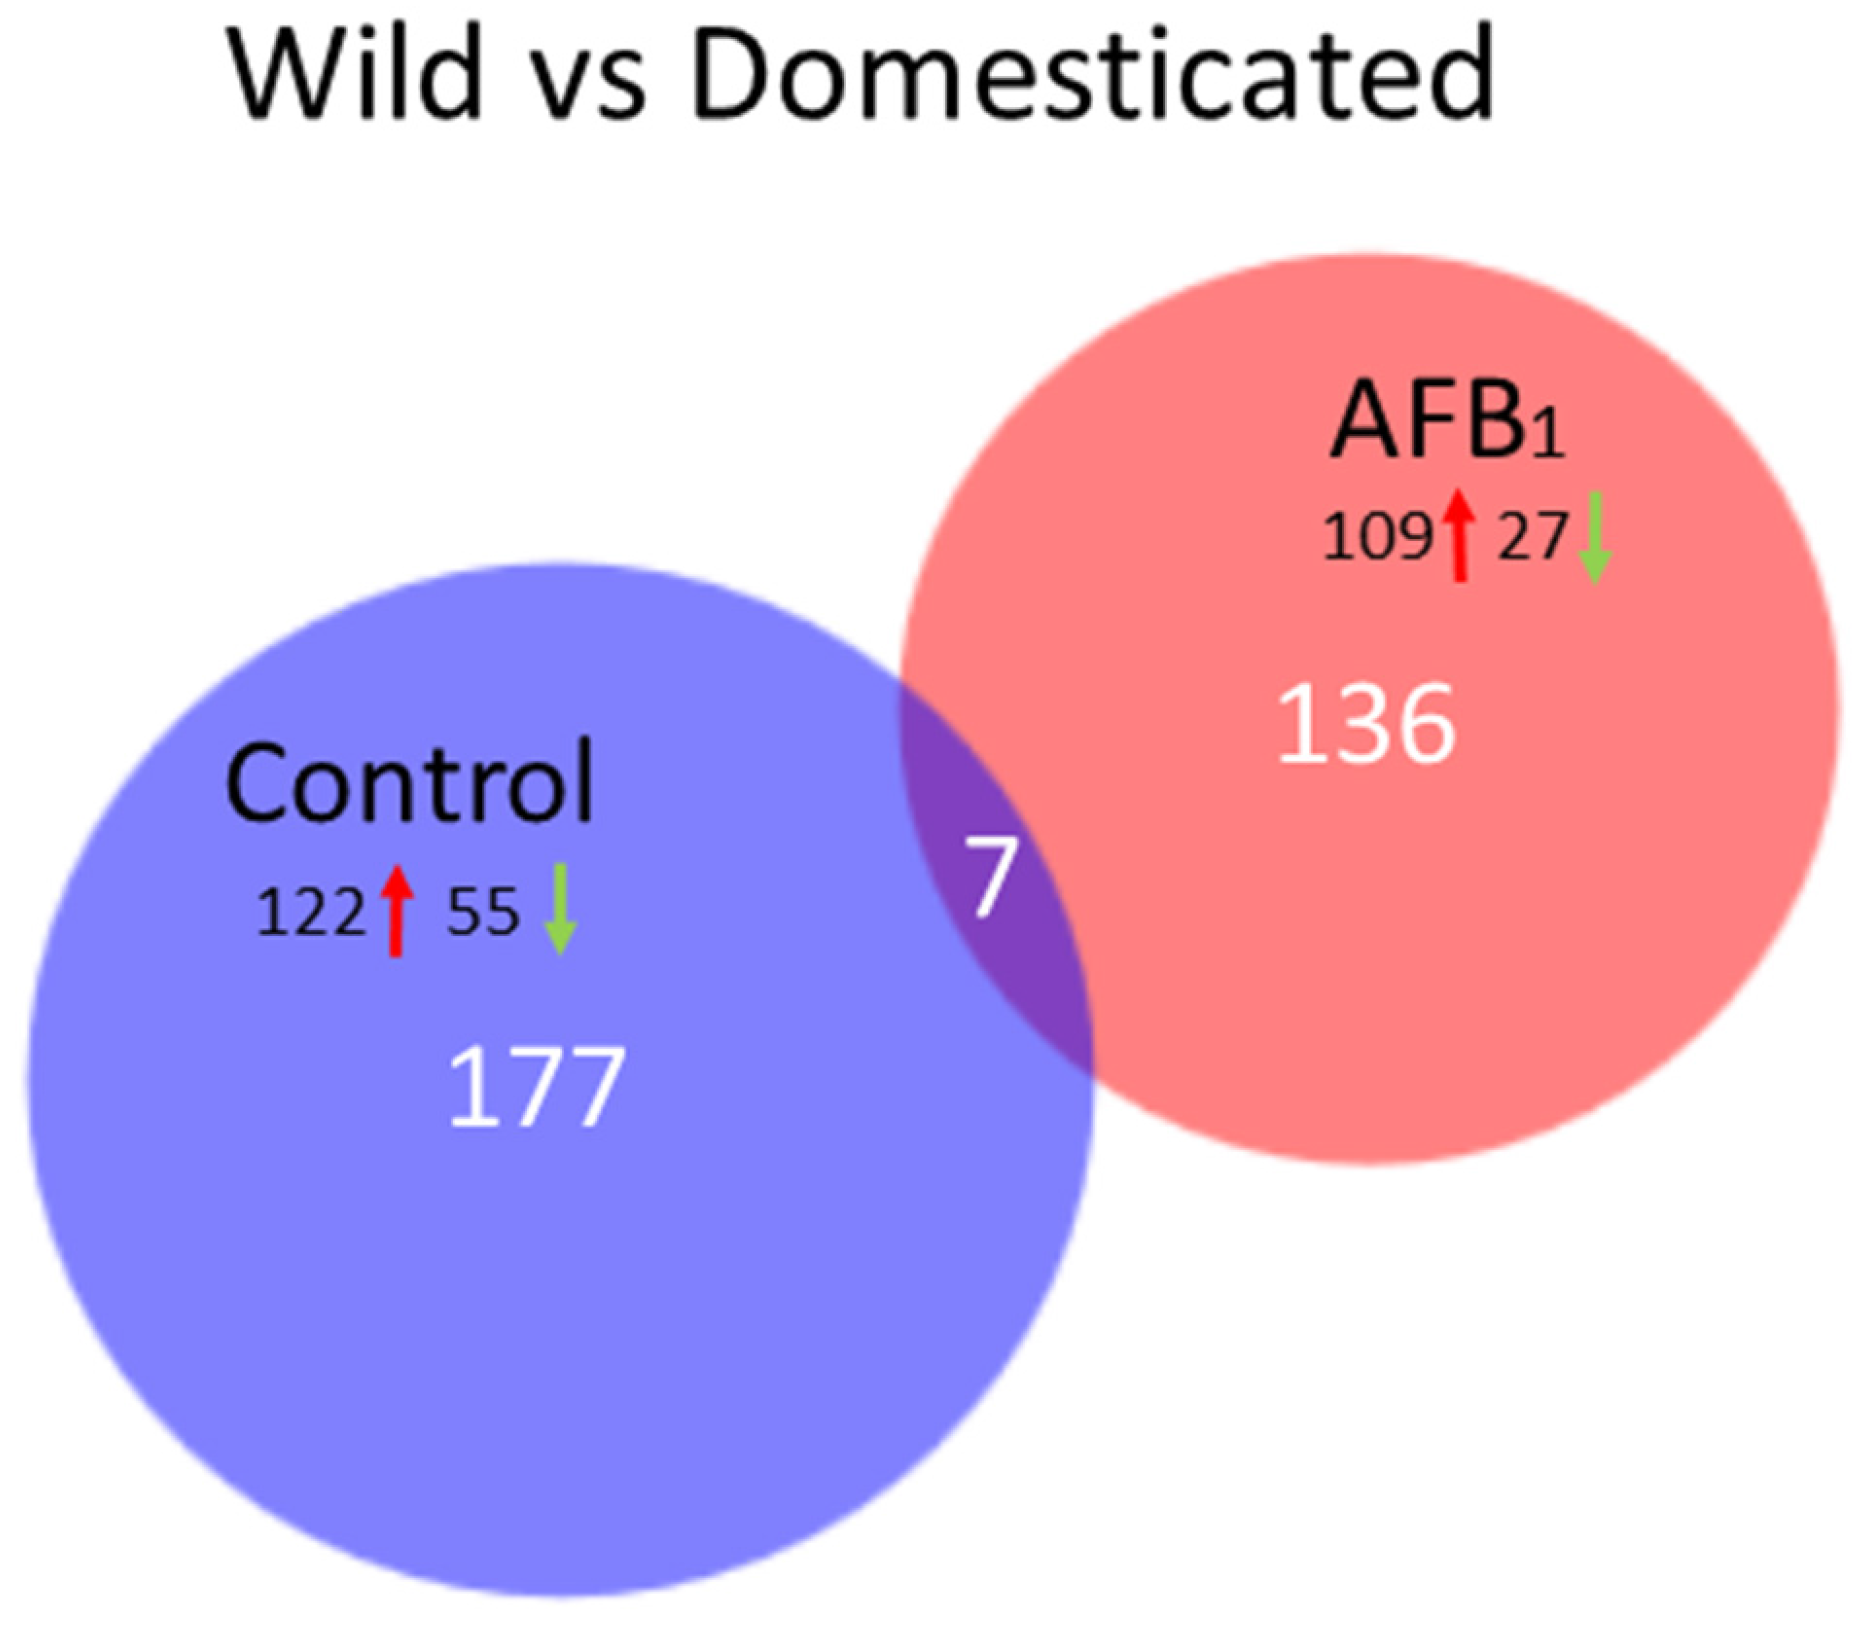
70]) prior to read mapping (Bowtie v2.2.4.0) on the turkey genome (UMD 5.0, NCBI Annotation 101). Read counts were normalized in CLC Genomics Workbench (CLCGWB v. 8.0.2, CLC Bio, Aarhus, Denmark) by dividing the total read counts by the group sample sum with the results being expressed as reads per 12.2 M. Hierarchical clustering of samples was performed (based on Euclidean sample distances with single linkage) in CLCGWB. Principal component analysis (PCA), Volcano plots, and Venn diagrams were used to visualize expression data and the results of significance testing. Empirical analysis of differential gene expression and ANOVA were performed in CLCGWB on EdgeR-normalized read counts. Pair-wise comparisons between treatment groups were made in CLCGWB following the standard workflow Wald test with multi-comparison p-values < 0.05 being considered as significant (Bonferroni and FDR corrected). In each pair-wise comparison, significant DE genes were used to investigate affected gene pathways using Ingenuity Pathway Analysis (IPA, Ingenuity Systems, Redwood City, CA, USA). Gene enrichment tests were performed using the PANTHER Overrepresentation Test (GO Consortium release 20150430, [38]).

4.3. Quantitative Real-Time PCR

To more broadly examine the expression profile response of GSTA3 to dietary AFB1, quantitative real-time PCR (qRT-PCR) was performed on both domesticated and wild turkey liver samples. Samples included AFB1-treated and control animals (six per group) from the domesticated Nicholas turkey (DT) and Eastern Wild (EW) experiment, plus AFB1-treated and control animals (six per group) of a parallel experiment that included domesticated Broad Breasted White (BB), and birds of the Rio Grande subspecies (RGW, M. g. intermedia) of wild turkey. Four of the six samples for the DT and EW groups were in common with the RNA-seq study.
Briefly, cDNA was synthesized from DNase-treated liver mRNA (TRIzol extracted) using Invitrogen Super Script IV First-strand synthesis kit (Invitrogen, Carlsbad, CA, USA). Expression analysis of gene-specific amplicons was performed with the iTaq Universal SYBR Green Supermix (BioRad, Hercules, CA, SA) with the CFX96 touch real time detection system (BioRad, Hercules, CA, USA). Primers were designed within Primer3 software (http://www.ncbi.nlm.nih.gov/tools/primer-blast) from accessioned genomic DNA sequence (NM_001303157.1) to span an exon/exon junction and at least one intron in the amplicon. RefFinder software was utilized to determine the most stable reference gene. Several normalizing genes were tested for uniformity between treatments and lines and RNA polymerase II subunit D (POLR2D, XM_003208947) was found to have the highest stability value (0.848). Target gene reactions were conducted in triplicate, and POLR2D, no template and gDNA controls were run in duplicate. All of the reactions included a disassociation curve to confirm a single product and to preclude the possibility of dimers amplifying. Expression in each RNA sample was normalized first to the control gene POLR2D. Results were interpreted using the Double Delta Ct Analysis (ΔΔCt, [71]) and a comparative Ct approach. Expression analysis was performed within the Biorad CFX Maestro software package following the standard ΔΔCt workflow.

Supplementary Materials

The following are available online at www.mdpi.com/2072-6651/10/1/42/s1. Figure S1: Hierarchical clustering of samples based on Euclidean distance reiterated relationships shown by PCA. Figure S2: Distribution of genes expressed in turkey liver by treatment group. Figure S3: Differential fold change in DEGs shared by Eastern wild (EW) and domesticated (DT) birds exposed to AFB1 in comparison to controls. Table S1. Mean quality-trimmed RNA-seq read counts for genes with mapped reads in the livers of wild and domesticated turkeys. Table S2. Summary of pairwise differential gene expression analysis of liver transcriptomes. Table S3. Fifty genes showing the greatest differential expression in each pairwise comparison of treatment groups. Table S4. Summary of PANTHER Overrepresentation test of the 3380 differentially expressed genes shared in the AFB1-treated birds as compared to controls. Table S5. Significant differentially expressed genes (FDR p-values < 0.05 and |log2FC| > 2.0) identified in each pairwise comparison of genetic groups (Eastern wild and domesticated turkey).

Acknowledgments

This project was supported by Agriculture and Food Research Initiative Competitive Grant No. 2013-67015-21241 from the USDA National Institute of Food and Agriculture. This research was also supported in part by the Minnesota and Utah Agricultural Experiment Stations, and approved as Utah Agricultural Experiment Station journal paper number 9060.

Author Contributions

K.M.R. and R.A.C. conceived and designed the experiments; K.M.M. and R.A.C. performed the experiments; J.E.A., K.M.M., and K.M.R. analyzed and interpreted the data; K.M.R. drafted the manuscript; R.A.C., K.M.M., J.E.A., and K.M.R. edited and revised the manuscript.

Conflicts of Interest

The authors declare no conflict of interest.

Abbreviations

AFB1aflatoxin B1
AFBOexo-AFB1-8,9-epoxide
BBBroad Breasted White
BWbody weight
Ctthreshold cycle
CYPcytochrome P450
DEdifferentially expressed
DEGdifferentially expressed gene
DTdomesticated turkey
EWEastern wild turkey (Meleagris gallopavo silvestris)
FCfold change
FDRfalse discovery rate
GOgene ontology
GSTglutathione S-transferase
IPAIngenuity Pathway Analysis
lncRNAlong non-coding RNA
miRNAmicro-RNA
ncRNAnon-coding RNA
PCAprincipal component analysis
qRT-PCRquantitative real-time polymerase chain reaction
RGWRio Grande wild turkey (Meleagris gallopavo intermedia)

References

  1. Council for Agricultural Science and Technology (CAST). Mycotoxins: Risks in Plant, Animal and Human Systems; Council for Agricultural Science and Technology: Ames, IA, USA, 2003. [Google Scholar]
  2. Pons, W.A., Jr.; Goldblatt, L.A. The determination of aflatoxins in cottonseed products. J. Am. Oil Chem. Soc. 1965, 42, 471–475. [Google Scholar] [CrossRef] [PubMed]
  3. Winn, R.T.; Lane, G.T. Aflatoxin production on high moisture corn and sorghum with a limited incubation. J. Dairy Sci. 1978, 61, 762–764. [Google Scholar] [CrossRef]
  4. Hill, R.A.; Blankenship, P.D.; Cole, R.J.; Sanders, T.H. Effects of soil moisture and temperature on preharvest invasion of peanuts by the Aspergillus flavus group and subsequent aflatoxin development. Appl. Environ. Microbiol. 1983, 45, 628–633. [Google Scholar] [PubMed]
  5. Miraglia, M.; Marvin, H.J.; Kleter, G.A.; Battilani, P.; Brera, C.; Coni, E.; Cubadda, F.; Croci, L.; De Santis, B.; Dekkers, S.; et al. Climate Change and Food Safety: An Emerging Issue with Special Focus on Europe. Food Chem. Toxicol. 2009, 47, 1009–1021. [Google Scholar] [CrossRef] [PubMed]
  6. Rawal, S.; Kim, J.E.; Coulombe, R., Jr. Aflatoxin B1 in poultry: Toxicology, metabolism and prevention. Res. Vet. Sci. 2010, 89, 325–331. [Google Scholar] [CrossRef] [PubMed]
  7. Monson, M.S.; Coulombe, R.A.; Reed, K.M. Aflatoxicosis: Lessons from toxicity and responses to aflatoxin B1 in poultry. Agriculture 2015, 5, 742–777. [Google Scholar] [CrossRef]
  8. Rawal, S.; Yip, S.S.; Coulombe, R.A., Jr. Cloning, expression and functional characterization of cytochrome P450 3A37 from turkey liver with high aflatoxin B1 epoxidation activity. Chem. Res. Toxicol. 2010, 23, 1322–1329. [Google Scholar] [CrossRef] [PubMed]
  9. Quist, C.F.; Bounous, D.I.; Kilburn, J.V.; Nettles, V.F.; Wyatt, R.D. The effect of dietary aflatoxin on wild turkey poults. J. Wildl. Dis. 2000, 36, 436–444. [Google Scholar] [CrossRef] [PubMed]
  10. Blount, W.P. Turkey “X” disease. Turkeys 1961, 9, 52–77. [Google Scholar]
  11. Coulombe, R.A., Jr. Biological action of mycotoxins. J. Dairy Sci. 1993, 76, 880–891. [Google Scholar] [CrossRef]
  12. Qureshi, M.A.; Brake, J.; Hamilton, P.B.; Hagler, W.M., Jr.; Nesheim, S. Dietary exposure of broiler breeders to aflatoxin results in immune dysfunction in progeny chicks. Poult. Sci. 1998, 77, 812–819. [Google Scholar] [CrossRef] [PubMed]
  13. Qureshi, M.A.; Heggen, C.L.; Hussain, I. Avian macrophage: effector functions in health and disease. Dev. Comp. Immunol. 2000, 24, 103–119. [Google Scholar] [CrossRef]
  14. Williams, J.G.; Deschl, U.; Williams, G.M. DNA damage in fetal liver cells of turkey and chicken eggs dosed with aflatoxin B1. Arch. Toxicol. 2011, 85, 1167–1172. [Google Scholar] [CrossRef] [PubMed]
  15. Gross-Steinmeyer, K.; Eaton, D.L. Dietary modulation of the biotransformation and genotoxicity of aflatoxin B(1). Toxicology 2012, 299, 69–79. [Google Scholar] [CrossRef] [PubMed]
  16. Rawal, S.; Coulombe, R.A., Jr. Metabolism of aflatoxin B1 in turkey liver microsomes: The relative roles of cytochromes P450 1A5 and 3A37. Toxicol. Appl. Pharmacol. 2011, 254, 349–354. [Google Scholar] [CrossRef] [PubMed]
  17. Yip, S.S.; Coulombe, R.A., Jr. Molecular cloning and expression of a novel cytochrome P450 from turkey liver with aflatoxin B1 oxidizing activity. Chem. Res. Toxicol. 2006, 19, 30–37. [Google Scholar] [CrossRef] [PubMed]
  18. Ilic, Z.; Crawford, D.; Vakharia, D.; Egner, P.A.; Sell, S. Glutathione-S-transferase A3 knockout mice are sensitive to acute cytotoxic and genotoxic effects of aflatoxin B1. Toxicol. Appl. Pharmacol. 2010, 242, 241–246. [Google Scholar] [CrossRef] [PubMed]
  19. Kim, J.E.; Bunderson, B.R.; Croasdell, A.; Coulombe, R.A., Jr. Functional characterization of alpha-class glutathione s-transferases from the Turkey (Meleagris gallopavo). Toxicol. Sci. 2011, 124, 45–53. [Google Scholar] [CrossRef] [PubMed]
  20. Kim, J.E.; Bunderson, B.R.; Croasdell, A.; Reed, K.M.; Coulombe, R.A., Jr. Alpha-class glutathione S-transferases in wild turkeys (Meleagris gallopavo): Characterization and role in resistance to the carcinogenic mycotoxin aflatoxin B1. PLoS ONE 2013, 8, e60662. [Google Scholar] [CrossRef] [PubMed]
  21. Klein, P.J.; Buckner, R.; Kelly, J.; Coulombe, R.A. Biochemical basis for the extreme sensitivity of turkeys to aflatoxin B1. Toxicol. Appl. Pharmacol. 2000, 165, 45–52. [Google Scholar] [CrossRef] [PubMed]
  22. Klein, P.J.; Van Vleet, T.R.; Hall, J.O.; Coulombe, R.A., Jr. Biochemical factors underlying the age-related sensitivity of turkeys to aflatoxin B1. Comp. Biochem. Physiol. Part C Toxicol. Pharmacol. 2002, 132, 193–201. [Google Scholar] [CrossRef]
  23. Klein, P.J.; Van Vleet, T.R.; Hall, J.O.; Coulombe, R.A., Jr. Dietary butylated hydroxytoluene protects against aflatoxicosis in Turkeys. Toxicol. Appl. Pharmacol. 2002, 182, 11–19. [Google Scholar] [CrossRef] [PubMed]
  24. Eaton, D.L.; Gallagher, E.P. Mechanisms of aflatoxin carcinogenesis. Annu. Rev. Pharmacol. Toxicol. 1994, 34, 135–172. [Google Scholar] [CrossRef] [PubMed]
  25. Guarisco, J.A.; Hall, J.O.; Coulombe, R.A., Jr. Butylated hydroxytoluene chemoprevention of aflatoxicosis—Effects on aflatoxin B1 bioavailability, hepatic DNA adduct formation, and biliary excretion. Food Chem. Toxicol. 2008, 46, 3727–3731. [Google Scholar] [CrossRef] [PubMed]
  26. Monson, M.S.; Settlage, R.E.; McMahon, K.W.; Mendoza, K.M.; Rawal, S.; El-Nemazi, H.S.; Coulombe, R.A., Jr.; Reed, K.M. Response of the hepatic transcriptome to aflatoxin B1 in domestic turkey (Meleagris gallopavo). PLoS ONE 2014, 9, e100930. [Google Scholar] [CrossRef] [PubMed] [Green Version]
  27. Monson, M.S.; Settlage, R.E.; Mendoza, K.M.; Rawal, S.; El-Nezami, H.S.; Coulombe, R.A., Jr.; Reed, K.M. Modulation of the spleen transcriptome in domestic turkey (Meleagris gallopavo) in response to aflatoxin B1 and probiotics. Immunogenetics 2015, 67, 163–178. [Google Scholar] [CrossRef] [PubMed]
  28. Monson, M.S.; Cardona, C.C.; Coulombe, R.A.; Reed, K.M. Hepatic transcriptome responses of domestic and wild turkey embryos to aflatoxin B1. Toxins: Special issue entitled “Aflatoxins”. Toxins 2016, 8, 16. [Google Scholar] [CrossRef] [PubMed]
  29. Koishi, R.; Ando, Y.; Ono, M.; Shimamura, M.; Yasumo, H.; Fujiwara, T.; Horikoshi, H.; Furukawa, H. ANGPTl3 regulates lipid metabolism in mice. Nat. Genet. 2002, 30, 151–157. [Google Scholar] [CrossRef] [PubMed]
  30. Ono, M.; Shimizugawa, T.; Shimamura, M.; Yoshida, K.; Noji-Sakikawa, C.; Ando, Y.; Koishi, R.; Furukawa, H. Protein region important for regulation of lipid metabolism in angiopoietin-like 3 (ANGPTL3): ANGPTL3 is cleaved and activated in vivo. J. Biol. Chem. 2003, 278, 41804–41809. [Google Scholar] [CrossRef] [PubMed]
  31. Nagasawa, H.; Uto, Y.; Sasaki, H.; Okamura, N.; Murakami, A.; Kubo, S.; Kirk, K.L.; Hori, H. Gc protein (vitamin D-binding protein): Gc genotyping and GcMAF precursor activity. Anticancer Res. 2005, 25, 3689–3695. [Google Scholar] [PubMed]
  32. Geerts, A. History, heterogeneity, developmental biology, and functions of quiescent hepatic stellate cells. Semin. Liver Dis. 2001, 21, 311–335. [Google Scholar] [CrossRef] [PubMed]
  33. Fuchs, A.; Cella, M.; Giurisato, E.; Shaw, A.S.; Colonna, M. Cutting edge: CD96 (tactile) promotes NK cell-target cell adhesion by interacting with the poliovirus receptor (CD155). J. Immunol. 2004, 172, 3994–3998. [Google Scholar] [CrossRef] [PubMed]
  34. Uhlar, C.M.; Whitehead, A.S. Serum amyloid A, the major vertebrate acute-phase reactant. Eur. J. Biochem. 1999, 265, 501–523. [Google Scholar] [CrossRef] [PubMed]
  35. Michelucci, A.; Cordes, T.; Ghelfi, J.; Pailot, A.; Reiling, N.; Goldmann, O.; Binz, T.; Wegner, A.; Tallam, A.; Rausell, A.; et al. Immune-responsive gene 1 protein links metabolism to immunity by catalyzing itaconic acid production. Proc. Natl. Acad. Sci. USA 2013, 110, 7820–7825. [Google Scholar] [CrossRef] [PubMed]
  36. Gomez, A.; Nekvindova, J.; Travica, S.; Lee, M.Y.; Johansson, I.; Edler, D.; Mkrtchian, S.; Ingelman-Sundberg, M. Colorectal cancer-specific cytochrome P450 2W1: Intracellular localization, glycosylation, and catalytic activity. Mol. Pharmacol. 2010, 78, 1004–1011. [Google Scholar] [CrossRef] [PubMed]
  37. Karlgren, M.; Ingelman-Sundberg, M. Tumour-specific expression of CYP2W1: Its potential as a drug target in cancer therapy. Expert Opin. Ther. Targets 2007, 11, 61–67. [Google Scholar] [CrossRef] [PubMed]
  38. Mi, H.; Huang, X.; Muruganujan, A.; Tang, H.; Mills, C.; Kang, D.; Thomas, P.D. PANTHER version 11: Expanded annotation data from Gene Ontology and Reactome pathways, and data analysis tool enhancements. Nucleic Acids Res. 2017, 45, D183–D189. [Google Scholar] [CrossRef] [PubMed]
  39. Wang, Y.; McNutt, M.C.; Banfi, S.; Levin, M.G.; Holland, W.L.; Gusarova, V.; Gromada, J.; Cohen, J.C.; Hobbs, H.H. Hepatic ANGPTL3 regulates adipose tissue energy homeostasis. Proc. Natl. Acad. Sci. USA 2015, 112, 11630–11635. [Google Scholar] [CrossRef] [PubMed]
  40. Racioppi, L.; Means, A.R. Calcium/calmodulin-dependent kinase IV in immune and inflammatory responses: Novel routes for an ancient traveler. Trends Immunol. 2008, 29, 600–607. [Google Scholar] [CrossRef] [PubMed]
  41. Zhang, Y.; Burke, C.W.; Ryman, K.D.; Klimstra, W.B. Identification and characterization of interferon-induced proteins that inhibit alphavirus replication. J. Virol. 2007, 81, 11246–11255. [Google Scholar] [CrossRef] [PubMed]
  42. Lu, M.Y.; Liao, F. Interferon-stimulated gene ISG12b2 is localized to the inner mitochondrial membrane and mediates virus-induced cell death. Cell Death Differ. 2011, 18, 925–936. [Google Scholar] [CrossRef] [PubMed]
  43. Irgens, H.U.; Fjeld, K.; Johansson, B.B.; Ringdal, M.; Immervoll, H.; Leh, S.; Søvik, O.; Johansson, S.; Molven, A.; Njølstad, P.R. Glycogenin-2 is dispensable for liver glycogen synthesis and glucagon-stimulated glucose release. J. Clin. Endocrinol. Metab. 2015, 100, E767–E775. [Google Scholar] [CrossRef] [PubMed]
  44. Kim, M.A.; Sohn, Y.C. Characterization of a sea urchin IQ Motif Containing Protein D as a coactivator of nuclear receptors. Zool. Sci. 2017, 34, 235–241. [Google Scholar] [CrossRef] [PubMed]
  45. Bedard, L.L.; Massey, T.E. Aflatoxin B1-induced DNA damage and its repair. Cancer Lett. 2006, 241, 174–183. [Google Scholar] [CrossRef] [PubMed]
  46. Giambrone, J.J.; Diener, U.L.; Davis, N.D.; Panangala, V.S.; Hoerr, F.J. Effect of purified aflatoxin on broiler chickens. Poult. Sci. 1985, 64, 852–858. [Google Scholar] [CrossRef] [PubMed]
  47. Giambrone, J.J.; Diener, U.L.; Davis, N.D.; Panangala, V.S.; Hoerr, F.J. Effects of aflatoxin on young turkeys and broiler chickens. Poult. Sci. 1985, 64, 1678–1684. [Google Scholar] [CrossRef] [PubMed]
  48. Chen, X.; Horn, N.; Applegate, T.J. Efficiency of hydrated sodium calcium aluminosilicate to ameliorate the adverse effects of graded levels of aflatoxin B1 in broiler chicks. Poult. Sci. 2014, 93, 2037–2047. [Google Scholar] [CrossRef] [PubMed]
  49. Huff, W.E.; Kubena, L.F.; Harvey, R.B.; Corrier, D.E.; Mollenhauer, H.H. Progression of aflatoxicosis in broiler chickens. Poult. Sci. 1986, 65, 1891–1899. [Google Scholar] [CrossRef] [PubMed]
  50. Yarru, L.P.; Settivari, R.S.; Antoniou, E.; Ledoux, D.R.; Rottinghaus, G.E. Toxicological and gene expression analysis of the impact of aflatoxin B1 on hepatic function of male broiler chicks. Poult. Sci. 2009, 88, 360–371. [Google Scholar] [PubMed]
  51. Zhang, N.Y.; Qi, M.; Gao, X.; Zhao, L.; Liu, J.; Gu, C.Q.; Song, W.J.; Krumm, C.S.; Sun, L.H.; Qi, D.S. Response of the hepatic transcriptome to aflatoxin B1 in ducklings. Toxicon 2016, 111, 69–76. [Google Scholar] [CrossRef] [PubMed]
  52. Wu, Z.L.; Sohl, C.D.; Shimada, T.; Guengerich, F.P. Recombinant enzymes overexpressed in bacteria show broad catalytic specificity of human cytochrome P450 2W1 and limited activity of human cytochrome P450 2S1. Mol. Pharmacol. 2006, 69, 2007–2014. [Google Scholar] [CrossRef] [PubMed]
  53. Yang, Y.H.; Miranda, C.L.; Henderson, M.C.; Wang-Buhler, J.L.; Buhler, D.R. Heterologous expression of CYP2K1 and identification of the expressed protein (BV-CYP2K1) as lauric acid (omega-1)-hydroxylase and aflatoxin B1 exo-epoxidase. Drug Metab. Dispos. 2000, 28, 1279–1283. [Google Scholar] [PubMed]
  54. Laborde, E. Glutathione transferases as mediators of signaling pathways involved in cell proliferation and cell death. Cell Death Differ. 2010, 17, 1373–1380. [Google Scholar] [CrossRef] [PubMed]
  55. Chen, J.; Chen, K.; Yuan, S.; Peng, X.; Fang, J.; Wang, F.; Cui, H.; Chen, Z.; Yuan, J.; Geng, Y. Effects of aflatoxin B1 on oxidative stress markers and apoptosis of spleens in broilers. Toxicol. Ind. Health 2016, 32, 278–284. [Google Scholar] [CrossRef] [PubMed]
  56. Eraslan, G.; Akdogan, M.; Yarsan, E.; Sahindokuyucu, F.; Essiz, D.; Altintas, L. The effects of aflatoxins on oxidative stress in broiler chickens. Turk. J. Vet. Anim. Sci. 2005, 29, 701–707. [Google Scholar]
  57. Yang, W.; Lian, J.; Feng, Y.; Srinivas, S.; Guo, Z.; Zhong, H.; Zhuang, Z.; Wang, S. Genome-wide miRNA-profiling of aflatoxin B1-induced hepatic injury using deep sequencing. Toxicol. Lett. 2016, 226, 140–149. [Google Scholar] [CrossRef] [PubMed]
  58. Livingstone, M.C.; Johnson, N.M.; Roebuck, B.D.; Kensler, T.W.; Groopman, J.D. Profound changes in miRNA expression during cancer initiation by aflatoxin B1 and their abrogation by the chemopreventive triterpenoid CDDO-Im. Mol. Carcinog. 2017, 56, 2382–2390. [Google Scholar] [CrossRef] [PubMed]
  59. Merrick, B.A.; Phadke, D.P.; Auerbach, S.S.; Mav, D.; Stiegelmeyer, S.M.; Shah, R.R.; Tice, R.R. RNA-Seq profiling reveals novel hepatic gene expression pattern in aflatoxin B1 treated rats. PLoS ONE 2013, 8, e61768. [Google Scholar] [CrossRef] [PubMed]
  60. Shi, J.; He, J.; Lin, J.; Sun, X.; Sun, F.; Ou, C.; Jiang, C. Distinct response of the hepatic transcriptome to Aflatoxin B1 induced hepatocellular carcinogenesis and resistance in rats. Sci. Rep. 2016, 6, 31898. [Google Scholar] [CrossRef] [PubMed]
  61. Bourd-Boittin, K.; Bonnier, D.; Leyme, A.; Mari, B.; Tuffery, P.; Samson, M.; Ezan, F.; Baffet, G.; Theret, N. Protease profiling of liver fibrosis reveals the ADAM metallopeptidase with thrombospondin type 1 motif, 1 as a central activator of transforming growth factor beta. Hepatology 2011, 54, 2173–2184. [Google Scholar] [CrossRef] [PubMed]
  62. Giambrone, J.J.; Diener, U.L.; Davis, N.D.; Panangala, V.S.; Hoerr, F.J. Effects of purified aflatoxin on turkeys. Poult. Sci. 1985, 64, 859–865. [Google Scholar] [CrossRef] [PubMed]
  63. Sharma, R.P. Immunotoxicity of mycotoxins. J. Dairy Sci. 1993, 76, 892–897. [Google Scholar] [CrossRef]
  64. Bababunmi, E.A.; Bassir, O. A delay in blood clotting of chickens and ducks induced by aflatoxin treatment. Poult. Sci. 1982, 61, 166–168. [Google Scholar] [CrossRef] [PubMed]
  65. Doerr, J.A.; Hamilton, P.B. Aflatoxicosis and intrinsic coagulation function in broiler chickens. Poult. Sci. 1981, 60, 1406–1411. [Google Scholar] [CrossRef] [PubMed]
  66. Witlock, D.R.; Wyatt, R.D. Effect of dietary aflatoxin on hemostasis of young turkey poults. Poult. Sci. 1981, 60, 528–531. [Google Scholar] [CrossRef] [PubMed]
  67. Granevitze, Z.; Blum, S.; Cheng, H.; Vignal, A.; Morisson, M.; Ben-Ari, G.; David, L.; Feldman, M.W.; Weigend, S.; Hillel, J. Female-specific DNA sequences in the chicken genome. J. Hered. 2007, 98, 238–242. [Google Scholar] [CrossRef] [PubMed]
  68. Coulombe, R.A.; Guarisco, J.A.; Klein, P.J.; Hall, J.O. Chemoprevention of aflatoxicosis in poultry by dietary butylated hydroxytoluene. Anim. Feed Sci. Technol. 2005, 121, 217–225. [Google Scholar] [CrossRef]
  69. Bolger, A.M.; Lohse, M.; Usadel, B. Trimmomatic: A flexible trimmer for Illumina sequence data. Bioinformatics 2014, 30, 2114–2120. [Google Scholar] [CrossRef] [PubMed]
  70. Andrews, S. FastQC: A Quality Control Tool for High Throughput Sequence Data. 2010. Available online: http://www.bioinformatics.babraham.ac.uk/projects/fastqc/ (accessed on 10 January 2018).
  71. Schmittgen, T.D.; Livak, K.J. Analyzing real-time PCR data by the comparative C(T) method. Nat. Protoc. 2008, 3, 1101–1108. [Google Scholar] [CrossRef] [PubMed]
Figure 1. Principal component analysis (PCA) of normalized RNA-seq read counts. For each treatment group, sample to sample distances (within- and between-treatments) are illustrated on the first two principal components comprising approximately 95% of the variation.
Toxins 10 00042 g001
Figure 2. Distribution of differentially expressed genes in turkey. For each comparison, the number of genes with FDR p-value < 0.05 and |log2FC| > 2.0 shared or unique to each treatment are indicated in the Venn diagram. Circle size is proportional to the number of genes and direction of expression change (↑ or ↓) is given for the genes in each group.
Toxins 10 00042 g002
Figure 3. Distribution of differentially expressed of liver genes between turkey types (Wild and Domesticated). For each comparison, the number of genes with FDR p-value < 0.05 and |log2FC| > 2.0 shared or unique to each treatment group are indicated. Circle size is proportional to the number of genes and direction of expression change (↑ or ↓) is given for the genes in each group.
Toxins 10 00042 g003
Figure 4. Effect of AFB1 on expression of GSTA3 in the livers of turkeys. (A) Mean normalized RNA-seq read counts. For each treatment group, individual read counts are indicated by closed circles. Error bars denote standard deviation of the mean. (B) Relative expression as measured by qRT-PCR. For each group the fold change (ΔΔCt) between AFB1-treated and control birds is given. Asterisks denote significant comparisons (p-value < 0.01).
Toxins 10 00042 g004
Table 1. Summary of RNA-seq data for turkey liver transcriptomes.
LineGroupReplicatePE ReadsMedian Read Quality R1Median Read Quality R2% Mapped% ConcordantEstimated Insert Mean (bp)Observed GenesExpressed Genes% Genes Expressed
Eastern WildCNTLEW9L12,148,65436.536.691.786.817215,85714,80470.5
EW10L14,641,78136.436.590.985.717316,48314,83370.6
EW12L11,740,80636.936.891.185.819116,50615,44873.5
EW13L12,466,17136.936.990.985.419116,57214,93571.1
Mean12,749,353.036.6836.7091.1585.93181.816,354.515,005.071.4
AFBEW1L11,719,04936.937.089.783.619217,91417,07381.3
EW2L12,615,19536.937.090.184.219117,91116,52378.6
EW3L12,625,96236.936.990.584.719218,02617,19481.8
EW4L12,468,13636.936.989.984.019318,05417,23082.0
Mean12,357,085.536.9036.9590.0584.13192.017,976.317,005.080.9
DomesticatedCNTLN11L12,448,49636.736.892.487.717215,99314,83770.6
N12L12,857,79536.736.792.387.717216,13614,39968.5
N13L11,417,33837.237.491.485.721216,63415,58474.2
N14L12,099,33536.736.691.987.017015,95214,78070.4
Mean12,205,741.036.8336.8892.0087.03181.516,178.714,900.070.9
AFBN1L11,388,75337.237.490.384.321217,96717,10981.4
N2L12,827,96437.137.389.883.621318,08316,75279.7
N3L10,821,68337.137.390.484.421117,90317,04881.1
N4L11,144,37137.237.390.184.021117,98917,11981.5
Mean11,545,693.037.1537.3390.1584.08211.817,985.517,007.081.0
Mean 12,214,468.0636.8936.9690.8485.29191.7517,123.7515,979.2576.1
For each library the total number of concatenated reads, median read qualities (R1 and R2), estimated mean insert length (bp), number of and percentage of aligned reads, percentage of concordant reads, and the number and percentage of observed genes (mapped reads > 1) and expressed genes (mean group normalized read count > 3.0) are given.
Table 2. Summary of genes with significant differential expression (DE) in pair-wise comparisons of treatment groups.
ComparisonGroupsExpressed GenesShared GenesUnique Genes/GroupFDR Pval < 0.05|log2FC| > 1.0|log2FC| > 2.0
AFB1 effectEW (AFB vs. CNTL)17,34214,9082147/287962071684176
DT (AFB vs. CNTL)17,40314,6692407/32811,32580014621
LineCNTL (EW vs. DT)15,52514,667528/330744495184
AFB (EW vs. DT)17,41116,719336/356903456143
For each comparison, the treatment groups, number of genes with significant FDR p-value, and the numbers of significant genes that also had |log2 fold change| > 1.0 and > 2.0 are given.
Table 3. Summary of PANTHER Overrepresentation Test of the 796 unique differentially expressed (DE) genes in livers of Eastern wild turkeys compared to controls after AFB1 exposure.
CategoryGallus gallus—REFLIST Genes (15,789)Observed Turkey GenesExpectedover/underFold Enrichmentp-Value
GO biological process complete
  negative regulation of neurogenesis (GO:0050768)101122.15+5.581.28 × 10−2
  negative regulation of cell development (GO:0010721)119132.53+5.131.21 × 10−2
  negative regulation of nervous system development (GO:0051961)111122.36+5.083.29 × 10−2
  regulation of system process (GO:0044057)184163.92+4.091.58 × 10−2
  regulation of membrane potential (GO:0042391)185163.94+4.061.69 × 10−2
  regulation of neuron differentiation (GO:0045664)233194.96+3.834.83 × 10−3
  regulation of neurogenesis (GO:0050767)279205.94+3.371.72 × 10−2
  regulation of nervous system development (GO:0051960)323236.87+3.353.53 × 10−3
  neurological system process (GO:0050877)337227.17+3.072.45 × 10−2
  system process (GO:0003008)5593011.9+2.522.36 × 10−2
  generation of neurons (GO:0048699)5893112.53+2.472.40 × 10−2
  neurogenesis (GO:0022008)6363313.53+2.441.57 × 10−2
  nervous system development (GO:0007399)8864418.85+2.331.03 × 10−3
  regulation of multicellular organismal process (GO:0051239)10835223.05+2.262.01 × 10−4
  system development (GO:0048731)16136434.33+1.864.44 × 10−3
  cell communication (GO:0007154)22508547.88+1.783.50 × 10−4
  single organism signaling (GO:0044700)22018346.84+1.775.71 × 10−4
  multicellular organismal process (GO:0032501)24179151.44+1.771.16 × 10−4
  signaling (GO:0023052)22058346.92+1.776.18 × 10−4
  multicellular organism development (GO:0007275)18146838.6+1.761.37 × 10−2
  single-multicellular organism process (GO:0044707)21207945.11+1.752.09 × 10−3
  anatomical structure development (GO:0048856)19717141.94+1.693.16 × 10−2
  single-organism process (GO:0044699)6098180129.77+1.391.05 × 10−4
  Unclassified (UNCLASSIFIED)635784135.28-0.620.00 × 10
GO cellular component complete
  sarcolemma (GO:0042383)4370.92+7.654.23 × 10−2
  proteinaceous extracellular matrix (GO:0005578)168143.58+3.921.85 × 10−2
  extracellular matrix (GO:0031012)249185.3+3.48.51 × 10−3
  plasma membrane part (GO:0044459)9874521.0+2.141.33 × 10−3
  intrinsic component of membrane (GO:0031224)324413269.03+1.913.19 × 10−12
  integral component of membrane (GO:0016021)320012968.1+1.891.70 × 10−11
  plasma membrane (GO:0005886)18347139.03+1.824.27 × 10−4
  membrane part (GO:0044425)368914278.5+1.811.39 × 10−11
  cell periphery (GO:0071944)18887240.18+1.796.08 × 10−4
  extracellular region part (GO:0044421)15555733.09+1.723.49 × 10−2
  membrane (GO:0016020)4745154100.98+1.537.69 × 10−7
  organelle part (GO:0044422)35804576.18-0.591.11 × 10−2
  intracellular organelle part (GO:0044446)34724173.89-0.552.59 × 10−3
  nucleus (GO:0005634)31063566.1-0.533.12 × 10−3
  organelle lumen (GO:0043233)17031536.24-0.412.45 × 10−2
  intracellular organelle lumen (GO:0070013)17031536.24-0.412.45 × 10−2
  membrane-enclosed lumen (GO:0031974)17031536.24-0.412.45 × 10−2
  nuclear part (GO:0044428)17641537.54-0.41.01 × 10−2
  Unclassified (UNCLASSIFIED)606278129.0-0.60.00 × 10
GO molecular function complete
  transporter activity8613918.32+2.131.71 × 10−2
  nucleic acid binding19881542.31-0.356.66 × 10−4
  Unclassified6653112141.58-0.790.00 × 10
Included categories had fold enrichment (number of DE genes divided by expected (Exp)) > 2.0. For each Gene Ontology category, the number of genes in the reference list and those differentially expressed in the turkey are given. DE turkey genes were matched to the chicken gene reference list for analysis in PANTHER [38]. p-values are as determined by the binomial statistic.
Table 4. Summary of PANTHER Overrepresentation Test of the 1241 unique differentially expressed (DE) genes in liver of domesticated turkeys after AFB1 exposure as compared to controls.
CategoryGallus gallus—REFLIST Genes (15789)Observed Turkey GenesExpectedover/underFold Enrichmentp-Value
GO biological process complete
  organelle fission (GO:0048285)135174.52+3.762.53 × 10−2
  oxidation-reduction process (GO:0055114)5494618.39+2.501.11 × 10−4
  regulation of immune system process (GO:0002682)4083313.67+2.412.40 × 10−2
  signal transduction (GO:0007165)205711468.92+1.652.19 × 10−4
  Signaling (GO:0023052)220512273.88+1.656.80 × 10−5
  single organism signaling (GO:0044700)220112173.74+1.641.15 × 10−4
  single-organism metabolic process (GO:0044710)17459558.47+1.628.40 × 10−3
  cell communication (GO:0007154)225012275.38+1.622.13 × 10−4
  cellular response to stimulus (GO:0051716)265713589.02+1.521.45 × 10−3
  single-organism process (GO:0044699)6098309204.31+1.511.54 × 10−16
  response to stimulus (GO:0050896)3224159108.02+1.475.26 × 10−4
  single-organism cellular process (GO:0044763)4263205142.83+1.441.46 × 10−5
  regulation of cellular process (GO:0050794)4810220161.16+1.372.08 × 10−4
  regulation of biological process GO:0050789)5131227171.91+1.321.83 × 10−3
  biological regulation (GO:0065007)5521244184.98+1.324.20 × 10−4
  cellular process (GO:0009987)7267307243.48+1.261.04 × 10−4
  Unclassified6357130212.99-0.610.00 × 10
GO cellular component complete
  mitochondrial inner membrane (GO:0005743)213227.14+3.084.57 × 10−3
  mitochondrial membrane (GO:0031966)273269.15+2.842.75 × 10−3
  mitochondrial envelope (GO:0005740)290279.72+2.782.69 × 10−3
  organelle inner membrane (GO:0019866)239228.01+2.752.60 × 10−2
  mitochondrial part (GO:0044429)3953013.23+2.273.65 × 10−2
  mitochondrion (GO:0005739)8195027.44+1.823.85 × 10−2
  membrane part (GO:0044425)3689193123.6+1.567.73 × 10−9
  cell periphery (GO:0071944)18889863.26+1.557.45 × 10−3
  plasma membrane (GO:0005886)18349561.45+1.551.15 × 10−2
  intrinsic component of membrane (GO:0031224)3244166108.69+1.532.94 × 10−6
  integral component of membrane (GO:0016021)3200163107.21+1.526.18 × 10−6
  Membrane(GO:0016020)4745238158.98+1.503.01 × 10−10
  Cell (GO:0005623)7948328266.29+1.234.09 × 10−5
  cell part (GO:0044464)7895325264.52+1.237.49 × 10−5
  Intracellular (GO:0005622)6948279232.79+1.203.08 × 10−2
  intracellular ribonucleoprotein complex GO:0030529)437214.64-<0.204.24 × 10−2
  ribonucleoprotein complex (GO:1990904)438214.67-<0.204.12 × 10−2
  Unclassified6062115203.10-0.570.00 × 10
GO molecular function complete
  oxidoreductase activity (GO:0016491)4863816.28+2.333.68 × 10−3
  ion binding (GO:0043167)3114144104.33+1.383.63 × 10−2
  Unclassified6653155222.9-0.700.00 × 10
DE turkey genes were matched to the chicken gene reference list for analysis in PANTHER [38]. For each, Gene Ontology category, the number of genes in the reference list and those differentially expressed in the turkey are given. Fold enrichment is the number of DE genes divided by Expected. p-values are as determined by the binomial statistic.
Table 5. Summary of PANTHER Overrepresentation Test of the 136 unique differentially expressed (DE) genes in livers of Eastern wild turkeys after AFB1 exposure as compared to domesticated turkey.
GO Biological Process CompleteGallus gallus—REFLIST Genes (15782)Observed Turkey GenesExpectedover/underFold Enrichmentp-Value
  L-serine biosynthetic process (GO:0006564)330.01+>1006.60 × 10−4
  blood coagulation, fibrin clot formation (GO:0072378)530.02+>1003.04 × 10−3
  plasminogen activation (GO:0031639)530.02+>1003.04 × 10−3
  positive regulation of heterotypic cell-cell adhesion (GO:0034116)630.02+>1005.24 × 10−3
  L-serine metabolic process (GO:0006563)630.02+>1005.24 × 10−3
  zymogen activation (GO:0031638)940.03+>1001.15 × 10−4
  regulation of heterotypic cell-cell adhesion (GO:0034114)930.03+>1001.76 × 10−2
  fibrinolysis (GO:0042730)930.03+>1001.76 × 10−2
  negative regulation of endothelial cell apoptotic process (GO:2000352)1130.03+87.843.20 × 10−2
  neg regulation of ext apoptotic signaling pathway (GO:1902042)1130.03+87.843.20 × 10−2
  positive regulation of vasoconstriction (GO:0045907)1230.04+80.524.14 × 10−2
  positive regulation of peptide hormone secretion (GO:0090277)3040.09+42.941.36 × 10−2
  cell-matrix adhesion (GO:0007160)4450.14+36.61.52 × 10−3
  coagulation (GO:0050817)6550.20+24.781.02 × 10−2
  blood coagulation (GO:0007596)6550.20+24.781.02 × 10−2
  cell-substrate adhesion (GO:0031589)6650.20+24.41.10 × 10−2
  hemostasis (GO:0007599)6650.20+24.41.10 × 10−2
  positive regulation of protein secretion (GO:0050714)6950.21+23.341.36 × 10−2
  positive regulation of peptide secretion (GO:0002793)7850.24+20.652.46 × 10−2
  alpha-amino acid metabolic process (GO:1901605)10460.32+18.584.71 × 10−3
  regulation of response to external stimulus (GO:0032101)26480.82+9.767.87 × 10−3
  small molecule metabolic process (GO:0044281)816132.53+5.134.46 × 10−3
  single-organism metabolic process (GO:0044710)1775195.51+3.453.17 × 10−3
  single-organism process (GO:0044699)62143919.29+2.025.62 × 10−5
  Unclassified (UNCLASSIFIED)6196619.24-0.310.00 × 10
DE turkey genes were matched to the chicken gene reference list for analysis in PANTHER [38]. For each, Gene Ontology category, the number of genes in the reference list and those differentially expressed in the turkey are given. Fold enrichment is the number of DE genes divided by Expected. p-values are as determined by the binomial statistic.
Table 6. Differential expression (DE) of genes from major enzyme groups responsible for metabolizing xenobiotic chemicals.
IDEW AFB vs. CNTLDT AFB vs. CNTLCNTL EW vs. DTAFB EW vs. DTDescription
FDR Pvallog2FCFDR Pvallog2FCFDR Pvallog2FCFDR Pvallog2FC
AKR1D10.99640.05590.0000−2.65180.0000−3.24450.2276−0.5988aldo-keto reductase family 1, member D1
ALDH20.0190−0.84040.0000−1.57790.1522−0.53540.96480.1539aldehyde dehydrogenase 2 family (mitochondrial)
AOX10.00002.11370.00100.84100.0574−0.69750.20370.5258aldehyde oxidase 1
COMT0.0000−2.57290.0000−2.87230.0373−0.76820.2064−0.5319catechol-O-methyltransferase
CYP1A50.0000−6.00430.0000−9.27920.0721−0.81050.00002.4042cytochrome P450, family 1, subfamily A, polypeptide 5
CYP3A370.0640−0.95760.0000−2.88840.0007−1.50990.82680.3698cytochrome P450 3A37
CYP3A800.9731−0.12700.0052−1.08660.0022−1.70310.3001−0.8022cytochrome P450 3A80
EPHX10.00003.09940.00070.96360.2271−0.87190.00091.2112epoxide hydrolase 1, microsomal (xenobiotic)
EPHX20.0000−2.75120.0000−2.57880.47570.43010.83420.2075epoxide hydrolase 2, cytoplasmic
EPHX40.00003.13650.00912.44791.00000.38590.14091.0154epoxide hydrolase 4
GSTA1.1 *0.0000−2.00070.0000−2.65840.00661.30210.00001.9010glutathione S-transferase alpha class A1.1
GSTA1.3 *0.0004−1.08040.0000−1.67460.17400.60980.00031.1419glutathione S-transferase alpha class A1.3
GSTA20.0000−1.73320.0000−1.92110.10190.53860.00980.6713glutathione S-transferase 2
GSTA30.84690.12970.00141.46670.00002.31300.00630.9211glutathione S-transferase 3
GSTA40.0000−5.95780.0000−6.40580.30860.56900.02040.9569glutathione S-transferase 4
GSTK10.0000−1.80720.0000−2.98500.1814−0.55830.07730.5713glutathione S-transferase kappa 1
GSTZ10.0000−3.36390.0000−4.11311.00000.05170.03250.7477glutathione S-transferase zeta 1
LOC1005384340.00001.71780.75700.14510.0038−0.97460.35300.5480cytochrome P450 4B1-like
LOC1005384400.0000−2.89700.0000−2.26820.11630.55500.9682−0.1256glutathione S-transferase theta-1-like
LOC1005385880.0025−1.18810.0000−3.48840.0001−1.28450.07580.9622cytochrome P450 4B1-like
LOC1005385950.0000−7.00460.0000−8.56601.00000.05230.18951.5495glutathione S-transferase theta-1
LOC1005424860.0000−3.30500.0000−7.40050.1187−0.89540.00003.1496cytochrome P450 1A4
LOC1005431470.0000−1.91290.0001−1.02440.00970.82350.9927−0.1181cytochrome P450 2U1
LOC1005434740.00004.40890.00003.20440.6256−0.42280.02270.7294glutathione S-transferase omega-1-like
LOC1005444480.0000−3.10800.0000−3.18651.0000−0.17571.0000−0.1579cytochrome P450 2C9-like
LOC1005449380.0000−1.62540.0052−0.82550.86840.37290.3538−0.4894cytochrome P450 26B1
LOC1005451630.0000−2.73940.0000−3.57850.0404−0.76681.00000.0207alcohol dehydrogenase 1
LOC1005452510.0055−0.87650.0000−1.76180.64660.32010.00851.1514sulfotransferase 1C1-like
LOC1005453130.0011−6.62060.0000−12.90850.06622.50300.00719.2625sulfotransferase 6B1-like
LOC1005453370.0042−0.82580.41110.37110.01161.34341.00000.0879sulfotransferase family cytosolic 2B member 1-like
LOC1005454690.0000−7.47920.0000−12.45380.8899−0.31590.03304.6071sulfotransferase 6B1-like
LOC1005456830.0000−2.42760.0000−5.54880.3422−0.84550.09152.2195cytochrome P450 2H1-like
LOC1005467240.00001.83390.00950.80640.1178−0.99301.0000−0.0121cytochrome P450 2K4-like
LOC1005468740.01690.79070.00000.90121.00000.01000.9251−0.1538cytochrome P450 2W1-like
LOC1005470300.0000−7.64580.0000−13.62341.0000−0.22620.00105.8718cytochrome P450 2W1-like
LOC1005475760.0000−4.31150.0000−5.27190.0014−1.01311.0000−0.1127UDP-glucuronosyltransferase 1-1-like
LOC1005476270.76890.14330.0094−0.72290.0023−1.05920.7311−0.2480sulfotransferase family cytosolic 1B member 1
LOC1005477940.02840.70200.96130.06890.9308−0.34880.71430.2327cytochrome P450 2J2-like
LOC1005478850.0011−0.98410.0000−2.41950.0453−0.66720.03210.7153UDP-glucuronosyltransferase 1-1-like
LOC1005481730.00003.72490.00002.59691.0000−0.33910.14610.7080galactosylgalactosylxylosylprotein 3-betaglucuronosyltransferase 1-like
LOC1005482790.0000−7.91930.0000−11.07350.5445−0.55330.09062.5242cytochrome P450 2K4-like
LOC1005483220.0000−5.63880.0000−7.64090.0002−1.22260.04290.7206cytochrome P450 2D17
LOC1005484330.0000−5.36270.0000−8.59151.0000−0.14640.00003.0249cytochrome P450 2K1-like
LOC1005489650.00271.24120.45610.27910.58050.47250.01441.3798cytochrome P450 2J3-like
LOC1005491600.0000−1.56070.0000−1.75170.0335−0.71030.3717−0.5706cytochrome P450 4F22
LOC1005492680.00002.87340.00671.68351.0000−0.37990.26580.7421aldehyde oxidase 2-like
LOC1005493120.31770.35740.0000−1.57380.0000−1.91581.0000−0.0363UDP-glucuronosyltransferase 2C1-like
LOC1005499910.0000−1.76550.0000−1.69430.00021.38940.00391.2611arylamine N-acetyltransferase, liver isozyme
LOC1005504300.0512−0.66590.0000−1.37360.2945−0.48550.94950.1737cytochrome P450 4F22
LOC1049092160.09253.66770.02074.62621.00000.00000.5908−1.0481cytochrome P450 2J6-like
LOC1049097340.0000−6.44430.0023−2.10110.00004.14411.0000−0.2356sulfotransferase family cytosolic 2B member 1-like
LOC1049107460.0000−3.63850.0000−5.19880.7764−0.36200.18961.1405alcohol dehydrogenase 1-like
LOC1049119550.3696−0.40510.0000−1.79540.0045−1.29851.00000.0458cytochrome P450 2H2
LOC1049123730.00006.12240.00007.79090.21632.27650.27240.5912sulfotransferase 6B1-like
LOC1049124270.00010.86260.00060.80490.7651−0.34680.3464−0.3463cytochrome P450 2J2-like
LOC1049124280.17380.57651.00000.02810.28790.52090.04011.0161cytochrome P450 2J2-like
LOC1049124940.00061.59620.03730.58711.0000−0.15630.35370.7988cytochrome P450 2J2-like
LOC1049153910.0000−4.40410.0000−4.54291.00000.24530.95730.3281sulfotransferase family cytosolic 2B member 1-like
LOC1049154450.0000−3.61080.0000−4.23250.0262−0.85590.9682−0.2891alcohol dehydrogenase 1-like
LOC1049154460.0000−3.86780.0000−5.46610.1525−0.65180.41290.8857alcohol dehydrogenase 1-like
LOC1049154730.00001.51410.86430.08740.8777−0.30840.00101.0674UDP-glucuronosyltransferase 1-9-like
LOC1049154740.8756−0.15600.0000−3.71120.0000−2.53120.04180.9617UDP-glucuronosyltransferase 1-6-like
LOC1049154760.00061.67040.91120.15040.4764−1.01510.62920.4445UDP-glucuronosyltransferase 1-1-like
LOC1049154770.0000−4.30260.0000−6.16301.00000.06750.01601.8961UDP-glucuronosyltransferase 1-6 pseudogene
LOC1049154780.0000−1.73040.0000−3.78921.00000.19390.00172.2036UDP-glucuronosyltransferase 1-1-like
LOC1049154790.0000−2.40270.0000−5.55370.1838−0.96210.03842.1351cytochrome P450 2H1-like
LOC1049155860.0000−5.93230.0090−2.76870.00233.15181.0000−0.0267sulfotransferase family cytosolic 2B member 1-like
LOC1049156090.0022−3.86610.0686−3.90120.80371.20481.00001.5781cytochrome P450 2C19-like
LOC1049156100.00003.86310.00003.52780.9437−0.62310.9255−0.3368cytochrome P450 2C4-like
LOC1049163990.0000−6.07010.0000−7.55160.56480.61410.42952.0569cytochrome P450 2C27-like
LOC1049165530.0000−4.97030.0000−3.97950.53690.68530.9367−0.3716sulfotransferase family cytosolic 2B member 1-like
LOC1049169090.0000−5.60850.0000−7.04580.53150.53730.12271.9411cytochrome P450 2C31-like
NQO10.7812−0.14080.0008−0.82831.0000−0.14350.21450.4945NAD(P)H dehydrogenase, quinone 1
NQO20.0000−0.90710.4267−0.22420.43890.39900.5130−0.3430NAD(P)H dehydrogenase, quinone 2
PTGS10.00001.44440.17290.54130.9517−0.47820.52660.3552prostaglandin-endoperoxide synthase 1
PTGS20.79630.13150.00001.33650.11570.75440.1495−0.5069prostaglandin-endoperoxide synthase 2
SULT4A10.1141−0.63150.0039−0.81131.00000.30270.45150.4192sulfotransferase family 4A, member 1
SULT6B10.0457−1.69540.0001−2.60411.00000.05400.75450.9577sulfotransferase family, cytosolic, 6B, member 1
TPMT0.97010.07250.0017−0.71060.8466−0.29680.23120.4402thiopurine S-methyltransferase
UGT80.00001.79260.00001.14970.5752−0.31940.63560.2705UDP glycosyltransferase 8
Genes included were significant (FDR p-value < 0.05) in at least one comparison. Comparisons highlighted in green are down regulated and those in red up regulated. Cytochrome P450 (CYP) and glutathione S-transferase (GST) family members shown to have in vitro activity towards AFB1 and its metabolites in turkey are indicated in bold. * Due to similarity, these likely include transcripts assignable to GSTA1.1, A1.2, and A1.3.

