
Experimental Investigations of Using Aluminum Oxide (Al2O3) and Nano-Graphene Powder in the Electrical Discharge Machining of Titanium Alloy

 , , , ,
Abstract
:1. Introduction
2. Materials and Methods
2.1. Synthesis of Nanopowders
2.1.1. Aluminum Oxide (Al2O3) Nanopowder
2.1.2. Nano-Graphene Nanopowder
2.2. Experimental Conditions
2.3. Optimization
3. Results and Discussion
3.1. Analysis of MRR
3.2. Analysis of SR
3.3. Optimization
3.4. Investigating the Effect of Alumina and Nano-Graphene Powders on MRR and SR
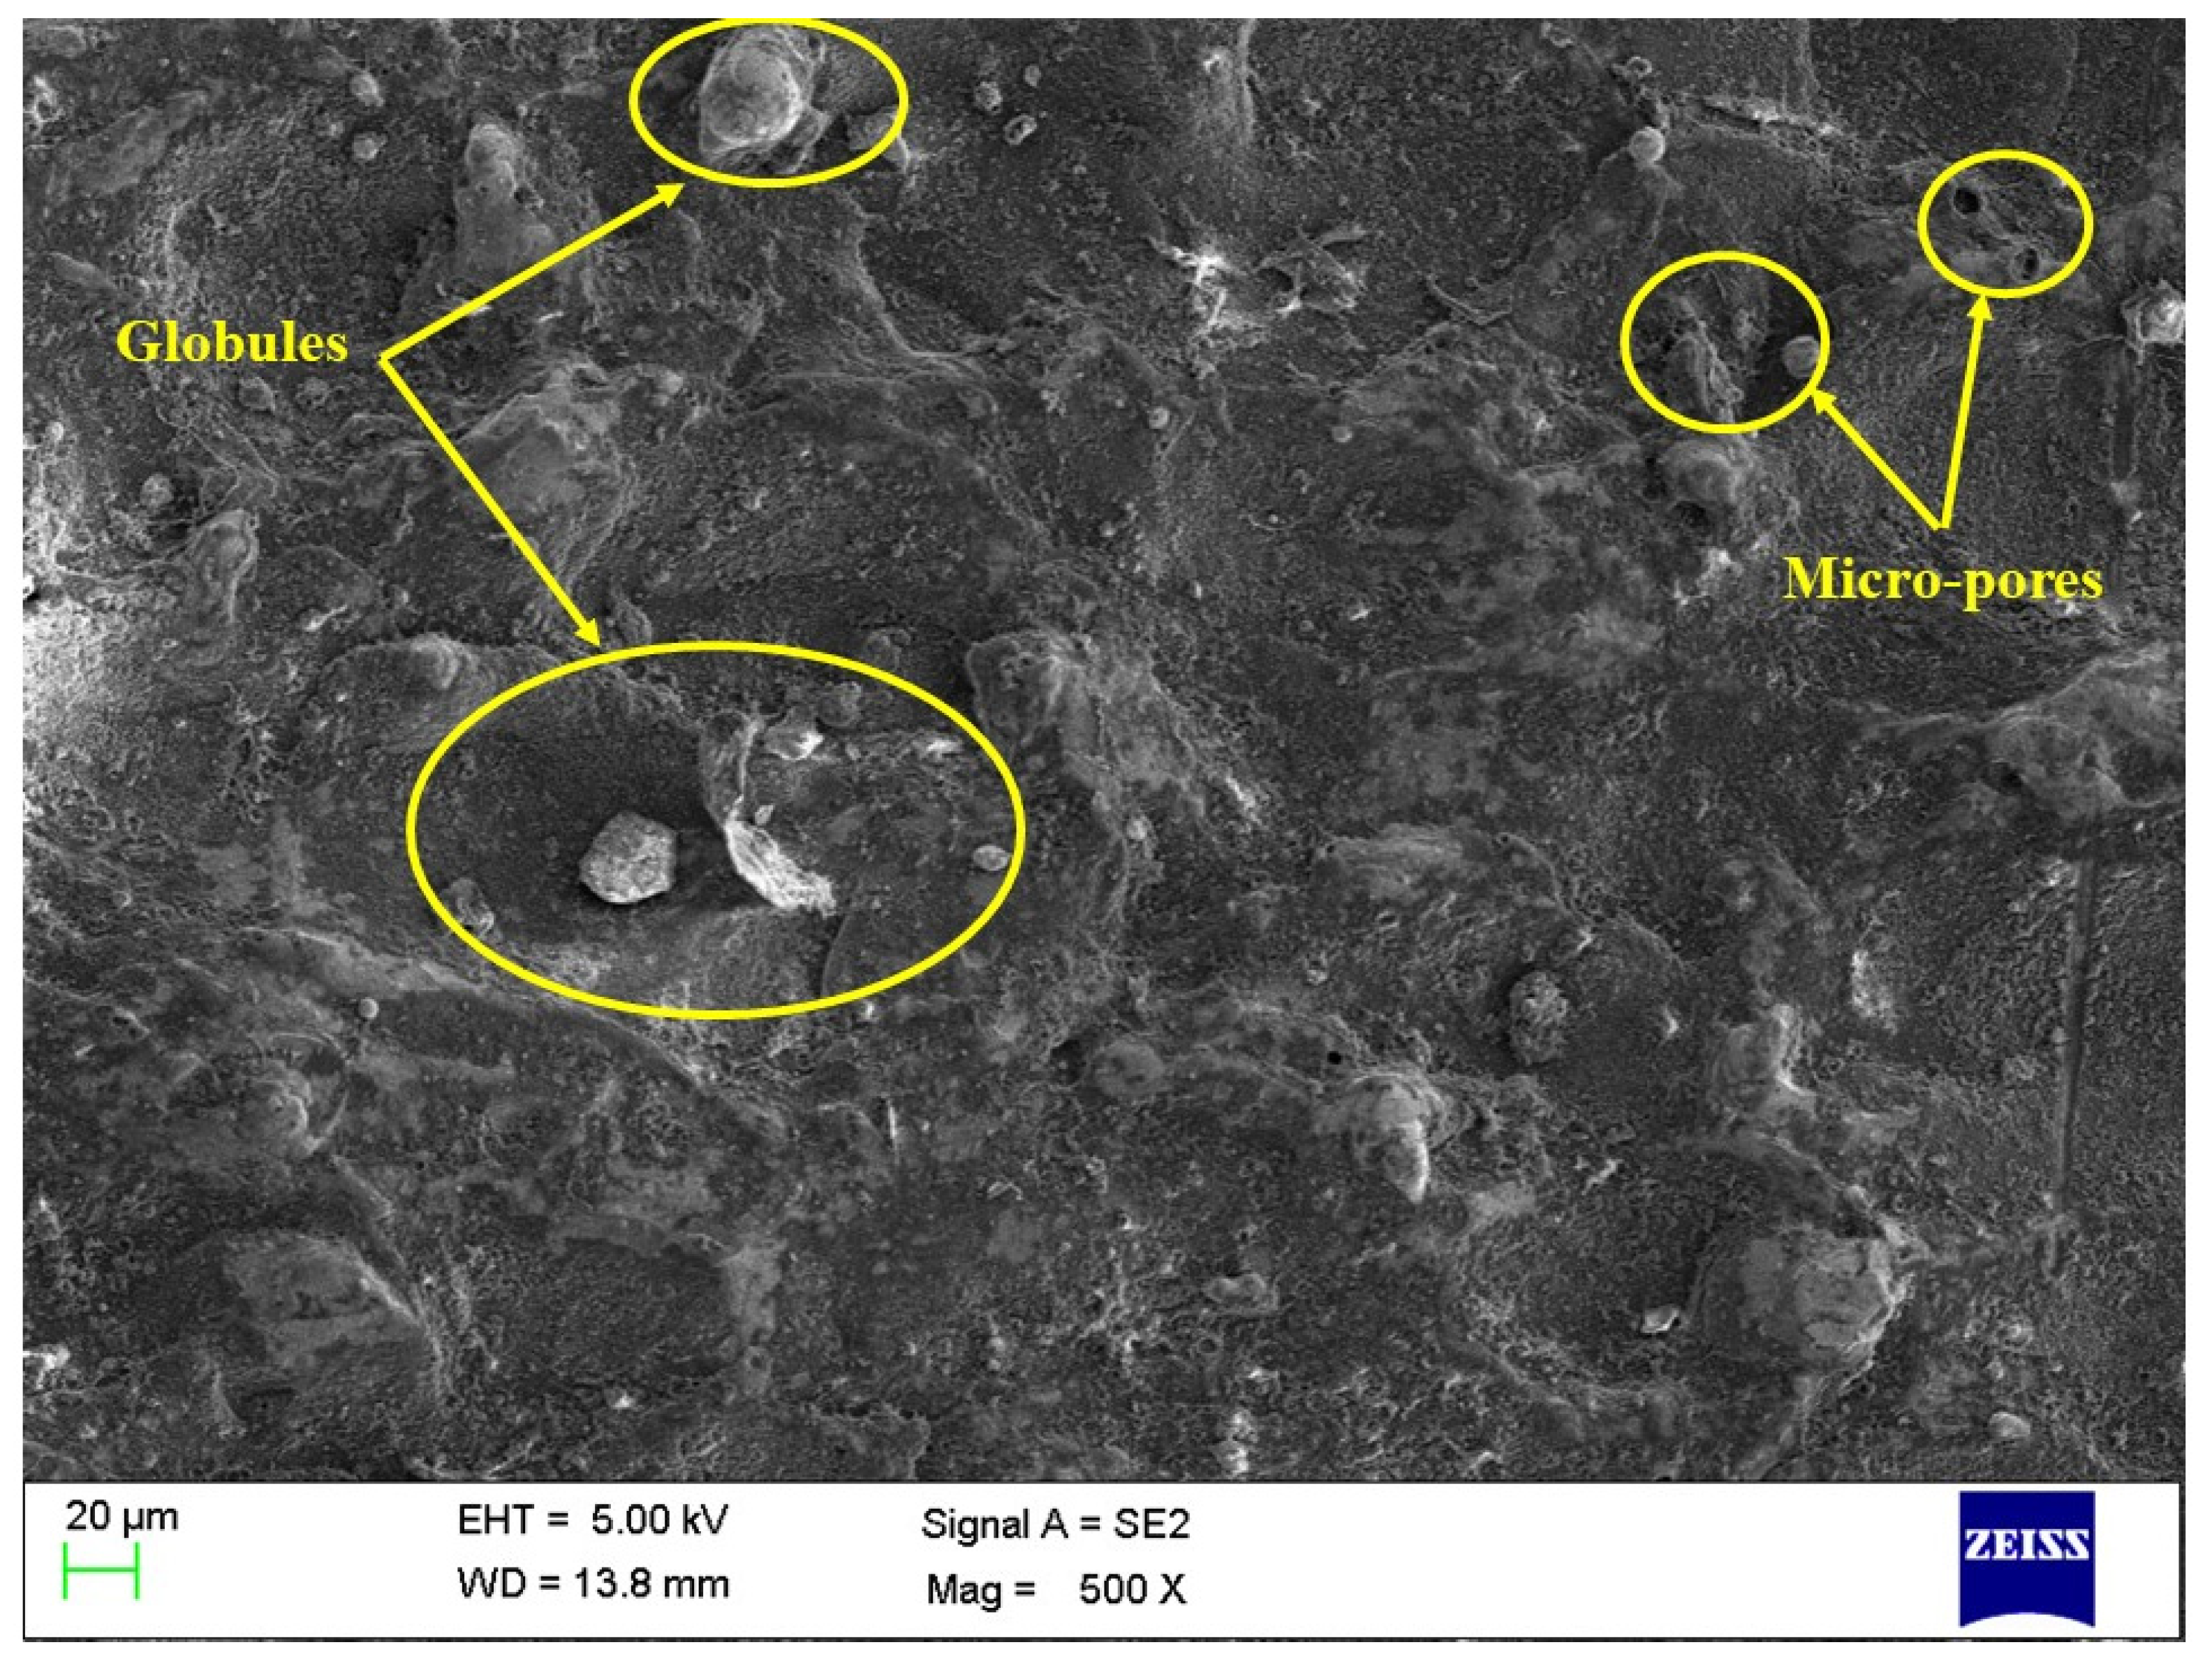
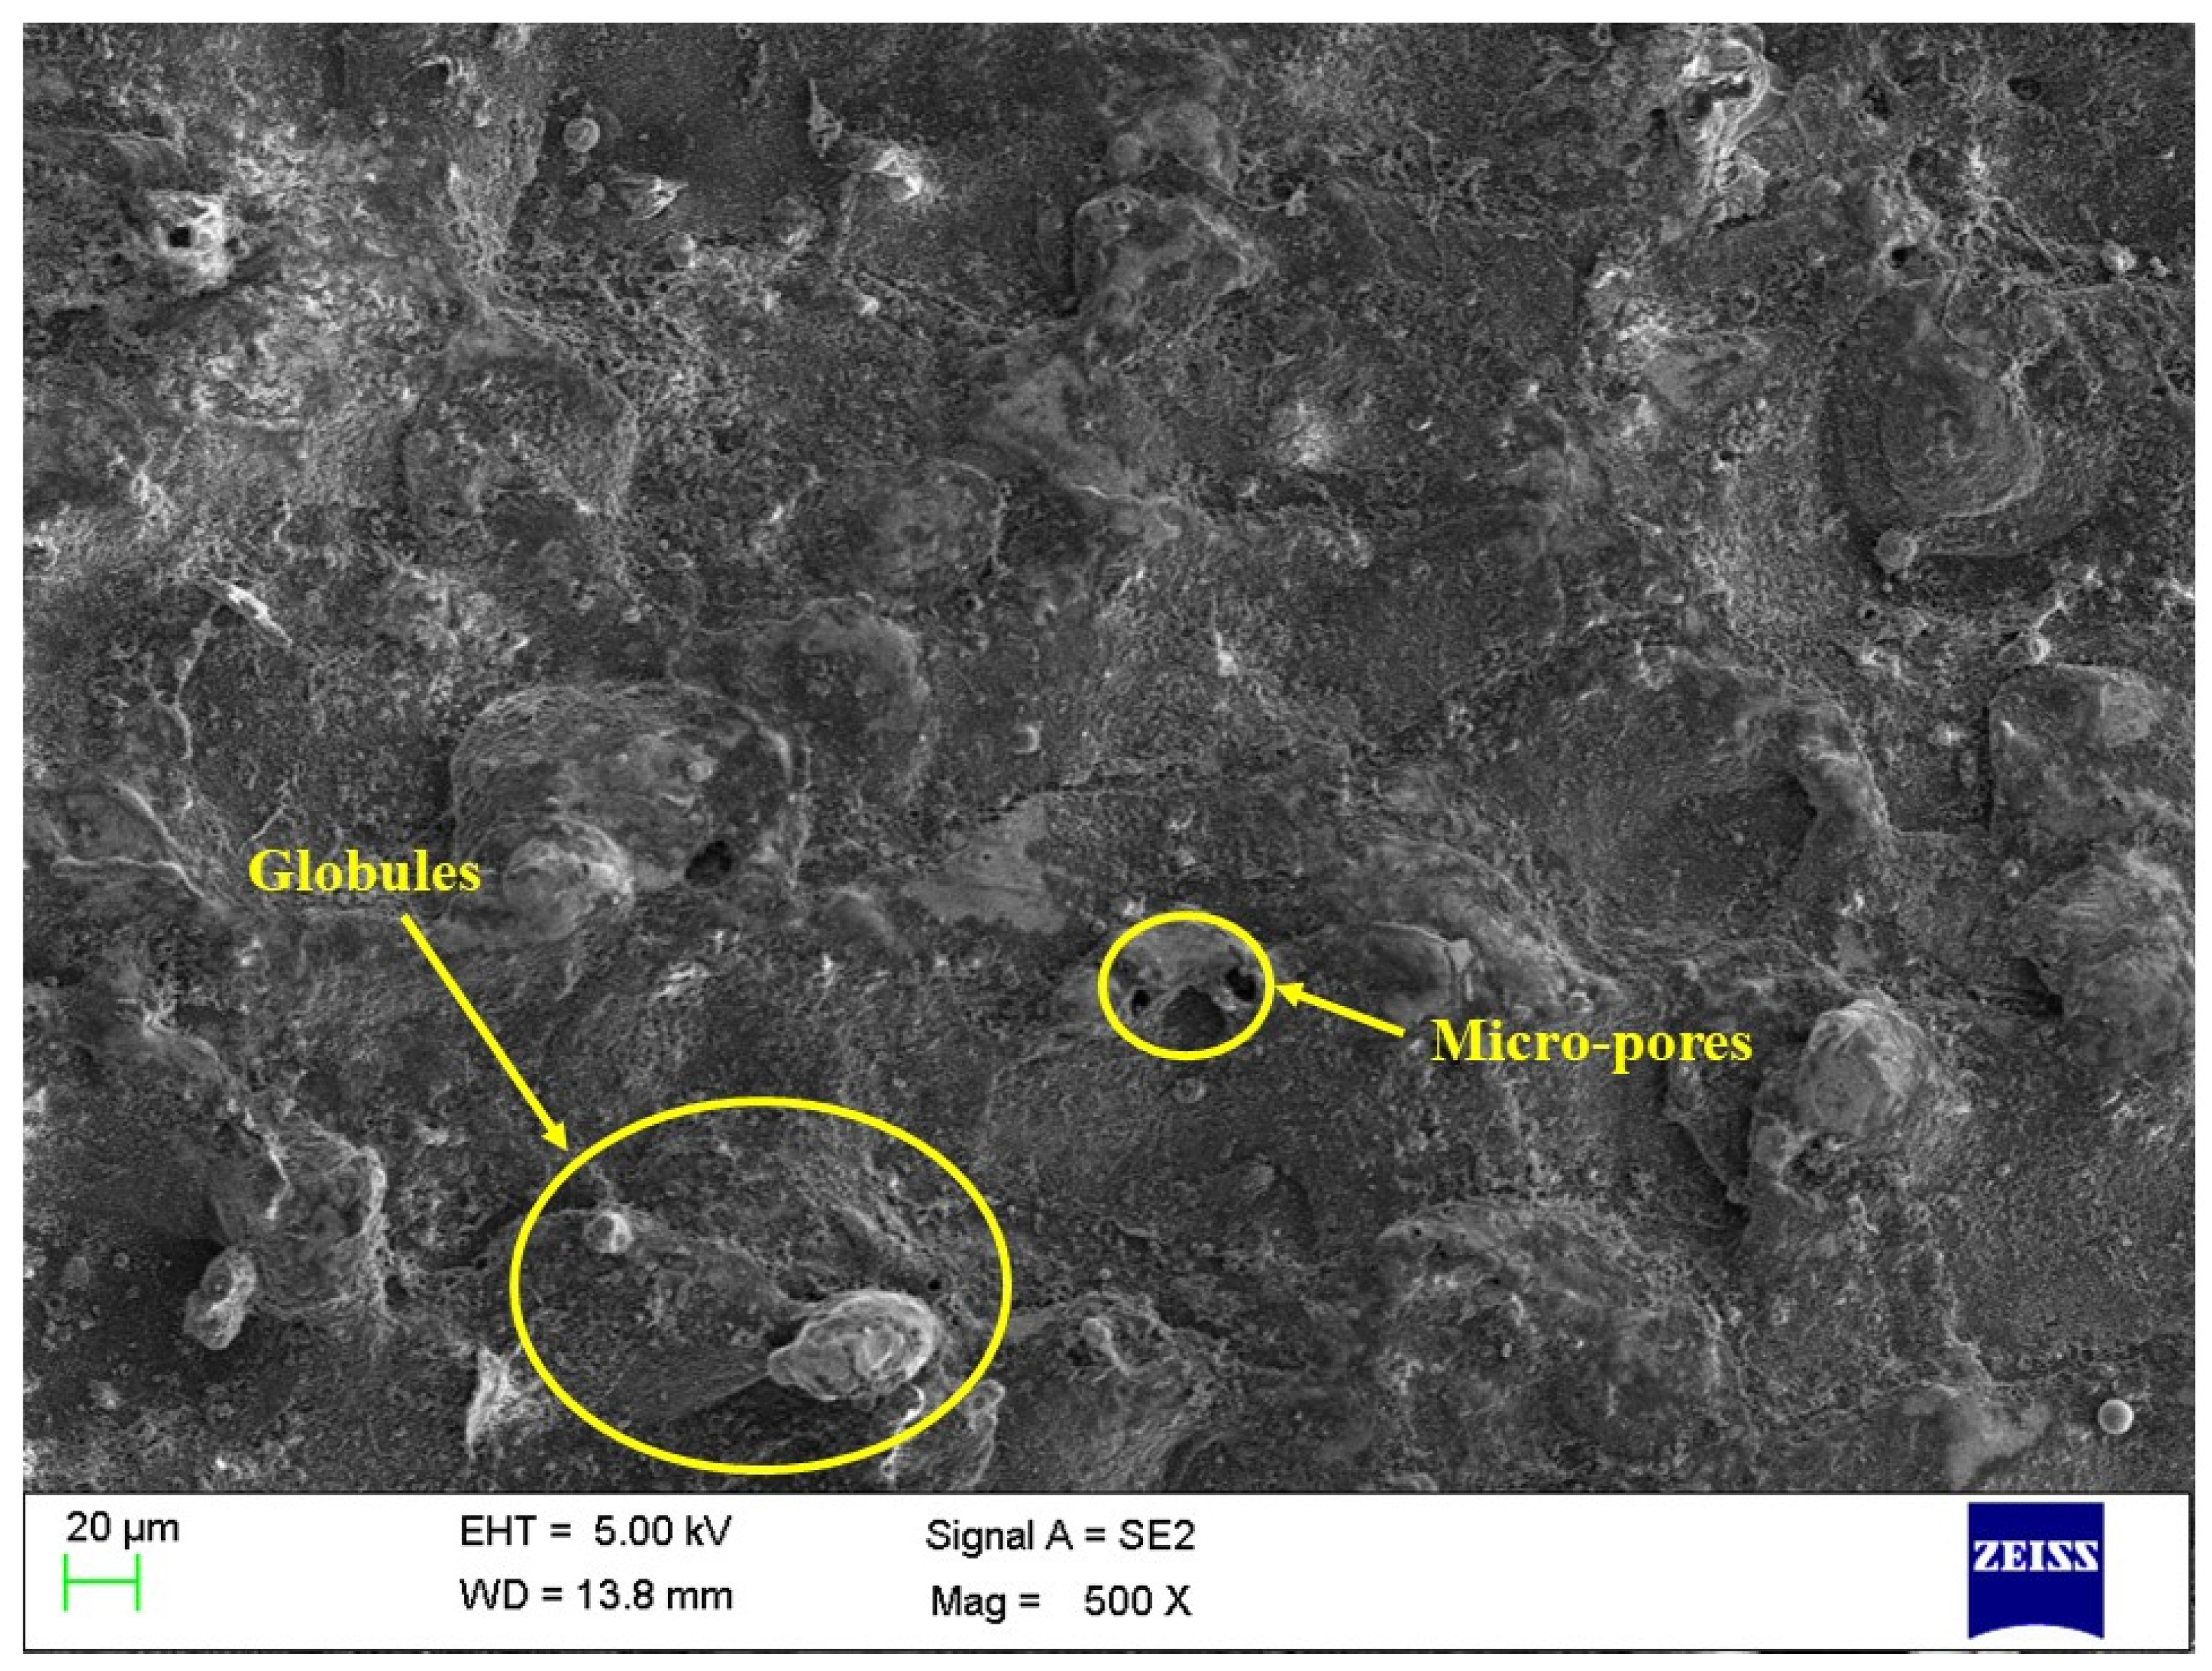
3.5. Investigating the Effect of Alumina and Nano-Graphene Powders on Machined Surfaces
4. Conclusions
- ➢
- Empirical relations were generated through Minitab. ANOVA was employed to study the statistical significance. The regression model term was observed to be significant for both SR and MRR responses.
- ➢
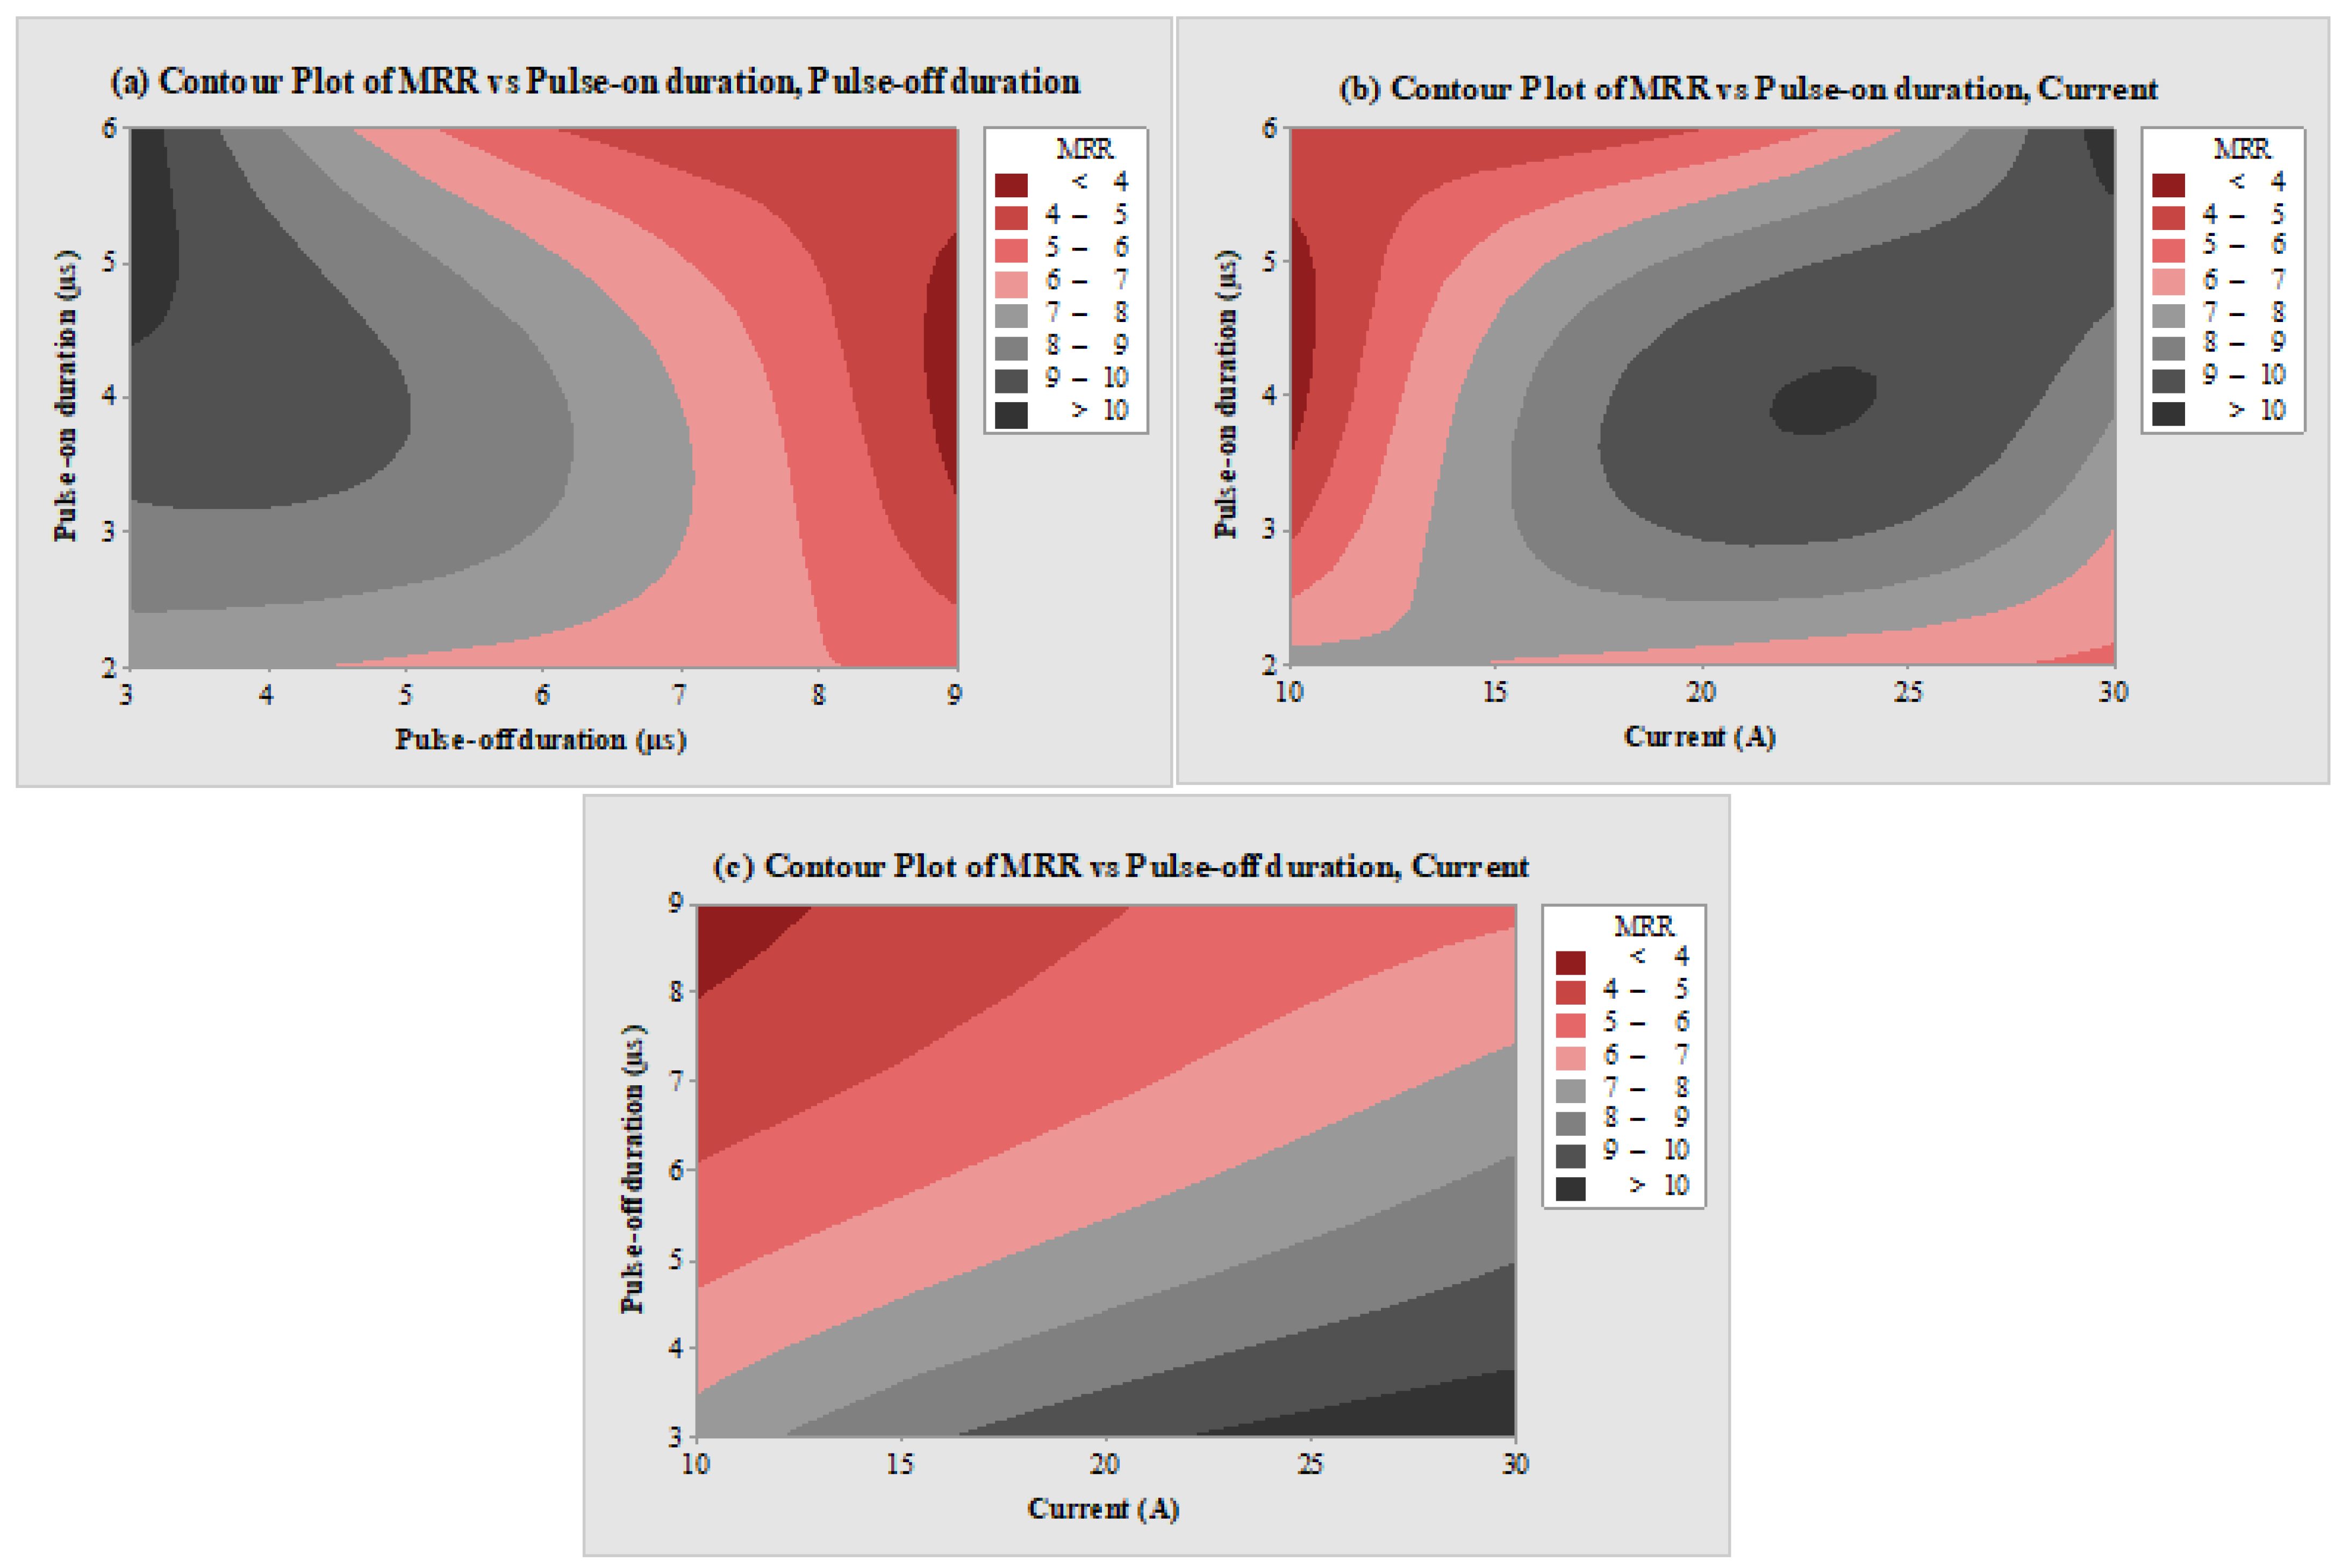
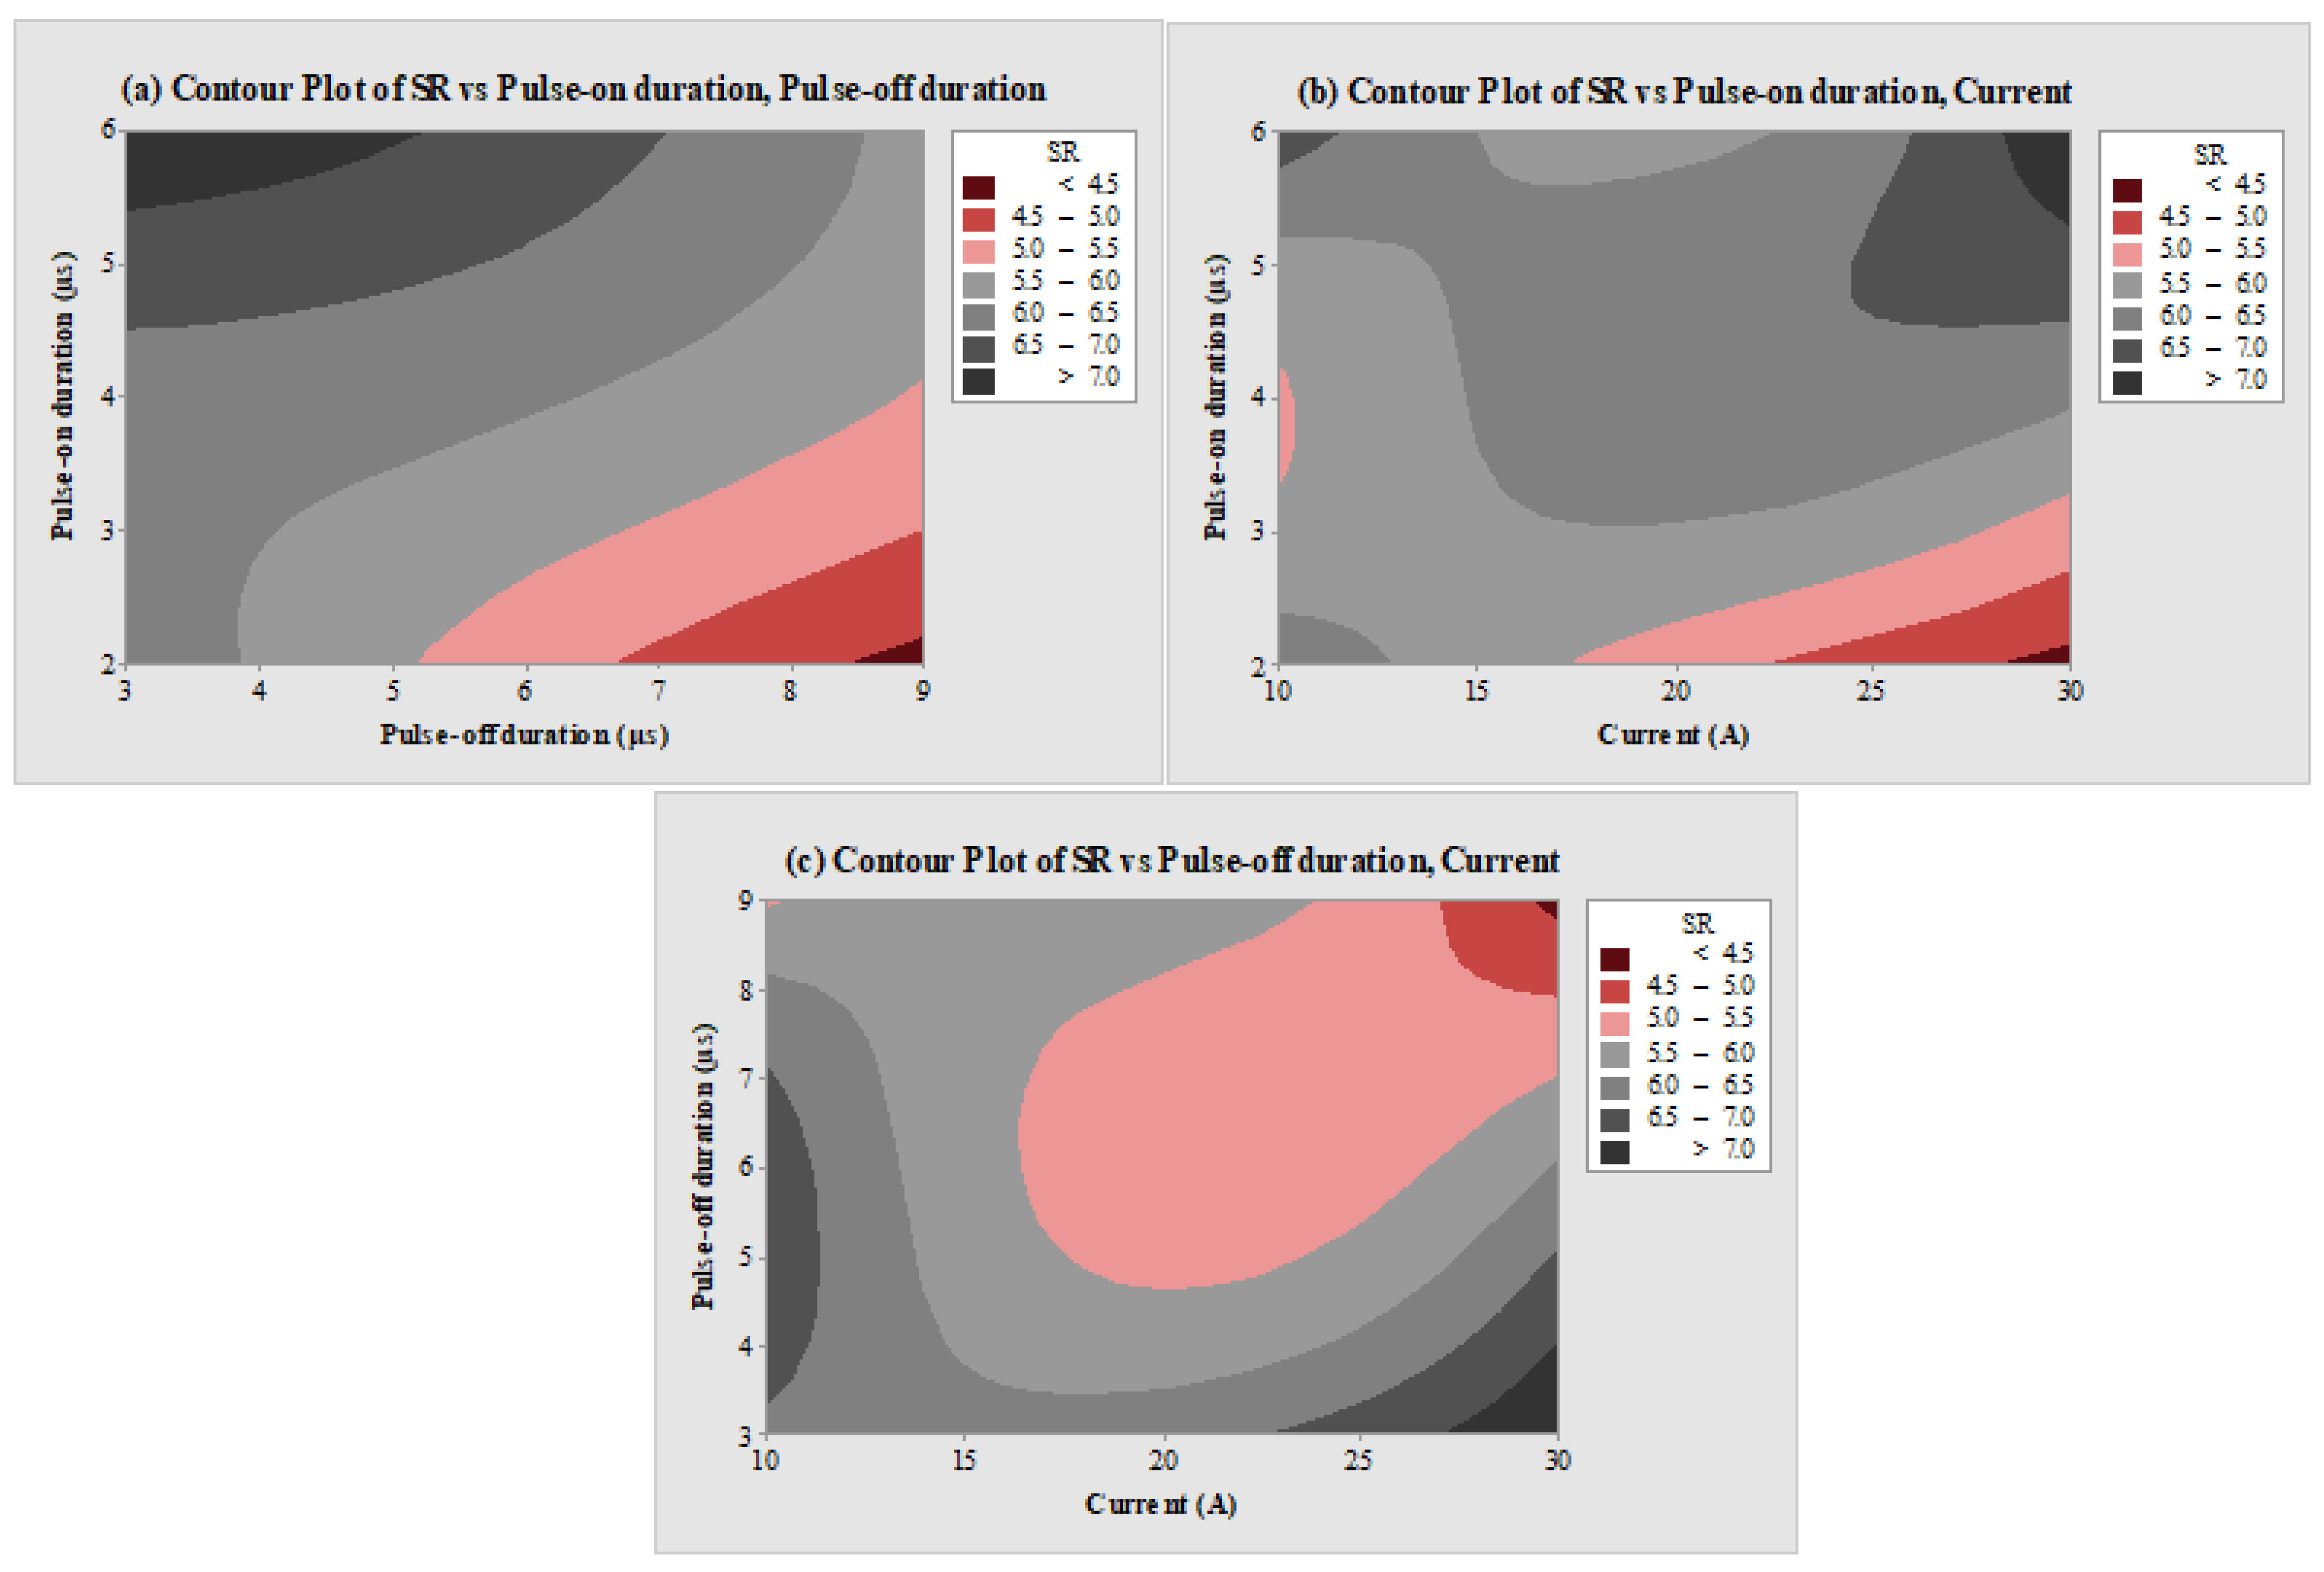
- Among the input factors, Toff and current were found to have a vital role in the change of MRR response. A higher F-value of 175.26 for Toff suggested that it has the largest significant effect, with a contribution of 69.51%, trailed by current with a 28.22% contribution. For SR response, Ton and Toff were identified as significant factors. A higher F-value of 55.73 for Toff suggested that it has the largest significant impact, with a contribution of 50.41%, trailed by Ton with 43.71%.
- ➢
- Single-objective optimization has shown a maximum MRR of 10.7071 mm3/s and a least SR of 4.41 µm. The objective function of simultaneous optimization has given an optimum MRR of 8.9154 mm3/s and an SR of 5.14 µm at input factors of Ton at 2 µs, Toff at 5 µs, and I at 30 A.
- ➢
- The influence of alumina and nano-graphene powder was investigated on MRR, SR, and surface morphology at optimized parametric settings. The machining performance was significantly improved by using both powder-mixed EDM as compared to conventional EDM. For alumina powder, the performance of MRR and SR was improved by 35.19% and 18.27%, respectively. In the case of nano-graphene powder, MRR and SR showed a larger improvement of 45.81% and 37.22%, respectively. Due to the higher conductivity of nano-graphene powder, it showed a larger improvement as compared to alumina powder.
- ➢
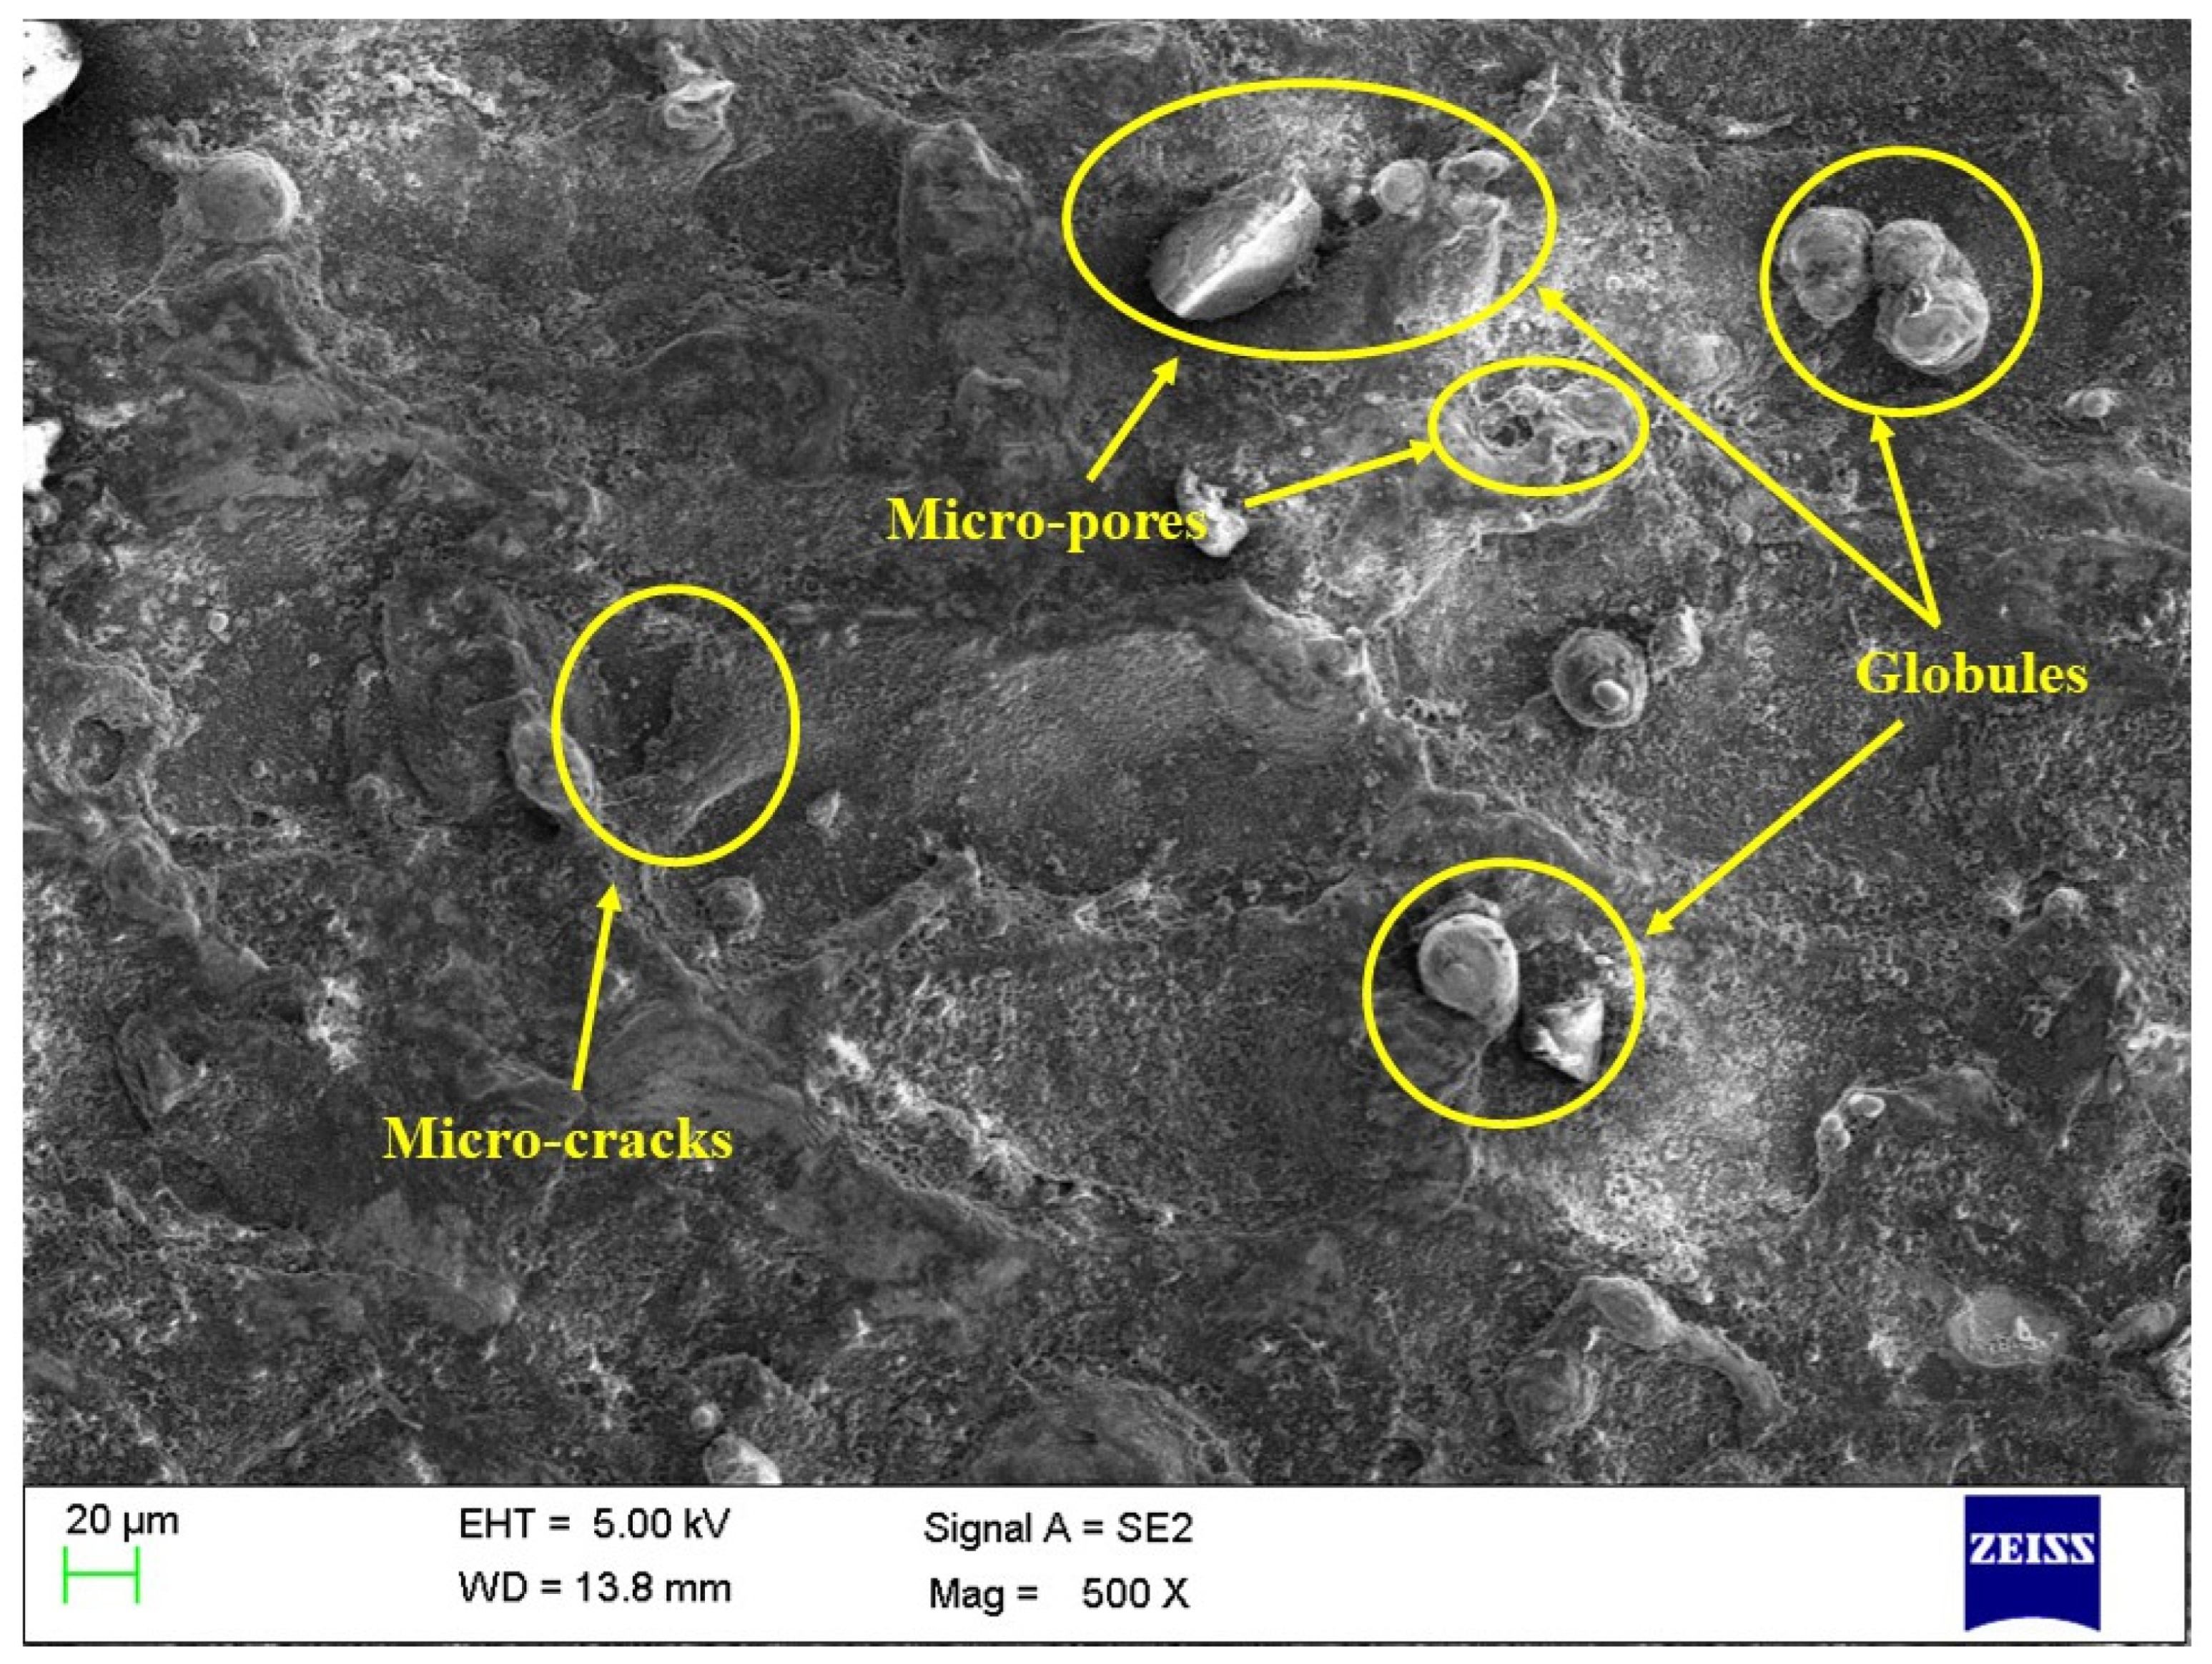
- Lastly, SEM was utilized to investigate the impact of alumina and graphene powder on surface morphology. The machined surface obtained for conventional EDM depicted more surface defects than the PMEDM process. The surface morphology of PMEDM using nano-graphene showed the fewest surface defects in terms of microcracks, pores, and globule size.
- ➢
- The last thing to say is that workers who deal with nanoparticles in dielectrics must wear gloves and masks to avoid the risk of skin exposure. Exposure can occur during pouring or mixing operations; the use in EDM will need further research.
Author Contributions
Funding
Data Availability Statement
Conflicts of Interest
References
- Cui, C.; Hu, B.; Zhao, L.; Liu, S. Titanium alloy production technology, market prospects and industry development. Mater. Des. 2011, 32, 1684–1691. [Google Scholar] [CrossRef]
- Zhang, C.; Zou, D.; Mazur, M.; Mo, J.P.; Li, G.; Ding, S. The State of the Art in Machining Additively Manufactured Titanium Alloy Ti-6Al-4V. Materials 2023, 16, 2583. [Google Scholar] [CrossRef] [PubMed]
- Boyer, R.R. An overview on the use of titanium in the aerospace industry. Mater. Sci. Eng. A 1996, 213, 103–114. [Google Scholar] [CrossRef]
- Outeiro, J.; Cheng, W.; Chinesta, F.; Ammar, A. Modelling and optimization of machining of Ti-6Al-4V titanium alloy using machine learning and design of experiments methods. J. Manuf. Mater. Process. 2022, 6, 58. [Google Scholar] [CrossRef]
- Yu, F.-L.; Kong, C.; Yu, H.-L. Low-temperature superplasticity of cryorolled Ti-6Al-4V titanium alloy sheets. Tungsten 2023, 5, 522–530. [Google Scholar] [CrossRef]
- Sarıkaya, M.; Gupta, M.K.; Tomaz, I.; Pimenov, D.Y.; Kuntoğlu, M.; Khanna, N.; Yıldırım, Ç.V.; Krolczyk, G.M. A state-of-the-art review on tool wear and surface integrity characteristics in machining of superalloys. CIRP J. Manuf. Sci. Technol. 2021, 35, 624–658. [Google Scholar] [CrossRef]
- Hourmand, M.; Sarhan, A.A.; Sayuti, M.; Hamdi, M. A comprehensive review on machining of titanium alloys. Arab. J. Sci. Eng. 2021, 46, 7087–7123. [Google Scholar] [CrossRef]
- Sethy, S.; Behera, R.K.; Davim, J.P.; Rana, J. Effect of Thermo-Physical Properties of the Tool Materials on the Electro-Discharge Machining Performance of Ti-6Al-4V and SS316 Work Piece Materials. J. Manuf. Mater. Process. 2022, 6, 96. [Google Scholar] [CrossRef]
- Dekster, L.; Karkalos, N.E.; Karmiris-Obratański, P.; Markopoulos, A.P. Evaluation of the Machinability of Ti-6Al-4V Titanium Alloy by AWJM Using a Multipass Strategy. Appl. Sci. 2023, 13, 3774. [Google Scholar] [CrossRef]
- Chaudhari, R.; Vora, J.J.; Mani Prabu, S.; Palani, I.; Patel, V.K.; Parikh, D.; de Lacalle, L.N.L. Multi-response optimization of WEDM process parameters for machining of superelastic nitinol shape-memory alloy using a heat-transfer search algorithm. Materials 2019, 12, 1277. [Google Scholar] [CrossRef]
- Zhang, H.-Y.; Liu, Y.-H.; Li, Z.-W.; Xiong, A.-H.; Li, K.; Fu, J.-Y. Crack analysis in Ti-6Al-4V alloy produced by selective laser melting. Tungsten 2021, 3, 361–367. [Google Scholar] [CrossRef]
- Wang, J.; Zhu, R.; Liu, Y.; Zhang, L. Understanding melt pool characteristics in laser powder bed fusion: An overview of single-and multi-track melt pools for process optimization. Adv. Powder Mater. 2023, 2, 100137. [Google Scholar] [CrossRef]
- Ma, H.; Wang, J.; Qin, P.; Liu, Y.; Chen, L.; Wang, L.; Zhang, L. Advances in additively manufactured titanium alloys by powder bed fusion and directed energy deposition: Microstructure, defects, and mechanical behavior. J. Mater. Sci. Technol. 2023, 183, 32–62. [Google Scholar] [CrossRef]
- Sharma, N.; Gupta, R.D.; Khanna, R.; Sharma, R.C.; Sharma, Y.K. Machining of Ti-6Al-4V biomedical alloy by WEDM: Investigation and optimization of MRR and Rz using grey-harmony search. World J. Eng. 2023, 20, 221–234. [Google Scholar] [CrossRef]
- Maurya, R.; Porwal, R.K.; Singh, R. Concerning drifts to optimization techniques of wire-EDM process for titanium based super alloys: A review. Mater. Today Proc. 2019, 18, 4509–4514. [Google Scholar] [CrossRef]
- Hasan, M.M.; Saleh, T.; Sophian, A.; Rahman, M.A.; Huang, T.; Mohamed Ali, M.S. Experimental modeling techniques in electrical discharge machining (EDM): A review. Int. J. Adv. Manuf. Technol. 2023, 127, 2125–2150. [Google Scholar] [CrossRef]
- Matanda, B.K.; Patel, V.; Singh, B.; Joshi, U.; Joshi, A.; Oza, A.D.; Gupta, M.; Kumar, S. A review on parametric optimization of EDM process for nanocomposites machining: Experimental and modelling approach. Int. J. Interact. Des. Manuf. 2023, 1–10. [Google Scholar] [CrossRef]
- Ishfaq, K.; Sana, M.; Waseem, M.U.; Ashraf, W.M.; Anwar, S.; Krzywanski, J. Enhancing EDM machining precision through deep cryogenically treated electrodes and ANN modelling approach. Micromachines 2023, 14, 1536. [Google Scholar] [CrossRef]
- Jatti, V.S. Multi-characteristics optimization in EDM of NiTi alloy, NiCu alloy and BeCu alloy using Taguchi’s approach and utility concept. Alex. Eng. J. 2018, 57, 2807–2817. [Google Scholar] [CrossRef]
- Muttamara, A.; Nakwong, P. Enhancing Wire-EDM Performance with Zinc-Coated Brass Wire Electrode and Ultrasonic Vibration. Micromachines 2023, 14, 862. [Google Scholar] [CrossRef]
- Chaudhari, R.; Vora, J.J.; Prabu, S.M.; Palani, I.; Patel, V.K.; Parikh, D. Pareto optimization of WEDM process parameters for machining a NiTi shape memory alloy using a combined approach of RSM and heat transfer search algorithm. Adv. Manuf. 2021, 9, 64–80. [Google Scholar] [CrossRef]
- Surani, K.; Patel, S.; Alrubaie, A.J.; Oza, A.; Panchal, H.; Kumar, S.; Zahmatkesh, S. Performance comparison of powder mixed EDM and traditional EDM on TZM-molybdenum super alloy using response surface methodology. Int. J. Interact. Des. Manuf. 2023, 17, 2647–2658. [Google Scholar] [CrossRef]
- Işık, A.T.; Çakıroğlu, R.; Günay, M. Multiresponse optimization of performance indicators through Taguchi-grey relational analysis in EDM of cemented carbide. CIRP J. Manuf. Sci. Technol. 2023, 41, 490–500. [Google Scholar] [CrossRef]
- Maddu, J.; Karrolla, B.; Shaik, R.U.; Elahi, H.; Arkanti, K. Evaluation of Bronze Electrode in Electrical Discharge Coating Process for Copper Coating. Micromachines 2023, 14, 136. [Google Scholar] [CrossRef] [PubMed]
- Gupta, A.; Kumar, H. Optimization of EDM process parameters: A review of technique, process, and outcome. In Proceedings of the ICAPIE2019: Advances in Manufacturing Industrial Engineering, Delhi, India, 21–22 December 2019; pp. 981–996. [Google Scholar]
- Dikshit, M.K.; Singh, S.; Pathak, V.K.; Saxena, K.K.; Agrawal, M.K.; Malik, V.; hazim Salem, K.; Khan, M.I. Surface characteristics optimization of biocompatible Ti6Al4V with RCCD and NSGA II using die sinking EDM. J. Mater. Res. Technol. 2023, 24, 223–235. [Google Scholar] [CrossRef]
- Solís Pinargote, N.W.; Malakhinsky, A.; Soe, T.N.; Pristinskiy, Y.; Smirnov, A.; Meleshkin, Y.; Apelfeld, A.; Peretyagin, N.; Peretyagin, P.; Grigoriev, S.N. Investigation of the WEDM Parameters’ Influence on the Recast Layer Thickness of Spark Plasma Sintered SiC-TiB2-TiC Ceramic. Coatings 2023, 13, 1728. [Google Scholar] [CrossRef]
- Devarasiddappa, D.; Chandrasekaran, M.; Arunachalam, R. Experimental investigation and parametric optimization for minimizing surface roughness during WEDM of Ti6Al4V alloy using modified TLBO algorithm. J. Braz. Soc. Mech. Sci. Eng. 2020, 42, 128. [Google Scholar] [CrossRef]
- Vora, J.; Prajapati, N.; Patel, S.; Sheth, S.; Patel, A.; Khanna, S.; Ayesta, I.; de Lacalle, L.L.; Chaudhari, R. Multi-response optimization and effect of alumina mixed with dielectric fluid on WEDM process of Ti6Al4V. In Recent Advances in Mechanical Infrastructure: Proceedings of ICRAM 2021; Springer: Singapore, 2022; pp. 277–287. [Google Scholar]
- Guo, X.; Zhou, J.; Zhao, Y.; Zhang, S.; Yin, X.; Xu, Y. Multi-objective parameter optimization of Ti6Al4V surface integrity for SEAM. Int. J. Adv. Manuf. Technol. 2023, 129, 469–483. [Google Scholar] [CrossRef]
- Verma, V.; Sajeevan, R. Multi process parameter optimization of diesinking EDM on titanium alloy (Ti6Al4 V) using Taguchi approach. Mater. Today Proc. 2015, 2, 2581–2587. [Google Scholar] [CrossRef]
- Alam, M.N.; Siddiquee, A.N.; Khan, Z.A.; Khan, N.Z. A comprehensive review on wire EDM performance evaluation. Proc. Inst. Mech. Eng. Part E J. Process Mech. Eng. 2022, 236, 1724–1746. [Google Scholar] [CrossRef]
- Mao, X.; Almeida, S.; Mo, J.; Ding, S. The state of the art of electrical discharge drilling: A review. Int. J. Adv. Manuf. Technol. 2022, 121, 2947–2969. [Google Scholar] [CrossRef]
- Kumar, S.S.; Varol, T.; Canakci, A.; Kumaran, S.T.; Uthayakumar, M. A review on the performance of the materials by surface modification through EDM. Int. J. Lightweight Mater. Manuf. 2021, 4, 127–144. [Google Scholar] [CrossRef]
- Abdudeen, A.; Abu Qudeiri, J.E.; Kareem, A.; Ahammed, T.; Ziout, A. Recent advances and perceptive insights into powder-mixed dielectric fluid of EDM. Micromachines 2020, 11, 754. [Google Scholar] [CrossRef] [PubMed]
- Prakash, C.; Kansal, H.; Pabla, B.; Puri, S. Potential of silicon powder-mixed electro spark alloying for surface modification of β-phase titanium alloy for orthopedic applications. Mater. Today Proc. 2017, 4, 10080–10083. [Google Scholar] [CrossRef]
- Prakash, C.; Kansal, H.; Pabla, B.; Puri, S. Experimental investigations in powder mixed electric discharge machining of Ti–35Nb–7Ta–5Zrβ-titanium alloy. Mater. Manuf. Process. 2017, 32, 274–285. [Google Scholar] [CrossRef]
- Rajkumar, G.; Saravanan, M.; Bejaxhin, A.B.H.; Sharma, S.; Dwivedi, S.P.; Kumar, R.; Singh, S. Parametric optimization of powder-mixed EDM of AA2014/Si3N4/Mg/cenosphere hybrid composites using fuzzy logic: Analysis of mechanical, machining, microstructural, and morphological characterizations. J. Compos. Sci. 2023, 7, 380. [Google Scholar] [CrossRef]
- Le, V.T.; Hoang, L.; Ghazali, M.F.; Le, V.T.; Do, M.T.; Nguyen, T.T.; Vu, T.S. Optimization and comparison of machining characteristics of SKD61 steel in powder-mixed EDM process by TOPSIS and desirability approach. Int. J. Adv. Manuf. Technol. 2023, 1–22. [Google Scholar] [CrossRef]
- Marashi, H.; Jafarlou, D.M.; Sarhan, A.A.; Hamdi, M. State of the art in powder mixed dielectric for EDM applications. Precis. Eng. 2016, 46, 11–33. [Google Scholar] [CrossRef]
- Taherkhani, A.; Ilani, M.A.; Ebrahimi, F.; Huu, P.N.; Long, B.T.; Van Dong, P.; Tam, N.C.; Minh, N.D.; Van Duc, N. Investigation of surface quality in Cost of Goods Manufactured (COGM) method of μ-Al2O3 Powder-Mixed-EDM process on machining of Ti-6Al-4V. Int. J. Adv. Manuf. Technol. 2021, 116, 1783–1799. [Google Scholar] [CrossRef]
- Chaudhari, R.; Shah, Y.; Khanna, S.; Patel, V.K.; Vora, J.; Pimenov, D.Y.; Giasin, K. Experimental Investigations and Effect of Nano-Powder-Mixed EDM Variables on Performance Measures of Nitinol SMA. Materials 2022, 15, 7392. [Google Scholar] [CrossRef]
- Chaudhari, R.; Vora, J.; López de Lacalle, L.; Khanna, S.; Patel, V.K.; Ayesta, I. Parametric optimization and effect of nano-graphene mixed dielectric fluid on performance of wire electrical discharge machining process of Ni55. 8Ti shape memory alloy. Materials 2021, 14, 2533. [Google Scholar] [CrossRef] [PubMed]
- Vora, J.; Khanna, S.; Chaudhari, R.; Patel, V.K.; Paneliya, S.; Pimenov, D.Y.; Giasin, K.; Prakash, C. Machining parameter optimization and experimental investigations of nano-graphene mixed electrical discharge machining of nitinol shape memory alloy. J. Mater. Res. Technol. 2022, 19, 653–668. [Google Scholar] [CrossRef]
- Ishfaq, K.; Maqsood, M.A.; Anwar, S.; Harris, M.; Alfaify, A.; Zia, A.W. EDM of Ti6Al4V under nano-graphene mixed dielectric: A detailed roughness analysis. Int. J. Adv. Manuf. Technol. 2022, 120, 7375–7388. [Google Scholar] [CrossRef]
- Mohammed, A.A.; Khodair, Z.T.; Khadom, A.A. Preparation and investigation of the structural properties of α-Al2O3 nanoparticles using the sol-gel method. Chem. Data Collect. 2020, 29, 100531. [Google Scholar] [CrossRef]
- Xavier, G.; Dave, B.; Khanna, S. Supercritical fluid extraction of bi & multi-layer graphene sheets from graphite by using exfoliation technique. AIP Conf. Proc. 2018, 1961, 030027. [Google Scholar]
- Ishfaq, K.; Maqsood, M.A.; Mahmood, M.A. Machining characteristics of various powder-based additives, dielectrics, and electrodes during EDM of micro-impressions: A comparative study. Int. J. Adv. Manuf. Technol. 2022, 123, 1521–1541. [Google Scholar] [CrossRef]
- Rao, R.; Patel, V. An elitist teaching-learning-based optimization algorithm for solving complex constrained optimization problems. Int. J. Ind. Eng. Comput. 2012, 3, 535–560. [Google Scholar] [CrossRef]
- Yu, X.; Hu, Z.; Wang, X.; Luo, W. Ranking teaching–learning-based optimization algorithm to estimate the parameters of solar models. Eng. Appl. Artif. Intell. 2023, 123, 106225. [Google Scholar] [CrossRef]
- Sahoo, R.; Debnath, T.; Patowari, P.K. Machinability characteristics of titanium diamond using EDM and its parametric optimization. Mater. Manuf. Process. 2023, 38, 78–88. [Google Scholar] [CrossRef]
- Al-Amin, M.; Abdul Rani, A.M.; Abdu Aliyu, A.A.; Abdul Razak, M.A.H.; Hastuty, S.; Bryant, M.G. Powder mixed-EDM for potential biomedical applications: A critical review. Mater. Manuf. Process. 2020, 35, 1789–1811. [Google Scholar] [CrossRef]
- Aggarwal, V.; Pruncu, C.I.; Singh, J.; Sharma, S.; Pimenov, D.Y. Empirical investigations during WEDM of Ni-27Cu-3.15 Al-2Fe-1.5 Mn based superalloy for high temperature corrosion resistance applications. Materials 2020, 13, 3470. [Google Scholar] [CrossRef] [PubMed]
- Goyal, A.; Pandey, A.; Rahman, H.U. Present and future prospective of shape memory alloys during machining by EDM/wire EDM process: A review. Sādhanā 2022, 47, 217. [Google Scholar] [CrossRef]
- Galati, M.; Antonioni, P.; Calignano, F.; Atzeni, E. Experimental Investigation on the Cutting of Additively Manufactured Ti6Al4V with Wire-EDM and the Analytical Modelling of Cutting Speed and Surface Roughness. J. Manuf. Mater. Process. 2023, 7, 69. [Google Scholar] [CrossRef]
- Pratiwi, D.K.; Arifin, A.; Mardhi, A. Investigation of Welding Parameters of Dissimilar Weld of SS316 and ASTM A36 Joint Using a Grey-Based Taguchi Optimization Approach. J. Manuf. Mater. Process. 2023, 7, 39. [Google Scholar] [CrossRef]
- Chaudhari, R.; Vora, J.J.; Patel, V.; López de Lacalle, L.; Parikh, D. Surface analysis of wire-electrical-discharge-machining-processed shape-memory alloys. Materials 2020, 13, 530. [Google Scholar] [CrossRef]
- Bisaria, H.; Shandilya, P. Processing of curved profiles on Ni-rich nickel–titanium shape memory alloy by WEDM. Mater. Manuf. Process. 2019, 34, 1333–1341. [Google Scholar] [CrossRef]
- Dzionk, S.; Siemiątkowski, M.S. Studying the effect of working conditions on WEDM machining performance of super alloy Inconel 617. Machines 2020, 8, 54. [Google Scholar] [CrossRef]
- Srivastava, S.; Vishnoi, M.; Gangadhar, M.T.; Kukshal, V. An insight on Powder Mixed Electric Discharge Machining: A state of the art review. Proc. Inst. Mech. Eng. Part B J. Eng. Manuf. 2023, 237, 657–690. [Google Scholar] [CrossRef]
- Thakur, S.S.; Patel, B.; Upadhyay, R.K.; Bagal, D.K.; Barua, A. Machining characteristics of metal matrix composite in powder-mixed electrical discharge machining–A review. Aust. J. Mech. Eng. 2023, 21, 1755–1777. [Google Scholar] [CrossRef]
- Singh, S.; Patel, B.; Upadhyay, R.K.; Singh, N.K. Improvement of process performance of powder mixed electrical discharge machining by optimisation-A Review. Adv. Mater. Process. Technol. 2022, 8, 3074–3104. [Google Scholar] [CrossRef]
- Gul, I.A.; Abdul-Rani, A.M.; Al-Amin, M.; Garba, E. Elucidating Powder-Mixed Electric Discharge Machining Process, Applicability, Trends and Futuristic Perspectives. Machines 2023, 11, 381. [Google Scholar] [CrossRef]
- Sharma, R.; Singh, J. Effect of powder mixed electrical discharge machining (PMEDM) on difficult-to-machine materials–a systematic literature review. J. Manuf. Sci. Prod. 2014, 14, 233–255. [Google Scholar] [CrossRef]
- Razak, M.; Rani, A.; Saad, N.; Littlefair, G.; Aliyu, A. Controlling corrosion rate of Magnesium alloy using powder mixed electrical discharge machining. IOP Conf. Ser. Mater. Sci. Eng. 2018, 344, 012010. [Google Scholar] [CrossRef]
- Abdul-Rani, A.; Nanimina, A.; Ginta, T.; Razak, M. Machined surface quality in nano aluminum mixed electrical discharge machining. Procedia Manuf. 2017, 7, 510–517. [Google Scholar] [CrossRef]
- Le, V.-T. New insights into the surface features of SKD61 steel at heat-treated and non-heat-treated states as processed by powder-mixed EDM. Mater. Lett. 2023, 352, 135199. [Google Scholar] [CrossRef]
- Al-Amin, M.; Abdul-Rani, A.M.; Danish, M.; Thompson, H.M.; Aliyu, A.A.A.; Hastuty, S.; Zohura, F.T.; Bryant, M.G.; Rubaiee, S.; Rao, T. Assessment of PM-EDM cycle factors influence on machining responses and surface properties of biomaterials: A comprehensive review. Precis. Eng. 2020, 66, 531–549. [Google Scholar] [CrossRef]
- Hourmand, M.; Sarhan, A.A.; Farahany, S.; Sayuti, M. Microstructure characterization and maximization of the material removal rate in nano-powder mixed EDM of Al-Mg 2 Si metal matrix composite—ANFIS and RSM approaches. Int. J. Adv. Manuf. Technol. 2019, 101, 2723–2737. [Google Scholar] [CrossRef]
- Gosai, N.D.; Joshi, A.Y. Experimental investigation and optimization of process parameters used in the silicon powder mixed electro discharge machining of Ti-6Al-4V alloy using response surface methodology. J. Manuf. Sci. Prod. 2016, 16, 21–32. [Google Scholar] [CrossRef]


| Machining Factors | Levels/Values |
|---|---|
| Pulse-on duration (µs) | 1, 3, 5 |
| Pulse-off time (µs) | 6, 16, 26 |
| Current (A) | 20, 60, 100 |
| Cutting depth | 2 mm |
| Spark gap | 0.01 mm |
| Nanopowder | Al2O3, and nano-graphene |
| Run Order | Ton (µs) | Toff (µs) | Current (A) | MRR Trial 1 | MRR Trial 2 | MRR Trial 3 | Avg. MRR (mm3/s) | SR Trial 1 | SR Trial 2 | SR Trial 3 | Avg. SR (µm) |
|---|---|---|---|---|---|---|---|---|---|---|---|
| 1 | 2 | 3 | 10 | 7.4297 | 7.5738 | 7.2601 | 7.4212 | 6.63 | 6.12 | 6.34 | 6.36 |
| 2 | 2 | 6 | 20 | 6.5181 | 6.5752 | 6.5501 | 6.5478 | 5.09 | 5.24 | 5.31 | 5.21 |
| 3 | 2 | 9 | 30 | 5.7386 | 5.8801 | 5.8105 | 5.8097 | 4.28 | 4.29 | 4.47 | 4.35 |
| 4 | 4 | 3 | 20 | 9.8459 | 9.7601 | 9.5341 | 9.7134 | 6.26 | 6.43 | 6.27 | 6.32 |
| 5 | 4 | 6 | 30 | 8.1933 | 8.2927 | 8.0167 | 8.1677 | 6.16 | 5.89 | 6.13 | 6.06 |
| 6 | 4 | 9 | 10 | 3.6601 | 3.4211 | 3.6021 | 3.5611 | 5.38 | 5.48 | 5.49 | 5.45 |
| 7 | 6 | 3 | 30 | 10.9398 | 10.1099 | 10.9642 | 10.6713 | 7.33 | 7.67 | 7.41 | 7.47 |
| 8 | 6 | 6 | 10 | 5.0007 | 5.0607 | 5.1073 | 5.0562 | 6.73 | 6.75 | 6.94 | 6.81 |
| 9 | 6 | 9 | 20 | 4.8894 | 4.9702 | 4.9106 | 4.9234 | 5.96 | 5.6 | 5.97 | 5.84 |
| Source | Adj. SS | F | p | % Contribution |
|---|---|---|---|---|
| Regression | 42.9104 | 82.39 | 0.000 | Significant |
| Ton | 0.1268 | 0.73 | 0.432 | Insignificant |
| Toff | 30.4277 | 175.26 | 0.000 | Significant |
| Current | 12.3559 | 71.17 | 0.000 | Significant |
| Error | 0.8681 | |||
| Total | 43.7784 |
| Source | Adj. SS | F | p | Significance |
|---|---|---|---|---|
| Regression | 6.4212 | 35.19 | 0.001 | Significant |
| Ton | 2.9400 | 48.33 | 0.001 | Significant |
| Toff | 3.3900 | 55.73 | 0.001 | Significant |
| Current | 0.0912 | 1.50 | 0.275 | Insignificant |
| Error | 0.3041 | |||
| Total | 6.7254 |
| Condition | EDM Variables | Output Response | |||
|---|---|---|---|---|---|
| Toff (µs) | Toff (µs) | Current (A) | MRR (mm3/s) | SR (µm) | |
| Maximum MRR | 6 | 3 | 30 | 10.7074 | 7.32 |
| Minimum SR | 2 | 9 | 30 | 5.9130 | 4.41 |
| Sr. No. | Ton (µs) | Toff (µs) | Current (A) | MRR (mm3/s) | SR (µm) |
|---|---|---|---|---|---|
| 1 | 6 | 3 | 30 | 10.7074 | 7.32 |
| 2 | 5 | 3 | 30 | 10.6347 | 6.97 |
| 3 | 4 | 3 | 30 | 10.5620 | 6.62 |
| 4 | 3 | 3 | 30 | 10.4893 | 6.27 |
| 5 | 2 | 3 | 30 | 10.4166 | 5.92 |
| 6 | 2 | 4 | 30 | 9.6660 | 5.66 |
| 7 | 2 | 5 | 30 | 8.9154 | 5.41 |
| 8 | 2 | 6 | 30 | 8.1648 | 5.16 |
| 9 | 2 | 7 | 30 | 7.4142 | 4.91 |
| 10 | 2 | 8 | 30 | 6.6636 | 4.66 |
| 11 | 2 | 9 | 30 | 5.9130 | 4.41 |
| Experimental Condition | Input Factors | Output Responses |
|---|---|---|
| Conventional EDM | Ton = 2 µs Toff = 5 µs Current = 30 A | MRR = 8.9811 mm3/s SR = 5.05 µm |
| Aluminum oxide (Al2O3) nanopowder | Ton = 2 µs Toff = 5 µs Current = 30 A Alumina nanopowder = 1 g/L | MRR = 13.8568 mm3/s SR = 4.27 µm |
| Nano-graphene powder | Ton = 2 µs Toff = 5 µs Current = 30 A Nano-graphene powder = 1 g/L | MRR = 16.5732 mm3/s SR = 3.68 µm |
Disclaimer/Publisher’s Note: The statements, opinions and data contained in all publications are solely those of the individual author(s) and contributor(s) and not of MDPI and/or the editor(s). MDPI and/or the editor(s) disclaim responsibility for any injury to people or property resulting from any ideas, methods, instructions or products referred to in the content. |
© 2023 by the authors. Licensee MDPI, Basel, Switzerland. This article is an open access article distributed under the terms and conditions of the Creative Commons Attribution (CC BY) license (https://creativecommons.org/licenses/by/4.0/).
Share and Cite
Chaudhari, R.; Khanna, S.; Patel, V.K.; Vora, J.; Plaza, S.; Lacalle, L.N.L.d. Experimental Investigations of Using Aluminum Oxide (Al2O3) and Nano-Graphene Powder in the Electrical Discharge Machining of Titanium Alloy. Micromachines 2023, 14, 2247. https://doi.org/10.3390/mi14122247
Chaudhari R, Khanna S, Patel VK, Vora J, Plaza S, Lacalle LNLd. Experimental Investigations of Using Aluminum Oxide (Al2O3) and Nano-Graphene Powder in the Electrical Discharge Machining of Titanium Alloy. Micromachines. 2023; 14(12):2247. https://doi.org/10.3390/mi14122247
Chicago/Turabian StyleChaudhari, Rakesh, Sakshum Khanna, Vivek K. Patel, Jay Vora, Soraya Plaza, and Luis Norberto López de Lacalle. 2023. "Experimental Investigations of Using Aluminum Oxide (Al2O3) and Nano-Graphene Powder in the Electrical Discharge Machining of Titanium Alloy" Micromachines 14, no. 12: 2247. https://doi.org/10.3390/mi14122247