Article

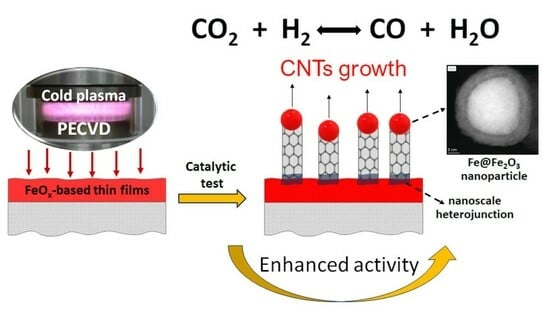
The Role of Carbon Nanotube Deposit in Catalytic Activity of FeOX-Based PECVD Thin Films Tested in RWGS Reaction

by
Bartosz Panek
1,
Hanna Kierzkowska-Pawlak
1,
Paweł Uznański
2,
Stefan Nagy
3,
Veronika Nagy-Trembošová
3 and
Jacek Tyczkowski
1,*
1
Department of Molecular Engineering, Faculty of Process and Environmental Engineering, Lodz University of Technology, Wolczanska 213, 93-005 Lodz, Poland
2
Centre of Molecular and Macromolecular Studies, Polish Academy of Sciences, Sienkiewicza 112, 90-363 Lodz, Poland
3
Institute of Materials and Machine Mechanics, Slovak Academy of Sciences, Dúbravská cesta 9, 845-11 Bratislava, Slovakia
*
Author to whom correspondence should be addressed.
Catalysts 2023, 13(9), 1302; https://doi.org/10.3390/catal13091302
Submission received: 19 August 2023 / Revised: 9 September 2023 / Accepted: 14 September 2023 / Published: 17 September 2023

Abstract

:
While the reverse water-gas shift (RWGS) reaction holds great promise as a method of converting CO2 to CO and subsequently into valuable fuels, achieving its commercial viability requires the development of highly efficient, selective, durable, and low-cost catalysts. Recently, thin-film nanocatalysts produced through plasma deposition (PECVD) have garnered significant attention in this domain. Among them, FeOx-based catalytic films deposited using Fe(CO)5 as a precursor, under reduced pressure (4–5 Pa) and a 13.56 MHz glow discharge, have demonstrated particular interest. Our study shows that by appropriately tuning the parameters of the plasma deposition process, it is feasible to generate nanocatalyst films exhibiting exceptional CO2 conversion (38% at 673 K) and CO selectivity (97%). Moreover, the study has revealed the formation of a carbon deposit containing carbon nanotubes (CNTs) during the RWGS reaction, significantly increasing the catalytic activity of the films. Through an analysis involving X-ray photoelectron spectroscopy (XPS), X-ray diffraction (XRD), and electron microscopy techniques (SEM and HRTEM), we have determined that CNTs not only serve as carriers for highly catalytically active Fe nanoparticles but also create nanoscale heterojunctions (p-n) with Fe2O3 nanoparticles, thereby enhancing their catalytic effect. This paper attempts to elucidate the differences and changes in the surface structure of FeOx-based films dictating the catalytic activity, which stems from both the conditions of plasma deposition and the environmental impact during the catalytic process.

Graphical Abstract

1. Introduction

Undoubtedly, thin-film nanocatalysts produced through cold plasma deposition (PECVD) have been attracting increasing interest due to their unique properties and wide range of applications in various catalytic structured reactors [1,2,3,4]. Building on our previous research on FeOx-based PECVD thin-film catalysts tested for the CO2 hydrogenation process [5,6], our current focus is investigating the impact of carbon deposits on their catalytic activity, which turned out to be formed as carbon nanotubes during this process.
Beyond the imperative to significantly reduce atmospheric CO2 levels, this substrate offers a valuable source of pristine carbon that can be utilized for large-scale production of various important chemicals, including liquid fuels. It is, therefore, not surprising that substantial efforts have recently been dedicated to developing existing and exploring new approaches for CO2 utilization. Among them, the reverse water-gas shift (RWGS) reaction is particularly interesting [7,8]:
CO2 + H2 → CO + H2O       ΔH0298 = 42.1 kJ/mol
This mildly endothermic and competitive reaction with CO2 methanation (Sabatier reaction) holds great potential and is considered an essential intermediate stage in various key CO2 hydrogenation reactions [9], and it also serves as a route to produce syngas compatible with existing industrial infrastructure [10]. However, although the RWGS reaction shows immense promise, achieving commercial viability and efficiency still necessitates the development of highly efficient, selective, durable, and low-cost catalysts [11,12].
A lot of attention in this area is devoted to iron-based catalysts, which have been intensively studied for a long time, not only in the RWGS reaction [13] but also in the Fischer-Tropsch (FT) synthesis [14,15] and the water-gas shift (WGS) reaction [16]. However, in all these cases, there is still an intense debate about the mechanisms of these processes and the role that the individual phases of iron-based catalysts, such as oxides, carbides, and elemental metal (Fe), play in them [17,18]. Furthermore, the problem is complicated by the complex transformation between these phases, which occurs during the catalytic processes. Nevertheless, based on current findings, iron oxides are frequently considered to be notably active phases of the RWGS reaction, where oxygen vacancies act as catalytic sites for CO2 activation and CO release [19]. On the other hand, there are also reports indicating metallic iron nanoparticles as the active phase in this reaction [20].
Another challenge in finding suitable catalysts for the RWGS process is the already well-known accumulation of carbonaceous deposits (also called coke) on their surfaces during catalytic reactions [21,22]. In the vast majority of cases, such a deposit deactivates the catalyst by blocking pores of various sizes or directly blocking active sites. In the RWGS process in the relatively lower temperature range (<873 K), two reactions of carbon deposit formation should be considered [23]:
2CO → C + CO2,
CO + H2 → C + H2O
The first is the Boudouard reaction, often attributed to the formation of carbon deposits on iron oxides in the presence of carbon monoxide [24]. In the second case, it is assumed that the initial step is the adsorption of CO and H2 on the catalyst surface. H2 molecules directly dissociate, and hydrogen atoms can assist in the dissociation of CO and the formation of, among other species, a carbon deposit [25].
The nature of carbonaceous deposits formed on the catalyst depends on the catalyst’s composition, textural properties, structure, feed composition, and reaction conditions; they can take various forms, such as amorphous and graphitic carbon islands on the catalyst surface, encapsulating layers, carbon filaments, whiskers, nanofibers, and even creating chemical connections as carbides [26]. A special place among them is occupied by carbon nanotubes (CNTs), which, unlike most other forms of carbon deposit, are able to enhance catalytic activity [27].
The ability to form carbon nanotubes on fine Fe particles or its compounds (like iron oxides or carbides) as effective catalysts for this process was established quite a long time ago in the reactions of thermal decomposition of carbon monoxide or hydrocarbons [28], before the concept of carbon nanotubes was known. They were called filamentous carbons at that time. Interestingly, the formation of carbon nanotubes with the participation of magnetite (Fe3O4) was also found in interplanetary space by studying micrometeorites. It is assumed that carbon was formed there in the catalytic reaction of CO disproportionation (Equation (2)), i.e., analogous to the one observed during the processes of Fischer-Tropsch and RWGS (Equation (1)) [29].
In some cases, studies of the catalytic properties of nanohybrids formed from FeOx and CNTs revealed better catalytic activity than that of pure FeOx. This has been shown, for example, in the case of Fe2O3/CNT (then reduced to Fe/CNT, where Fe nanoparticles were inside or outside of carbon nanotubes) tested in the Fischer-Tropsch reaction [30], Fe3O4/CNT nanohybrids used in catalytic ozonation [31], or α-Fe2O3/CNT in photo-catalytic oxidation [32]. It should be emphasized, however, that all these nanohybrids were produced in a planned manner and were not the result of uncontrolled carbon deposit formation.
Although the explanation of the effect of CNTs on the improvement of catalytic activity is still debatable, some interesting suggestions point to the possible influence of electronic interaction between the particles of the catalytic material and the walls of the CNTs, which may entail the transfer of electrons and, consequently, facilitate the activation of the reaction substrates [33].
In this work, we also demonstrate the improving effect of the deposition of carbon nanotubes formed during the RWGS reaction (Equation (1)) on the catalytic activity of the FeOx-based PECVD thin-film catalyst in this reaction. The paper attempts to explain the mechanism of this phenomenon.

2. Results and Discussion

2.1. General Characteristics of Catalytic Films

The studies were carried out on catalytic FeOx-based thin films produced by cold plasma deposition (PECVD) from Fe(CO)5 as a precursor. Preliminary catalytic tests performed for the CO2 hydrogenation showed that the catalytic activity of the films was significantly affected by the parameters of the plasma deposition process and, above all, by the partial pressure of the precursor, which led to the distinction of two basic groups of these films—with low and high catalytic activity. Representatives for each of these groups were selected for further analysis, namely two nanocatalysts produced at different partial pressures of Fe(CO)5: 0.1 Pa (low activity) and 0.3 Pa (high activity), while maintaining other parameters constant, such as discharge power P = 80 W, partial pressure of argon (carrier gas) pAr = 4.0 Pa, and deposition temperature T = 298 K. Before the catalytic tests, the produced films were calcined at 673 K in an argon atmosphere. In the next part of the work, the films produced at the precursor partial pressure of 0.1 Pa will be called 0.1FeOx, and those obtained at the pressure of 0.3 Pa will be called 0.3FeOx. Their thicknesses were about 200 nm and 650 nm for 0.1FeOx and 0.3FeOx, respectively.
Investigations of the basic elemental composition of the film surfaces performed by XPS spectroscopy (Table 1) exhibit a significant similarity between both types of fresh films (as prepared, before their use in the catalytic tests). A deeper look at the molecular structure, however, revealed quite significant differences. Figure 1a,b shows the core level of the Fe 3p spectrum for both types of films. The spectra were numerically deconvoluted, and the calculated bands were assigned to appropriate oxidation states of Fe [6,34]. On this basis, it can be concluded that while metallic iron (Fe0) is present in the 0.3FeOx film, it is completely absent in the 0.1FeOx film. In turn, the presence of Fe2+ and Fe3+ in both films indicates the possibility of the existence of iron oxides, such as FeO, Fe2O3, and Fe3O4. However, in the case of 0.1FeOx, Fe2O3 (Fe3+) is dominant on the surface, while all three of these oxides may be present on the surface of 0.3FeOx, although the Fe3+/Fe2+ content ratio = 2.02 may indicate Fe3O4 as the main component.
To supplement the above studies, XRD measurements were performed. Raw XRD spectra (Supplement Figure S1) in both films reveal the likely presence of an amorphous fraction while also containing clear nanocrystalline structures. Figure 2 shows “normalized” XRD patterns by interpreting individual diffraction peaks based on the ICDD PDF database [35], using the following ICDD-PDF cards: FeO (card no. 01-089-0687), Fe3O4 (card no. 01-072-2303), and Fe (card no. 04-002-3692). However, it should be remembered that the XRD results refer to the entire thickness of the film, while XPS covers only its very thin surface layer (5–10 nm), the structure of which may differ from the bulk structure. This is the case with 0.1FeOx, where XRD (Figure 2a) indicates the presence of Fe3O4 (approx. 25 nm) and FeO (approx. 10 nm) nanocrystallites in the film, while XPS on the film surface basically shows only the presence of iron at the oxidation state (Fe3+). However, a common result for both measurement techniques is the complete lack of metallic iron (Fe0) in the 0.1FeOx film. In turn, in the 0.3FeOx film, the XRD pattern (Figure 2b) indicates the presence of metallic iron nanocrystallites with a cubic structure of bcc (approx. 23 nm) and Fe3O4 (approx. 25 nm), confirming in this case compliance with the XPS result.

2.2. Catalytic Activity
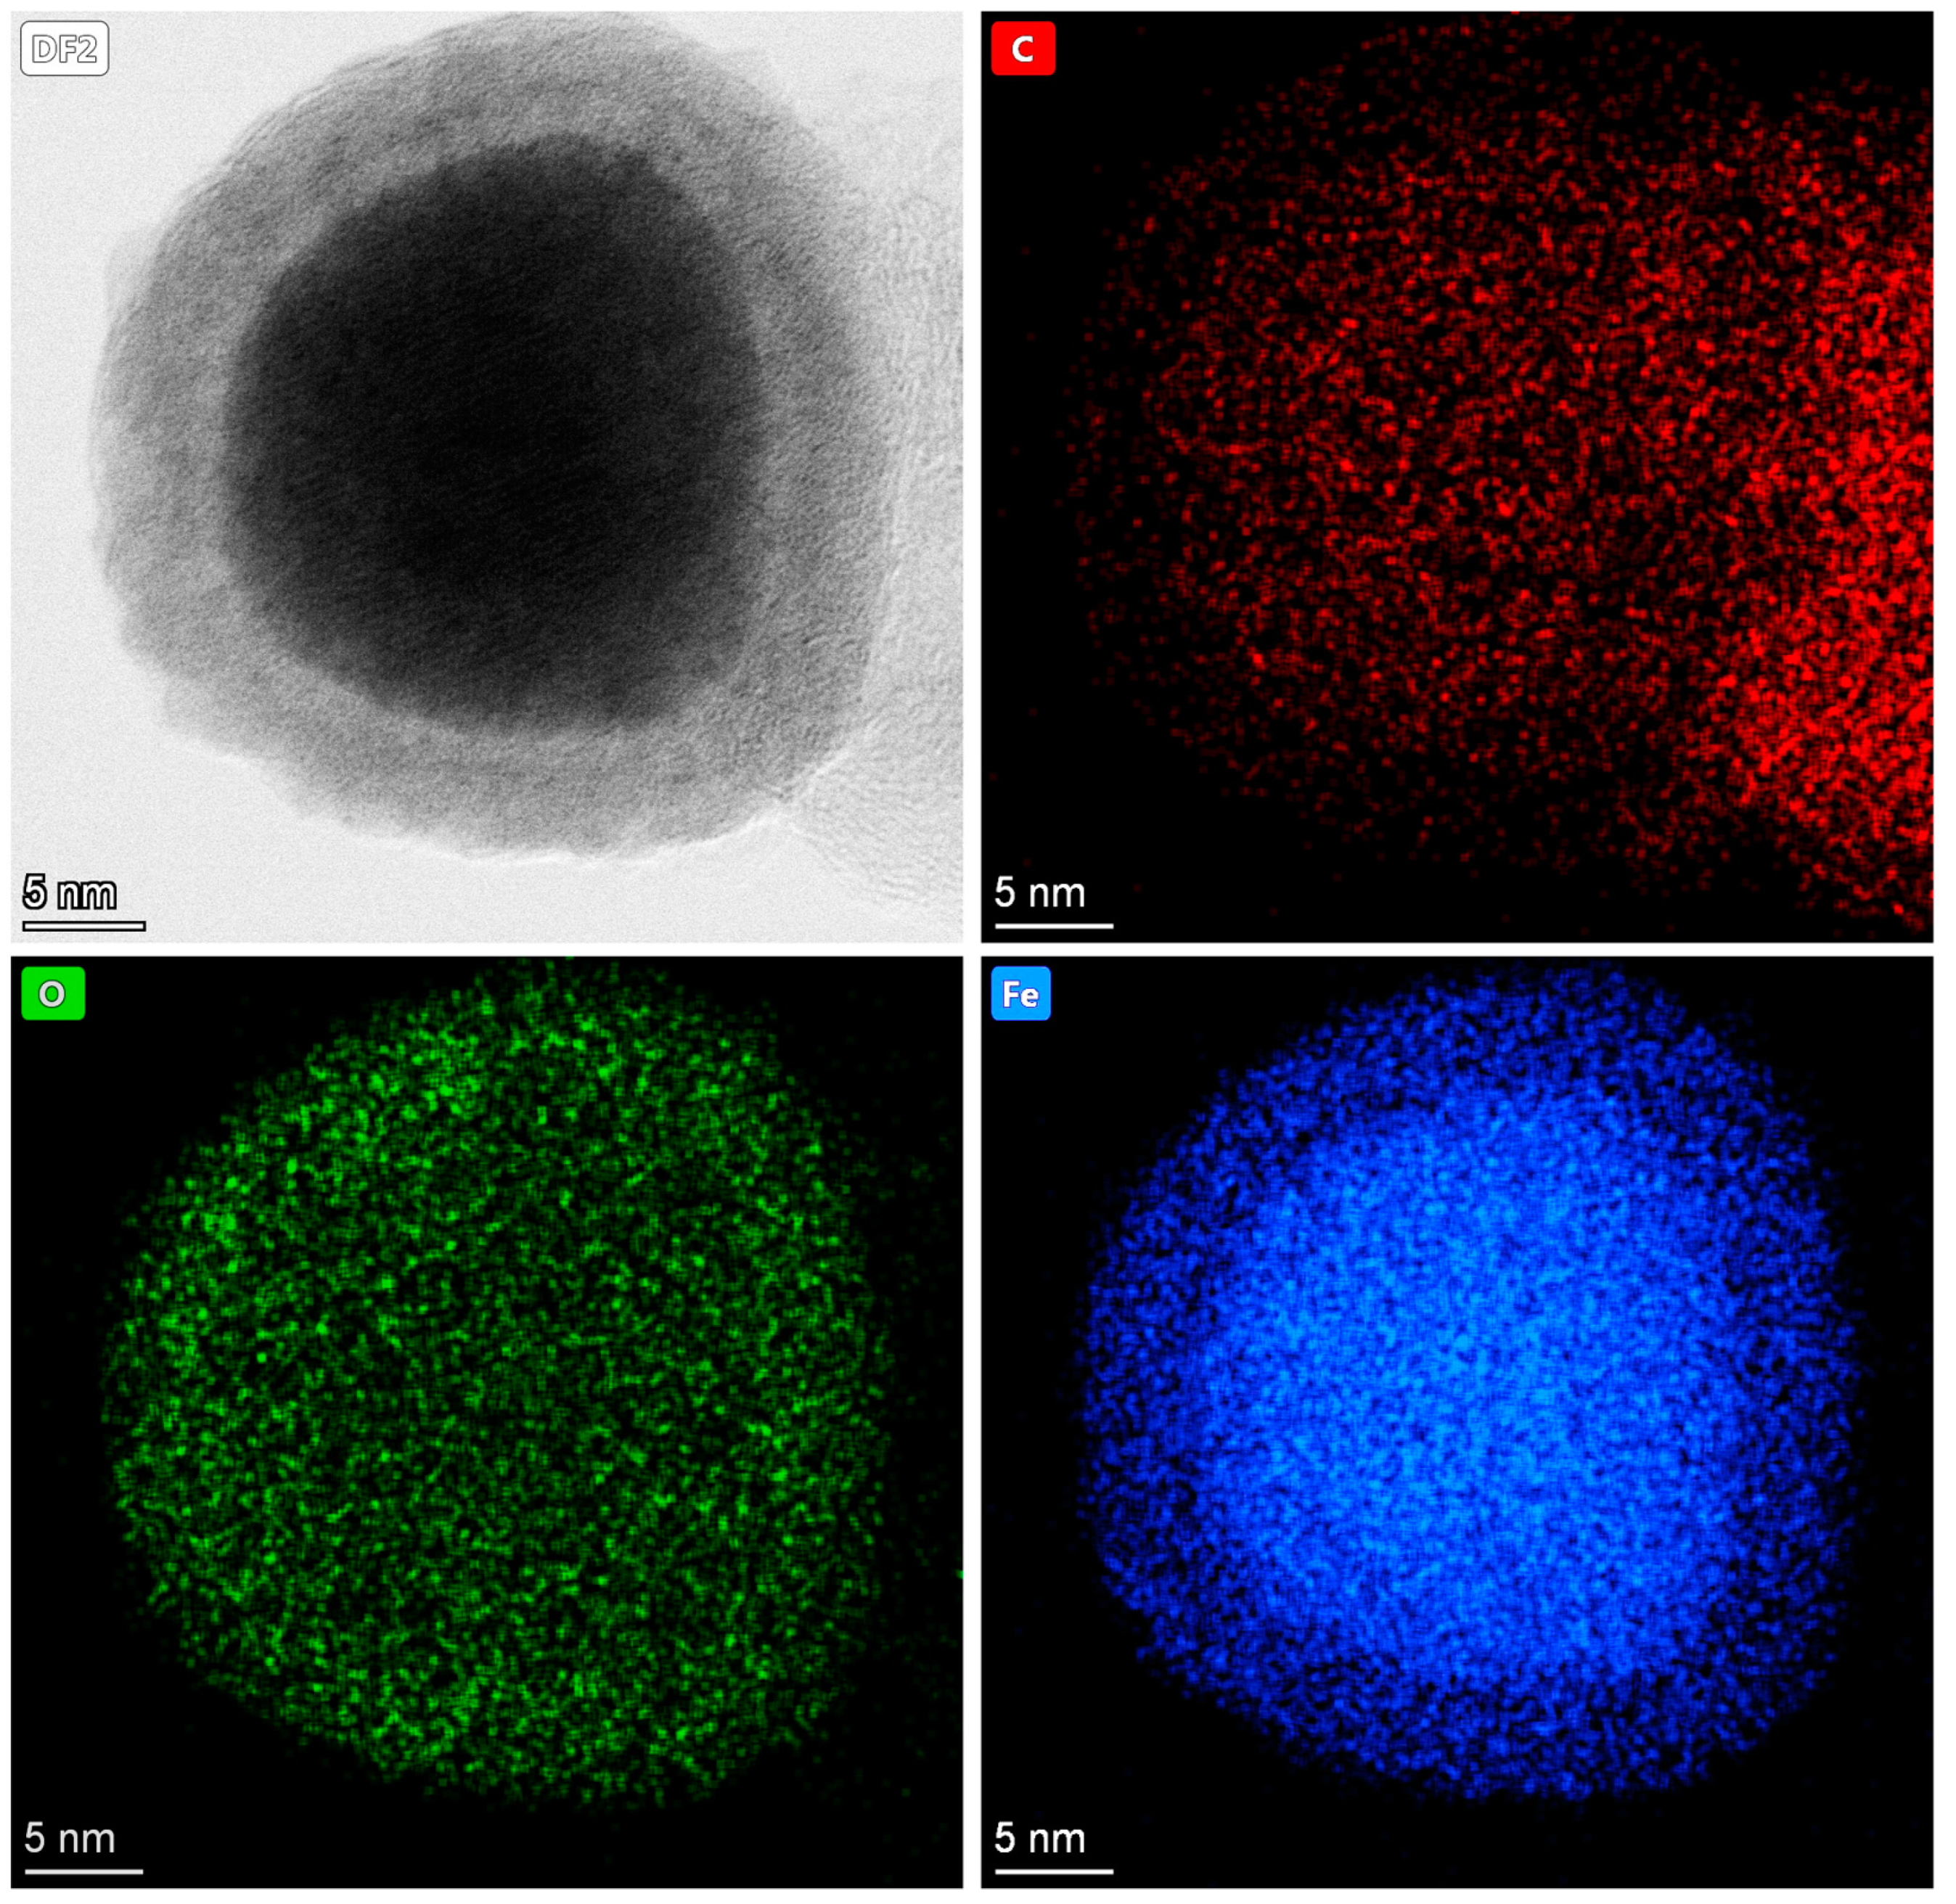
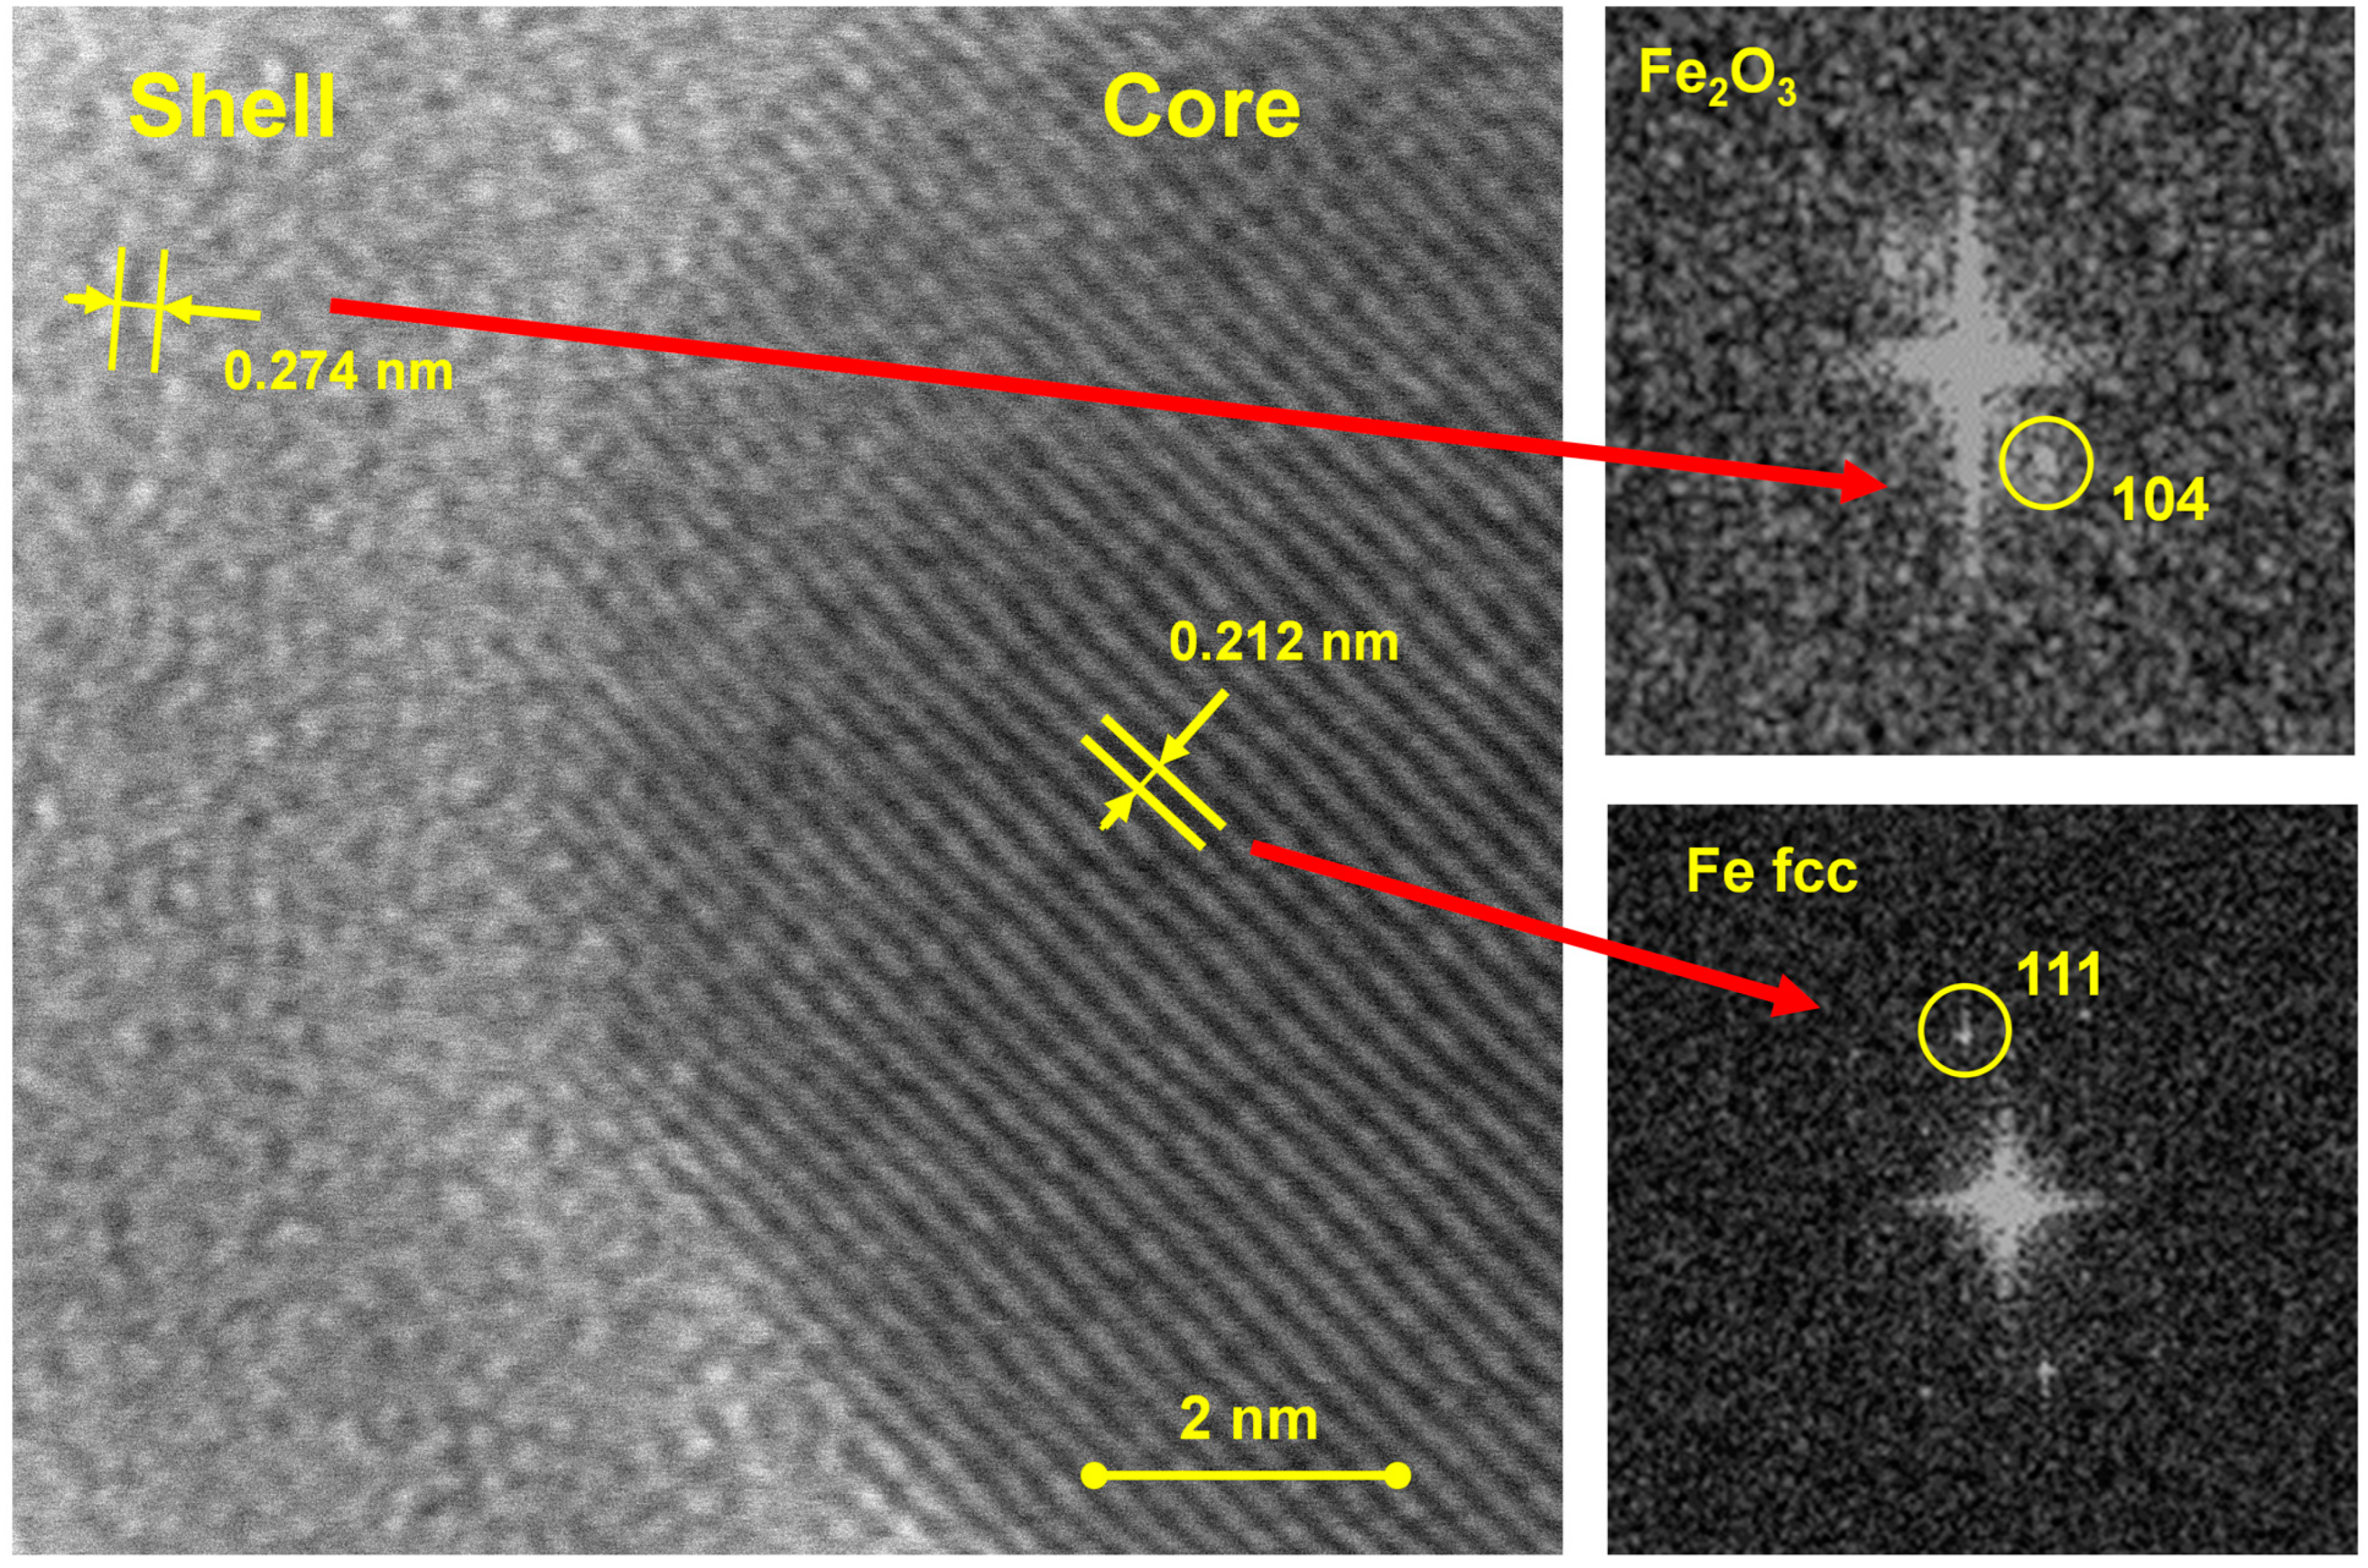
The catalytic tests were carried out for the CO2 hydrogenation process (in the reaction mixture, H2/CO2 = 4:1). Figure 3 shows the dependencies of CO2 conversion and selectivity to CO and CH4 as a function of the catalytic process temperature for the two types of nanocatalysts tested.
As can be seen, the CO2 hydrogenation reaction proceeds much more efficiently on the 0.3FeOx than on the 0.1FeOx film. The next step in the analysis of the catalytic process was to determine the conversion as a function of time (time-on-stream). Figure 4 shows such dependencies for both nanocatalysts after they reach (in the reaction mixture) the temperature of 673 K. In the case of 0.3FeOx, a clear increase in CO2 conversion is visible over time, until reaching a high stable value after about 4–6 h (Test A), close to the equilibrium value (Supplement Material Figure S2 which under the reaction conditions is 41.5%. Meanwhile, for the 0.1FeOx film, such an induction period is not observed (Test B), and the conversion remains at a very low level.
Interestingly, the end of the catalytic process carried out on 0.3FeOx after 20 h (Test A), cooling the catalyst to room temperature in the reaction mixture, leaving it in an air atmosphere for 12 h, and then carrying out another catalytic test in the same way as the first test, reveals a similar increase in conversion over time after reaching the temperature of 673 K (Test C). In the next, third, analogous test, we obtain a similar, as in the previous, course of the CO2 conversion curve versus time (Test D). This type of behavior indicates evident periodic changes in the molecular structure of the 0.3FeOx nanocatalyst, which may result from changes in temperature as well as the environment in which the catalyst is located.
To obtain more complete information about changes in the structure of 0.3FeOx, two further catalytic tests were carried out. In the first of them, the catalyst, after the previously performed test (Test A) and prepared as for Test C, was heated from room temperature to 673 K, but not in the reaction mixture and only in a helium atmosphere. After 2 h of keeping the catalyst at the final temperature, the reaction mixture (H2/CO2 = 4:1) was introduced. The time dependence of the CO2 conversion is shown in Figure 4 (Test E). The observed period of the conversion increase is much longer in this case (approx. 8–10 h) than in the tests where the catalyst was heated to 673 K immediately in the reaction mixture (Tests A, C, and D). This difference in the induction period is indicated by the dotted lines in Figure 4.
The second test was carried out analogously to the first one, except that the heating and holding at a temperature of 673 K for 2 h were carried out in a hydrogen atmosphere. The curve (Test F) in Figure 4 illustrates the dependence of the CO2 conversion on time, which in this case is stable and reaches a high value from the beginning (as in Tests A, C, and D). The tests performed indicate that the reducing environment (hydrogen) plays an important role in the catalytic activity of 0.3FeOx. The reduced structure of the catalyst is oxidized upon contact with air and needs to be reduced again to achieve a stabilized CO2 conversion value.
An interesting observation was provided by studies performed using scanning electron microscopy (SEM). Figure 5 shows SEM images of the surface of the 0.1FeOx and 0.3FeOx as-prepared and spent catalysts (after Tests B and A in Figure 4, respectively). In the case of 0.3FeOx, unlike 0.1FeOx, a fine moss-like deposit appears on the catalyst surface after the catalytic test and persists during subsequent tests. However, this deposit can be removed (at least partially) by blowing it off with compressed air. A stream of synthetic air at a pressure of 0.35 MPa for 3 min was used. The elimination of the deposit causes a drastic, irreversible change in the catalytic activity of 0.3FeOx, which is shown by the curve of CO2 conversion versus time at 673 K (Test G, carried out in the same way as Test A). Performing further catalytic tests gives a very similar result. SEM observations also do not reveal the presence of a moss-like deposit in these cases.
The composition of the mixture consisting of substrates (CO2 and H2) and products (CO, H2O, and a small amount of CH4) suggests with high probability that the emerging deposit is made of carbon. This is confirmed by XPS investigations carried out on 0.1FeOx and 0.3FeOx films after catalytic Tests B and A, respectively. Table 1 shows the elemental compositions of the surface of these films, which, compared with the composition of the films before the catalytic process, indicates a drastic increase in the carbon content on the 0.3FeOx film and practically no change in the composition for the 0.1FeOx film. The core-level analysis of the Fe 3p spectrum also shows no significant differences for the 0.1FeOx film before and after the catalytic test (Figure 1a,c). Similarly, no significant differences in the Fe 3p spectrum, apart from signal reduction and noise increase caused by a significant increase in carbon content, are visible for the 0.3FeOx film before and after the catalytic test (Figure 1b,d). Changes, however, occur after removing the superficial moss-like layer of carbon deposit with compressed air (as was achieved before the catalytic Test G), where we do not now record the presence of metallic iron (Figure 1e). Analysis of the elemental composition, however, indicates that a significant part of the carbon deposit still remains on the surface (Table 1).
Attention should also be paid to the location of the maximum of the Fe3+ band, which in the 0.3FeOx film is shifted by about 0.38 eV towards the higher binding energy after the catalytic process, while in the 0.1FeOx film, it remains practically unchanged. This effect will be discussed in Section 2.4.

2.3. HRTEM Analysis

The finding of the formation of a carbon deposit on the 0.3FeOx films in the catalytic process and its moss-like structure shown in the SEM micrographs (Figure 5) suggests the possibility of building this deposit from carbon nanotubes. To delve deeper into the structure of the deposit, studies were carried out using high-resolution transmission electron microscopy (HRTEM).
Indeed, HRTEM micrographs of the moss-like structure taken from the surface of the 0.3FeOx film confirmed the presence of multi-walled carbon nanotubes (CNTs) formed during the CO2 hydrogenation process (Figure 6).
As can be seen, the nanotubes are accompanied by nanoparticles with an average size of about 20–35 nm, the location of which proves their participation in the formation of CNTs and indicates the tip-growth mechanism. Nano-EDX measurements allowed for a more precise determination of the nature of the nanoparticles. Figure 7 shows the atomic intensity maps of C, Fe, and O for a typical nanoparticle located on top of the nanotube. It is easy to see that the nanoparticles are composed of an iron-rich core and an oxygen-rich shell (about 5 nm thick). A more detailed analysis of these results based on the atomic intensity profile across the diameter of the nanoparticle (Supplement Figure S3) indicates that the core is composed of pure iron, while the shell is composed of iron oxide, most likely Fe2O3.
The above conclusions are confirmed by the analysis of the crystallographic structure of the nanoparticles (Figure 8). The clearly visible interplanar spacing in the core of the nanoparticle is 0.211 nm, which is attributed to the plane (111) in the Fe cubic (fcc) structure. In contrast to the core, the shell shows a much more amorphous structure. However, small, ordered areas composed of several planes can be found there. The interplanar spacing determined for them is 0.274 nm, which can be attributed to the plane (104) in the rhombohedral Fe2O3, thus the previously suggested shell structure.
Crystallographic structure analysis was also performed for CNTs. Figure 9 shows an exemplary micrograph of a nanotube along with a fast Fourier transformation (FFT) diffraction pattern that reveals two main typical reflections corresponding to crystallographic planes (002) and (100), characteristic of CNTs [36].

2.4. What Is the Role of Carbon Nanotubes in the Catalytic Activity?—A Proposed Explanation

There are two key findings to build upon in starting this discussion. Firstly, the much better catalytic activity of 0.3FeOx films, on which the CNT deposit is formed, than of 0.1FeOx films, on which such a deposit is not formed (Figure 4, tests A, B, C, and D). Secondly, the significant decrease in catalytic activity after removing part of the CNT deposit with associated iron nanoparticles from the surface of the 0.3FeOx films, although still higher than for the 0.1FeOx films. Both of these results clearly indicate the positive role of the CNT deposit in the RWGS reaction on thin-film FeOx-based nanocatalysts deposited by PECVD.
Comparing the CO2 conversion for fresh 0.3FeOx and 0.1FeOx films (Figure 4, Test A and Test B, respectively) and the molecular structure of their surfaces (Figure 1a,b), it can be assumed that a much higher conversion value for the 0.3FeOx films is associated with the presence of metallic iron nanoparticles, which are the active phase on the surface of such a film. As a result of the CO2 hydrogenation process, CO is produced in an amount enabling the formation of a carbon deposit (as a result of the reactions presented by Equation (2) or Equation (3)), which is deposited in the form of CNTs using Fe nanoparticles, widely known as the archetypal material that catalyzes the efficient growth of CNTs [37,38]. Growing nanotubes, in accordance with the tip-growth mechanism, lift up Fe nanoparticles, where they continue to act catalytically in the CO2 hydrogenation process. It is worth noting that, although a difference was observed in the crystallographic structure of Fe nanoparticles between those carried by nanotubes, for which the structure of fcc was determined in HRTEM studies (Section 2.3), and those present in the fresh film, whose structure was defined by XRD to be bcc (Section 2.1), it is not known at the present stage of research whether this affects the catalytic activity. It is also difficult to determine whether the change in the structure results from changes occurring during the transfer of Fe nanoparticles by CNTs in the catalytic process, which is not completely excluded [39], or whether it results from the difference between the surface and bulk structure of the catalytic film that was fixed in the plasma deposition process, which is also probable, for example in the light of XPS and XRD investigations for the 0.1FeOx film, where the difference between the surface and bulk structure is clearly visible (Section 2.1).
If the 0.3FeOx film comes into contact with air before initiating the catalytic test (e.g., Tests A, C, and D (Figure 4)), the surface of the Fe nanoparticles oxidizes, forming a Fe2O3 shell with a thickness of approx. 5 nm (Figure 7). Upon starting the test, a certain induction period is required to achieve full catalytic activity. This effect is attributed to the reduction of the shell to metallic Fe in the presence of hydrogen, which is a component of the reaction mixture [40]. This assumption is strongly supported by the results of Test E described in Section 2.2, and most notably by Test F, where the presence of the hydrogen atmosphere eliminates the induction period. Based on the above discussion, an important conclusion can be drawn: in the investigated nanocatalyst, metallic iron nanoparticles are primarily responsible for the high catalytic activity. Although Fe2O3 shells also exhibit catalytic activity, it is at a significantly lower level.
After removing the CNT fragments with the Fe nanoparticles they carry, the CO2 conversion clearly and irreversibly decreases (Figure 4, Test G), although it does not fall to zero. This finding proves that some catalytic activity is still retained by the surface of the 0.3FeOx film. However, this surface (Figure 1e and Table 1) differs from that of the fresh film (Figure 1b and Table 1) in two aspects. Firstly, it lacks iron nanoparticles, implying that they are not the sole contributors to the catalytic activity. Secondly, it contains the remaining part of the CNTs deposit, which may enhance this activity, as evidenced by comparison with the activity of the 0.1FeOx film. In the former case, the catalytic activity is clearly greater than in the latter (Tests B and G, respectively (Figure 4)). Meanwhile, the XPS spectra of Fe 3p for the spent film of 0.3FeOx devoid of Fe nanoparticles (Figure 1e) and 0.1FeOx (Figure 1c) are analogous, indicating the dominant presence of Fe3+ in both cases, most likely Fe2O3. We have already attributed some catalytic activity to this structure in the case of Fe nanoparticles carried by CNTs.
The enhanced catalytic activity of 0.3FeOx films can be attributed to the creation of nanohybrids from carbon nanotubes and Fe2O3 nanoparticles present on the film surface [32]. This leads to the formation of nanoscale heterojunctions between them. Assuming that Fe2O3 is an n-type semiconductor [41] and CNTs are a p-type semiconductor [42], the junction formation results in the appearance of space charges, positive on Fe2O3 and negative on CNTs, in the resulting depletion regions.
The small size of Fe2O3 nanoparticles (approx. 25 nm, determined analogously to the size of Fe3O4 nanoparticles (Figure 2b), which are oxidized to Fe2O3 on the film surface) is comparable to the average size of the depletion region [43]. This means that the entire volume of Fe2O3 nanoparticles becomes filled with a positive charge. On the other hand, the CNTs deposit constitutes a much larger volume, and the negatively charged depletion region occupies only a small space in the vicinity of the junctions.
This concept is confirmed by the aforementioned shift of the XPS bands for Fe3+ by approx. 0.38 eV towards higher binding energies after the catalytic process, i.e., after the formation of CNTs (Figure 1b,d). The presence of a positive charge causes a stronger binding of electrons, hence shifting the band maximum towards higher binding energy [44]. Such an effect is not observed in the case of the 0.1FeOx film, where no CNTs are formed in the catalytic process (Figure 1a,c).
The presence of a positive charge in Fe2O3 nanoparticles can generally be interpreted as an enhancement of the acidic nature of the surface of the 0.3FeOx film, leading, for example, to an increase in the density of oxygen vacancies. This change results in an elevated CO2 conversion towards CO [45], as evident when compared with the 0.1FeOx film. Another aspect to consider is the possibility of reducing Fe2O3 with hydrogen from the reaction mixture, similar to the case with the Fe2O3 shell on Fe nanoparticles. However, it is reasonable to assume that Fe2O3 nanoparticles, with a size of about 25 nm and present in much larger quantities on the film surface compared with the thin Fe2O3 shells (of a much smaller size, about 5 nm) on Fe nanoparticles, may undergo reduction, if at all, more reluctantly [46]. The slow increase in CO2 conversion observed during Test G could possibly be attributed to a partial, slow reduction of Fe2O3 to Fe.
Despite several questions that arise when attempting to explain the mechanism of action of Fe2O3-based nanocatalysts produced by the PECVD method, the positive effect of carbon nanotubes on their catalytic activity is evident. However, the pursuit of a comprehensive understanding and potential application in the design of nanocatalysts encourages further in-depth research and analysis.

3. Materials and Methods

3.1. Thin-Film Nanocatalyst Preparation

The FeOx-based thin films were produced by plasma-enhanced chemical vapor deposition (PECVD) in a parallel-plate radio-frequency (RF 13.56 MHz) reactor, the construction of which is described in more detail elsewhere [47]. The film fabrication procedure was similar to that presented in our previous work [6]. Iron pentacarbonyl (Fe(CO)5, Stream Chemicals, Newburyport, MA, USA) was used as a precursor, which was fed into the reactor chamber as a vapor in a mixture with a carrier gas (Ar, 99.999%, Linde Gas, Cracow, Poland). Argon had a constant flow rate of 1.0 sccm, corresponding to a partial pressure of 4.0 Pa, while the precursor was fed at two different partial pressures: 0.1Pa (0.1FeOx films) or 0.3 Pa (0.3FeOx films). The same discharge power of 80 W and the same deposition time of 30 min were used in all experiments. For catalytic tests, the films were deposited on a precalcined wire-mesh support [6], while for XPS and XRD studies, zero-background Si wafers (Si 510, Institute of Electronic Materials Technology—Łukasiewicz Research Network, Warsaw, Poland) were used as substrates. After deposition, all films were thermally treated at 673 K for 30 min under a continuous flow of argon at a rate of 2 L/min. Samples for the HRTEM study were collected from the surface of the 0.3FeOx film after the catalytic test.

3.2. Characteristics of the Film Structure

The elemental composition and molecular structure of the films were investigated by X-ray photoelectron spectroscopy (XPS) using a Kratos AXIS Ultra spectrometer (Kratos Analytical Ltd., Manchester, UK) with a monochromatic Al-Kα X-ray source (1486.6 eV). The power of the anode was set at 180 W, and the hemispherical electron energy analyzer was operated at a pass energy of 20 eV for all high-resolution measurements. The measurements were performed with a charge neutralizer. XPS spectra were analyzed using Kratos Vision 2.2.10 software, calibrated by setting the C1s carbon peak assigned to sp2 carbon at 284.6 eV. The background subtraction was performed with Shirley’s algorithm.
The nanocrystalline structure of the films was determined by X-ray diffraction. The measurements were performed in a reflection Bragg–Brentano mode using an Empyrean diffractometer (Malvern Panalytical Ltd., Malvern, UK) with Cu Kα radiation (λ = 1.541874 Å), operating at 45 kV and 40 mA. The diffractometer was equipped with a PIXcel3D detector with 255 active channels. Soller slits of 0.04 rad, a fixed mask of 20 mm, and a divergence slit of 1/4 deg were used on an incident beam path, while the diffracted beam path was also equipped with Soller slits of 0.04 rad. The diffractograms were obtained in the range of 2Θ = 5–85 deg using a continuous scan mode with a step size of 0.0263 deg and a counting time of 176 s. The samples were spined with a rotation time of 8 s.
The morphology of the films was examined using both scanning electron microscopy (SEM) and high-resolution transmission electron microscopy (HRTEM). SEM micrographs were obtained with an Apreo 2S microscope (Thermo Fisher Scientific, Waltham, MA, USA) in high vacuum mode at low voltage (1.0 kV) with a T2 detector. The tested samples were without sputtered coatings. In turn, the HRTEM investigations were performed using a Titan Themis 300 S/TEM (Thermo Fisher Scientific, Waltham, MA, USA) in scanning mode (STEM), equipped with a Super-X EDS system. Scanning transmission micrographs were acquired simultaneously by four detectors: a high-angle annular dark field (HAADF) detector, annular dark-field detectors (DF2, DF4), and an annular bright-field (ABF) detector. Copper grids with lacey carbon film were used to observe the deposits taken from the surface of the catalytic films.

3.3. Catalytic Tests

The catalytic tests were carried out in a quartz tube-in-tube reactor at atmospheric pressure with an internal diameter of 2.3 cm and an overall length of 30 cm. The reactor was operated under continuous flow conditions and placed horizontally in an electric furnace equipped with a programmable temperature controller. Further details on the experimental setup can be found in our previous publication [6]. Here we present a concise description supplemented with details on testing the performance of the catalyst under the conditions used in this work.
The catalyst bed was formed by six circular wire mesh discs (OD = 2.3 cm) with a hole (ID = 1.0 cm), which were fixed on the inner tube of the tubular reactor. To ensure a fair comparison between the different catalysts, the same number of mesh discs were always placed in the reactor in a uniform manner. The total geometrical area of the catalyst bed was 38 cm2, and its measured length was 10 cm.
The system was purged with 99.999% He before starting a typical catalytic test. Thereafter, a gas mixture consisting of CO2 99.99% and H2 99.999% (all gases supplied by Linde Gas, Cracow, Poland) flowed into the system at a total rate of 25 sccm with a 4:1 H2/CO2 feed composition. Once helium was flushed out, the system was preheated to 473 K. Kinetic tests were performed in the range of 473–673 K with a temperature ramp of 50 K and a heating rate of 5 K/min. The test was then continued at 673 K, and the time-on-stream performance was evaluated over a period of up to 20 h.
Additionally, several tests were conducted to evaluate the performance and repeatability of the catalysts. Following the 20 h time-on-stream run, the system was cooled to room temperature under the flow of the reaction mixture (25 sccm). The catalyst was then held in the air for 12 h before the next catalytic test was restarted. Tests were also carried out in which the catalyst reached a temperature of 673 K, in accordance with the procedure described above, in a flow of helium (25 sccm) or hydrogen (25 sccm) instead of the reaction mixture, and it was maintained in this way for 2 h. The flow of He or H2 was then stopped, and the feed of the reaction mixture was started. After approx. 30 min, the progress of CO2 hydrogenation was monitored over time at 673 K.
The outlet gas mixture from the reactor was passed through a cold trap to condense the water vapor, and then the dry gas was analyzed. The GC analysis was conducted in triplicate at 10 min intervals at each temperature. Carbon-containing components, including CO2, CO, and CH4, were analyzed on a HayeSep D column (Agilent) using a gas chromatograph (SRI 8610C, SRI Instruments, Torrance, CA, USA) with a thermal conductivity detector (TCD). Based on the calibration curves for CO2, CO, and CH4, the conversion of CO2 and selectivity to CO and CH4 were determined.
We attempted to determine the mass of carbon deposited on the surface during the catalytic tests. This was achieved by calculating the difference in mass between the fresh and spent catalysts. The measured mass (after 20 h of the process) remained consistent within an uncertainty of 0.1 mg, corresponding to the measurement sensitivity of an analytical balance. As a result, the mass of deposited carbon per unit of time is orders of magnitude lower than the flow rate of carbon in the tests performed (2.7 mg/min), and this value does not impact the accuracy of the carbon balance, which is solely based on the gaseous reactants (CO2, CO, and CH4) and was calculated as presented in Ref. [5].

4. Conclusions

This paper presents two significant aspects of research related to the search for new solutions in the area of catalytic materials for CO2 conversion into syngas. The first aspect confirms the broad potential offered by the PECVD method in producing thin-film nanocatalytic materials with unique properties. These materials are particularly useful in the construction of structured packings for catalytic reactors. Through plasma deposition using Fe(CO)5 as a precursor, conveniently carried out by means of PECVD, thin-film nanocatalysts based on FeOx were obtained. The structure and catalytic activity of these nanocatalysts can be precisely controlled by selecting appropriate deposition process parameters. This approach enabled the production of films (referred to as 0.3FeOx in this work) that achieved CO2 conversion in the reverse water-gas shift (RWGS) reaction very close to the equilibrium value under reaction conditions (XCO2 = approx. 38% at 673 K for H2/CO2 = 4:1, with an equilibrium value of 41.5%), and with a selectivity to CO of approx. 96%. Additionally, these films exhibited no signs of nanocatalyst destabilization over long periods of time.
The second important aspect of the research involved the finding of a carbon deposit containing carbon nanotubes (CNTs) on the surface of highly catalytically active films (0.3FeOx). This deposit was formed during the RWGS reaction. Contrary to the commonly held opinion, the presence of this deposit turned out to be highly beneficial in this case, significantly enhancing the catalytic activity of the films. According to the proposed mechanism, carbon nanotubes play a dual role in this context. Firstly, CNTs formed through the tip-growth mechanism lift up the iron nanoparticles present on the surface of the fresh 0.3FeOx film. These nanoparticles serve as both the nuclei for CNT growth and an active catalyst in the RWGS reaction. The removal of these iron nanoparticles leads to a significant reduction in catalytic activity. Secondly, CNTs simultaneously form nanoscale heterojunctions with Fe2O3 nanoparticles present on the film surface. The resulting positive charge on the Fe2O3 nanoparticles significantly enhances the conversion of CO2 into CO.
The presented results undoubtedly contribute to a better understanding of the nature of the active form of plasma-deposited thin films based on FeOx as catalysts in the CO2 hydrogenation process, thus opening up new possibilities for designing active and selective nanocatalysts in this area.

Supplementary Materials

The following supporting information can be downloaded at: https://www.mdpi.com/article/10.3390/catal13091302/s1, Supplementary Figure S1. X-ray diffraction (XRD); Supplementary Figure S2. RWGS reaction—thermodynamic analysis; Supplementary Figure S3. Calculation of composition of core-shell iron nanoparticle.

Author Contributions

Conceptualization and methodology, J.T. and H.K.-P.; catalytic tests and analysis, B.P. and H.K.-P.; XPS analysis, B.P. and J.T.; XRD analysis, P.U.; SEM analysis, B.P.; XRTEM analysis, S.N., V.N.-T. and J.T.; data curation, B.P., H.K.-P., P.U., S.N. and J.T; writing (draft, review, editing), J.T. and H.K.-P.; visualization, J.T., H.K.-P., P.U. and S.N.; supervision, J.T. and H.K.-P. All authors have read and agreed to the published version of the manuscript.

Funding

This research received no external funding and was financed as part of the statutory activity of the Lodz University of Technology.

Data Availability Statement

The data presented in this study are available on reasonable request from the corresponding author.

Conflicts of Interest

The authors declare no conflict of interest.

References

  1. Tyczkowski, J. Cold Plasma produced catalytic materials. In Plasma Science and Technology—Progress in Physical States and Chemical Reactions; Mieno, T., Ed.; InTech Open: Vienna, Austria, 2016; pp. 53–93. [Google Scholar]
  2. Wang, Z.; Zhang, Y.; Neyts, E.C.; Cao, X.; Zhang, X.; Jang, B.W.L.; Liu, C.J. Catalyst preparation with plasmas: How does it work? ACS Catal. 2018, 8, 2093–2110. [Google Scholar] [CrossRef]
  3. Kołodziej, A.; Łojewska, J.; Tyczkowski, J.; Jodłowski, P.; Redzynia, W.; Iwaniszyn, M.; Zapotoczny, S.; Kustrowski, P. Coupled engineering and chemical approach to the design of a catalytic structured reactor for combustion of VOCs: Cobalt oxide catalyst on knitted wire gauzes. Chem. Eng. J. 2012, 200–202, 329–337. [Google Scholar] [CrossRef]
  4. Kierzkowska-Pawlak, H.; Kruszczak, E.; Tyczkowski, J. Catalytic activity of plasma-deposited Co3O4-based thin films for CO2 hydration—A new approach to carbon capture applications. Appl. Catal. B Environ. 2022, 304, 120961. [Google Scholar] [CrossRef]
  5. Kierzkowska-Pawlak, H.; Tracz, P.; Redzynia, W.; Tyczkowski, J. Plasma deposited novel nanocatalysts for CO2 hydrogenation to methane. J. CO2 Util. 2017, 17, 312–319. [Google Scholar] [CrossRef]
  6. Kierzkowska-Pawlak, H.; Ryba, M.; Fronczak, M.; Kapica, R.; Sielski, J.; Sitarz, M.; Zając, P.; Łyszczarz, K.; Tyczkowski, J. Enhancing CO2 conversion to CO over plasma-deposited composites based on mixed Co and Fe oxides. Catalysts 2021, 11, 883. [Google Scholar] [CrossRef]
  7. Daza, Y.A.; Kuhn, J.N. CO2 conversion by reverse water gas shift catalysis: Comparison of catalysts, mechanisms and their consequences for CO2 conversion to liquid fuels. RSC Adv. 2016, 6, 49675–49691. [Google Scholar] [CrossRef]
  8. González-Castaño, M.; Dorneanu, B.; Arellano-García, H. The reverse water gas shift reaction: A process systems engineering perspective. React. Chem. Eng. 2021, 6, 954. [Google Scholar] [CrossRef]
  9. Mota, F.M.; Kim, D.H. From CO2 methanation to ambitious long-chain hydrocarbons: Alternative fuels paving the path to sustainability. Chem. Soc. Rev. 2019, 48, 205–259. [Google Scholar] [CrossRef]
  10. Wismann, S.Y.; Larsen, K.E.; Mortensen, P.M. Electrical reverse shift: Sustainable CO2 valorization for industrial scale. Angew. Chem. Int. Ed. 2022, 61, e202109696. [Google Scholar] [CrossRef]
  11. Su, X.; Yang, X.; Zhao, B.; Huang, Y. Designing of highly selective and high-temperature endurable RWGS heterogeneous catalysts: Recent advances and the future directions. J. Energy Chem. 2017, 26, 854–867. [Google Scholar] [CrossRef]
  12. Chen, X.; Chen, Y.; Song, C.; Ji, P.; Wang, N.; Wang, W.; Cui, L. Recent advances in supported metal catalysts and oxide catalysts for the reverse water-gas shift reaction. Front. Chem. 2020, 8, 709. [Google Scholar] [CrossRef]
  13. Chou, C.Y.; Loiland, J.A.; Lobo, R.F. Reverse water-gas shift iron catalyst derived from magnetite. Catalysts 2019, 9, 773. [Google Scholar] [CrossRef]
  14. Ding, M.; Yang, Y.; Wu, B.; Wang, T.; Ma, L.; Xiang, H.; Li, Y. Transformation of carbonaceous species and its influence on catalytic performance for iron-based Fischer–Tropsch synthesis catalyst. J. Mol. Catal. A Chem. 2011, 351, 165–173. [Google Scholar] [CrossRef]
  15. Otun, K.O.; Yao, Y.; Liu, X.; Hildenbrandt, D. Synthesis, structure, and performance of carbide phases in Fischer-Tropsch synthesis: A critical review. Fuel 2021, 296, 120689. [Google Scholar] [CrossRef]
  16. Zhu, M.; Wachs, I.E. Iron-based catalysts for the high-temperature water–gas shift (HTWGS) reaction: A review. ACS Catal. 2016, 6, 722–732. [Google Scholar] [CrossRef]
  17. Landau, M.V.; Meiri, N.; Utsis, N.; Nehemya, R.V.; Herskowitz, M. Conversion of CO2, CO, and H2 in CO2 hydrogenation to fungible liquid fuels on Fe-based catalysts. Ind. Eng. Chem. Res. 2017, 56, 13334–13355. [Google Scholar] [CrossRef]
  18. Zhang, Y.; Cao, C.; Zhang, C.; Zhang, Z.; Liu, X.; Yang, Z.; Zhu, M.; Meng, B.; Xu, J.; Han, Y.F. The study of structure-performance relationship of iron catalyst during a full life cycle for CO2 hydrogenation. J. Catal. 2019, 378, 51–62. [Google Scholar] [CrossRef]
  19. Puga, A.F. On the nature of active phases and sites in CO and CO2 hydrogenation catalysts. Catal. Sci. Technol. 2018, 8, 5681–5707. [Google Scholar] [CrossRef]
  20. Kim, D.H.; Han, S.W.; Yoon, H.S.; Kim, Y.D. Reverse water gas shift reaction catalyzed by Fe nanoparticles with high catalytic activity and stability. J. Ind. Eng. Chem. 2015, 25, 67–71. [Google Scholar] [CrossRef]
  21. Saeidi, S.; Amin, N.A.S.; Rahimpour, M.R. Hydrogenation of CO2 to value-added products—A review and potential future developments. J. CO2 Util. 2014, 5, 66–81. [Google Scholar] [CrossRef]
  22. Zhou, J.; Zhao, J.; Zhang, J.; Zhang, T.; Ye, M.; Liu, Z. Regeneration of catalysts deactivated by coke deposition: A review. Chin. J. Catal. 2020, 41, 1048–1061. [Google Scholar] [CrossRef]
  23. le Sache, E.; Reina, T.R. Analysis of dry reforming as direct route for gas phase CO2 conversion. The past, the present and future of catalytic DRM technologies. Prog. Energy Combust. Sci. 2022, 89, 100970. [Google Scholar] [CrossRef]
  24. Bost, N.; Ammar, M.R.; Bouchetou, M.L.; Poirier, J. The catalytic effect of iron oxides on the formation of nano-carbon by the Boudouard reaction in refractories. J. Eur. Ceram. Soc. 2016, 36, 2133–2142. [Google Scholar] [CrossRef]
  25. Vogt, E.T.C.; Fu, D.; Weckhuysen, B.M. Carbon deposit analysis in catalyst deactivation, regeneration, and rejuvenation. Angew. Chem. Int. Ed. 2023, 62, e202300319. [Google Scholar] [CrossRef]
  26. Papadopoulou, C.; Matralis, H.; Verykios, X. Deactivation due to coking. In Catalysis for Alternative Energy Generation; Guczi, L., Erdőhelyi, A., Eds.; Springer: New York, NY, USA, 2012; pp. 80–84. [Google Scholar]
  27. Lu, W.; Li, N.; Chen, W.; Yao, Y. The role of multiwalled carbon nanotubes in enhancing the catalytic activity of cobalt tetraaminophthalocyanine for oxidation of conjugated dyes. Carbon 2009, 47, 3337–3345. [Google Scholar] [CrossRef]
  28. Oberlin, A.; Endo, M.; Koyama, T. Filamentous growth of carbon through benzene decomposition. J. Cryst. Growth 1976, 32, 335–349. [Google Scholar] [CrossRef]
  29. Bradley, J.P.; Brownlee, D.E. Carbon compounds in interplanetary dust: Evidence for formation by heterogeneous catalysis. Science 1984, 223, 56–57. [Google Scholar] [CrossRef]
  30. Chen, W.; Fan, Z.; Pan, X.; Bao, X. Effect of confinement in carbon nanotubes on the activity of Fischer−Tropsch iron catalyst. J. Am. Chem. Soc. 2008, 130, 9414–9419. [Google Scholar] [CrossRef]
  31. Bai, Z.Y.; Yang, Q.; Wang, J.I. Fe3O4/multi-walled carbon nanotubes as an efficient catalyst for catalytic ozonation of p-hydroxybenzoic acid. Int. J. Environ. Sci. Technol. 2016, 13, 483–492. [Google Scholar] [CrossRef]
  32. Ismail, A.A.; Ali, A.M.; Harraz, F.A.; Faisal, M.; Shoukry, H.; Al-Salami, A.E. A facile synthesis of α-Fe2O3/carbon nanotubes and their photocatalytic and electrochemical sensing performances. Int. J. Electrochem. Sci. 2019, 14, 15–32. [Google Scholar] [CrossRef]
  33. Chen, Y.; Wei, J.; Duyar, M.S.; Ordomsky, V.V.; Khodakov, A.Y.; Liu, J. Carbon-based catalysts for Fischer–Tropsch synthesis. Chem. Soc. Rev. 2021, 50, 2337–2366. [Google Scholar] [CrossRef] [PubMed]
  34. Yamashita, T.; Hayes, P. Analysis of XPS spectra of Fe2+ and Fe3+ ions in oxide materials. Appl. Surf. Sci. 2008, 254, 2441–2449. [Google Scholar] [CrossRef]
  35. Gates-Rector, S.; Blanton, T. The powder diffraction file: A quality materials characterization database. Powder Diffr. 2019, 34, 352–360. [Google Scholar] [CrossRef]
  36. Das, R.; Hamid, S.B.A.; Ali, M.E.; Ramakrishna, S.; Yongzhi, W. Carbon nanotubes characterization by X-ray powder diffraction—A review. Curr. Nanosci. 2015, 11, 23–35. [Google Scholar] [CrossRef]
  37. Wirth, C.T.; Bayer, B.C.; Gamalski, A.D.; Esconjauregui, S.; Weatherup, R.S.; Ducati, C.; Baehtz, C.; Robertson, J.; Hofmann, S. The phase of iron catalyst nanoparticles during carbon nanotube growth. Chem. Mater. 2012, 24, 4633–4640. [Google Scholar] [CrossRef]
  38. McCafferty, L.; Stolojan, V.; King, S.G.; Zhang, W.; Haq, S.; Silva, S.R.P. Decoration of multiwalled carbon nanotubes with protected iron nanoparticles. Carbon 2015, 84, 47–55. [Google Scholar] [CrossRef]
  39. Ou, X. Molecular dynamics simulations of fcc-to-bcc transformation in pure iron: A review. Mater. Sci. Technol. 2017, 33, 822–835. [Google Scholar] [CrossRef]
  40. Jozwiak, W.K.; Kaczmarek, E.; Maniecki, T.P.; Ignaczak, W.; Maniukiewicz, W. Reduction behavior of iron oxides in hydrogen and carbon monoxide atmospheres. Appl. Catal. A Gen. 2007, 326, 17–27. [Google Scholar] [CrossRef]
  41. Liao, P.; Toroker, M.C.; Carter, E.A. Electron transport in pure and doped hematite. Nano Lett. 2011, 11, 1775–1781. [Google Scholar] [CrossRef]
  42. Hu, Q.; Lu, Z.; Wang, Y.; Wang, J.; Wang, H.; Wu, Z.; Lu, G.; Zhang, H.L.; Yu, C. Double doping approach for unusually stable and large n-type thermoelectric voltage from p-type multi-walled carbon nanotube mats. J. Mater. Chem. A 2020, 8, 13095–13105. [Google Scholar] [CrossRef]
  43. Sze, S.M.; Ng, K.K. Physics of Semiconductor Devices, 3rd ed.; John Wiley & Sons, Inc.: Hoboken, NJ, USA, 2007; pp. 80–90. [Google Scholar]
  44. Wang, L.; Chen, B.; Zhang, L.; Yu, J. In situ irradiated XPS investigation on S-scheme TiO2@ZnIn2S4 photocatalyst for efficient photocatalytic CO2 reduction. Small 2021, 17, 2103447. [Google Scholar] [CrossRef]
  45. Gao, X.; Cai, P.; Wang, Z.; Lv, X.; Kawi, S. Surface acidity/basicity and oxygen defects of metal oxide: Impacts on catalytic performances of CO2 reforming and hydrogenation reactions. Top. Catal. 2023, 66, 299–325. [Google Scholar] [CrossRef]
  46. Pour, A.N.; Housaindokht, M.R.; Babakhani, E.G.; Irani, M.; Shahri, S.M.K. Size dependence on reduction kinetic of iron based Fischer–Tropsch catalyst. J. Ind. Eng. Chem. 2011, 17, 596–602. [Google Scholar] [CrossRef]
  47. Tyczkowski, J.; Kierzkowska-Pawlak, H.; Kapica, R.; Balcerzak, J.; Sielski, J. Cold plasma − a promising tool for the production of thin-film nanocatalysts. Catal. Today 2019, 337, 44–54. [Google Scholar] [CrossRef]
Figure 1. Typical XPS Fe 3p spectra for: (a,c) 0.1FeOx film; (b,d,e) 0.3FeOx film. (a,b) Fresh (as-prepared) films; (c,d) Spent films; (e) 0.3FeOx spent film after removing part of the moss-like carbon deposit.
Catalysts 13 01302 g001
Figure 2. XRD patterns with interpreted diffraction peaks for: (a) 0.1FeOx film; (b) 0.3FeOx film.
Catalysts 13 01302 g002
Figure 3. CO2 conversion and selectivity to CO and CH4 as a function of temperature for 0.3FeOx and 0.1FeOx films.
Catalysts 13 01302 g003
Figure 4. CO2 conversion at 673 K as a function of time-on-stream: (Tests A, C, D) Successive runs for 0.3FeOx film starting in reaction mixture (H2/CO2 = 4:1) from room temperature; (Test B) Run for 0.1FeOx film starting in reaction mixture (H2/CO2 = 4:1) from room temperature; (Test E) Run for the 0.3FeOx film after Test A and heated from room temperature to 673 K in He; (Test F) Run for 0.3FeOx film after Test A and heated from room temperature to 673 K in H2; (Test G) Run for 0.3FeOx film after Test A and removing part of the moss-like carbon deposit. (More details in the text.).
Catalysts 13 01302 g004
Figure 5. SEM images of 0.1FeOx and 0.3FeOx films before (as-prepared) and after 20 h (spent) of the RWGS reaction. The moss-like deposit is clearly visible on the surface of the spent 0.3FeOx nanocatalyst.
Catalysts 13 01302 g005
Figure 6. Examples of HRTEM micrographs of the moss-like deposit taken from the surface of the spent 0.3FeOx nanocatalyst.
Catalysts 13 01302 g006
Figure 7. DF2 HRTEM micrograph of a typical Fe-based nanoparticle (spent 0.3FeOx) and its atomic intensity maps for carbon (C), oxygen (O) and iron (Fe) determined from nano-EDX measurements.
Catalysts 13 01302 g007
Figure 8. ABF HRTEM micrograph and the FFT diffraction patterns analyzing core and shell structures for a Fe-based nanoparticle.
Catalysts 13 01302 g008
Figure 9. DF2 HRTEM micrograph of a typical Fe-based nanoparticle and its atomic intensity maps for carbon (C), oxygen (O) and iron (Fe) determined from nano-EDX measurements.
Catalysts 13 01302 g009
Table 1. Elemental atomic composition of the fresh and spent 0.1FeOx and 0.3FeOx films.
Catalyst →0.1FeOx
Fresh
0.1FeOx
Spent
0.3FeOx
Fresh
0.3FeOx
Spent
0.3FeOx
Spent
(CNTs Partially Removed)
Element ↓Content [at%]
Fe23 ± 224.0 ± 0.525.0 ±0.45.0 ± 0.310 ± 1
O45 ± 249.7 ±0.448 ± 111 ± 123 ± 1
C 32.0 ± 0.126.3 ± 0.827 ± 284 ± 167 ± 2
Disclaimer/Publisher’s Note: The statements, opinions and data contained in all publications are solely those of the individual author(s) and contributor(s) and not of MDPI and/or the editor(s). MDPI and/or the editor(s) disclaim responsibility for any injury to people or property resulting from any ideas, methods, instructions or products referred to in the content.

