
Basic Properties of ZnO, Ga2O3, and MgO—Quantitative IR Studies

Jerzy Haber Institute of Catalysis and Surface Chemistry, Polish Academy of Sciences, Niezapominajek 8, 30-239 Krakow, Poland
*
Author to whom correspondence should be addressed.
Catalysts 2024, 14(2), 106; https://doi.org/10.3390/catal14020106
Submission received: 14 December 2023
/
Revised: 16 January 2024
/
Accepted: 17 January 2024
/
Published: 26 January 2024
(This article belongs to the Special Issue Feature Papers in Catalytic Materials)
Abstract
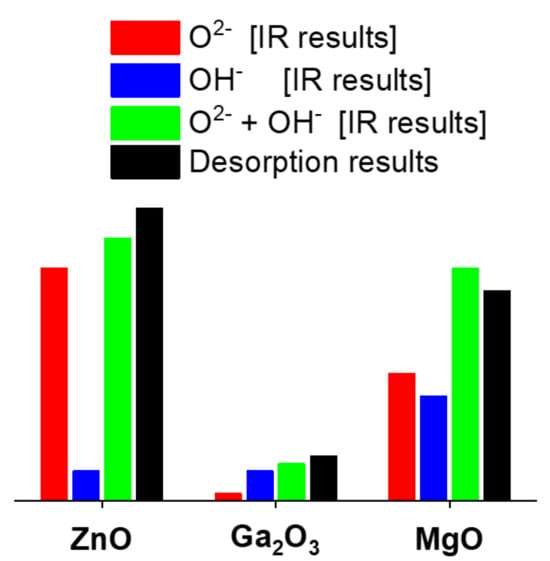
:In our previous study, we elaborated a method of determination of concentrations of the basic sites O2− and OH− in a quantitative IR study of CO2 adsorption. Previous adsorption studies or TPD experiments only provided the total basicity without distinguishing between O2− and OH−. In this study, we determined the concentration of O2− and OH− on ZnO, Ga2O3, and MgO surfaces. The basicity of ZnO and MgO was found to be significantly higher than that of Ga2O3. The surface of ZnO was rich in O2−, the contribution of OH− was very small, and the Ga2O3 surface contained mainly OH−. For MgO, the contribution of O2− and OH− was comparable. According to the IR results, only a small fraction of all surface hydroxyls were sufficiently basic to react with CO2. The partial dehydroxylation changed the proportion of the concentrations of O2− and OH− on the oxides. We also elaborated upon a new method to determine the total concentration of basic sites via CO2 desorption monitored using IR. For all the oxides, we studied the sum of the concentrations of O2− and OH−, as determined in our quantitative IR studies, to find whether they were comparable with the total basicity determined in the desorption experiments.
1. Introduction
Acid catalysts (mostly acidic zeolites) are very important catalysts in the chemical industry (especially in the oil refinery industry). The acidity of solids has been the subject of extensive investigation, whereas basic catalysts attract much less attention. The first investigation of basic catalysts was realized by Pines and Haag [1], who observed that alkali metals supported on alumina catalysed the double-bond isomerization of alkenes. Later, metal oxides with and without alkali metals, zeolites, clay minerals, and KF on alumina or lantanide imide, or nitride on zeolites, were applied as basic catalysts. According to Hattori [2,3], solid basic catalysts have many advantages over liquid basic catalysts in industrial processes, as follows: (1) Neutralization of the reaction mixture (which produces waste) is not necessary; (2) Application of flow reactors and reactions at high temperatures is possible; (3) Application of dual function acid–basic catalysts is possible.
Even though the number of industrial applications involving basic catalysts is smaller than of acid catalysts [4], they are used in numerous reactions, as follows [2,5]: double-bond isomerization, hydrogenation, amination, dehydrocylcodimerization, aldol condensation, nitroaldol reaction, the Michael addition, the conjugative addition of alcohol, cyanoetylation, and the Tishchenko reaction, among others.
Studying the basicity of catalysts is of great importance for science and technology. While many methods concerning the characterization of acidic catalysts have been elaborated upon, and many probe molecules have been applied (e.g., [6,7,8]), the number of methods mentioned in studies concerning basicity is much smaller. Most basicity studies use CO2 as a probe molecule (e.g., [9,10,11,12,13,14,15,16,17,18,19]). DFT calculations concerning CO2 adsorption have also been conducted [20,21,22,23,24]. Adsorption studies have provided information on the number of basic sites, and TPD experiments have also provided data on acid strength. More information on the acid strength of basic sites (mostly surface oxygens) has been obtained in IR studies on methane and ethyne [25], as well as pyrrole [26] adsorptions. More basic sites exhibit a strong interaction between oxygen and the hydrogen of the organic molecule and a higher red shift of the C-H and N-H IR band. Valuable information concerning the strength of basic sites was also obtained in microcalorimetric studies conducted by Auroux [27].
Supplementary information concerning the interaction between CO2 and basic sites on catalysts was obtained in IR studies. CO2 reacts with surface O2−, forming carbonate ions (CO32−). It also reacts with basic OH−, forming bicarbonate species (HCO3−). These species have different IR spectra, and there are bands characteristic of each of these forms [15,18,28,29,30,31]. A very good review on the IR spectra of CO2 that is adsorbed on various oxides was written by Busca and Lorenzelli [11]. While the adsorption and TPD experiments provided information on the number of basic sites, the IR studies on CO2 adsorption informed which kind of sites are present (O2−, OH−, or both of them). These IR studies are therefore qualitative. It was not possible to reveal the quantitative contribution of both kinds of basic sites.
We undertook quantitative IR studies of CO2 adsorption aiming to determine the concentration of basic sites, being both O2− and OH−. The adsorption and TPD studies do not differentiate between these sites, but their catalytic behaviour is different. In our previous study [32], we elaborated the experimental conditions in which CO2 molecules react solely with one kind of basic site on ZrO2 and on CeO2 and we determined the extinction coefficient of νCOO sym at around 1300–1350 cm−1 of the carbonate species, CO32−; we also determined the extinction coefficients of the νCOO sym band at around 1400–1450 cm−1, as well as the bending of the OH δOH band of bicarbonate species, HCO3−. These extinction coefficients were applied to determine the concentration of both kinds of basic sites O2− or OH− on ZrO2, CeO2, Al2O3, and CuO. For all these oxides, the total basicity (i.e., the sum of the concentrations of O2− or OH−) determined in our IR studies was close to the concentration of the basic sites determined in pulse adsorption experiments, which was evidence that our procedure, regarding the quantitative study of basicity, was correct and gave reliable results. Moreover, an advantage of our quantitative IR studies [32] is that it is possible to determine the concentrations of both kinds of basic sites independently.
The present study continues our previous research concerning IR studies on basicity. We studied the concentration of surface basic sites on ZnO, Ga2O3, and MgO. As practically only O2− was present on ZnO, we also determined the extinction coefficient of νCOO of CO32− band for ZnO, and we compared it with the values that were previously obtained for ZrO2 and CeO2. The fact that the extinction coefficient of the IR band determined for various adsorbents is the same has great importance, because such an extinction coefficient can be used for quantitative IR studies of basicity and materials other than the oxides studied in the present study (ZnO, Ga2O3, and MgO), as well as in our previous research [32].
We also elaborated upon a new method of determining the total basicity of oxides (or other materials) by quantifying the amount of desorbed CO2; to achieve this, we trapped these molecules and subsequently readsorbed them on the zeolite NaY. The amount of CO2 readsorbed on the zeolite was determined via IR spectroscopy.
As mentioned above, the subjects of our investigation were oxides, as follows: ZnO, Ga2O3, and MgO. ZnO is a component of catalysts that are active in the production of hydrogen using ethanol [33], and in CO2 conversion to methanol [34]. The first step of the reaction of ethanol is the formation of ethoxy groups by the reaction of alcohol with basic OH− and O2−; therefore, the recognition of the basicity of ZnO seems to be important for catalysis. Moreover, ZnO has been investigated as a component of catalysts for CO2 fixation in chemicals [35].
Ga2O3 is a catalyst used in numerous reactions concerning organic molecules, such as alkane dehydrogenation and cyclization [36,37,38], hydrocarbon isomerization [39], and methanol synthesis [40], among others. The surface properties of Ga2O3 were studied by Collins et al. [30]. These authors observed the formation of carbonate and bicarbonate species; however, the results have only a qualitative aspect. We undertook quantitative studies of the concentrations of O2− and OH− on Ga2O3.
MgO is a basic oxide which acts as an important catalyst for reactions of organic molecules such as alkane conversion [41,42,43]. MgO is also a promising adsorbent for CO2 capture [44,45,46]. As basic sites are involved in many of the abovementioned processes, we undertook quantitative IR studies of the basicity of ZnO, Ga2O3, and MgO.
2. Results and Discussion
2.1. CO2 Adsorption on ZnO
The spectra of carbonate species (CO32) formed on oxides show several characteristic IR bands: 1250–1400 cm−1 of symmetrical C-O stretching and 1500–1600 cm−1 of antisymmetrical C-O stretching. Symmetrical and antisymmetrical C-O stretching bands are also observed for bicarbonate (HCO3−) species. They appear at 1400–1500 cm−1 (symmetrical stretching) and 1600–1700 cm−1 (antisymmetrical stretching). Moreover, bicarbonate species show a band of OH bending (δOH) at 1200–1250 cm−1).
The spectra of CO2 adsorbed at room temperature on ZnO activated at 720 K are presented in Figure 1A. The spectra show an intensive and sharp band at 1337 cm−1 which can be assigned to bidentate carbonates (CO32−), as well as less intensive and broad bands at 1300 and 1320 cm−1 assigned to bridging and bidentate carbonates. The bands at 1550–1600 cm−1 are also due to carbonate species. The weak bands at 1230 and 1425 cm−1 can be assigned to small amounts of bicarbonate species. The formation of carbonate and bicarbonate species was also reported by Gankanda et al. [47].
Figure 1A shows that at relatively low loadings, the bands of carbonate species increase with CO2 loading, but at a higher amount of CO2 adsorbed the carbonate bands shift to higher frequencies: from 1337 to 1345 cm−1 and from 1597 to 1615 cm−1. At the present moment, we cannot explain this frequency shift.
The spectrum of OH groups (Figure 1B) shows several weak bands of Zn-OH. An explanation for this was proposed by Noei et al. [48], who assigned individual OH bands to Zn-OH on the various crystal faces of the oxide. These bands are significantly weaker than on other oxides. The adsorption of CO2 causes a decrease in these bands, which may be related to the formation of small amounts of bicarbonate species (Figure 1A).
At relatively low CO2 loadings, all adsorbate molecules form practically only carbonate species, and the bands of bicarbonates and of molecular CO2 are negligible. Therefore, all CO2 molecules introduced into the cell form carbonate ions and the conditions necessary for the determination of the extinction coefficient of the band carbonate ions are fulfilled. The integrated intensity of carbonate bands (integrated in the limits 1250–1400 cm−1) was plotted against the surface concentration of adsorbed CO2. The plot is linear (Figure 1C) and the points obtained in three independent experiments fit the same line. The slope of this line is the integrated extinction of the complex carbonate band with the maximum at 1337 cm−1. The value obtained was 14.8 cm/µmol, which is very close to the values of extinction coefficients obtained in our previous [32] quantitative IR studies of CO2 adsorption onZrO2 (15.1 cm/µmol) and on CeO2 (14.5 cm/µmol). For further calculations, the average value of these three values of 14.8 cm/µmol was used.
The concentration of basic O2− and OH− sites was calculated from the intensities of the bands of carbonate (CO32−) and bicarbonate (HCO3−) species: 1300–1337 cm−1 and 1230 cm−1, respectively, and the extinction coefficients of these bands. The value of 14.8 cm/µmol was used as the extinction coefficient of the carbonate band, and the value 2.26 cm/µmol determined in our previous study of CO2 adsorption on ZrO2 [32] was the extinction coefficient of the bicarbonate band at 1230 cm−1. The concentrations of O2− and OH− determined as described above were 31 and 4 µmol/g, respectively. These values are presented in Table 1. It may be concluded that the ZnO surface is rich in basic O2−, and the contribution of basic OH− is significantly lower. The total concentration of all basic sites reacting with CO2 is 35 µmol/g. Independently of the determination of concentration of O2− and OH− from the intensities of carbonate and bicarbonate bands, we also determined the total concentration of all the basic sites in desorption experiments, the procedure for which is described in the last chapter. The concentration of basic sites determined in desorption experiments for ZnO was 39 µmol/g. This value agrees well with the sum of concentrations of O2− and OH−, i.e., 35 µmol/g.
2.2. CO2 Adsorption on Ga2O3
The spectra recorded upon the adsorption of CO2 at room temperature on Ga2O3 are presented in Figure 2A. The IR bands (1230, 1430, 1462, 1630 cm−1) are typical of bicarbonate species, while the bands of carbonates 1290 and 1335 cm−1 are very weak. Moreover, the bands of carboxylate-like species (νsym.CO at 1180 and νasym.CO at 1740–1790 cm−1) are present. The discussion of the nature of such carboxylate species was proposed by Busca and Lorenzelli [11]. Similar results were obtained by Collins et al. [30] who reported a variety of carbonate and bicarbonate species. At relatively low CO2 coverages, the bidentate bicarbonates prevail (band at 1462 cm−1), while at higher loadings monodentate bicarbonates are formed (band at 1430 cm−1). These results prove that bidentate bicarbonates are more strongly bonded to the Ga2O3 surface and are formed in the first order.
The spectrum of OH groups (Figure 2B) shows several bands, the assignment of which was proposed by Collins et al. [30]. The reaction with CO2 consumes some hydroxyls. It is important to mention that only a small fraction of hydroxyls are sufficiently basic to react with CO2. The hydroxyls reacting with CO2 are these of high frequency: doublet 3663, 3670 cm−1, as well as 3695, and 3710 cm−1. These hydroxyls ae described by Collins et al. [30] as terminal hydroxyls and hydroxyls bonded to four- and hexa-coordinated Ga. These hydroxyls bear the net negative charge (−0.5, −0.25) or are neutral. Other hydroxyls which have a positive charge [30] (of lower stretching frequencies) do not react with CO2. The adsorption of CO2 on Ga2O3 produces new C-OH hydroxyls vibrating at 3610 cm−1.
The concentration of basic OH− sites was calculated from the integrated intensity of the band of δOH 1230 cm−1 and its extinction coefficient (2.26 cm/µmol) determined in our previous study [32]. The concentration of O2− was calculated from the intensities of the CO32− band: 1290 and 1335 cm−1 and the extinction coefficient of the carbonate band (14.8 cm/µmol) determined as described above. These concentrations of basic sites (O2− and OH−) are presented in Table 1 and can be compared with the concentration of basic sites determined in desorption experiments (described in the last chapter). The agreement of the concentration of basic sites of O2− plus OH− determined in our IR experiments (5 µmol/g) and determined in adsorption experiments (4 µmol/g) is further evidence that the IR method of determination of the concentration of sites is correct.
2.3. CO2 Adsorption on MgO
The spectra of CO2 adsorbed on MgO activated at 720 K are presented in Figure 3A. The bands of carbonates (1305 and 1500–1600 cm−1), as well as of bicarbonates (1215, 1380, 1420, and 1665–1685 cm−1), are present.
An analysis of the bands of carbonates and bicarbonates suggests that they are composed of the bands monodentate and bidentate species. The presence of monodentate and bidentate carbonates was also reported by Fukuda and Tanabe [49], as well as Yanagisawa et al. [50]. Moreover, Jensen et al. [51] realized quantum chemical calculations and proposed that monodentate species were formed on edge sites and bidentate ones on corner sites.
The spectra of hydroxyl groups on the MgO surface are presented in Figure 3B. The Mg-OH band at 3750 cm−1 is present. The adsorption of CO2 causes the decrease in the Mg-OH band due to the formation of bicarbonate ions. The bands at 3621 and at 3664 cm−1 typical of monodentate and bidentate bicarbonates, respectively, appear. It is interesting to mention that the minimum in the difference spectrum representing the hydroxyls lost by the reaction with CO2 occurs at 3755 cm−1, whereas the maximum representing the hydroxyls not reacting with CO2 occurs at 3746 cm−1. This result evidences that the 3750 cm−1 band in the spectrum of activated MgO is complex and the high-frequency component is sufficiently basic to react with CO2. A similar situation was observed for Ga2O3 (Figure 2B) in which only the high-frequency OH groups (negative or neutral) reacted with CO2.
The concentration of basic O2− and OH− on the MgO surface was calculated from the intensities of the IR bands of carbonates (1305 cm−1) and bicarbonates (1215 cm−1) and the extinction coefficients of these bands. The value of the extinction coefficient of the carbonate band (14.8 cm/µmol) was determined for ZnO and also taken from our earlier study of CO2 adsorption on ZrO2 and CeO2 [32]. The extinction coefficient of the bicarbonate band (2.26 cm/µmol) was taken from our earlier study [32].
The concentration of O2− and OH− on MgO is given in Table 1. For MgO activated at 720 K, these concentrations were 17 µmol/g (O2−) and 14 µmol/g (OH−). The sum of the concentrations of O2− and OH− (31 µmol/g) agrees well with the total concentration of all basic sites determined in desorption experiments (28 µmol/g).
2.4. Dehydroxylation of ZnO, Ga2O3, and MgO
In order to study the effect of partial dehydroxylation on the basic properties of oxides, the oxides were calcined in a vacuum at 900 K (Ga2O3 and MgO) or at 820 K (ZnO). The spectra of OH groups in these oxides activated at 720 K and calcined at 900 K are presented in Figure 4A,C,E, and the concentration of basic O2− and OH− calculated from the intensities of carbonate and bicarbonate bands (Figure 4B,D,F) are given in Table 1. The surface of ZnO is poor in OH groups, and the intensities of OH bands are very low. The calcination causes a significant decrease in OH bands (Figure 4A). The adsorption of CO2 evidenced that the concentration of OH− decreased upon calcination (Figure 4B). The calcination of Ga2O3 also causes a decrease in OH bands (Figure 4C), but in this case only ca. 30% of OH groups were lost, indicating that ca. 30% of Ga-OH groups are lost by dehydroxylation. The experiments of CO2 adsorption also revealed some loss of OH−. Additionally, the calcination of MgO results in the loss of some OH groups: the band at 3750 cm−1 decreases by ca. 20%. The analysis of the spectra recorded upon activation at 720 K and calcination at 900 K, as well as the difference spectrum (Figure 4E), shows that hydroxyls of the highest stretching frequency are the most sensitive to dehydroxylation (the high-frequency component of the OH band is lost). The adsorption of CO2 revealed the loss of practically all basic OH− (see Table 1). Comparing the data concerning Mg-OH groups presented in Figure 3A and Figure 4E leads to the conclusion that Mg-OH groups are heterogenous and only some of them (ca. 20–30%) are sufficiently basic to react with CO2 forming HCO3−. These basic OH− are less stable at high temperatures and the most prone to dehydroxylation. A similar situation was observed for Ga2O3 (Figure 4C), ZrO2, and CeO2 [32] in which the high-frequency hydroxyls were found to be most basic and were the most prone to dehydroxylation. Comparing the concentrations of basic O2− in MgO activated at 720 K and calcined at 900 K proved that the dehydroxylation which caused the loss of most of the basic OH− produced a corresponding amount of O2−. The total amount of the number of basic sites (O2− plus OH−) did not change. A similar situation was also observed for ZrO2.
Independently of our IR studies of the concentration of basic O2− and OH− from the intensities of IR bands of carbonate and bicarbonate species and the extinction coefficients of these bands, we also determined the total concentration of basic sites by measuring the amount of CO2 desorbed from our oxides and trapped in a cold trap. These amounts are also presented in Table 1. In all the cases, the sum concentrations of O2− and OH−, i.e., the total basicity of oxides, was close to the basicity expressed by the amount of CO2 desorbed. This agreement is evidence that our IR method of determination of the concentrations of O2− and OH− is correct.
2.5. Determination of Total Concentration of Basic Sites in Desorption Experiments
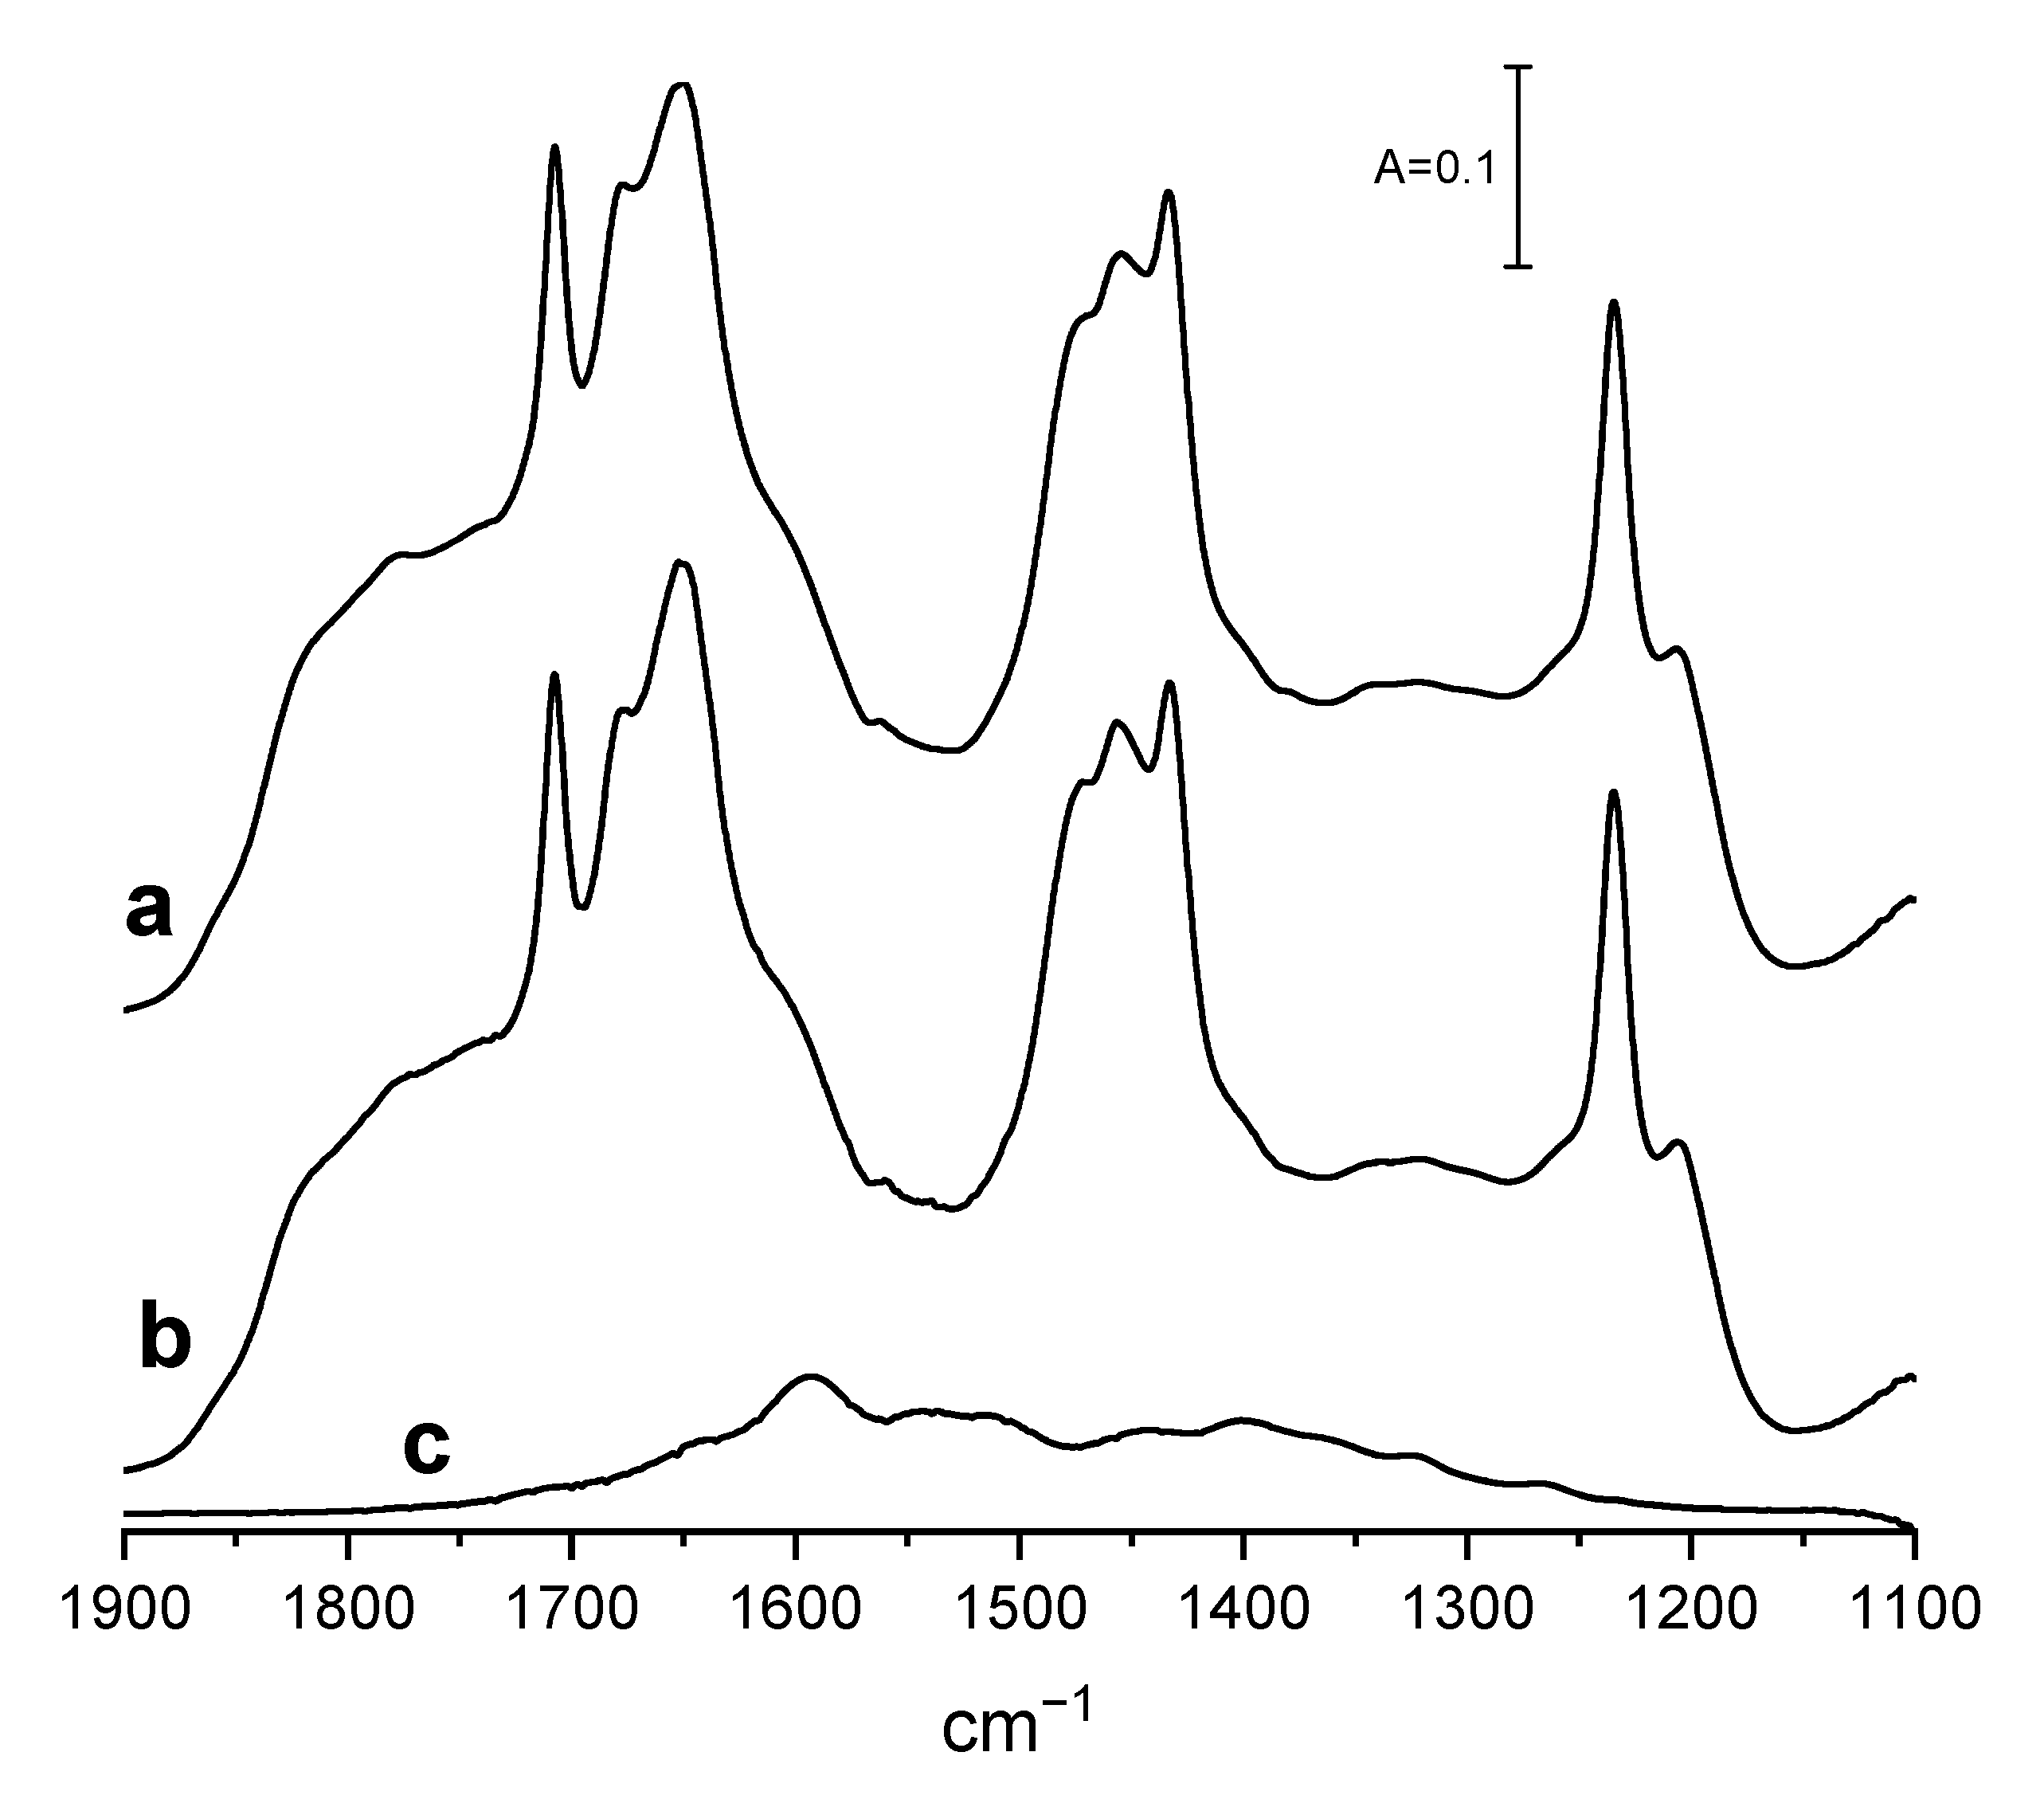
Independently of the IR studies of the concentration of the basic sites O2− and OH− separately with the use of the intensity of diagnostic bands and their extinction coefficients, we elaborated an alternative new method of determination of the total concentration of all basic sites (O2− and OH− combined). This new method also used IR spectrometry. The excess of CO2 (sufficient to cover all the basic sites) was adsorbed at room temperature and the IR spectrum was recorded (spectrum a). The gaseous and weakly bonded CO2 was next removed by a 1 min evacuation at room temperature. The IR spectrum recorded subsequently (spectrum b) showed a small decrease in bicarbonate bands due to the decomposition of some unstable bicarbonate species. More strongly bonded CO2 was next removed by a 30 min desorption at 470 K to cold trap. The spectrum recorded upon desorption at 470 K was denoted as spectrum c. The molecules caught in the cold trap were subsequently adsorbed on a freshly activated wafer of zeolite NaY which is a very efficient adsorbent. The amount of such CO2 stored in the cold trap, i.e., desorbed at 470 K from our oxides (denoted as CO2 des.), was calculated from the intensity of the IR band of CO2 on zeolite and the extinction coefficient of this band (determined in an experiment in which the measured doses of CO2 were adsorbed on NaY). The total amount of CO2 bonded to all the basic sites on our oxide (denoted CO2 total) was calculated by the multiplication of the amount of CO2 des. by the factor F where F = Aspectrum a/Aspectrum b − Aspectrum c. (A represents the intensities of the spectra of (bi)carbonate species integrated inside the region 1200–1900 cm−1). The amount of CO2 denoted as CO2 des. represents the amount of CO2 desorbed at 470 K from our oxide upon the removal of the gas phase (together with very weakly bonded molecules). This amount corresponds to that determined in “classical” TPD experiments. The multiplication of this amount by the factor F described above additionally takes into account the number of molecules very weakly bonded lost in flushing together with the gas phase by inert gas before the TPD procedure. Additionally, the factor F takes into account the strongly bonded molecules which remain on the surface after the TPD procedure has ended. In other words, our IR method takes into account the molecules of adsorbate very weakly and strongly bonded which are often lost in the “classical” TPD experiment.
Our new method of determining the concentration of basic sites on oxides’ surfaces was tested in the case of alumina. The basicity of this oxide was followed in our earlier study [32,52] by IR spectroscopy and also by the pulse adsorption method. According to IR experiments, this oxide contained 2 µmol/g of O−2, and 46 µmol/g of OH− (48 µmol/g of all basic sites). The pulse adsorption measurements gave 44 µmol/g of the basic sites, which was in good agreement with the IR results. The basicity of alumina was also measured by the method described here. Figure 5 shows the spectra recorded upon the adsorption of the excess of CO2 at room temperature on alumina activated at 720 K. Spectrum a was recorded upon CO2 adsorption, whereas spectra b and c were recorded upon 1 min evacuation at room temperature and upon the desorption at 470 K. The factor F calculated as F = Aspectrum a/Aspectrum b − Aspectrum c. (A represent the intensities of the spectra of (bi)carbonate species integrated inside the region 1200–1900 cm−1) was found to be F = 1.21. The amount of CO2 desorbed at 470 K, trapped in the cold trap, and subsequently readsorbed on zeolite NaY was calculated from the intensity of the CO2 band in the spectrum of CO2 on NaY, and the extinction coefficient of this band (17.1 cm/µmol) was 42 µmol/g. This value multiplied by the factor F gave 51 µmol/g. This value is close to the values of the sum of concentrations of O2− and OH− (48 µmol/g) and the concentration of basic sites determined using the pulse adsorption method (44 µmol/g). The agreement of all these three values is evidence that our IR methods of determination of the concentration of basic sites are correct. Therefore, this method may be used for the determination of the total basicity of oxides of other catalysts.
3. Materials and Methods
ZnO (Aldrich 544906-10G, Sigma-Aldrich, St. Louis, MO, USA, nanopowder), Ga2O3 (ACS reagent, purity > 99.99%), MgO (POCH, Gliwice, Poland, analytical grade), and CO2 (Linde, Krakow, Poland, purity 99.98) were used.
For IR studies, all oxides were pressed into thin wafers of approx. 100–250 mg. Prior to IR experiments, wafers were evacuated in situ in an IR cell at 720 K for 30 min. In some experiments, partial dehydroxylation was followed: ZnO was evacuated at 820 K, Ga2O3 and MgO were evacuated at 900 K for 1 h. CO2 was adsorbed at room temperature. The spectra were recorded with a NICOLET 6700 spectrometer (Thermo Scientific, Cambridge, MA, USA) with the spectral resolution of 1 cm−1.
4. Conclusions
The extinction coefficient of νCOsym. at 1337 cm−1 of CO32− formed on ZnO was determined. The obtained value was very close to those determined in our previous study of CO2 adsorption on ZrO2 and CeO2 proving that this extinction coefficient does not depend on the adsorbent. The concentrations of both surface O2− and OH− were determined for ZnO, Ga2O3, and MgO with the extinction coefficients of the CO32− and HCO3− bands determined in this study and in our previous research. While ZnO contained practically only O2− and Ga2O3 practically only OH−, MgO contained comparable amounts of O2− and OH−. The sum of the concentrations of surface O2− and OH− was comparable with the values obtained in the desorption study. We also elaborated a new method of determining total basicity by desorption monitored by IR. Only a small fraction of OH groups on Ga2O3 and MgO were sufficiently basic to react with CO2. These hydroxyls showed the highest stretching frequency. Partial dehydroxylation by calcination of oxides at high temperatures decreased the population of basic OH−. In the case of MgO, all OH− lost by dehydroxylation formed new O2− in the proportion of 1:1.
Author Contributions
Conceptualization, J.D.; methodology, J.P. and J.D.; software, J.P.; validation, J.P. and J.D.; formal analysis, J.P. and J.D.; investigation, J.P.; resources, J.P.; data curation, J.P. and J.D.; writing—original draft preparation, J.D.; writing—review and editing, J.P. and J.D.; visualization, J.P.; supervision, J.D.; project administration, J.D.; funding acquisition, J.D. All authors have read and agreed to the published version of the manuscript.
Funding
This work was supported by the statutory funds of the Jerzy Haber Institute of Catalysis and Surface Chemistry PAS.
Data Availability Statement
Data are contained within the article.
Conflicts of Interest
The authors declare no conflicts of interest.
References
- Pines, H.; Haag, W.O. Communications-stereoselectivity in the carbanion-catalyzed isomerization of 1-Butene. J. Org. Chem 1958, 23, 328–329. [Google Scholar] [CrossRef]
- Hattori, H. Solid base catalysts: Generation of basic sites and application to organic synthesis. Appl. Catal. A Gen. 2001, 222, 247–259. [Google Scholar] [CrossRef]
- Hideshi, H. Solid base catalysts: Fundamentals and their applications in organic reactions. Appl. Catal. A Gen. 2015, 504, 103–109. [Google Scholar] [CrossRef]
- Ono, Y.; Baba, T. Selective reactions over solid base catalysts. Catal. Today 1997, 38, 321–337. [Google Scholar] [CrossRef]
- Bing, W.; Wei, M. Recent advances for solid basic catalysts: Structure design and catalytic performance. J. Solid State Chem. 2019, 269, 184–194. [Google Scholar] [CrossRef]
- Derouane, E.G.; Védrine, J.C.; Ramos Pinto, R.; Borges, P.M.; Costa, L.; Lemos, M.A.N.D.A.; Lemos, F.; Ramôa Ribeiro, F. The acidity of zeolites: Concepts, measurements and relation to catalysis: A review on experimental and theoretical methods for the study of zeolite acidity. Catal. Rev. Sci. Eng. 2013, 55, 454–515. [Google Scholar] [CrossRef]
- Knözinger, H. Infrared spectroscopy for the characterization of surface acidity and basicity. In Handbook of Heterogeneous Catalysis; Ertl, G., Knözinger, H., Schüth, F., Weitkamp, J., Eds.; Wiley: New York, NY, USA, 2008. [Google Scholar] [CrossRef]
- Kuterasiński, Ł.; Gackowski, M.; Podobiński, J.; Rutkowska-Zbik, D.; Datka, J. Nitrogen as a probe molecule for the IR studies of the heterogeneity of OH groups in zeolites. Molecules 2021, 26, 6261. [Google Scholar] [CrossRef] [PubMed]
- Ramis, G.; Busca, G.; Lorenzelli, V. Low-temperature CO2 adsorption on metal oxides: Spectroscopic characterization of some weakly adsorbed species. Mater. Chem. Phys. 1991, 29, 425–435. [Google Scholar] [CrossRef]
- Li, C.; Sakata, Y.; Arai, T.; Domen, K.; Maruya, K.; Onishi, T. Carbon Monoxide and carbon dioxide adsorption on cerium oxide studied by Fourier-transform infrared spectroscopy. Part 1.—Formation of carbonate species on dehydroxylated CeO2, at room temperature. J. Chem. Soc. Faraday Trans. I 1989, 85, 929–943. [Google Scholar] [CrossRef]
- Busca, G.; Lorenzelli, V. Infrared spectroscopic identification of species arising from reactive adsorption of carbon oxides on metal oxide surfaces. Mater. Chem. 1982, 7, 89–126. [Google Scholar] [CrossRef]
- Freund, H.J.; Roberts, M.W. Surface chemistry of carbon dioxide. Surf. Sci. Rep. 1996, 25, 225–273. [Google Scholar] [CrossRef]
- Mino, L.; Spoto, G.; Ferrari, A.M. CO2 capture by TiO2 anatase surfaces: A combined DFT and FTIR study. J. Phys. Chem. C 2014, 118, 25016–25026. [Google Scholar] [CrossRef]
- Cornu, D.; Guesmi, D.; Krafft, J.-M.; Lauron-Pernot, H. Lewis acido-basic interaction between CO2 and MgO surface: DFT and DRIFT approaches. J. Phys. Chem. C 2012, 116, 6645–6654. [Google Scholar] [CrossRef]
- Li, C.; Sakata, Y.; Arai, T.; Domen, K.; Maruya, K.; Onishi, T. Adsorption of carbon monoxide and carbon dioxide on cerium oxide studied by Fourier-transform infrared spectroscopy. Part 2.—Formation of formate species on partially reduced CeO2 at room temperature. J. Chem. Soc. Faraday Trans. I 1989, 85, 1451–1461. [Google Scholar] [CrossRef]
- Pokrovski, K.; Jung, K.T.; Bell, A.T. Investigation of CO and CO2 adsorption on tetragonal and monoclinic zirconia. Langmuir 2001, 17, 4297–4303. [Google Scholar] [CrossRef]
- Bachiller-Baeza, B.; Rodriguez-Ramos, I.; Guerrero-Ruiz, A. Interaction of carbon dioxide with the surface of ZrO2 polymorphs. Langmuir 1998, 14, 3556–3564. [Google Scholar] [CrossRef]
- Korhonen, S.T.; Calatayud, M.; Krause, A.O.I. Structure and Stability of Formates and Carbonates on Monoclinic Zirconia: A Combined Study by Density Functional Theory and Infrared Spectroscopy. J. Phys. Chem. C 2008, 112, 16096–16102. [Google Scholar] [CrossRef]
- Binet, C.; Daturi, M.; Lavalley, J.-C. IR Study of polycrystalline ceria properties in oxidized and reduced states. Catal. Today 1999, 50, 207–225. [Google Scholar] [CrossRef]
- Pacchioni, G.; Ricart, J.M.; Illas, F. Ab Initio Cluster Model Calculations on the Chemisorption of CO2 and SO2 Probe Molecules on MgO and CaO (100) Surfaces. A Theoretical Measure of Oxide Basicity. J. Am. Chem. Soc. 1994, 116, 10152–10158. [Google Scholar] [CrossRef]
- Markovits, A.; Fahmi, A.; Minot, C. A theoretical study of CO2 adsorption on TiO2. J. Mol. Struct. THEOCHEM 1996, 371, 219–235. [Google Scholar] [CrossRef]
- Sorescu, D.C.; Al-Saidi, W.A.; Jordan, K.D. CO2 adsorption on TiO2(101) anatase: A dispersion-corrected density functional theory study. J. Chem. Phys. 2011, 135, 124701. [Google Scholar] [CrossRef]
- He, H.; Zapol, P.; Curtiss, L.A. A Theoretical Study of CO2 Anions on Anatase (101) Surface. J. Phys. Chem. C 2010, 114, 21474–21481. [Google Scholar] [CrossRef]
- Tosoni, S.; Spinnato, D.; Pacchioni, G. DFT study of CO2 activation on doped and ultrathin MgO films. J. Phys. Chem. C 2015, 119, 27594–27602. [Google Scholar] [CrossRef]
- Thomasson, P.; Tyagi, O.S.; Knozinger, H. Characterisation of the basicity of modified MgO-catalysts. Appl. Catal. A Gen. 1999, 181, 181–188. [Google Scholar] [CrossRef]
- Huang, M.; Kaliaguine, S. Zeolite basicity characterized by pyrrole chemisorption: An infrared study. J. Chem. Soc. Faraday Trans. 1992, 88, 751–758. [Google Scholar] [CrossRef]
- Auroux, A. Calorimetry and Thermal Methods in Catalysis, 1st ed.; Springer Series in Materials Science; Springer: Berlin/Heidelberg, Germany, 2013; Volume 154, ISBN 978-3642119538. [Google Scholar]
- Köck, E.-M.; Kogler, M.; Bielz, T.; Klötzer, B.; Penner, S. In Situ FT-IR Spectroscopic Study of CO2 and CO Adsorption on Y2O3, ZrO2, and Yttria-Stabilized ZrO2. J. Phys. Chem. C 2013, 117, 17666–17673. [Google Scholar] [CrossRef]
- Morterra, C.; Orio, L. Mater. Chem. Phys. Surface characterization of zirconium oxide. II. The interaction with carbon dioxide at ambient temperature. Mater. Chem. Phys. 1990, 24, 247–268. [Google Scholar] [CrossRef]
- Collins, S.E.; Baltanas, M.A.; Bonivardi, A.L. Infrared spectroscopic study of the carbon dioxide adsorption on the surface of Ga2O3 polymorphs. J. Phys. Chem. B 2006, 110, 5498–5507. [Google Scholar] [CrossRef]
- Wachs, I. Infrared Spectroscopy of Supported Metal oxides. Colloids Surf. A Physicochem. Eng. Acpects 1995, 1, 143–149. [Google Scholar] [CrossRef]
- Podobiński, J.; Śliwa, M.; Datka, J. Determination of Concentration of Basic Sites on Oxides by IR Spectroscopy. Spectrochim. Acta A Mol. Biomol. Spectrosc. 2023. submitted. [Google Scholar]
- Śliwa, M.; Socha, R.P. Modification of CuO–ZrO2–ZnO Mixed Oxide Catalyst with Mn, Ga, Ni: Impact on Physicochemical Properties and Hydrogen Production via Low Temperature Steam Reforming of Ethanol. Catal. Lett. 2022, 152, 3747–3760. [Google Scholar] [CrossRef]
- Hamryszak, Ł.; Madej-Lachowska, M.; Grzesik, M.; Śliwa, M. Cu/Zn/Zr/Ga Catalyst for Utilisation of Carbon Dioxide to Methanol—Kinetic Equations. Catalysts 2022, 12, 757. [Google Scholar] [CrossRef]
- Tang, Q.L.; Luo, Q.H. Adsorption of CO2 at ZnO: A Surface Structure Effect From DFT-U Calculations. J. Phys. Chem. C 2013, 117, 22954–22966. [Google Scholar] [CrossRef]
- Carli, R.; Le Van Mao, R.; Bianchi, C.; Ragaini, V. Hydrogen Sorption Sites in the Gallium Containing Hybrid Catalysts Used for the Aromatization of Light Alkanes. Catal. Lett. 1993, 21, 265–274. [Google Scholar] [CrossRef]
- Takahara, I.; Saito, M.; Inaba, M.; Murata, K. Effects of Pre-Treatment of a Silica-Supported Gallium Oxide Catalyst with H2 on Its Catalytic Performance for Dehydrogenation of Propane. Catal. Lett. 2004, 96, 29–32. [Google Scholar] [CrossRef]
- Meitzner, G.D.; Iglesia, E.; Baumgartner, J.E.; Huang, E.S. The Chemical State of Gallium in Working Alkane Dehydrocyclodimerization Catalysts. In situ Gallium K-Edge X-Ray Absorption Spectroscopy. J. Catal. 1993, 140, 209–225. [Google Scholar] [CrossRef]
- Moreno, J.A.; Poncelet, G. Isomerization of n-Butane over Sulfated Al- and Ga-Promoted Zirconium Oxide Catalysts. Influence of Promoter and Preparation Method. J. Catal. 2001, 203, 453–465. [Google Scholar] [CrossRef]
- Collins, S.E.; Chiavassa, D.L.; Bonivardi, A.L.; Baltanas, L.A. Hydrogen Spillover in Ga2O3-Pd/SiO2 Catalysts for Methanol Synthesis from CO/H2. Catal. Lett. 2005, 103, 83–88. [Google Scholar] [CrossRef]
- Maeda, N.; Urakawa, A.; Baiker, A. Support Effects and Chemical Gradients along the Catalyst Bed in NOx Storage-Reduction Studied by Space- and Time-Resolved In Situ DRIFTS. J. Phys. Chem. C 2009, 113, 16724–16735. [Google Scholar] [CrossRef]
- Lin, C.H.; Ito, T.; Wang, J.; Lunsford, J.H. Oxidative Dimerization of Methane over Magnesium and Calcium Oxide Catalysts Promoted with Group IA Ions: The Role of [M+O-] Centers. J. Am. Chem. Soc. 1987, 109, 4808–4810. [Google Scholar] [CrossRef]
- Guzman, J.; Gates, B.C.; Bruce, C. A Mononuclear Gold Complex catalyst Supported on MgO: Spectroscopic Characterization during Ethylene Hydrogenation Catalysis. J. Catal. 2004, 226, 111–119. [Google Scholar] [CrossRef]
- Yong, Z.; Mata, V.G.; Rodrigues, A.E. Adsorption of Carbon Dioxide on Chemically Modified on High Surface Area Carbon-Based Adsorbent at High Temperature. Adsorption 2001, 7, 41–50. [Google Scholar] [CrossRef]
- Ding, Y.; Alpay, E. Equilibria and Kinetics of CO2 Adsorption on Hydrotalcite Adsorbent. Chem. Eng. Sci. 2000, 55, 3461–3474. [Google Scholar] [CrossRef]
- Ding, Y.; Alpay, E. Adsorption-enhanced steam–methane reforming. Chem. Eng. 2000, 55, 3929–3940. [Google Scholar] [CrossRef]
- Gankanda, A.; Cwiertny, D.M.; Grassian, V.H. Surface Phases and the Impact on Nanoparticle Dissolution. J. Phys. Chem. C 2016, 120, 19195–19203. [Google Scholar] [CrossRef]
- Noei, H.; Qiu, A.; Wang, Y.; Loeffler, E.; Woell, C.; Muehler, M. The Identification of Hydroxyl Groups on ZnO Nanoparticles by Infrared Spectroscopy. Phys. Chem. Chem. Phys. 2008, 10, 7092–7097. [Google Scholar] [CrossRef]
- Fukuda, Y.; Tanabe, K. Infrared Study of Carbon Dioxide Adsorbed on Magnesium and Calcium Oxides. Bull. Chem. Soc. Jpn. 1973, 46, 1616–1619. [Google Scholar] [CrossRef]
- Yanagisawa, Y.K.; Takaoka, K.; Yamabe, S. Interaction of CO2 with Magnesium Oxide Surfaces: A TPD, FTIR, and Cluster-Model Calculation Study. J. Phys. Chem. 1995, 99, 3704–3710. [Google Scholar] [CrossRef]
- Jensen, M.B.; Pettersson, L.G.M.; Swang, O.; Olsbye, U. CO2 Sorption on MgO and CaO Surfaces: A Comparative Quantum Chemical Cluster Study. J. Phys. Chem. B 2005, 109, 16774–16781. [Google Scholar] [CrossRef]
- Podobiński, J.; Zimowska, M.; Samson, K.; Śliwa, M.; Datka, J. Ethoxy Groups on ZrO2, CuO, CuO/ZrO2 Al2O3, Ga2O3, and NiO. Formation and Reactivity. Molecules 2023, 28, 3463. [Google Scholar] [CrossRef]
Figure 1.
(A)—the spectra recorded upon the adsorption of doses of CO2 (ca. 10 µmol/g) on ZnO at RT. (B)—the spectra of OH groups on activated ZnO, upon CO2 adsorption and difference spectrum; (C)—the integrated intensity of the carbonate 1337 cm−1 band as a function of the concentration of adsorbed CO2. ◯☐△ represent the results obtained in three independent experiments.

Figure 2.
(A)—the spectra recorded upon the adsorption of doses of CO2 (ca. 3 µmol/g) on Ga2O3 at RT; (B)—the spectra of OH groups on activated Ga2O3, upon CO2 adsorption and difference spectrum.
Figure 2.
(A)—the spectra recorded upon the adsorption of doses of CO2 (ca. 3 µmol/g) on Ga2O3 at RT; (B)—the spectra of OH groups on activated Ga2O3, upon CO2 adsorption and difference spectrum.

Figure 3.
(A)—the spectra recorded upon the adsorption of doses (ca. 10 µmol/g) on MgO at RT; (B)—the spectra of OH groups on activated MgO, upon CO2 adsorption at RT and difference spectrum.
Figure 3.
(A)—the spectra recorded upon the adsorption of doses (ca. 10 µmol/g) on MgO at RT; (B)—the spectra of OH groups on activated MgO, upon CO2 adsorption at RT and difference spectrum.

Figure 4.
Dehydroxylation of oxides: ZnO (A,B), Ga2O3 (C,D), and MgO (E,F). The spectra of OH groups (A,C,E) and of carbonate species (B,D,F) on oxides activated at 720 and 900 K (or 720 and 820 K for ZnO).
Figure 4.
Dehydroxylation of oxides: ZnO (A,B), Ga2O3 (C,D), and MgO (E,F). The spectra of OH groups (A,C,E) and of carbonate species (B,D,F) on oxides activated at 720 and 900 K (or 720 and 820 K for ZnO).
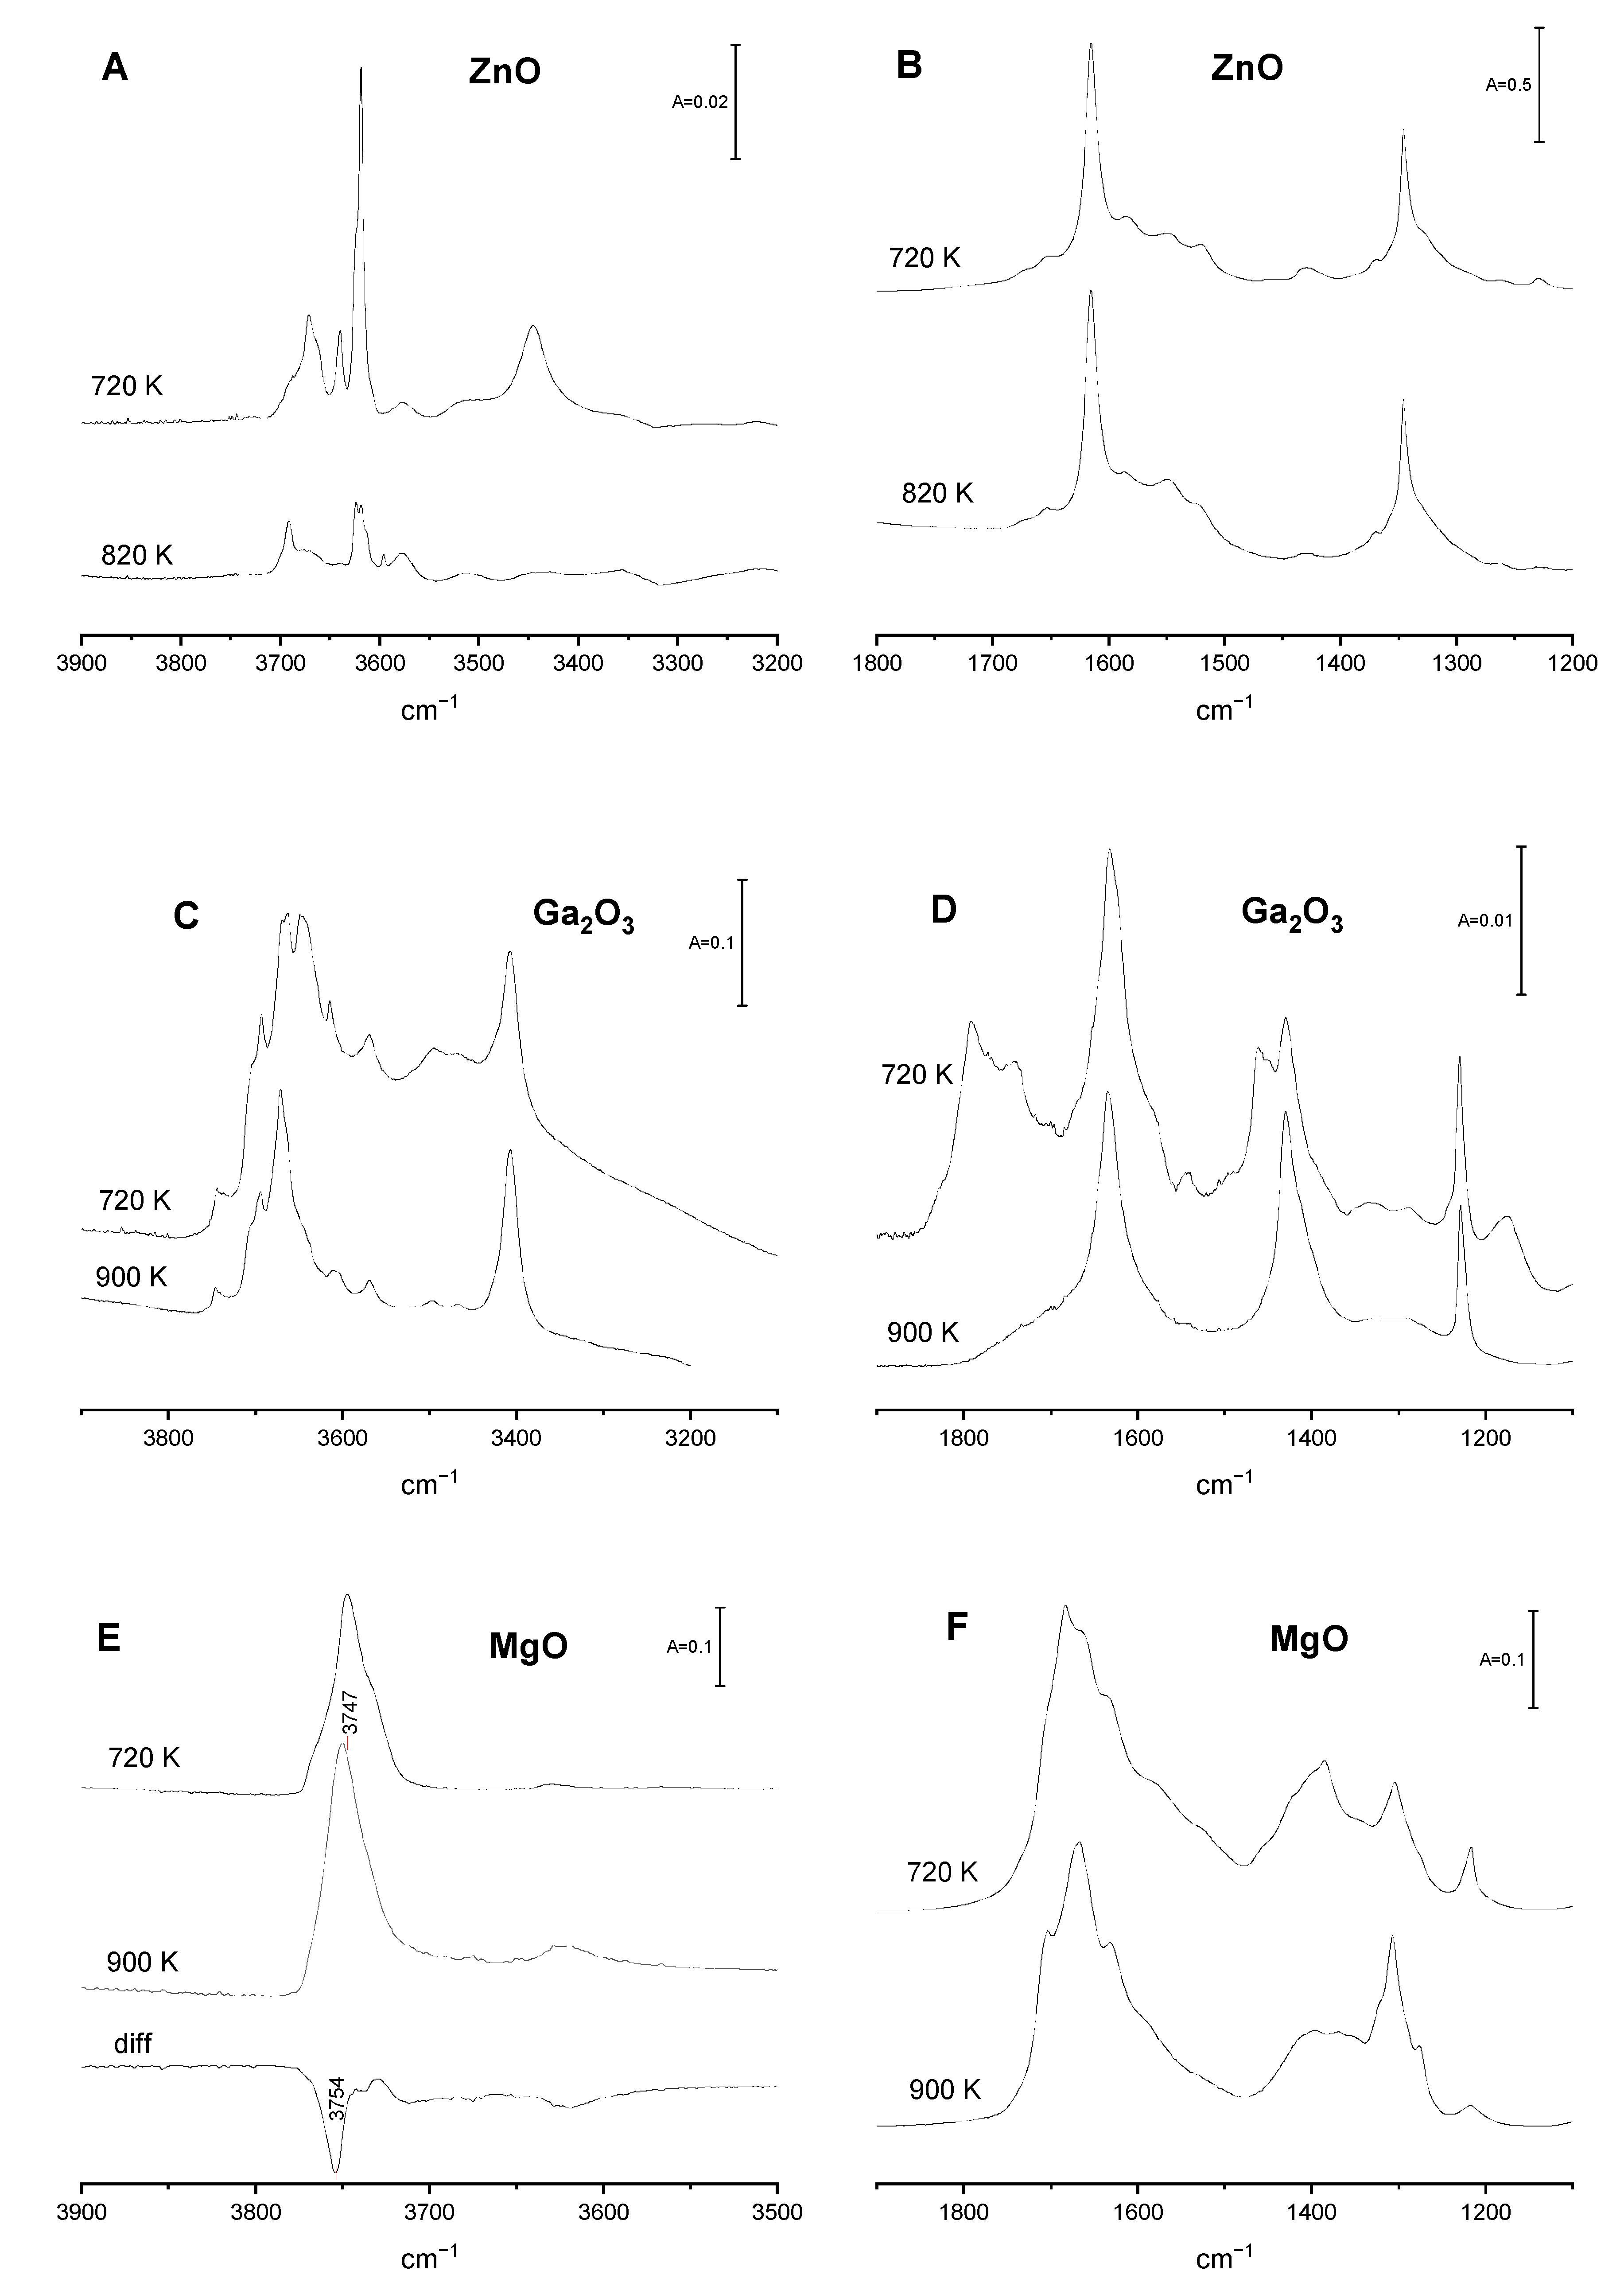
Figure 5.
The spectra of CO2 adsorbed at RT on Al2O3. Spectra a, b, and c were recorded upon the adsorption of excess of CO2, 1 min evacuation at RT, and 30 min desorption at 470 K to cold trap.
Figure 5.
The spectra of CO2 adsorbed at RT on Al2O3. Spectra a, b, and c were recorded upon the adsorption of excess of CO2, 1 min evacuation at RT, and 30 min desorption at 470 K to cold trap.

Table 1.
The concentration of O2− and OH− (µmol/g) on the surfaces of ZnO, Ga2O3 and MgO activated at various temperatures.
Table 1.
The concentration of O2− and OH− (µmol/g) on the surfaces of ZnO, Ga2O3 and MgO activated at various temperatures.
| Sample | Activ. Temp./K | IR Data | Desorption Data | ||
|---|---|---|---|---|---|
| O2− | OH− | O2 + OH− | |||
| ZnO | 720 | 31 | 4 | 35 | 39 |
| 820 | 28 | 2 | 30 | 35 | |
| Ga2O3 | 720 | 1 | 4 | 5 | 6 |
| 900 | 0 | 3 | 3 | 3 | |
| MgO | 720 | 17 | 14 | 31 | 28 |
| 900 | 27 | 1 | 28 | 25 | |
Disclaimer/Publisher’s Note: The statements, opinions and data contained in all publications are solely those of the individual author(s) and contributor(s) and not of MDPI and/or the editor(s). MDPI and/or the editor(s) disclaim responsibility for any injury to people or property resulting from any ideas, methods, instructions or products referred to in the content. |
© 2024 by the authors. Licensee MDPI, Basel, Switzerland. This article is an open access article distributed under the terms and conditions of the Creative Commons Attribution (CC BY) license (https://creativecommons.org/licenses/by/4.0/).
Share and Cite
MDPI and ACS Style
Podobiński, J.; Datka, J. Basic Properties of ZnO, Ga2O3, and MgO—Quantitative IR Studies. Catalysts 2024, 14, 106. https://doi.org/10.3390/catal14020106
AMA Style
Podobiński J, Datka J. Basic Properties of ZnO, Ga2O3, and MgO—Quantitative IR Studies. Catalysts. 2024; 14(2):106. https://doi.org/10.3390/catal14020106
Chicago/Turabian StylePodobiński, Jerzy, and Jerzy Datka. 2024. "Basic Properties of ZnO, Ga2O3, and MgO—Quantitative IR Studies" Catalysts 14, no. 2: 106. https://doi.org/10.3390/catal14020106
Note that from the first issue of 2016, this journal uses article numbers instead of page numbers. See further details here.