Article

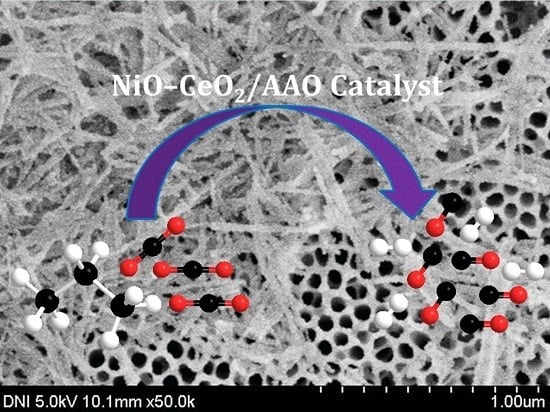
Anodized Aluminum Oxide Supported NiO-CeO2 Catalyst for Dry Reforming of Propane

1
Department of Chemical Engineering, Jeju National University, Jeju 63243, Korea
2
Department of Chemical Engineering, Kyungpook National University, Daegu 41566, Korea
*
Author to whom correspondence should be addressed.
Catalysts 2016, 6(10), 154; https://doi.org/10.3390/catal6100154
Submission received: 29 July 2016 / Revised: 15 September 2016 / Accepted: 26 September 2016 / Published: 29 September 2016
(This article belongs to the Special Issue Reforming Catalysts)

Abstract

:
Nano-porous anodic aluminum oxide (AAO) supported Ni-Ce mixed metal oxide catalysts were prepared and tested for dry reforming of propane to produce synthesis gas. The presence of Ce efficiently suppressed the nickel particle sintering and improved the reducibility of nickel oxide supported on the AAO. The prepared NiO-CeO2/AAO catalyst was highly efficient for the dry reforming of propane (DRP) with CO2 over a temperature range of 480–580 °C. The catalyst achieved the best reforming performance of 90%–97%, and a H2/CO ratio close to 1.37 at 580 °C. The AAO supported NiO-CeO2 catalyst can be a promising catalytic system for DRP.

Graphical Abstract

1. Introduction

The energy-rich gas mixture consisting of hydrogen (H2) and carbon monoxide (CO), called synthesis gas or syngas, is an important intermediate for the production of value-added chemicals and liquid fuels [1,2,3]. Dry reforming of methane with CO2 to produce synthesis gas is a well-known process that has been extensively studied due to its industrial importance. During the last decade, the work in this area has been extended to other hydrocarbons such as ethane and propane [4,5,6,7,8,9,10,11,12,13], since ethane and propane are more readily activated at relatively low temperatures than methane. Up to now, the dry reforming of hydrocarbons has been investigated with various catalysts, including noble metals as well as non-noble metals [14,15]. Among them, nickel-based catalysts are generally preferred because it is easily available and inexpensive. However, the major drawback of nickel regarding the dry reforming of hydrocarbon is coking [16,17,18,19]. Therefore, much attention has been paid to the development of more reliable Ni-based catalysts with anti-coking performance. The use of Lewis bases such as magnesium oxide (MgO) and calcium oxide (CaO) as promoters can enhance the chemisorption of CO2 that in turn reacts with C to form CO, thereby reducing the deposition of coke. Lanthanide oxides (e.g., CeO2 and La2O3) are able to store and release oxygen, and the lattice oxygen species in these redox oxides can react with deposited carbon, leading to the removal of carbon.
Recently, anodic oxidation technology has been applied to prepare catalyst supports, which offers a strong metal-support interaction. Porous anodic aluminum oxide (AAO) templates are one of the most interesting structures because of their unbranched, controllable and nearly uniform pores [20,21,22]. The catalyst pore structure at the scale of 10–100 nm can affect the flow of reagent, the distribution of active sites, and the contact time between reacting gas and catalyst. Hence, the AAO can be a highly efficient catalyst support structure for applications in catalytic reforming reactions.
In the present investigation, the dry reforming of propane (DRP) with carbon dioxide (CO2) was carried out over Ni-Ce oxides supported on the AAO as the catalyst. A series of NiO-CeO2/AAO catalysts with different Ni/Ce ratios were prepared and their physicochemical properties were systematically analyzed before and after the reforming reactions. The reactivity towards the DRP and the resistance against carbon deposition over different NiO-CeO2/AAO catalysts were examined in a temperature range of 480–580 °C. The objectives were not only to obtain optimized, efficient NiO-CeO2/AAO catalysts for practical applications but also to gain a better understanding of the fundamental aspects of the DRP process.

2. Results and Discussion

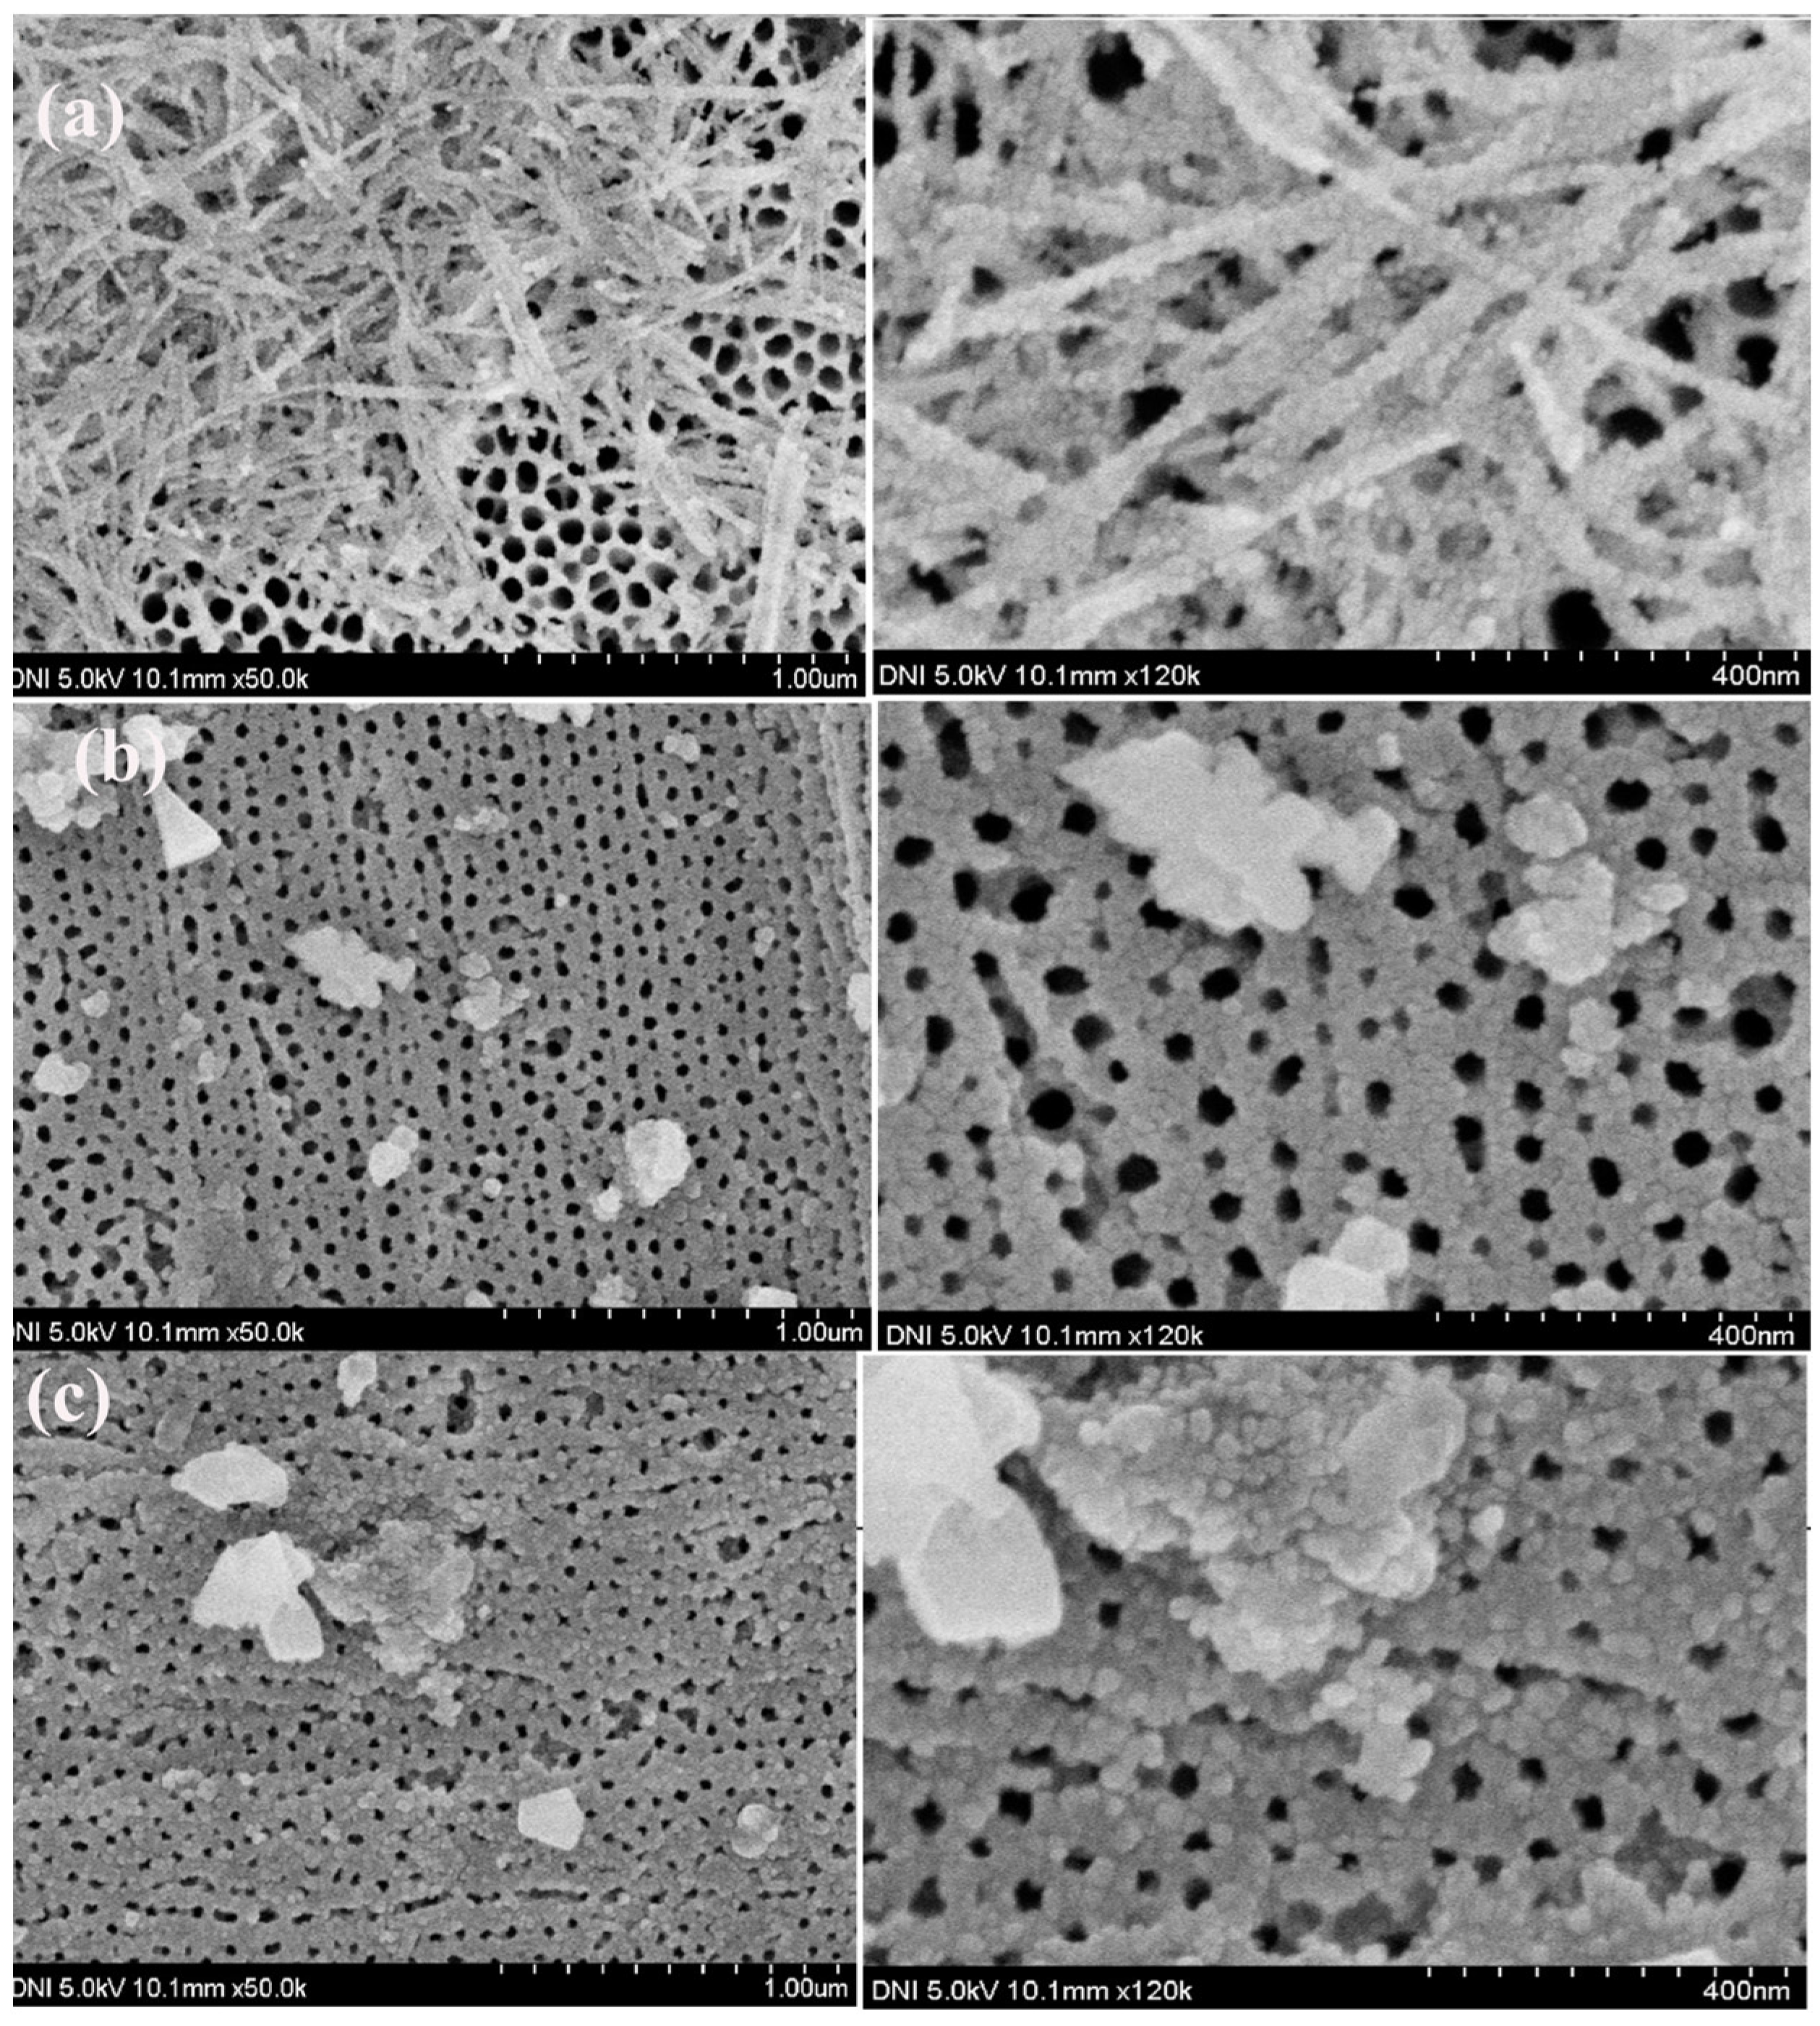
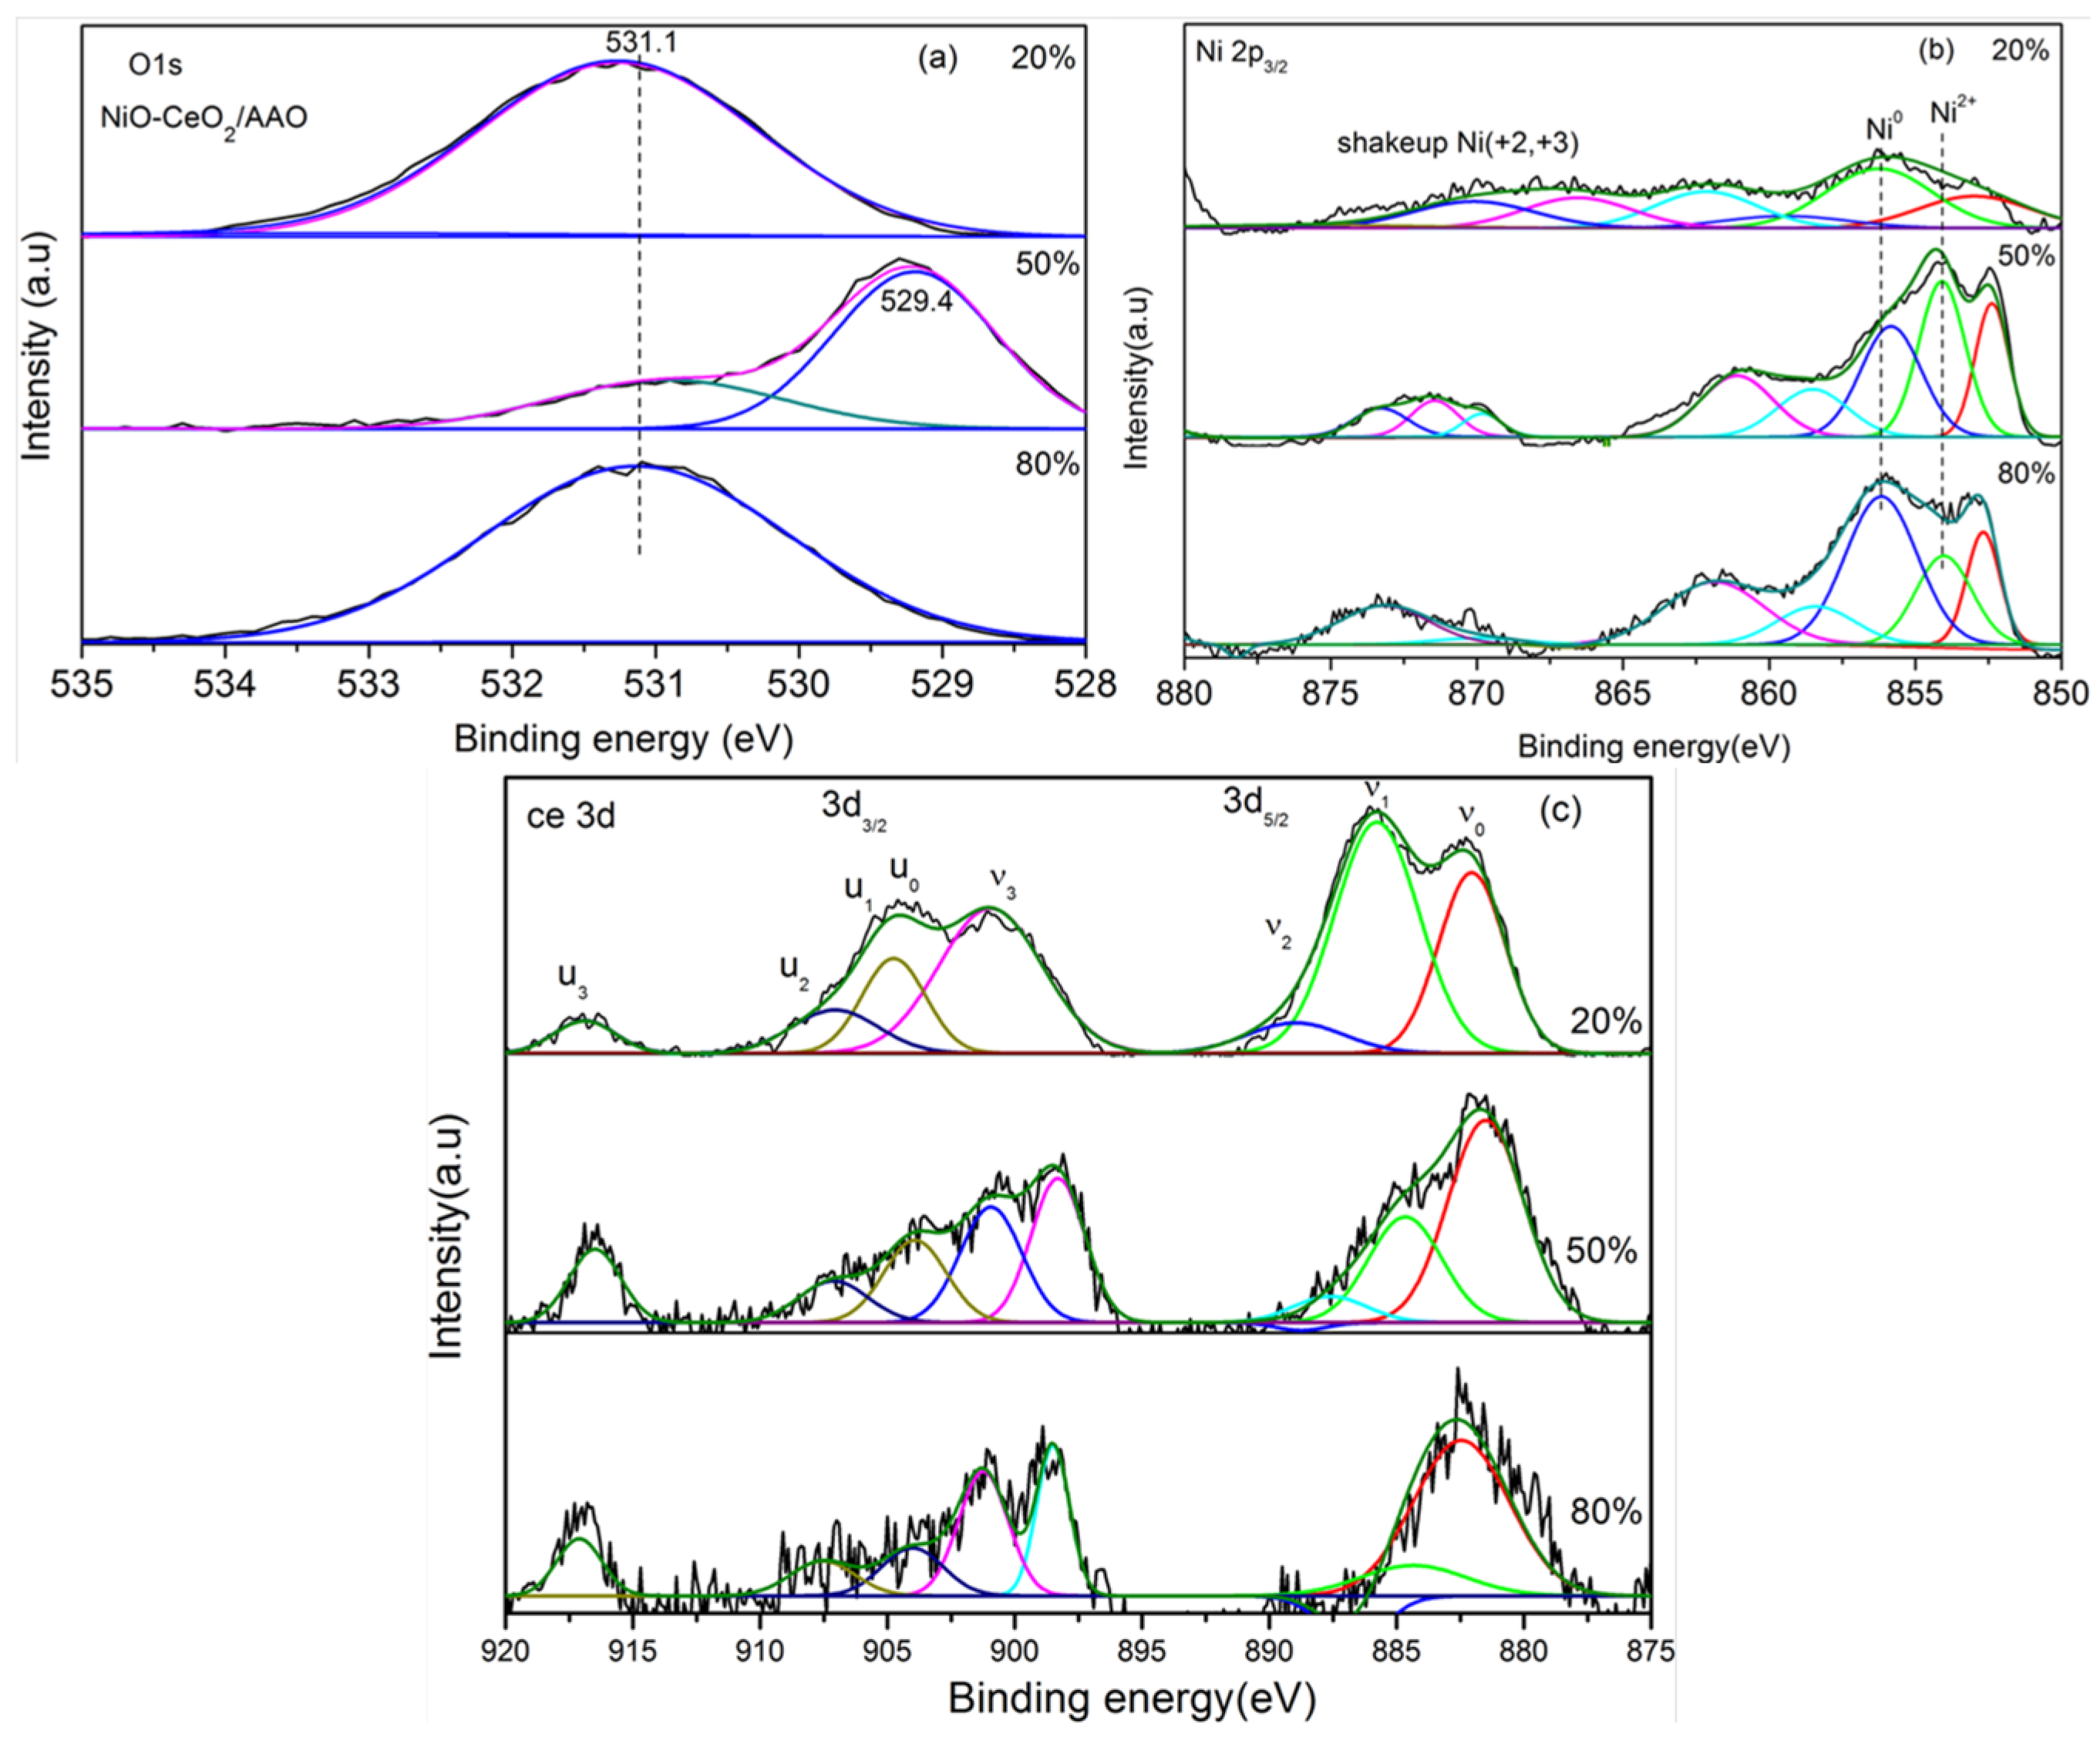
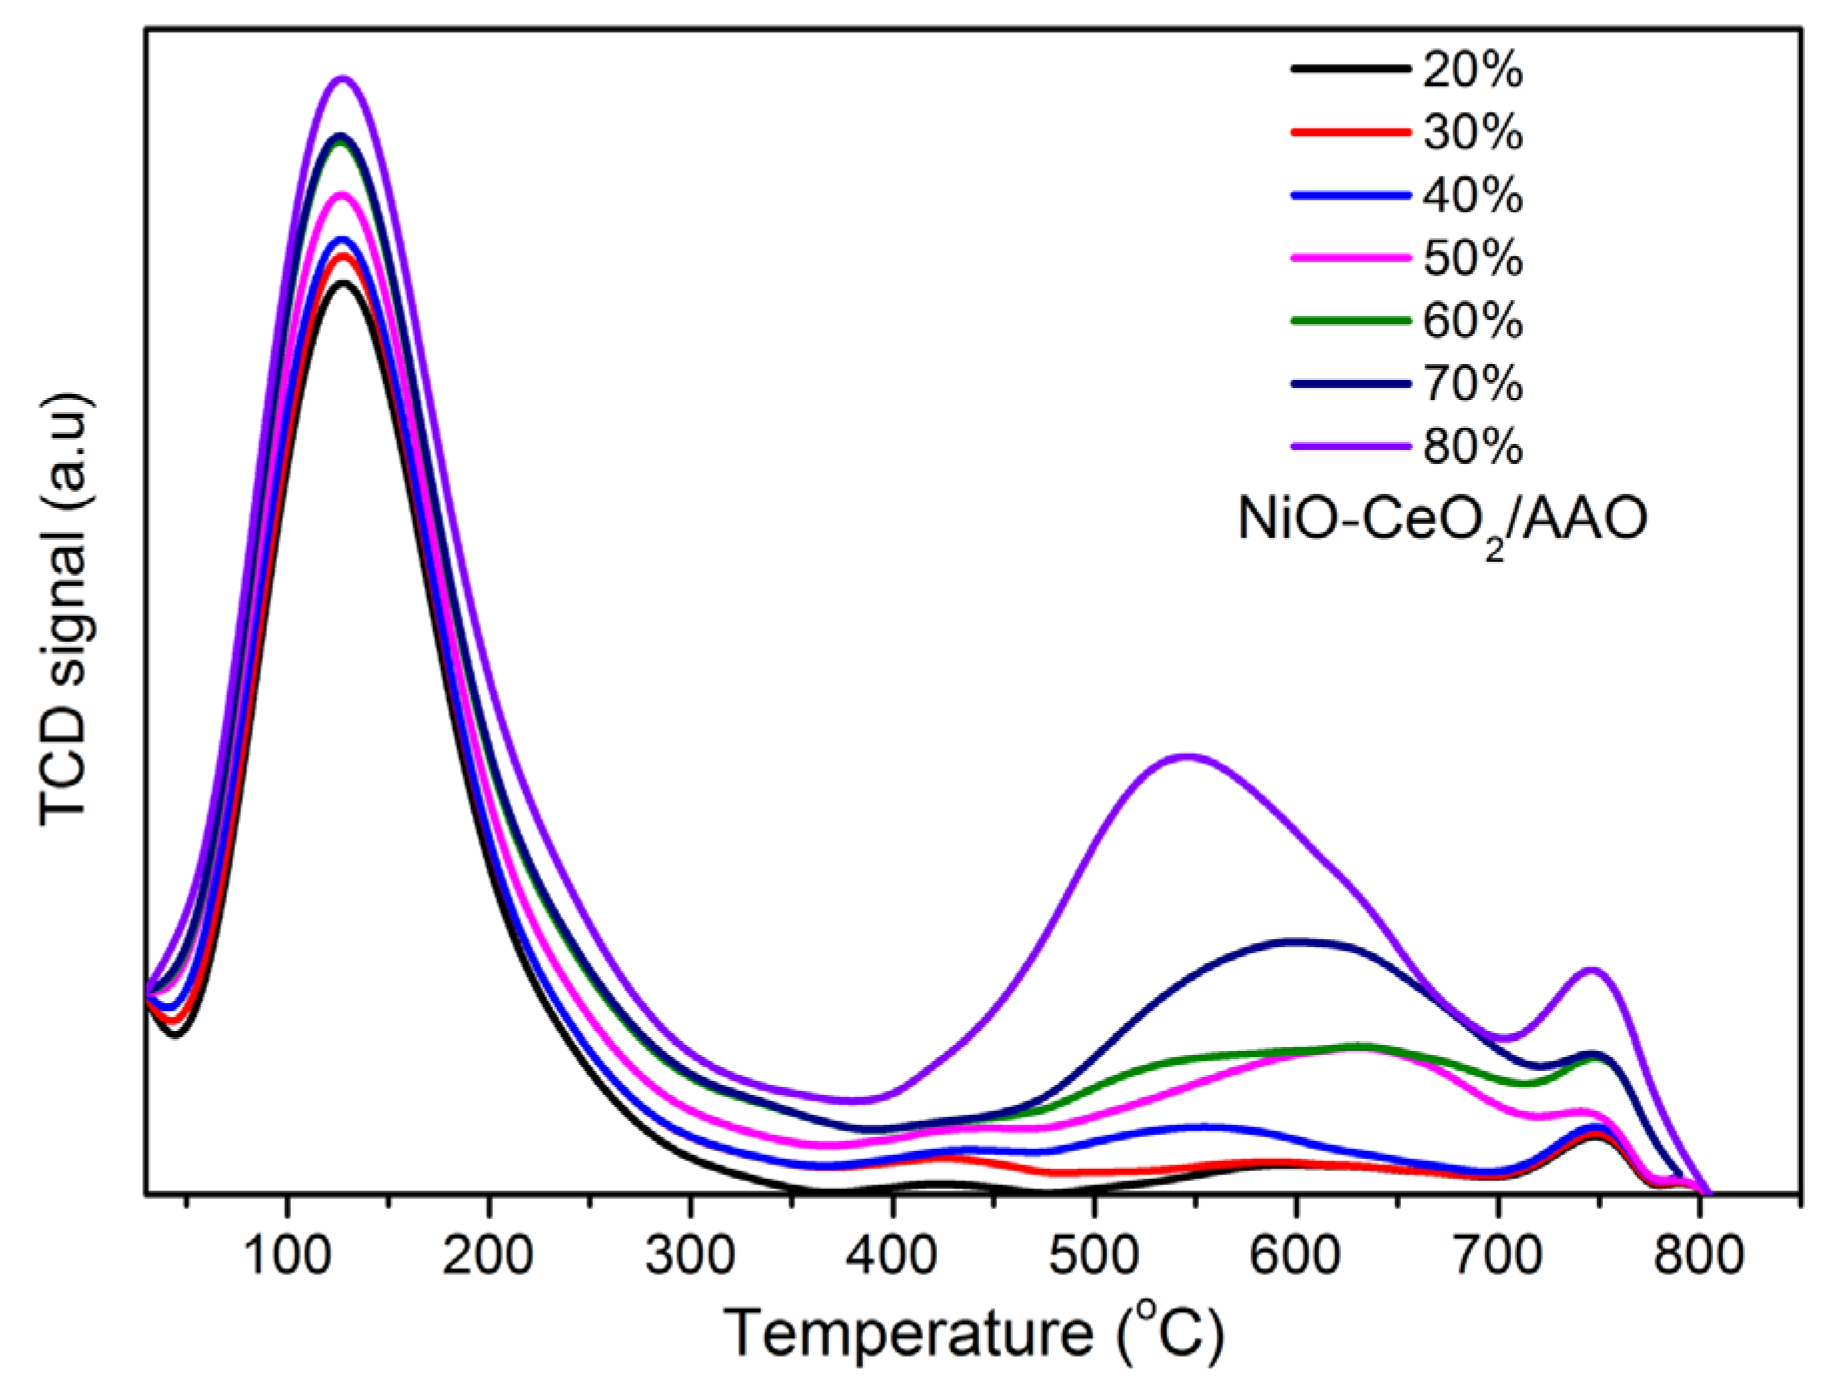
2.1. Characterization of the Catalyst before Reaction

Figure 1 presents the X-ray diffractograms of a series of 20%~80% NiO-CeO2/AAO catalysts. Figure 1a shows the X-ray diffraction pattern of the AAO support itself, which presents two sharp peaks at 2θ = 45° and 66.2° corresponding to the characteristic peaks of amorphous γ-alumina. In all cases (Figure 1b–h), the characteristic peaks of CeO2 cubic phase (2θ = 28.4°, 32.94°, 47.3° and 56.2°) appeared, which well match with JCPDS-ICDD PDF No. 43-1002. The catalyst samples also exhibited weak and broad peaks at 2θ = 36.4°, 42.6° and 64.4°, corresponding to NiO phase (ICDD PDF No. 73-1523), when the NiO concentration was more than 50%. The weak and broad peaks indicate that NiO crystallites are finely dispersed in the CeO2/AAO matrix. The characteristic diffraction peaks of NiO were well recognizable for the 60%~80% NiO-CeO2/AAO, but their intensities diminished when decreasing the Ni loading. Ni in the NiO-CeO2/AAO catalyst can exist in either crystallized NiO phase or Ni2+ ions fused into the ceria lattice. The average crystallite size and lattice strain of both CeO2 and NiO were estimated using Scherrer’s relation, which were presented in Table 1. As seen in Table 1, the bigger the crystalline size of ceria, the smaller the lattice strain. This result suggests that some nickel ions (Ni2+) were incorporated into the CeO2 lattice and formed a solid solution of NiO and CeO2 (Ce1−xNixO2−δ) since the size of Ni2+ ion is smaller than that of Ce4+ ion [23,24,25,26]. Higher NiO loading inhibited the growth of CeO2 [27,28,29].
The surface morphology of the bare AAO support was examined with field emission scanning electron microscopy (FE-SEM). As seen in Figure 2, it showed a well-defined porous structure with a homogeneous pore size distribution. The morphologies of 20%, 50% and 80% NiO-CeO2/AAO catalysts with two different magnifications (1 µm and 400 nm) are shown in Figure 3. The surface of the NiO-CeO2/AAO catalysts showed segregated agglomerations of NiO and CeO2 nanoparticles with lack of uniformity in size as well as a great heterogeneity in morphology. From Figure 3a, a well-defined nanorod like feature can be seen for the 20% NiO-CeO2/AAO catalyst, as can the agglomerations of nanoparticles for the 50% and 80% NiO-CeO2/AAO (Figure 3b,c).
Figure S1 shows the temperature programmed reduction (TPR) curves for the NiO-CeO2/AAO catalysts with different Ni contents. In all cases, two reduction peaks, the first one at temperatures in the range of 208–240 °C and the second one at temperatures from 432 to 496 °C, depending on the Ni content, were observed. The first peak is due to the reduction of mildly interactive NiO with CeO2 on the AAO support [30,31,32,33]. The second one was attributed to the reduction of NiO species that was strongly interactive with CeO2. The second reduction peak for the 20% NiO-CeO2/AAO was located at around 432 °C, while that of the 80% NiO-CeO2/AAO shifted to 496 °C, revealing a stronger interaction of NiO with CeO2 on the AAO support [31,34]. Namely, the reduction of NiO (to Ni) that is strongly bound to the CeO2 requires a higher temperature.
The valence state and fraction of Ce and Ni ions on the surface of the 20%, 50%, and 80% NiO-CeO2/AAO catalysts before dry reforming reactions were studied by X-ray photoelectron spectroscopy (XPS). Typical XPS spectra of O 1s and Ni 2p, Ce 3d of the catalysts before the reaction are given in Figure 4. The O 1s spectra of the 50% NiO-CeO2/AAO catalyst showing a main peak centered at 529.4 eV has been assigned to the lattice oxygen in CeO2 and NiO (O2− species). The additional peak at 531.1 eV can be allotted to oxygen ion deficiencies in the subsurface layer of metal oxides arising from the Ce-Ni solid solution formation [35]. The 20% and 80% NiO-CeO2/AAO catalysts showed only one peak at 531.1 eV which was ascribed to the different oxygen defects. For the 20%, 50% and 80% NiO-CeO2/AAO catalysts, the Ni 2p region resolved by curve fitting contained both Ni0 (~853.5 eV) and Ni2+ species (~856.7 eV). All three catalysts showed two distinct bands at around 853.5 eV and 856.8 eV that were correlated to the interaction between the support and the respective Ni0 and Ni2+ atoms. The fraction of Ni0 was in the order of 80% > 50% > 20% NiO-CeO2/AAO. Meanwhile, there was no significant variation observed in Ni2+ distribution on the surface. In the Ce 3d spectrum, eight peaks were observed as shown in Figure 4c. One can divide these peaks into four groups and assign them to four different spin-orbit doublets, i.e., (υ0, u0), (υ1, u1), (υ2, u2), and (υ3, u3), respectively. Among them, those labelled “υ” are for 3d5/2 and those labelled “u” are for 3d3/2. The doublets (υ0, u0), (υ2, u2) and (υ3, u3) correspond to the various states of Ce4+, while the doublet (υ1, u1) is considered as the character of Ce3+. The deconvoluted binding energies of Ce 3d spectra are summarized in Table 2, which distinctly shows that the fraction of Ce3+ (intensities of υ1 and u1) significantly decreased on account of the formation of CeO2 for the 80% NiO-CeO2/AAO. It is obvious that the observed binding energies of Ce4+ and Ce3+ are consistent with the previous reports [35,36]. The appearance of characteristic Ce3+ bands are labelled at 884.4 eV (υ1) and 900.8 eV (u0) suggests that Ce existed in both Ce3+ and Ce4+ oxidation states on the surfaces of the 20%, 50% and 80% NiO-CeO2/AAO. It can be seen that the intensity of Ce3+ 3d peaks in the 20%, 50% and 80% NiO-CeO2/AAO samples apparently increased when increasing the ceria content. The presence of Ce3+ aids the interaction with the peripheral NiO species to form the solid solution.

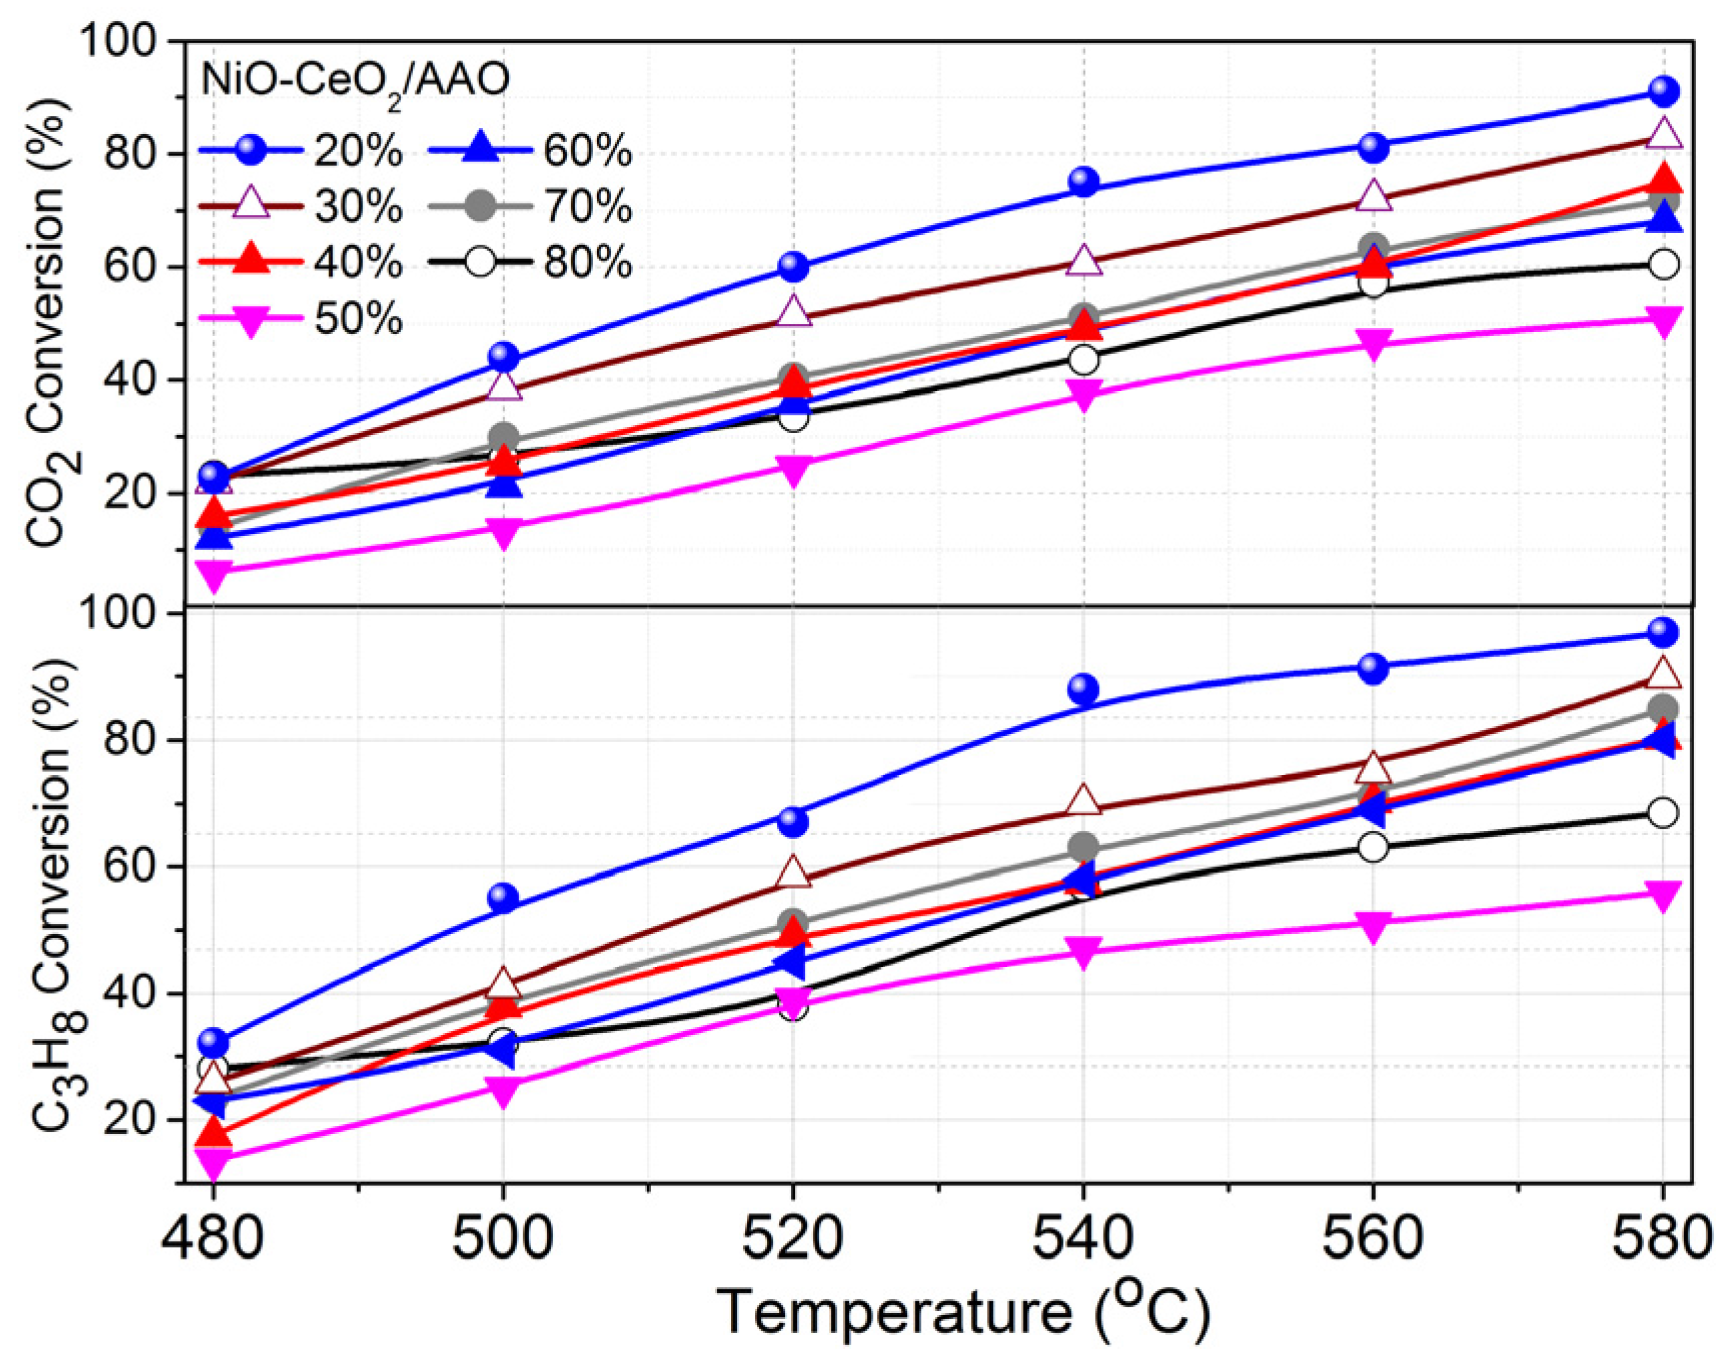
2.2. Propane/CO2 Reforming

The performance of the catalysts with different Ni and Ce loadings were examined in terms of C3H8 and CO2 conversions at various temperatures up to 580 °C, which is illustrated in Figure 5. The obtained results showed that both C3H8 and CO2 conversions were the highest with the 20% NiO-CeO2/AAO catalyst. At a lower reaction temperature of 500 °C, 20% and 30% NiO-CeO2/AAO catalyst exhibited 55% and 40% C3H8 conversion, and 45% and 40% CO2 conversion, respectively, while at 580 °C the same catalysts exhibited 97% and 90% C3H8 conversion and 90% and 80% CO2 conversion, respectively. As expected from the strong endothermic reforming reaction (∆H0298 K = 644.8 kJ·mol−1), the catalysts explored in this work showed their best catalytic activity at 580 °C. Increasing the nickel concentration from 20% to 80% tended to decrease the propane and CO2 conversion due to the lower nickel dispersion at higher nickel loadings. Also, it is clear that the conversion efficiency of CO2 was lower than that of C3H8 for all the catalysts, which can be explained by the additional propane consumption caused by its cracking into carbon. The C3H8 cracking into carbon and H2 consumed more C3H8 than the stoichiometric value. Meanwhile, the 50% NiO-CeO2/AAO catalyst was less active for propane reforming when compared with 40% and 60% catalyst. This might be due to the low BET surface area and large crystal size (23 nm) of ceria (Table 1).
The product concentrations of H2 and CO obtained during the DRP with various NiO-CeO2/AAO catalysts are represented in Figure 6, where it can be seen that the CO and H2 concentrations increased when gradually increasing the reaction temperature. The H2 concentration was higher than that of CO, as the temperature increased, because of the C3H8 cracking. From the effects of temperature on the conversion and product concentrations, it can be concluded that increasing the temperature is beneficial for the improvement in the conversion and the generation of syngas. Under the tested conditions, the adequate temperature appears to be 580 °C for the 20% NiO-CeO2/AAO. The H2/CO ratios acquired with the NiO-CeO2/AAO catalysts are shown in Figure S2 as a function of reaction temperature. At temperatures in the range of 480–580 °C, the 20% and 30% NiO-CeO2/AAO catalysts showed somewhat higher H2/CO ratio than the other ones. The enhanced catalytic activity of the 20% and 30% NiO-CeO2/AAO catalysts may be due to the ultrafine NiO/CeO2 nanoparticles or nanorods with high dispersion over the AAO support. It has been reported that the stability and dispersion of metal is significantly improved by the metal-oxygen species formed on the surface of CeO2 [37]. It has also been well recognized that the state of metallic Ni phases such as reduced and dispersed phases as well as the redox ability of CeO2 has a strong influence on the catalytic activity of CeO2-based Ni catalyst [38].
The catalytic stability of the NiO-CeO2/AAO catalysts was examined over the period of 55 h at 500 °C, which is shown in Figure 7. It appears that the 20% NiO-CeO2/AAO showed higher and more stable catalytic activity during the DRP, compared to the other catalysts. For instance, the C3H8 and CO2 conversions over the 20% NiO-CeO2/AAO catalyst was 54% and 43% at the start of the reaction, which decreased to 49% and 39%, respectively, after 55 h of the reaction. These small decreases in the C3H8 and CO2 conversions confirm its higher stability over the other catalysts. The higher activity and long-term stability of the 20% NiO-CeO2/AAO are credited to its features such as high thermal stability, redox behavior, reducibility and surface acidity [39]. The stability of the catalysts was also examined in terms of H2 and CO concentrations under the same conditions (Figure 7b). Decreases in the C3H8 and CO2 conversion efficiencies as well as in the H2 and CO concentrations with elapsed time were observed for the catalysts. For the 20% NiO-CeO2/AAO catalyst, the H2 and CO concentrations slightly increased in the early stage, probably because some further reduction of the metal oxide species occurred. As presented in Figure 7a,b, the catalytic stability did not decrease much during the 10-h reforming reaction on stream.

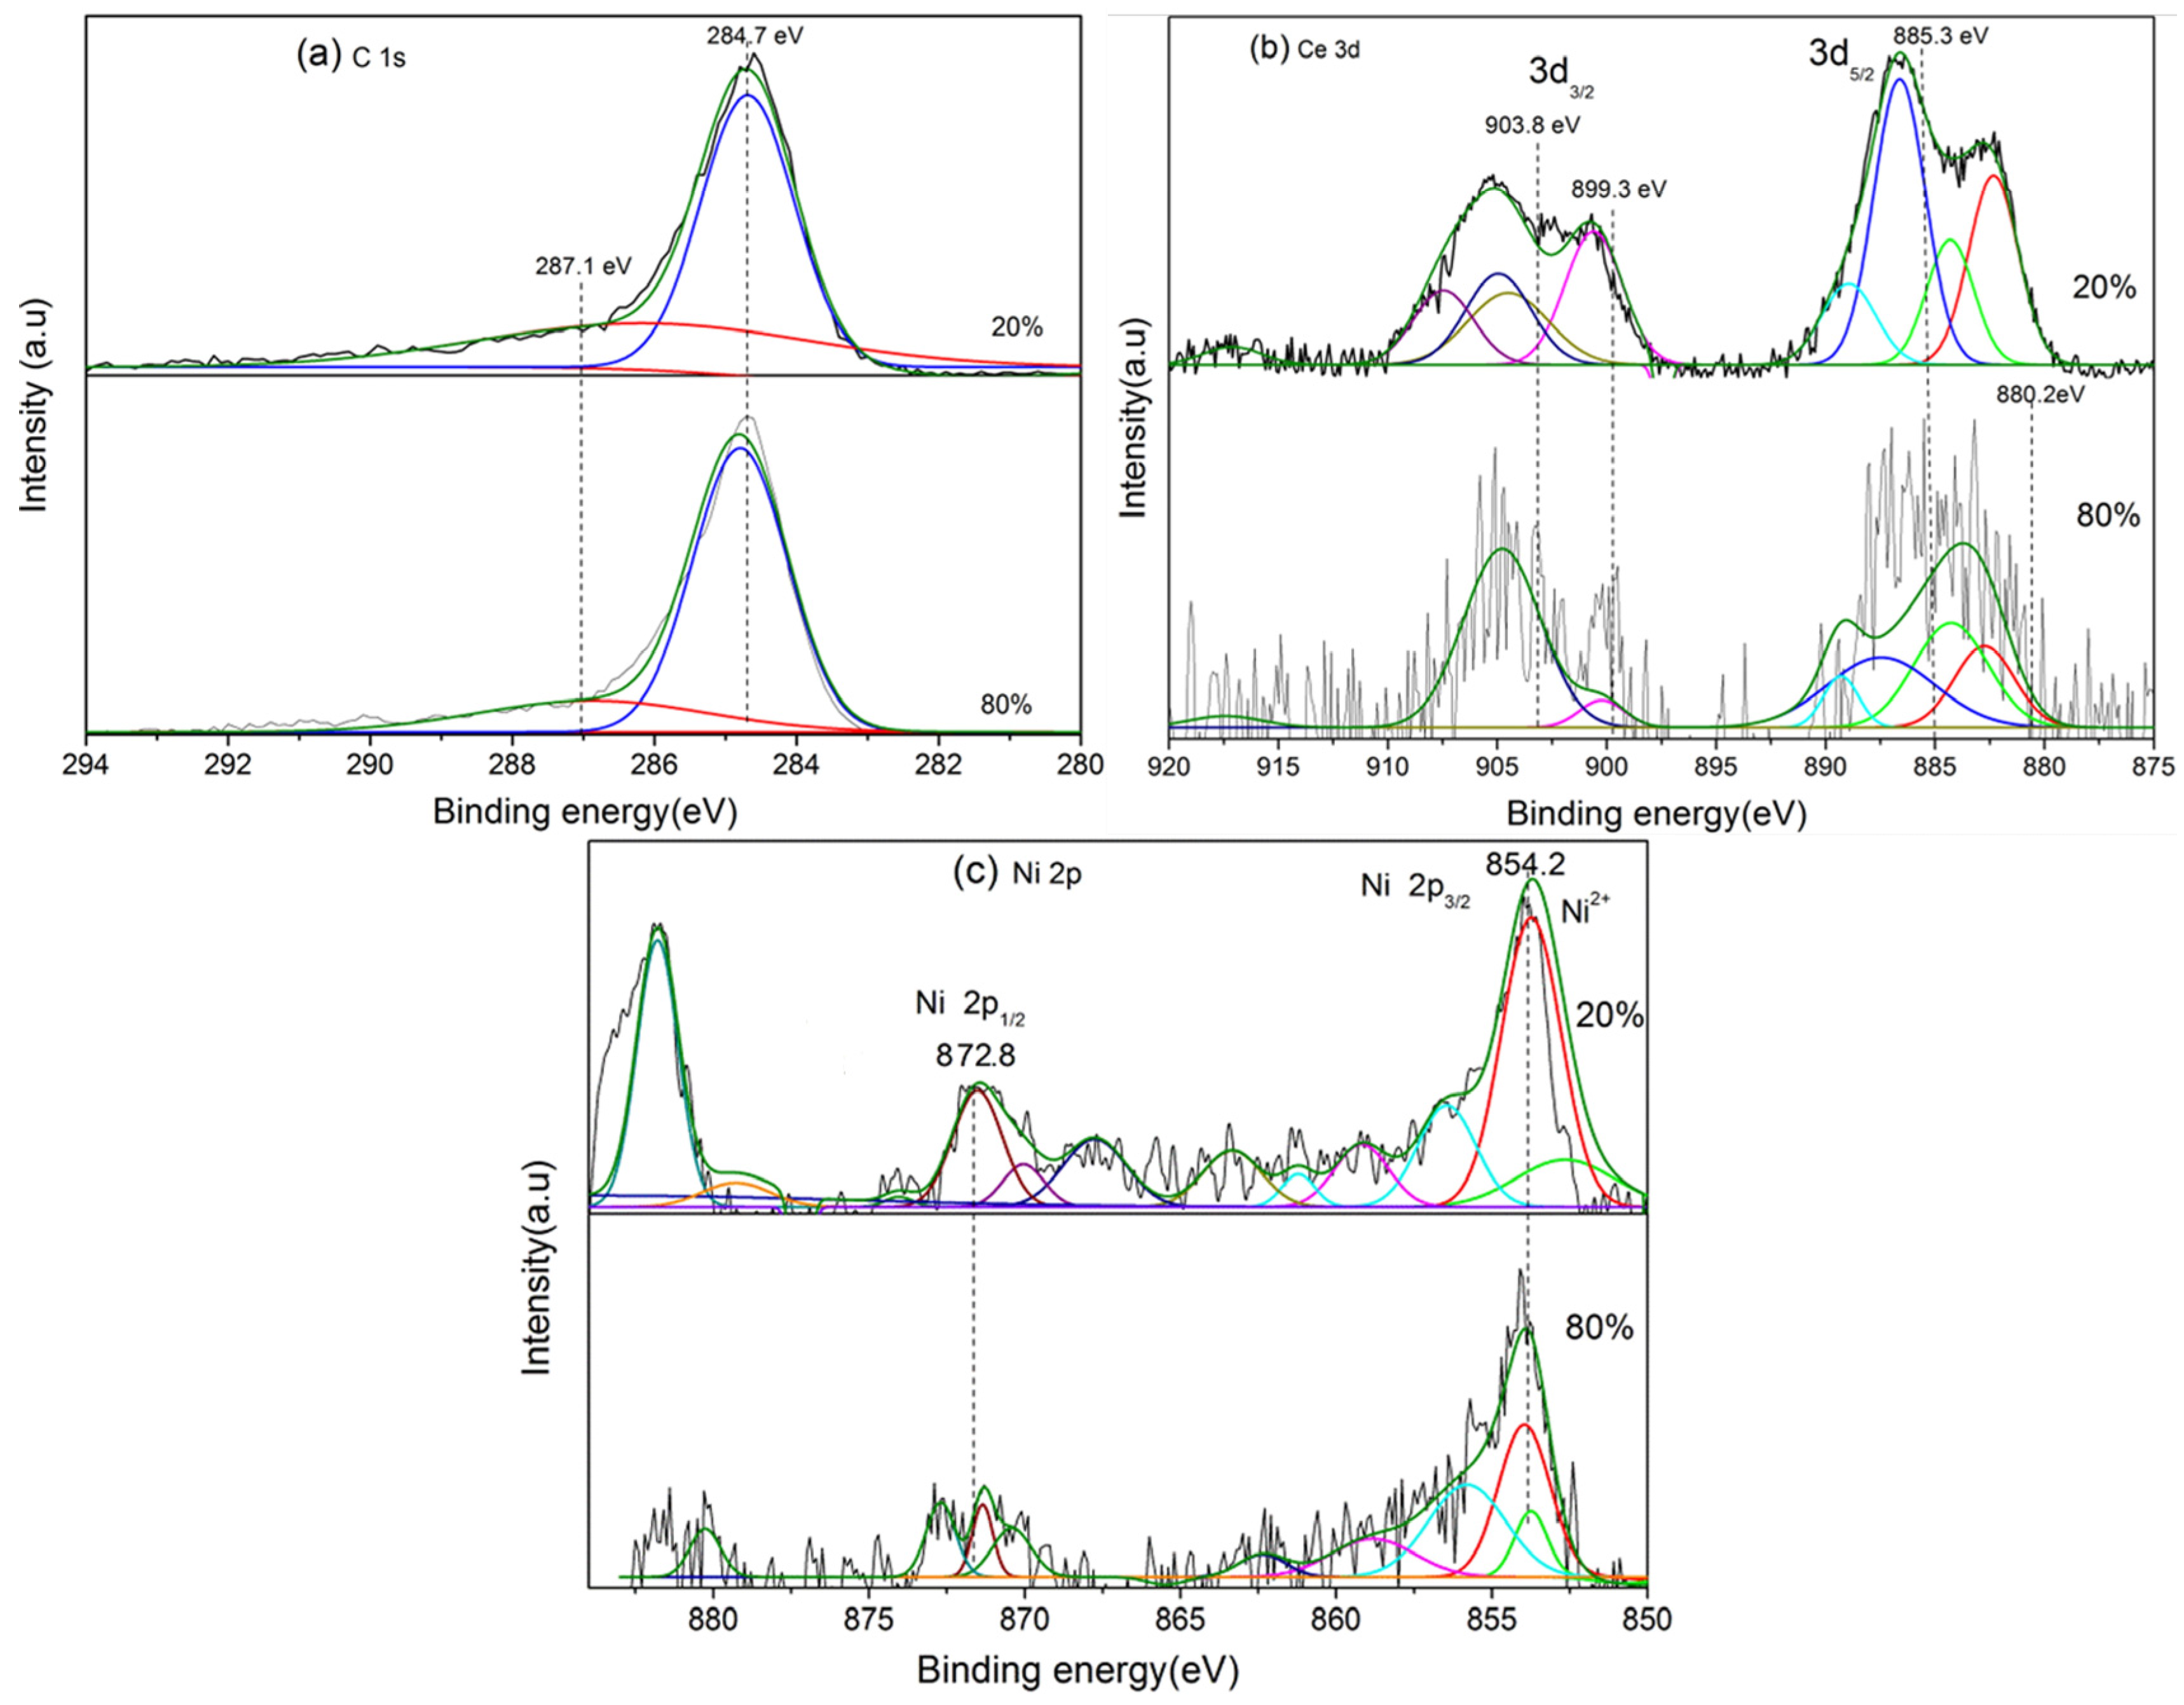
2.3. Characterization of the Catalyst after Reforming

One of the major drawbacks regarding the dry reforming of hydrocarbon is catalyst deactivation mainly due to the deposition of carbon [8,26,40]. So as to investigate the formation of carbon during the reforming reaction, the spent catalysts were collected after 10 h DRP reaction and characterized by FE-SEM, transmission electron microscopy (TEM), Raman spectroscopy, XPS and temperature programmed oxidation (TPO) analysis. Figure 8 shows the FE-SEM images of the spent catalysts. The FE-SEM images of the spent catalysts exhibited changes in the morphology from the fresh ones. Unlike the fresh catalysts, heterogeneous morphologies were observed in the used catalysts due to the presence of carbon deposits. As seen, the morphology of the deposited carbon over the 20% NiO-CeO2/AAO was quite different from the cases of 30%, 50%, and 80% NiO-CeO2/AAO; limited filamentous carbon was produced for the 20% and 30% NiO-CeO2/AAO catalysts, while in the cases of the 50% and 80% NiO-CeO2/AAO, nearly all active sites were veiled by long carbon filaments. Energy dispersive X-ray (EDX) analysis of the used catalyst (20% NiO-CeO2/AAO) is shown in Figure S3, where the elemental composition is also provided. In the used catalyst, the presence of carbon can clearly be seen.
The deposition of the carbonaceous material on the catalyst surface during the reforming was further evidenced by the TEM images shown in Figure 9. The TEM images definitely show the formation of carbonaceous material on the catalyst surface. The TEM images of the used catalysts depict carbon nanotubes formed during the DRP with diameters ranging from 10 to 100 nm along with NiO and CeO2 particles embedded in them.
The Raman spectra of the spent catalysts (20%–80% NiO-CeO2/AAO) are presented in Figure 10. It is noticed that all the used catalysts invariably showed two distinct bands, one located at 1590–1600 cm−1 and the other at 1380–1400 cm−1. The former and the latter are ascribed to the amorphous carbon and the graphitic carbon, respectively [41,42,43]. For the 70% NiO-CeO2/AAO catalyst, the intensity of the D band is stronger than that of the G band, implying that amorphous carbon is predominant. The relative ratio of the D band intensity to the G band intensity was 1.37 for the spent 80% NiO-CeO2/AAO catalyst, and 1.06 for the spent 20% NiO-CeO2/AAO catalyst. These results demonstrate that the carbon deposited on the 20% NiO-CeO2/AAO catalyst was highly graphitized, which agrees well with the TEM images. In this figure, a few peaks corresponding to CeO2 can also be observed for all the catalysts, indicating that the formation of carbon is less when ceria loading on the AAO support is higher and there is no carbon deposited on CeO2.
The catalyst deactivation during the reforming reaction is mainly caused by two reasons such as carbon deposition and metal sintering. The metal sintering leads to aggregation of metal particles during the reaction and causes catalyst deactivation. To date, it is well known that the deposition of carbon on the surface is one of the main reasons for catalyst deactivation. For more information on the carbon species formed during reforming reactions, we monitored the XPS scanning in the C 1s region after the reforming reaction on the 20% and 80% NiO-CeO2/AAO catalysts. The C 1s spectra in Figure 11a showed a narrow band at 284.7 eV and a shoulder peak at 287.12 eV, which reveals the presence of two types of carbonaceous species, i.e., carbonaceous layer on the surface of the grains and filaments [44,45]. These two types of carbon species may be detected at a binding energy of 284.5 eV. Also, the metal sintering is not ignorable, though the effect is limited. Here, the observed long-term stability of NiO-CeO2/AAO catalyst further reveals the limited sintering of Ni and Ce particles and good coking resistance as well. So as to understand more about it, we have compared the oxidation state of Ni and Ce before and after the reforming reaction. The XPS spectra of Ce (3d) and Ni (2p) regions for the 20% and 80% NiO-CeO2/AAO are shown in Figure 11b,c. After the reaction, the intensity of Ce3+ band was observed to decrease, which might have been due to the sintering and some Ni clusters covered by the AAO support. Here, neither sintering nor diffusion of ceria into the bulk should be put aside either. A small reduction of Ce4+ to Ce3+ can be best sensed as the small increase of the 903.9 eV and 885.3 eV intensity and also the weaker 899.3 eV and 880.2 eV components, which are the characteristics of Ce3+ [46,47]. After an elaborate analysis of the Ce 3d spectra, it can be concluded that the reduction of Ce is limited during DRP reactions. The Ni 2p spectra of the 20% and 80% NiO-CeO2/AAO catalysts are shown in Figure 11c, where the observed binding energy values at 854.2 eV (Ni 2p3/2) and 872.8 eV (Ni 2p1/2) further confirmed the presence of Ni2+ in the catalyst. In addition, the presence of metallic Ni0 and Ni2+ indicated the reduction of Ni2+ to Ni under an inert atmosphere.
The typical TPO profiles (desorbed CO2) of the spent NiO-CeO2/AAO catalysts are shown in Figure 12, which clearly showed the presence of three different types of carbonaceous species on the catalysts formed during the DRP. The first peak observed between 100 and 200 °C is attributed to the active carbon species reacted with oxygen at low temperatures. The second broad peak located at the higher temperature region (400~700 °C) is ascribed to the amorphous and/or graphitic carbon. It is obvious that the addition of CeO2 modifier had a significant effect on decreasing the intensity of this peak. The last peak at around 750 °C is attributed to the filamentous form of carbon [48]. It is obvious that the addition of this basic modifier reduced its intensity, and it can be said that the addition of this modifier enhanced the basicity of the catalyst, increased the CO2 adsorption and inhibited the CO decomposition reaction, suppressing the coke formation [48,49].

3. Materials and Methods

3.1. Preparation of AAO Support and NiO-CeO2/AAO Catalyst

Porous AAO was used as the catalyst support; it was prepared by anodization of aluminum sheet using aqueous oxalic acid solution [50,51,52,53]. Briefly, a high purity aluminum foil was anodized in the oxalic acid solution of 0.3 M at 40 V for 24 h at a temperature of 10 °C to form a porous γ-Al2O3 layer, and then, pore widening treatment was performed with the same aqueous oxalic acid solution mentioned above for 4 h at 30 °C. When the pore widening treatment was finished, it was immersed in deionized water for sufficient time to wash out the residual oxalic acid. Finally, the AAO support was calcined in air atmosphere at a temperature of 450 °C for 4 h.
Nickel and ceria were loaded onto the AAO support by impregnating with aqueous Ni(NO3)2·6H2O and Ce(NO3)3·6H2O solutions. Keeping the total molarity of the Ni and Ce at 1.0 M, the molarity of Ni was changed from 0.2 to 0.8 M. For instance, the prepared catalyst, NiO(X=0.2) + CeO2(Y=0.8) (X + Y = 1.0 M), was denoted as 20% NiO-CeO2/AAO in term of Ni molar percentage. The prepared catalysts were calcined at a temperature of 450 °C for 6 h. The content of metal oxides in the prepared NiO-CeO2/AAO catalyst was about ~4 wt % (obtained by measuring the weight of the support before and after catalyst loading).

3.2. Characterizations

The Brunauer-Emmett-Teller (BET) surface areas of the catalysts were measured with a surface area analyzer (AUTOSORB-1-MP, Quantachrome Instruments, Boynton Beach, FL, USA). Before the surface area analysis, each sample was degassed under vacuum condition at 200 °C for 4 h. The X-ray diffractograms of the catalysts were obtained by an X-ray diffractometer (XRD) (Rigaku D/max-2200H, Tokyo, Japan) with a Cu Kα radiation source. An FE-SEM (JEM-1200EX II, JEOL, Tokyo, Japan) and a TEM (JEM-2100HR, JEOL, Tokyo, Japan) at an accelerating voltage of 200 kV were employed to observe the surface structure and the distribution of the metal oxides over the AAO support. The Raman spectra of the catalyst were measured by micro-Raman microscopy (LabRm HR, Horiba Scientific, Irvine, CA, USA). The Raman spectra were excited by a 514 nm Ar+ ion laser with a power of 30 MW at room temperature. The characteristics of the catalyst surface was also examined using an XPS (VG Microtech, ESCA 2000, East Grinstead, West Sussex, UK) with monochromatic Mg Kα radiation (1253.6 eV) operated at 13 kV and 15 mA X-ray excitation source.
Temperature-programmed experiments, i.e., TPR and TPO were performed with an online gas chromatograph (Micro-GC CP-4900, Varian, Palo Alto, CA, USA) equipped with a thermal conductivity detector (TCD). The sample (100 mg) was placed on the quartz frit in the center of the reactor tube that was heated in an electric furnace. For the TPR investigation, the temperature was increased from 25 to 650 °C at a heating rate of 5 °C·min−1 and the amount of H2 uptake was monitored. The TPO experiments were performed with spent samples. First, the 100 mg of sample was heated at 450 °C for 30 min (pretreatment) and then cooled down to 20 °C in a flow of N2 (30 mL·min−1). Then the sample was ramped to 850 °C (linear heating rate of 5 °C·min−1) in a flow of 30% O2 (30 mL/min, N2 balance). The analysis of CO2 was performed with the gas chromatograph (GC) (Micro-GC CP-4900, Varian, Palo Alto, CA, USA).

3.3. Catalytic Activity Test

The DRP experiments were carried out in a self-designed thermo-catalytic fixed bed reactor. The catalyst plate (10 g, 5 cm × 6 cm) was cut into small pieces with a size of 2–3 mm2 and then packed in the reactor. The catalytic activity for the dry reforming was examined over a temperature range of 480–580 °C for all the catalysts with different Ni and Ce contents. The reactants such as C3H8 and CO2 were directed to the reactor at a proportion of 10/30/60 (C3H8/CO2/N2). The flow rate of the feed gas was 300 mL·min−1 throughout this work. The concentrations of reactants and products were analyzed by the GC. All the gases were detected in the present work by a thermal conductivity detector (TCD). The concentration of propane and CO2 are analyzed by GC (Micro-GCCP-4900; Varian, Palo Alto, CA, USA, 10 m PPQ column), the concentration of hydrogen and CO are analyzed by GC (Micro-GCCP-4900; Varian, Palo Alto, CA, USA, 10 m M5A column), and to cross check the H2 and CO concentration we used Bruker 450-GC equipped with TCD detector; and 20 m CP-Molsieve 5A column. Argon used as a carrier gas for both GC’s.
The overall reaction of propane with CO2 can be written as follows:
C3H8 + 3CO2 = 6CO + 4H2, ∆H0298K = 644.8 kJ·mol−1
As understood from Equation (1), the dry reforming of propane is a strongly endothermic reaction that is favored at high temperatures. The conversion (XA) was calculated using the Equation (2) below [8,54,55].
X A ( % ) = C A 0 C A C A 0 + ε A C A × 100 ( % )
Here, C A 0 and C A are the inlet and outlet concentrations of the reactant (C3H8 or CO2), respectively, and ε A is defined as
ε A = η X A = 1 η X A = 0 η X A = 0
where η X A = 0 indicates the total number of moles of reactants (no conversion) while η X A = 1 stands for the total number of moles of products (complete conversion). For the feed gas composition of 10/30/60 (C3H8/CO2/N2), ε A is calculated to be 0.6. Since ε A is not small, the fractional change in the volumetric flow rate with the reaction progress cannot be ignored in calculating the conversion (XA).

4. Conclusions

The DRP with CO2 was studied with the Ni-based catalysts supported on the AAO. The presence of CeO2 as a promoter had favorable effects on the catalytic activity for the dry reforming, stability and suppression of carbon deposition. Among the evaluated catalysts (20%–80% NiO-CeO2/AAO), the 20% NiO-CeO2/AAO was found to be the most active, achieving a high C3H8 conversion of 97% at 580 °C. Besides, the 20% NiO-CeO2/AAO catalyst exhibited a better stability than the others. It is also noteworthy that the CeO2 basic centers had a positive influence in improving the catalytic properties. In particular, CeO2 basic centers were able to promote the chemisorption and activation of CO2, improving the catalytic activity. Besides, the chemisorbed CO2 was also able to participate in the coke removal process and raise the catalytic stability. The deposited carbon was mainly in the form of nanotube. The graphitic carbon was observed to block the small pores of the NiO-CeO2/AAO catalyst, which led to a decrease in the catalytic dry reforming performance. Finally, it could be concluded that the AAO-supported Ni-Ce plate-type catalyst derived from the impregnation method can be considered a very interesting system in comparison with those reported in the literature.

Supplementary Materials

The following are available online at www.mdpi.com/2073-4344/6/10/154/s1. Figure S1: TPR (temperature programmed reduction) profiles of the catalysts: (a) 20% NiO-CeO2/AAO; (b) 30% NiO-CeO2/AAO; (c) 40% NiO-CeO2/AAO; (d) 50% NiO-CeO2/AAO; (e) 60% NiO-CeO2/AAO; (f) 70% NiO-CeO2/AAO; (g) 80% NiO-CeO2/AAO; Figure S2: H2/CO ratios achieved by the DRP (dry reforming of propane) over different NiO-CeO2/AAO catalysts; Figure S3: SEM-EDX spectrum of the 20% NiO-CeO2/AAO catalyst after the DRP.

Acknowledgments

This research was supported by Korea-EU collaboration program (KONNECT Joint Call) through the National Research Foundation of Korea (NRF) (Grant No. NRF-2015K1A3A1A59074246).

Author Contributions

J.K. carried out the experimental work and analyzed the data; E.L.R. helped prepare the catalyst and participated in the interpretation of the results; Y.S.M. supervised all the study.

Conflicts of Interest

The authors declare no conflict of interest.

References

  1. Aasberg-Petersen, K.; Dybkjær, I.; Ovesen, C.V.; Schjødt, N.C.; Sehested, J.; Thomsen, S.G. Natural gas to synthesis gas—Catalysts and catalytic processes. J. Nat. Gas Sci. Eng. 2011, 3, 423–459. [Google Scholar] [CrossRef]
  2. Ye, X.P.; Shoujie, R. Value-added chemicals from glycerol. ACS Symp. Ser. 2014, 1178, 43–80. [Google Scholar]
  3. Zinoviev, S.; Müller-Langer, F.; Das, P.; Bertero, N.; Fornasiero, P.; Kaltschmitt, M.; Centi, G.; Miertus, S. Next-generation biofuels: Survey of emerging technologies and sustainability issues. ChemSusChem 2010, 3, 1106–1133. [Google Scholar] [CrossRef]
  4. Althenayan, F.M.; Yei Foo, S.; Kennedy, E.M.; Dlugogorski, B.Z.; Adesina, A.A. Bimetallic Co–Ni/Al2O3 catalyst for propane dry reforming: Estimation of reaction metrics from longevity runs. Chem. Eng. Sci. 2010, 65, 66–73. [Google Scholar] [CrossRef]
  5. Siahvashi, A.; Chesterfield, D.; Adesina, A.A. Propane CO2 (dry) reforming over bimetallic Mo–Ni/Al2O3 catalyst. Chem. Eng. Sci. 2013, 93, 313–325. [Google Scholar] [CrossRef]
  6. Siahvashi, A.; Adesina, A.A. Kinetic Study of Propane CO2 Reforming over Bimetallic Mo–Ni/Al2O3 Catalyst. Ind. Eng. Chem. Res. 2013, 52, 15377–15386. [Google Scholar] [CrossRef]
  7. Yu, Q.; Kong, M.; Liu, T.; Fei, J.; Zheng, X. Non-thermal plasma assisted CO2 reforming of propane over Ni/γ-Al2O3 catalyst. Catal. Commun. 2011, 12, 1318–1322. [Google Scholar] [CrossRef]
  8. Karuppiah, J.; Mok, Y.S. Plasma-reduced Ni/γ–Al2O3 and CeO2–Ni/γ–Al2O3 catalysts for improving dry reforming of propane. Int. J. Hydrogen Energy 2014, 39, 16329–16338. [Google Scholar] [CrossRef]
  9. Huang, T.-J.; Wu, C.-Y.; Wang, C.-H. Fuel processing in direct propane solid oxide fuel cell and carbon dioxide reforming of propane over Ni–YSZ. Fuel Proc. Technol. 2011, 92, 1611–1616. [Google Scholar] [CrossRef]
  10. Adesina, A.A. The role of CO2 in hydrocarbon reforming catalysis: Friend or foe? Curr. Opin. Chem. Eng. 2012, 1, 272–280. [Google Scholar] [CrossRef]
  11. Gómez-Ramírez, A.; Rico, V.J.; Cotrino, J.; González-Elipe, A.R.; Lambert, R.M. Low temperature production of formaldehyde from carbon dioxide and ethane by plasma-assisted catalysis in a ferroelectrically moderated dielectric barrier discharge reactor. ACS Catal. 2014, 4, 402–408. [Google Scholar] [CrossRef]
  12. Wang, X.; Wang, N.; Zhao, J.; Wang, L. Thermodynamic analysis of propane dry and steam reforming for synthesis gas or hydrogen production. Int. J. Hydrogen Energy 2010, 35, 12800–12807. [Google Scholar] [CrossRef]
  13. Siahvashi, A.; Adesina, A.A. Synthesis gas production via propane dry (CO2) reforming: Influence of potassium promotion on bimetallic Mo-Ni/Al2O3. Catal. Today 2013, 214, 30–41. [Google Scholar] [CrossRef]
  14. Wang, H.Y.; Au, C.T. Carbon dioxide reforming of methane to syngas over SiO2-supported rhodium catalysts. Appl. Catal. A Gen. 1997, 155, 239–252. [Google Scholar] [CrossRef]
  15. Frusteri, F.; Arena, F.; Calogero, G.; Torre, T.; Parmaliana, A. Potassium-enhanced stability of Ni/MgO catalysts in the dry-reforming of methane. Catal. Commun. 2001, 2, 49–56. [Google Scholar] [CrossRef]
  16. Bradford, M.C.J.; Vannice, M.A. Catalytic reforming of methane with carbon dioxide over nickel catalysts I. catalyst characterization and activity. Appl. Catal. A Gen. 1996, 142, 73–96. [Google Scholar] [CrossRef]
  17. Shi, C.; Zhang, A.; Li, X.; Zhang, S.; Zhu, A.; Ma, Y.; Au, C. Ni-modified Mo2C catalysts for methane dry reforming. Appl. Catal. A Gen. 2012, 431–432, 164–170. [Google Scholar] [CrossRef]
  18. Takanabe, K.; Nagaoka, K.; Aika, K.I. Improved resistance against coke deposition of titania supported cobalt and nickel bimetallic catalysts for carbon dioxide reforming of methane. Catal. Lett. 2005, 102, 153–157. [Google Scholar] [CrossRef]
  19. Laosiripojana, N.; Sutthisripok, W.; Assabumrungrat, S. Synthesis gas production from dry reforming of methane over CeO2 doped Ni/Al2O3: Influence of the doping ceria on the resistance toward carbon formation. Chem. Eng. J. 2005, 112, 13–22. [Google Scholar] [CrossRef]
  20. Chen, Y.-H.; Shen, Y.-M.; Wang, S.-C.; Huang, J.-L. Fabrication of one-dimensional ZnO nanotube and nanowire arrays with an anodic alumina oxide template via electrochemical deposition. Thin Solid Films 2014, 570, 303–309. [Google Scholar] [CrossRef]
  21. Masuda, H.; Fukuda, K. Ordered metal nanohole arrays made by a two-step replication of honeycomb structures of anodic alumina. Science 1995, 268, 1466–1468. [Google Scholar] [CrossRef] [PubMed]
  22. Wang, X.; Han, G.-R. Fabrication and characterization of anodic aluminum oxide template. Microelectron. Eng. 2003, 66, 166–170. [Google Scholar] [CrossRef]
  23. Mamontov, E.; Egami, T.; Brezny, R.; Koranne, M.; Tyagi, S. Lattice defects and oxygen storage capacity of nanocrystalline ceria and ceria-zirconia. J. Phys. Chem. B 2000, 104, 11110–11116. [Google Scholar] [CrossRef]
  24. Deraz, N.M. Effect of NiO content on structural, surface and catalytic characteristics of nano-crystalline NiO/CeO2 system. Ceram. Int. 2012, 38, 747–753. [Google Scholar] [CrossRef]
  25. Dobrosz-Gómez, I.; Kocemba, I.; Rynkowski, J.M. Au/Ce1−xZrxO2 as effective catalysts for low-temperature CO oxidation. Appl. Catal. B Environ. 2008, 83, 240–255. [Google Scholar] [CrossRef]
  26. Xu, S.; Wang, X. Highly active and coking resistant Ni/CeO2–ZrO2 catalyst for partial oxidation of methane. Fuel 2005, 84, 563–567. [Google Scholar] [CrossRef]
  27. Xu, S.; Yan, X.; Wang, X. Catalytic performances of NiO–CeO2 for the reforming of methane with CO2 and O2. Fuel 2006, 85, 2243–2247. [Google Scholar] [CrossRef]
  28. Sohier, M.P.; Wrobel, G.; Bonnelle, J.P.; Marcq, J.P. Hydrogenation catalysts based on nickel and rare earths oxides: I. Relation between cations nature, preparation route, hydrogen content and catalytic activity. Appl. Catal. A Gen. 1992, 84, 169–186. [Google Scholar] [CrossRef]
  29. Lamonier, C.; Ponchel, A.; D’Huysser, A.; Jalowiecki-Duhamel, L. Studies of the cerium-metal–oxygen–hydrogen system (metal = Cu, Ni). Catal. Today 1999, 50, 247–259. [Google Scholar] [CrossRef]
  30. Solsona, B.; Concepción, P.; Hernández, S.; Demicol, B.; Nieto, J.M.L. Oxidative dehydrogenation of ethane over NiO–CeO2 mixed oxides catalysts. Catal. Today 2012, 180, 51–58. [Google Scholar] [CrossRef]
  31. Wang, Y.; Zhu, A.; Zhang, Y.; Au, C.T.; Yang, X.; Shi, C. Catalytic reduction of NO by CO over NiO/CeO2 catalyst in stoichiometric NO/CO and NO/CO/O2 reaction. Appl. Catal. B Environ. 2008, 81, 141–149. [Google Scholar] [CrossRef]
  32. Wang, Z.; Shao, X.; Larcher, A.; Xie, K.; Dong, D.; Li, C.-Z. A study on carbon formation over fibrous NiO/CeO2 nanocatalysts during dry reforming of methane. Catal. Today 2013, 216, 44–49. [Google Scholar] [CrossRef]
  33. Jiménez-González, C.; Boukha, Z.; de Rivas, B.; González-Velasco, J.R.; Gutiérrez-Ortiz, J.I.; López-Fonseca, R. Behavior of coprecipitated NiAl2O4/Al2O3 catalysts for low-temperature methane steam reforming. Energy Fuels 2014, 28, 7109–7121. [Google Scholar] [CrossRef]
  34. Si, Z.; Weng, D.; Wu, X.; Ma, Z.; Ma, J.; Ran, R. Lattice oxygen mobility and acidity improvements of NiO–CeO2–ZrO2 catalyst by sulfation for NOx reduction by ammonia. Catal. Today 2013, 201, 122–130. [Google Scholar] [CrossRef]
  35. Rao, P.V.R.; Kumar, V.P.; Rao, G.S.; Chary, K.V.R. Vapor phase selective hydrogenation of acetone to methyl isobutyl ketone (MIBK) over Ni/CeO2 catalysts. Catal. Sci. Technol. 2012, 2, 1665–1673. [Google Scholar] [CrossRef]
  36. Zhang, G.; Shen, Z.; Liu, M.; Guo, C.; Sun, P.; Yuan, Z.; Li, B.; Ding, D.; Chen, T. Synthesis and characterization of mesoporous ceria with hierarchical nanoarchitecture controlled by amino acids. J. Phys. Chem. B 2006, 110, 25782–25790. [Google Scholar] [CrossRef] [PubMed]
  37. Kumar, P.; Sun, Y.; Idem, R.O. Comparative study of Ni-based mixed oxide catalyst for carbon dioxide reforming of methane. Energy Fuels 2008, 22, 3575–3582. [Google Scholar] [CrossRef]
  38. Swaan, H.M.; Kroll, V.C.H.; Martin, G.A.; Mirodatos, C. Deactivation of supported nickel catalysts during the reforming of methane by carbon dioxide. Catal. Today 1994, 21, 571–578. [Google Scholar] [CrossRef]
  39. Rezaei, M.; Alavi, S.M.; Sahebdelfar, S.; Bai, P.; Liu, X.; Yan, Z.-F. CO2 reforming of CH4 over nanocrystalline zirconia-supported nickel catalysts. Appl. Catal. B Environ. 2008, 77, 346–354. [Google Scholar] [CrossRef]
  40. Laosiripojana, N.; Assabumrungrat, S. Catalytic dry reforming of methane over high surface area ceria. Appl. Catal. B Environ. 2005, 60, 107–116. [Google Scholar] [CrossRef]
  41. Sadanandam, G.; Ramya, K.; Kishore, D.B.; Durgakumari, V.; Subrahmanyam, M.; Chary, K.V.R. A study to initiate development of sustainable Ni/γ-Al2O3 catalyst for hydrogen production from steam reforming of biomass-derived glycerol. RSC Adv. 2014, 4, 32429–32437. [Google Scholar] [CrossRef]
  42. Carvalho, D.C.; Souza, H.S.A.; Filho, J.M.; Assaf, E.M.; Thyssen, V.V.; Campos, A.; Hernandez, E.P.; Raudel, R.; Oliveira, A.C. Nanosized Pt-containing Al2O3 as an efficient catalyst to avoid coking and sintering in steam reforming of glycerol. RSC Adv. 2014, 4, 61771–61780. [Google Scholar] [CrossRef]
  43. De Sousa, F.F.; de Sousa, H.S.A.; Oliveira, A.C.; Junior, M.C.C.; Ayala, A.P.; Barros, E.B.; Viana, B.C.; Filho, J.M.; Oliveira, A.C. Nanostructured Ni-containing spinel oxides for the dry reforming of methane: Effect of the presence of cobalt and nickel on the deactivation behaviour of catalysts. Int. J. Hydrogen Energy 2012, 37, 3201–3212. [Google Scholar] [CrossRef]
  44. Ferencz, Z.; Erdőhelyi, A.; Baán, K.; Oszkó, A.; Óvári, L.; Kónya, Z.; Papp, C.; Steinrück, H.-P.; Kiss, J. Effects of support and Rh additive on Co-based catalysts in the ethanol steam reforming reaction. ACS Catal. 2014, 4, 1205–1218. [Google Scholar] [CrossRef]
  45. Vári, G.; Óvári, L.; Papp, C.; Steinrück, H.P.; Kiss, J.; Kónya, Z. The interaction of cobalt with CeO2(111) prepared on Cu(111). J. Phys. Chem. C 2015, 119, 9324–9333. [Google Scholar] [CrossRef]
  46. Mattos, L.V.; Jacobs, G.; Davis, B.H.; Noronha, F.B. Production of hydrogen from ethanol: Review of reaction mechanism and catalyst deactivation. Chem. Rev. 2012, 112, 4094–4123. [Google Scholar] [CrossRef] [PubMed]
  47. Guil, J.M.; Homs, N.; Llorca, J.; de la Piscina, P.R. Microcalorimetric and infrared studies of ethanol and acetaldehyde adsorption to investigate the ethanol steam reforming on supported cobalt catalysts. J. Phys. Chem. B 2015, 109, 10813–10819. [Google Scholar] [CrossRef] [PubMed]
  48. Alipour, Z.; Rezaei, M.; Meshkani, F. Effects of support modifiers on the catalytic performance of Ni/Al2O3 catalyst in CO2 reforming of methane. Fuel 2014, 129, 197–203. [Google Scholar] [CrossRef]
  49. García-Diéguez, M.; Herrera, C.; Larrubia, M.Á.; Alemany, L.J. CO2-reforming of natural gas components over a highly stable and selective NiMg/Al2O3 nanocatalyst. Catal. Today 2012, 197, 50–57. [Google Scholar] [CrossRef]
  50. Robert-Goumet, C.; Monier, G.; Zefack, B.; Chelda, S.; Bideux, L.; Gruzza, B.; Awitor, O.K. SEM and XPS studies of nanohole arrays on InP(1 0 0) surfaces created by coupling AAO templates and low energy Ar+ ion sputtering. Surf. Sci. 2009, 603, 2923–2927. [Google Scholar] [CrossRef]
  51. Linga Reddy, E.; Karuppiah, J.; Lee, H.C.; Kim, D.H. Steam reforming of methanol over copper loaded anodized aluminum oxide (AAO) prepared through electrodeposition. J. Power Sources 2014, 268, 88–95. [Google Scholar] [CrossRef]
  52. Li, A.-P.; Müller, F.; Birner, A.; Nielsch, K.; Gösele, U. Fabrication and microstructuring of hexagonally ordered two-dimensional nanopore arrays in anodic alumina. Adv. Mater. 1999, 11, 483–487. [Google Scholar] [CrossRef]
  53. Linga Reddy, E.; Lee, H.C.; Kim, D.H. Steam reforming of methanol over structured catalysts prepared by electroless deposition of Cu and Zn on anodically oxidized alumina. Int. J. Hydrogen Energy 2015, 40, 2509–2517. [Google Scholar] [CrossRef]
  54. Mok, Y.S.; Jwa, E.; Hyun, Y.J. Regeneration of C4H10 dry reforming catalyst by nonthermal plasma. J. Energy Chem. 2013, 22, 394–402. [Google Scholar] [CrossRef]
  55. Levenspiel, O. Chemical Reaction Engineering, 3rd ed.; Wiley: Hoboken, NJ, USA, 1999; pp. 83–89. [Google Scholar]
Figure 1. X-ray diffraction (XRD) patterns of the NiO-CeO2/AAO catalysts: (a) Anodic aluminum oxide (AAO) support; (b) 20% NiO-CeO2/AAO; (c) 30% NiO-CeO2/AAO; (d) 40% NiO-CeO2/AAO; (e) 50% NiO-CeO2/AAO; (f) 60% NiO-CeO2/AAO; (g) 70% NiO-CeO2/AAO; (h) 80% NiO-CeO2/AAO.
Catalysts 06 00154 g001
Figure 2. FE-SEM (field emission scanning electron microscopy) image of the bare anodic aluminum oxide (AAO) support.
Catalysts 06 00154 g002
Figure 3. SEM images of (a) 20% NiO-CeO2/AAO; (b) 50% NiO-CeO2/AAO and (c) 80% NiO-CeO2/AAO with two magnifications (left: 1 µm; right: 400 nm scale).
Catalysts 06 00154 g003
Figure 4. (a) O 1s; (b) Ni 2p; (c) Ce 3d XPS (X-ray photoelectron spectroscopy) spectra of 20%, 50% and 80% NiO-CeO2/AAO catalysts.
Catalysts 06 00154 g004
Figure 5. C3H8 (lower) and CO2 (upper) conversion efficiencies obtained with different catalysts.
Catalysts 06 00154 g005
Figure 6. Concentrations of H2 (top) and CO (bottom) produced by the DRP with different catalysts.
Catalysts 06 00154 g006
Figure 7. Stability of the catalysts over the period of 55 h at 500 °C. (a) CO2 (top) & C3H8 (bottom) conversions and (b) product concentrations (H2 and CO).
Catalysts 06 00154 g007aCatalysts 06 00154 g007b
Figure 8. FE-SEM images of the spent catalysts. (a) 20%; (b) 30%; (c) 50%; (d) 80% NiO-CeO2/AAO with two magnifications (left: 1 µm; right: 400 nm scale).
Catalysts 06 00154 g008
Figure 9. TEM (transmission electron microscopy) images of the 20% NiO-CeO2/AAO catalyst after the DRP with different magnifications: (a) 100 nm; (b) 50 nm; (c) 20 nm; (d) 10 nm.
Catalysts 06 00154 g009
Figure 10. Typical Raman spectra of the NiO-CeO2/AAO catalysts after the DRP.
Catalysts 06 00154 g010
Figure 11. (a) C 1s; (b) Ce 3d and (c) Ni 2p XPS spectra of 20% NiO-CeO2/AAO and 80% NiO-CeO2/AAO catalysts.
Catalysts 06 00154 g011
Figure 12. TPO profiles of different NiO-CeO2/AAO catalysts after the DRP.
Catalysts 06 00154 g012
Table 1. Brunauer–Emmett–Teller (BET) surface area, mean crystallite sizes, and lattice strains (as determined by XRD) of the NiO-CeO2/AAO catalysts with different Ni content.
NiO:CeO2SBET (m2/g)NiOCeO2
Crystal Lattice Size Strain (nm) ÅCrystal Size (nm)Lattice Strain Å
AAO as prepared23---
20%:80%15.191.1161.1
30%:70%14.6--230.8
40%:60%13.9150.4111.5
50%:50%12.5140.1230.8
60%:40%12.7--181.0
70%:30%13.1200.1101.4
80%:20%12.8310.4--
Table 2. De-convoluted results of XPS (X-ray photoelectron spectroscopy) spectra for the 20%~80% NiO-CeO2/AAO catalysts.
CatalystCe 3d5/2Ce 3d3/2
υ0υ1υ2υ3u0u1u2u3
20%NiO-CeO2/AAO882.5884.4889.3898.4900.7904.3907.5917.0
50%NiO-CeO2/AAO882.5884.3887.4898.4900.9904.4907.5916.9
80%NiO-CeO2/AAO882.6884.3889.0898.2900.8904.4907.5916.9
AssignmentsCe4+Ce3+Ce4+Ce4+Ce4+Ce3+Ce4+Ce4+

