Article

Visualization of Gas Distribution in a Model AP-XPS Reactor by PLIF: CO Oxidation over a Pd(100) Catalyst

1
Division of Combustion Physics, Lund University, SE-221 00 Lund, Sweden
2
Division of Synchrotron Radiation Research, Lund University, SE-221 00 Lund, Sweden
*
Author to whom correspondence should be addressed.
Catalysts 2017, 7(1), 29; https://doi.org/10.3390/catal7010029
Submission received: 24 November 2016 / Revised: 10 January 2017 / Accepted: 11 January 2017 / Published: 17 January 2017
(This article belongs to the Special Issue In Situ and Operando Characterization in Catalysis)

Abstract

:
In situ knowledge of the gas phase around a catalyst is essential to make an accurate correlation between the catalytic activity and surface structure in operando studies. Although ambient pressure X-ray photoelectron spectroscopy (AP-XPS) can provide information on the gas phase as well as the surface structure of a working catalyst, the gas phase detected has not been spatially resolved to date, thus possibly making it ambiguous to interpret the AP-XPS spectra. In this work, planar laser-induced fluorescence (PLIF) is used to visualize the CO2 distribution in a model AP-XPS reactor, during CO oxidation over a Pd(100) catalyst. The results show that the gas composition in the vicinity of the sample measured by PLIF is significantly different from that measured by a conventional mass spectrometer connected to a nozzle positioned just above the sample. In addition, the gas distribution above the catalytic sample has a strong dependence on the gas flow and total chamber pressure. The technique presented has the potential to increase our knowledge of the gas phase in AP-XPS, as well as to optimize the design and operating conditions of in situ AP-XPS reactors for catalysis studies.

Graphical Abstract

1. Introduction

Catalysis is an essential technology for our society in that around 90% of all chemicals worldwide are produced using it [1]. In addition, environmental sustainability also relies on catalysis, particularly heterogeneous catalysis [2]. Although catalysis has been used and studied for more than a century, a fundamental understanding of the mechanisms behind most catalytic processes is still lacking, which calls for studies of catalysis at an atomic level. One of the most versatile surface-sensitive techniques is X-ray photoelectron spectroscopy (XPS) since it provides quantitative information about the elemental composition and chemical specificity of the surface [3]. Historically, XPS has been used to investigate surfaces under ultra-high vacuum (UHV) conditions, but during the last decades, the technique has been modified to operate under more realistic conditions, which is often referred to as ambient pressure X-ray photoelectron spectroscopy (AP-XPS). With AP-XPS, it is possible to detect both the gas-phase and surface chemical composition in situ, which makes it valuable for catalysis studies [4].
When moving from UHV conditions to elevated pressures, the effect of gas molecules close to the surface increases [5,6]. For example, a change of the gas composition can lead to compositional and structural changes of a working catalyst [7,8], which in turn can change the kinetics of the reaction. Therefore, in situ knowledge of the gas phase around a catalyst is essential to make an accurate correlation between the catalytic activity and surface structure in operando catalysis studies [9]. As mentioned above, AP-XPS can provide in situ gas-phase information of a working catalyst; however, the information suffers from poor temporal resolution and, so far, a lack of spatial resolution. As an additional gas tool for AP-XPS, a mass spectrometer (MS) is often used to analyze gases in an AP-XPS set up. Although a MS has the advantage of measuring several gases simultaneously, it cannot easily spatially resolve and image gases close to a sample, and usually samples the gases with a slight time delay. To overcome these problems, planar laser-induced fluorescence (PLIF) can be used to detect gases in the vicinity of a working catalyst in situ non-intrusively with high spatial and temporal resolution. A number of recent applications of PLIF have demonstrated it as a powerful gas detection tool, complementary to MS in catalysis studies [10,11,12,13,14].
One of the most intensively studied reactions using AP-XPS is CO oxidation, particularly on Pd single-crystal surfaces [15,16,17,18]. It is well-known that when the reaction is in the highly active phase, under semi-realistic conditions, it is often mass transfer limited (MTL) by the ability of CO molecules diffusing and reaching onto the surface. In the MTL regime, a CO2 boundary layer (a sharp gradient of the CO2 cloud) is often formed at high pressure, which changes the gas composition close to the sample surface [19,20]. Blomberg et al. have recently shown how this is reflected in the AP-XPS gas-phase signal by comparing gas-phase images by PLIF with AP-XPS data [21]. Those PLIF images, however, are obtained from a regular catalytic reactor in the absence of a nozzle close to the sample. It is highly likely that the presence of such a nozzle could change the gas distribution close to a sample significantly. In this work, a model reactor is therefore designed to mimic gas flows in a real AP-XPS reactor. To investigate how the presence of the nozzle affects the gas distribution close the sample surface, PLIF is used to visualize the CO2 distribution over a Pd(100) catalyst during CO oxidation. We show that the CO2 concentration in the vicinity of the sample, as measured by PLIF, is significantly different from that at the gas outlet, as measured by a MS. In addition, the CO2 distribution over the sample is strongly dependent on the flow rate and chamber pressure, as well as the flow configurations.

2. Results

A model reactor with a nozzle as the gas outlet was designed to mimic gas flows in a real AP-XPS reactor. The nozzle has an aperture with a diameter of 1 mm and is located at a normal operating distance, which is twice the diameter of the aperture [22,23]. A schematic of the nozzle and the flow configuration is shown in Figure 1a. A MS connected to the nozzle (as the gas outlet) via a leak valve was used to measure the global gas concentration. In this way, the MS can be seen to sample gases close to the sample, similar to a capillary MS. PLIF was used to image the CO2 gas distribution over a Pd(100) catalyst during CO oxidation in this model AP-XPS reactor.

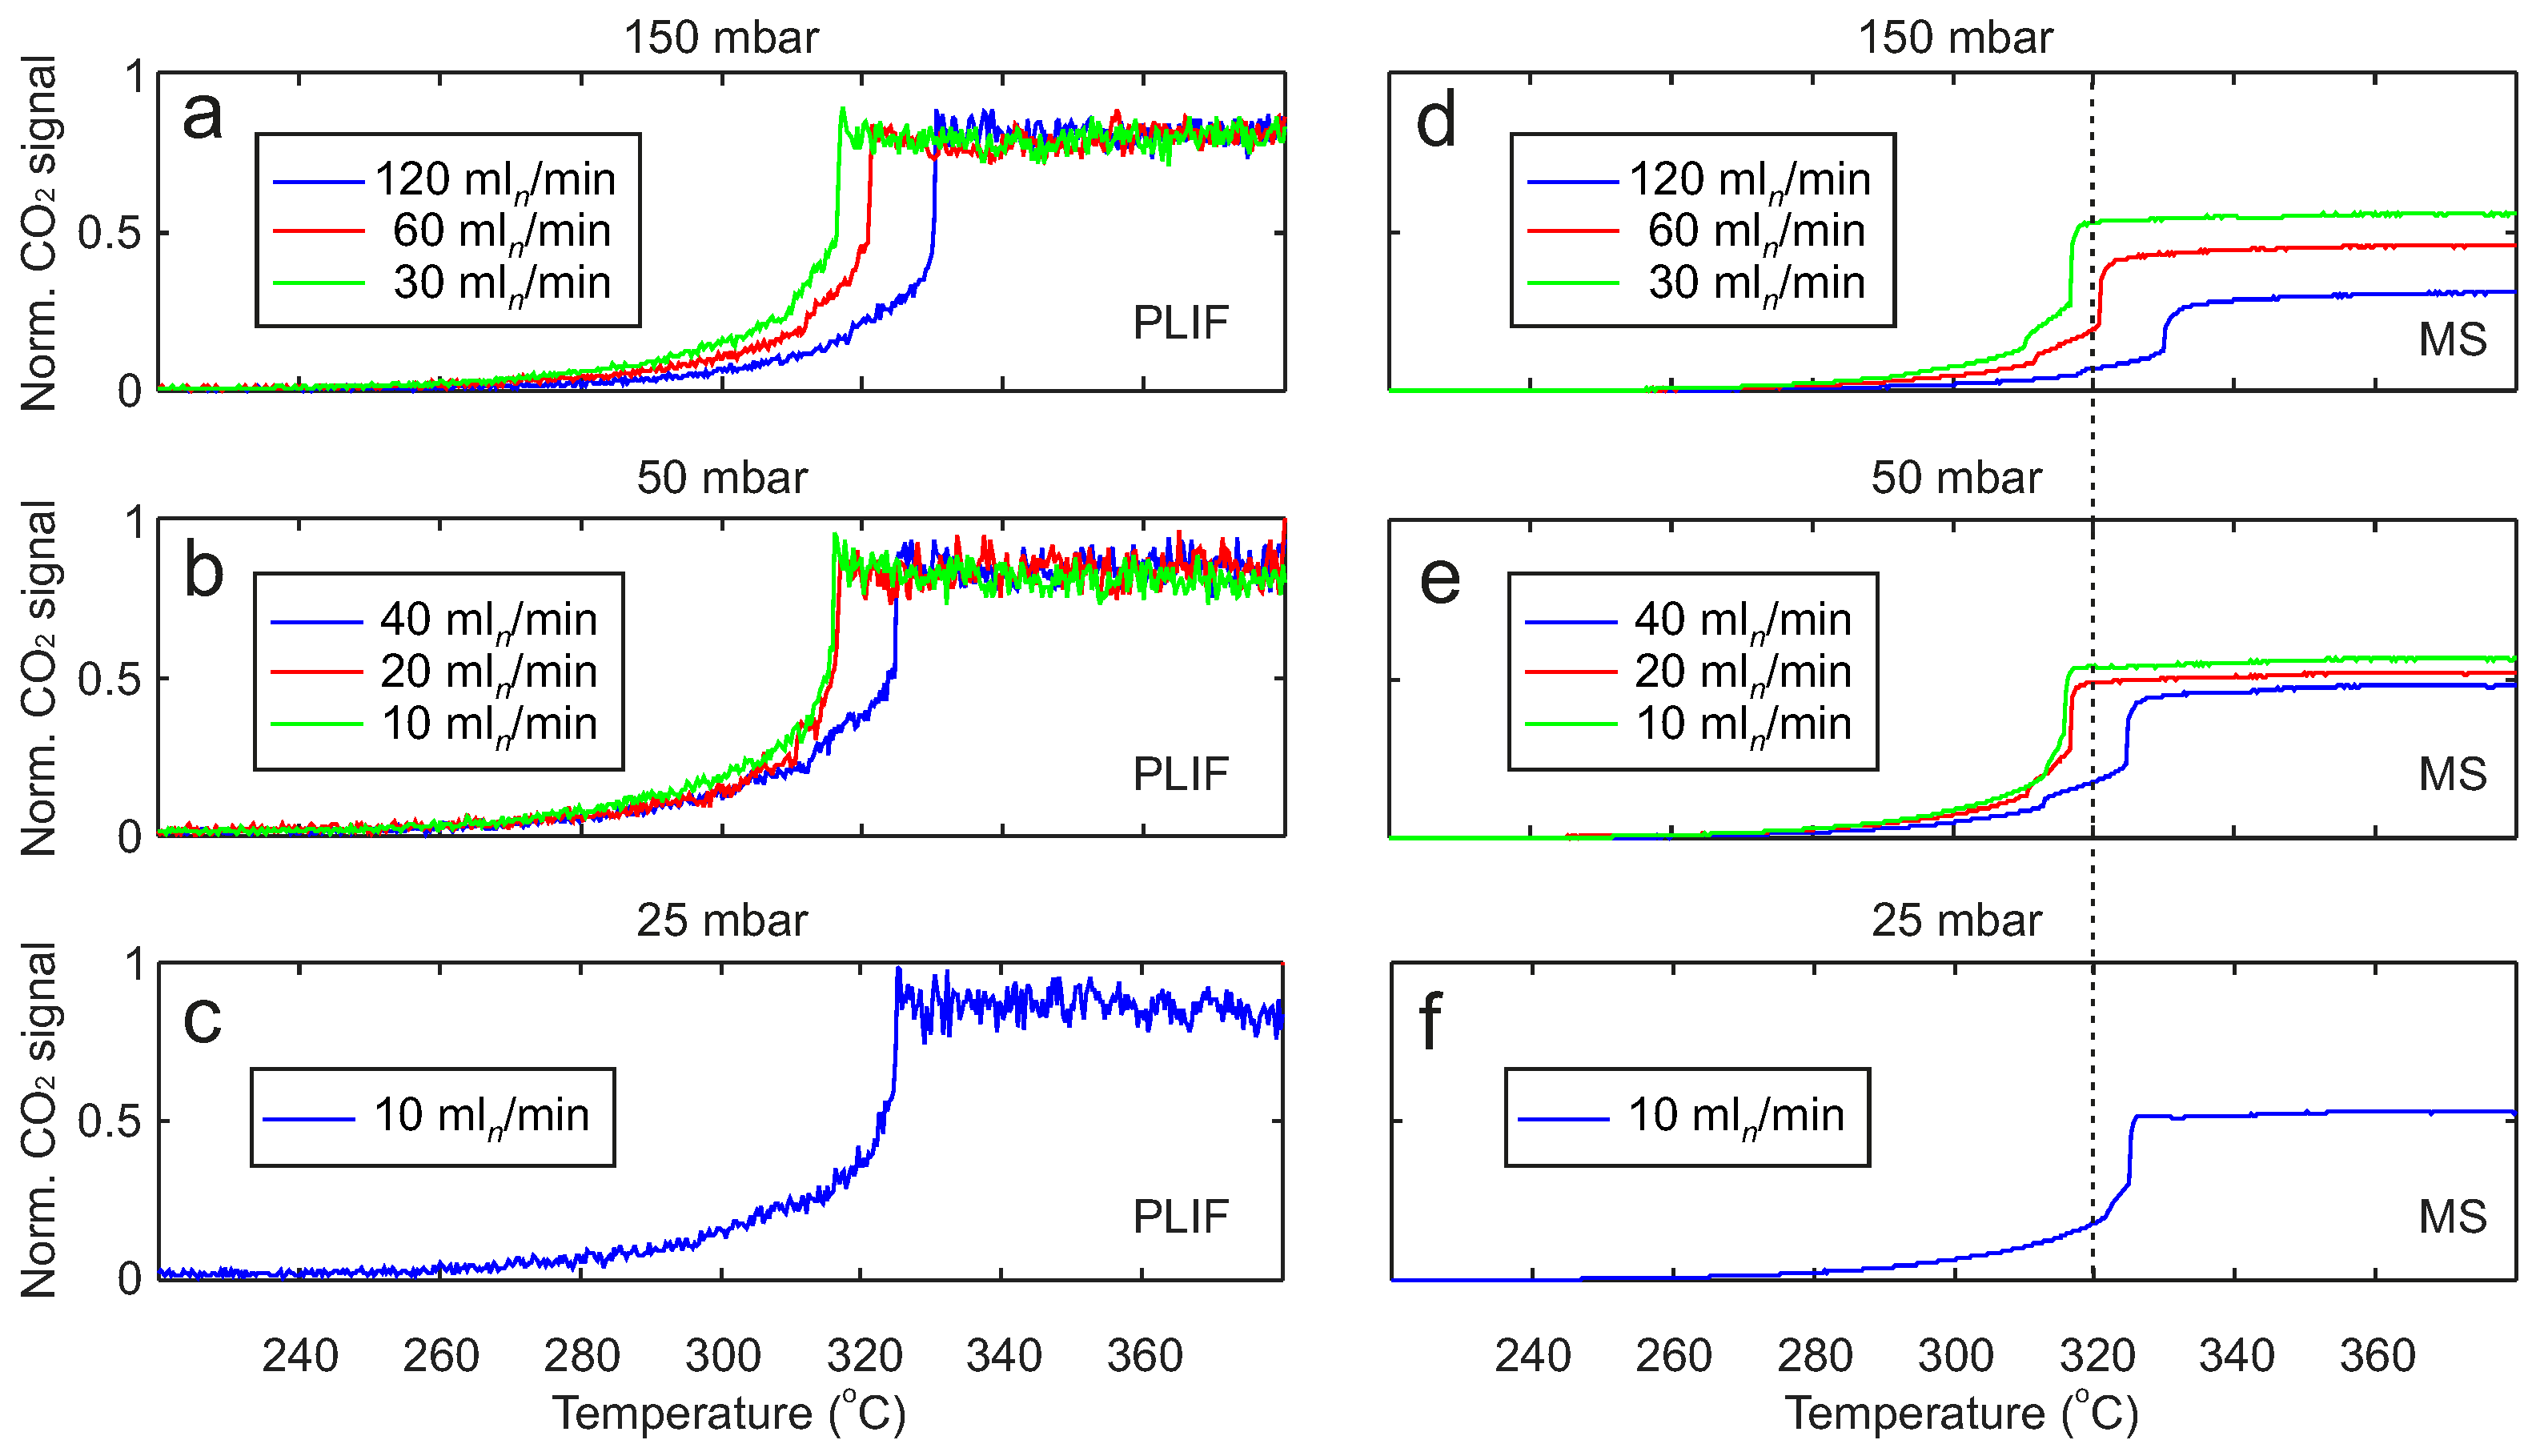
2.1. Comparison between PLIF and MS

PLIF and MS were compared in a CO oxidation experiment where the sample was heated by a heating plate from 220 to 380 °C at a constant rate of 16 °C/min, at flows of 4.8 mLn/min CO, 4.8 mLn/min O2 and 110.4 mLn/min Ar (corresponding to 0 °C and atmospheric pressure), and at a total pressure of 150 mbar (corresponding to initial partial pressures of 6 mbar each of CO and O2, and 138 mbar of Ar). It can be seen from both LIF and MS traces, in Figure 1b,c, that as the temperature of the catalyst increases, the CO2 partial pressure increases steadily from zero, and then increases dramatically when the sample ignites at 330 °C. As the temperature continues to increase, the CO2 partial pressure reaches a plateau, indicating that the activity has reached the MTL regime. Figure 1d–f show three CO2 PLIF images captured at 300, 330 and 348 °C, respectively. The PLIF images show the CO2 distribution over the sample with a high spatial resolution, 70 µm/pixel in this case. Focusing on the individual PLIF images, it can be seen that at 300 °C, the PLIF image is almost completely black, showing very little CO2 produced as the sample is in the low-activity regime. When the sample ignites at 330 °C, a clear increase gradient of the CO2-related intensity can be seen in the corresponding PLIF image. At 348 °C, the PLIF image shows a clear cloud, or the so-called boundary layer of CO2 formed above the sample when the reaction has reached the MTL regime.
Comparing the LIF and MS traces, the CO2 partial pressure in the vicinity of the sample, as measured by PLIF, is significantly different from that at the gas outlet, as measured by the MS. An even more pronounced difference can be seen at the highly active phase; approximately 5 mbar CO2 partial pressure is measured by PLIF, compared to around 2 mbar measured by the MS. However, no pronounced time delay (within 1 s) of the MS signal was found in this experiment, due to a short and small-sized tube, used between the MS and the gas outlet of the reactor, and a high flow rate in this experiment. A movie showing the dynamic change of the CO2 distribution during the reaction can be found in the Supplementary Materials Video S1.

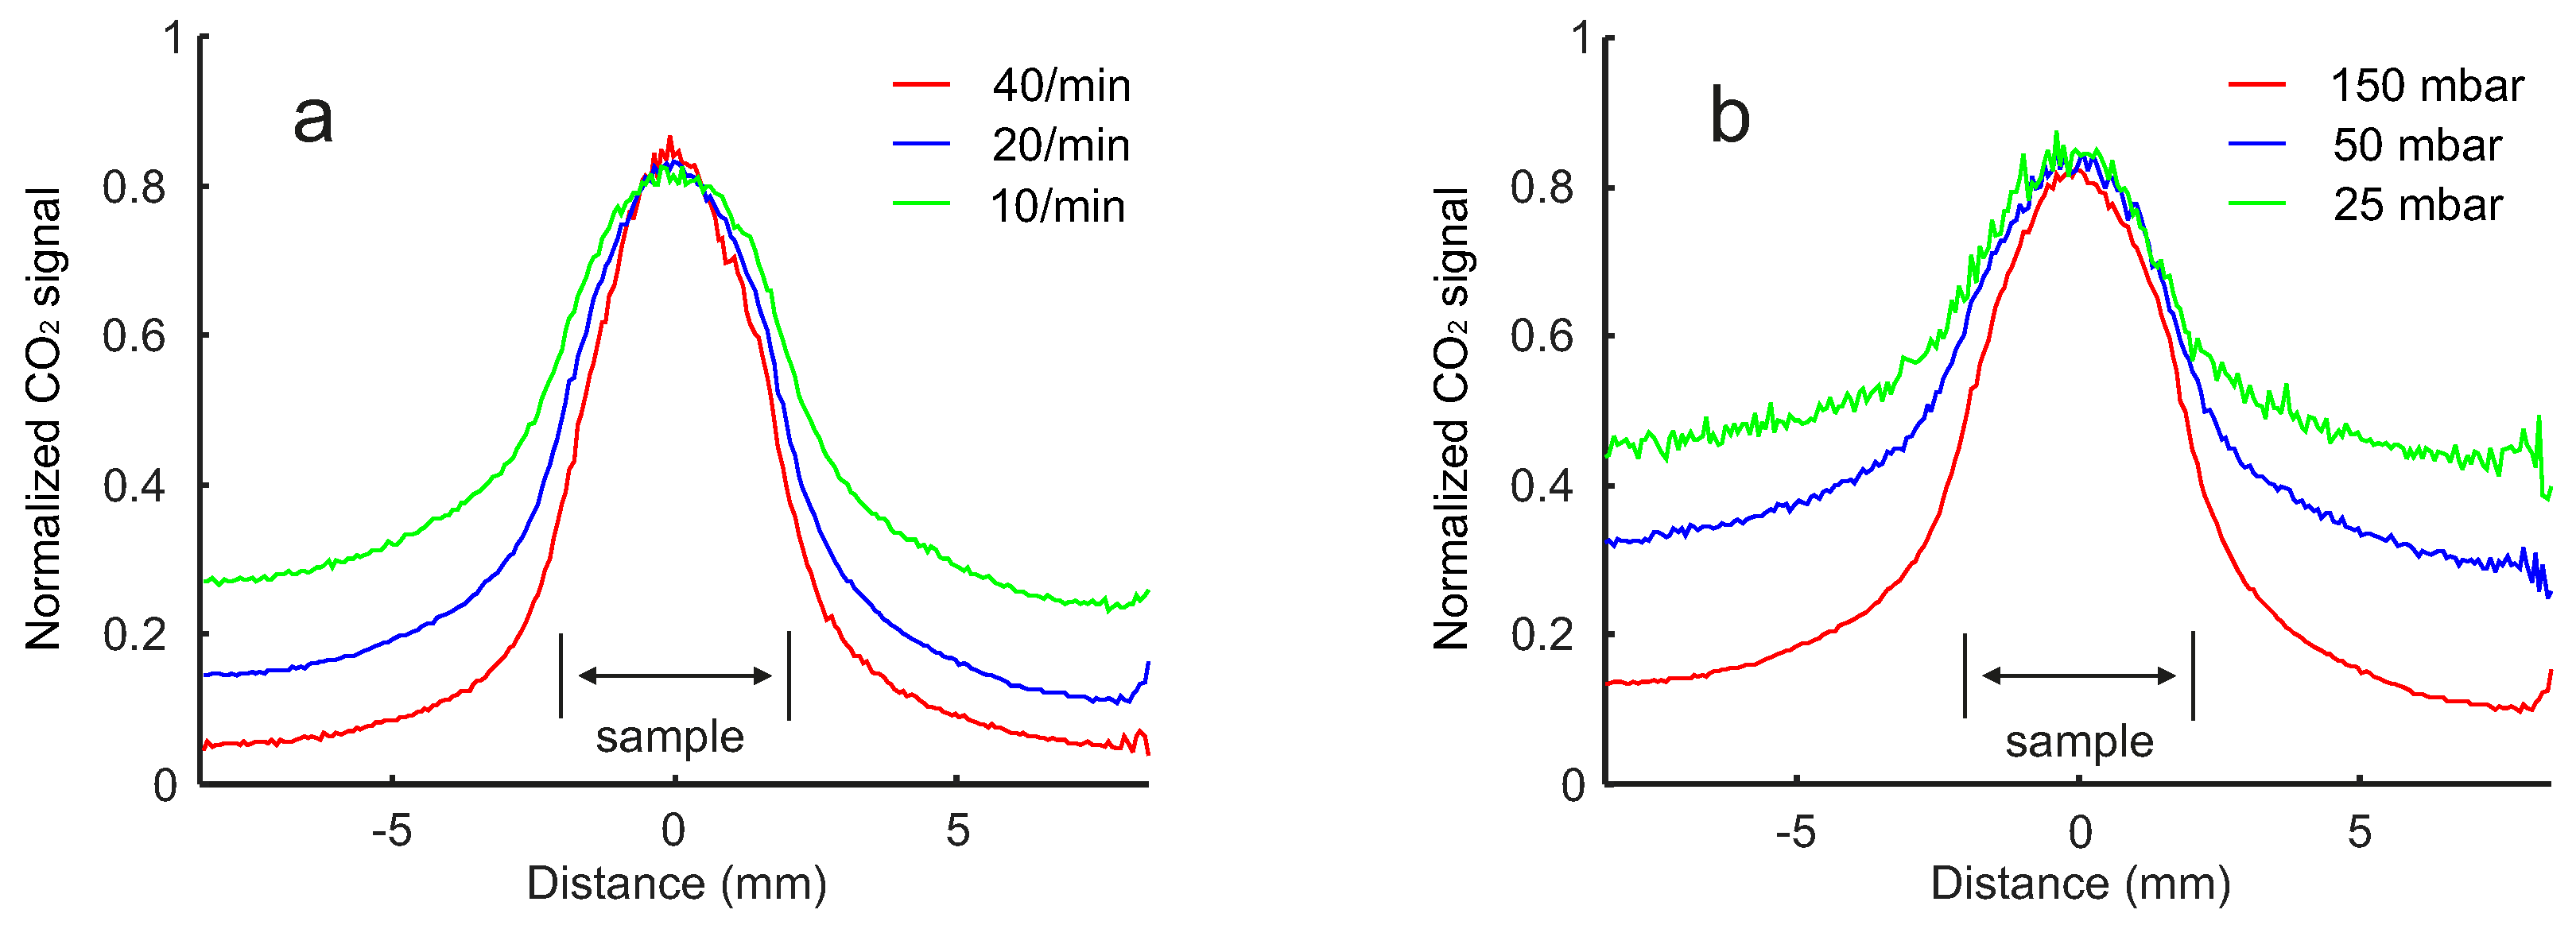
2.2. Pressure and Flow Rate Dependence

To study the pressure and flow dependence of the gas distribution over the sample, the sample was heated using the same temperature ramp at different pressures and flow rates, and the CO2 signals were measured by both PLIF and the MS. The average PLIF CO2 signal and the MS CO2 signal are shown in Figure 2. The CO2 signals shown are normalized to the initial CO partial pressures for purposes of comparison, since the partial pressures of CO, O2 and Ar vary for different gas conditions and the ratio of CO and O2 is kept to 1:1.
The ignition temperature of the sample is not the focus of this work; however, it is still interesting to show how the pressure and flow rate affect the ignition temperature. Under all the gas conditions in Figure 2, the reaction ignites at between 315 and 330 °C. At both 150 and 50 mbar, the sample has a higher light-off temperature at higher flux rates. This is due to the fact that at higher flux rates, the gas in the reactor (and close to the sample surface) is exchanged faster, which also means that the CO/O2 ratio stays higher until higher temperatures, leading to higher ignition temperatures.
Interestingly, the CO2 signal close to the sample, as measured by PLIF, does not change noticeably with the flow rates, as shown in Figure 2a,b. However, there is a slight increasing trend of the CO2 signal measured by the MS with the decreasing flow rate, as shown in Figure 2d,e. This behavior can be explained by the fact that at lower flow rates, the CO molecules stay in the reactor longer and a larger fraction of the molecules are converted into CO2.
The CO2 boundary layer formed over a catalyst in the MTL regime during CO oxidation has been shown to play an important role on the kinetics of the catalytic reaction [24,25]. Therefore, it is of great interest to study the CO2 distribution over the sample in the MTL regime under different gas conditions. Figure 3 summarizes the investigation of the pressure and flow rate dependence of the CO2 distribution. The images were recorded when the reactions reached the MTL regime, under the gas conditions shown in Figure 2. Since the reactions stabilize in the MTL regime, all images are averaged over 1000 shots to improve the signal-to-noise ratio.
The gas volumetric exchange rate per reactor volume (hereinafter referred to as the gas exchange rate) is dependent on both the flow rate and chamber pressure, and directly related to the diffusion of the gas. Thus, the gas exchange rate is used to facilitate the comparison of the CO2 distribution for different pressures. In fact, it is difficult to accurately estimate the gas exchange rate due to the complex geometry of the reactor. The gas exchange rates presented in Figure 3 are, therefore, simply calculated as the total flow rate divided by the chamber volume. However, this simplified calculation is sufficient for qualitative studies.
In a comparison of Figure 3a–c, it can be seen that the gradient of the CO2 signal intensity decreases as the gas exchange rate decreases from 40/min to 10/min while the total chamber pressure is kept at 150 mbar. A similar tendency can also be seen when the total pressure is at 50 mbar, as shown in Figure 3d–f. This smeared-out effect can be explained by more CO molecules being converted into CO2 inside the reactor at lower gas exchange rates, hence the stronger CO2 presence. It is interesting to see that the CO2 distribution also has a strong dependence on the total pressure. Comparing Figure 3b,e,g, the CO2 cloud becomes more smeared out as the total pressure decreases while the gas exchange rate is kept the same. This is most likely due to the diffusion effect, which is stronger at lower pressures. However, the CO2 boundary layer (sharp gradient of the CO2 cloud) can still be clearly seen at pressures down to 25 mbar.
To better illustrate the pressure and flow dependence of the CO2 distribution above the sample, horizontal CO2 profiles are plotted in Figure 4. Figure 4a shows the profiles with different gas exchange rates at a fixed total pressure of 150 mbar, while Figure 4b shows the profiles with different total pressures at a fixed gas exchange rate of 20/min. It can be clearly seen that the gradient of the profiles becomes smaller at a lower gas exchange rate and lower total pressure.

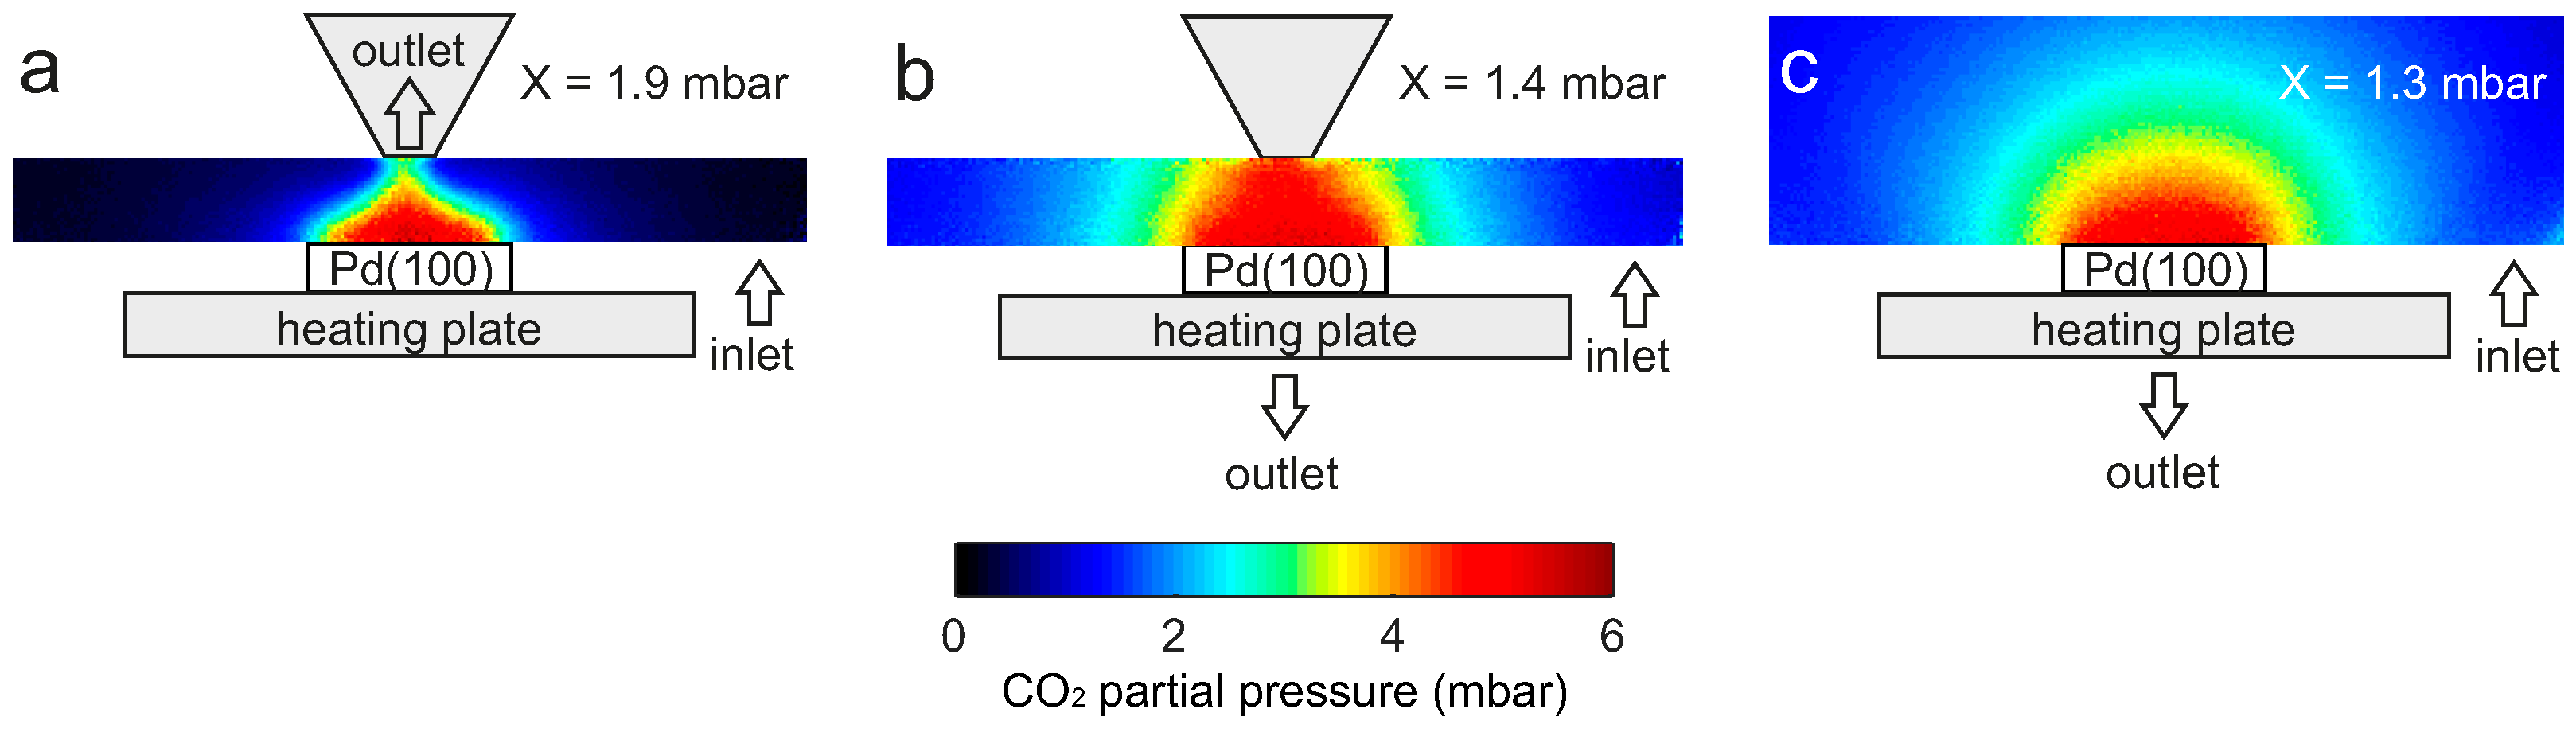
2.3. Flow Configuration Dependence

Apart from the strong dependence on the chamber pressure and flow rate, the CO2 gas distribution over an active Pd(100) sample was also found to vary significantly for different flow configurations. Figure 5a shows the model AP-XPS reactor where the nozzle is used as the gas outlet. Figure 5b shows a reactor similar to the model AP-XPS reactor where the nozzle is not used as the gas outlet. Instead, the gas outlet was located below the sample holder. Figure 5c shows a regular reactor without a nozzle. In all configurations, the gas outlet was connected to both the vacuum pump and the MS. All images were recorded when the reactions reached the MTL regime under the same gas conditions.
It can be clearly seen that both the shape and the gradient of the CO2 cloud in Figure 5a differ considerably, compared to the ones in Figure 5b,c. In addition, the CO2 partial pressures measured by the MS differ significantly. A higher CO2 partial pressure is measured by the MS in Figure 5a than in Figure 5b,c. This is probably due to the fact that the CO2 molecules produced were localized close to the sample, and the gas sampling distance between the gas outlet and the sample surface is much shorter in Figure 5a than in Figure 5b,c. Comparing Figure 5b,c, there is a small difference in the CO2 partial pressures measured by the MS between these two configurations, which could be due to the disturbance of the gas flow around the sample by the nozzle or the volume change of the reactor with the presence of the nozzle in Figure 5b. However, for all the flow configurations, the CO2 partial pressures close to the sample measured by PLIF were approximately the same. For a comparison of the cases with the nozzle and without the nozzle, a movie showing the dynamic change of the CO2 distribution can be found in the Supplementary Materials Video S2.

3. Discussion

PLIF makes it possible to spatially resolve gases close to the sample with a sufficient temporal resolution, to follow dynamic changes in the gas phase during catalytic reactions. In this study, a model AP-XPS reactor with a nozzle positioned just above the sample and connected to a vacuum pump and a MS was designed to mimic the gas flows in a real AP-XPS reactor. The study shows that the CO2 concentration in the vicinity of the sample, as measured by PLIF, was found to be different from the overall CO2 concentration measured by the MS. An even more pronounced difference could be seen when the reaction reached the MTL regime. As gas molecules close to the sample interact directly with the catalyst surface, in situ knowledge of the gas composition close to the sample is essential to make an accurate correlation between the catalytic activity and surface structure in operando studies of catalysis. Therefore, PLIF has the advantage of providing more accurate information of the gas phase close to the sample. Since MS has the benefit of measuring several gases simultaneously, a combination of PLIF and MS can provide an even more complete picture of the gas phase during catalytic reactions.
The gas distribution over a highly active sample was found to have a strong dependence on the flow rate and the total chamber pressure, as well as the flow configuration. This finding can be useful to obtain better knowledge of the gas phase in AP-XPS, as well as to optimize the design and operating conditions of in situ AP-XPS reactors. The common upper limit of the operating pressure of AP-XPS is a few mbar [26]. In this work, the minimum total chamber pressure investigated was 25 mbar (partial pressures of 1.25 mbar CO, 1.25 mbar O2 and 22.5 mbar Ar), limited by the pumping efficiency with a total flow of 10 mLn/min. However, the results showed a tendency where the gas distribution above the sample became more homogeneous at lower pressures and lower flow rates. From this tendency, it was estimated that a boundary layer of CO2 above the sample in the MTL regime could still be present at a 10 mbar chamber pressure and a 10 mLn/min flow rate, or at lower chamber pressures with higher flow rates. Within such a boundary layer, the CO2 partial pressure decreases radially from the center of the sample, and the CO and O2 partial pressures decrease radially towards the center of the sample. When surface structures are to be determined, the gas composition over the sample should ideally be homogeneous. We found in this study that the gas composition over the sample was not homogeneous due to the formation of the boundary layer. Lower pressures and flow rates would promote a more homogeneous gas distribution above the sample. However, higher pressures and flow rates are usually needed to mimic more realistic conditions in catalysis applications. The boundary layer is, therefore, of practical interest in catalysis studies.
Although the dependence of the gas distribution as a function of the distance between the nozzle and the sample surface was not investigated in this study, it is interesting to discuss it as a short working distance of an analyzer is preferred in most AP-XPS experiments [27,28]. At shorter distances, it is likely that the nozzle will have a stronger impact on the gas flow close to the sample surface, as gases close to the surface are pumped away more efficiently. Therefore, it can be inferred that the CO2 gas cloud over the sample would be more distorted at shorter working distances.
As the technique of AP-XPS is being developed towards higher and higher operating pressures in an effort to bridge the so-called pressure gap in catalysis studies, gas phase–related phenomena become increasingly important. As a powerful gas detection tool, PLIF has great potential to promote a better understanding of the gas-surface interaction during catalytic reactions.

4. Materials and Methods

4.1. Sample and Reactor

The sample investigated was a Pd(100) single crystal of dimension 4 × 4 mm2. The cleaning procedure of the sample can be referred to [14]. The sample was heated by a boralectric heater, the temperature of which was measured by a type D thermocouple. A cubical chamber of volume 23 cm3 with CaF2 windows was used for CO2 PLIF measurements. A cone-shaped nozzle of aperture diameter of 1 mm is located 2 mm above of the sample and acted as gas outlet. Gases (from AGA Gas AB, Lidingö, Sweden, the purities of CO, O2 and Ar are 99.97%, 99.9996% and 99.997%, respectively) were supplied to the reactor by individual mass flow controllers (Bronkhorst EL-FLOW, Bronkhorst High-Tech B.V., Ruurlo, The Netherlands), and the gas pressure in the reactor was regulated by a digital pressure controller (Bronkhorst EL-PRESS, Bronkhorst High-Tech B.V.). A carbonyl trap was used to remove nickel carbonyl present in the CO gas. The gas composition in the reactor was measured by a quadrupole mass spectrometer (Pfeiffer, QME 220, Pfeiffer Vacuum GmbH, Asslar, Germany) connected to the outlet of the reactor by a 70 cm long gas tube (d = 1/16 in.) and with a leak valve which kept the pressure in the MS at 5 × 10⁻⁶ mbar. The MS signal is converted into mbar by normalizing the MS CO and O2 signal to the known initial partial pressures, and the CO2 signal was scaled to match the observed conversion of CO. A schematic of the reaction system can be found in the Supplementary Materials Figure S1.

4.2. PLIF

The detection of CO2 was realized by a broadband excitation of the (0000) → (10001) combination band at ~2.7 µm and collecting fluorescence from the fundamental band at ~4.3 µm. The fundamental 1064 nm laser beam with ~350 mJ/pulse from a single-mode seeded Nd:YAG (neodymium-doped yttrium aluminium garnet) laser operating at 10 Hz, was used to pump an IR OPO (GWU, versaScan-L 1064, Erftstadt, Germany), generating a signal beam at ~1.7 µm and an idler beam at ~2.7 µm, with ~8 and ~7 mJ/pulse, respectively. The idler beam was shaped into a thin laser sheet of 2 mm height by a set of focusing lens and then sent through the reactor just above the catalyst. The CO2 fluorescence was imaged by a liquid-nitrogen-cooled, 256 × 256 InSb IR camera (Santa Barbara Focal Plane, SBF LP134, Goleta, CA, USA). A cold interference filter inside the camera, centered at 4.26 µm, was used to suppress the strong thermal background. The exposure time was set to 30 µs to suppress background and favor fluorescence signal. Purging of N2 was applied during measurements to reduce laser energy attenuation along the beam path and fluorescence signal loss between the cell and the IR camera. A detailed description of the detection scheme and the evaluation of PLIF signal can be found in [10,29].

Supplementary Materials

The following are available online at: www.mdpi.com/2073-4344/7/1/29/s1, Figure S1: Schematic of the reaction system, Video S1: Movie_reactor with a nozzle, Video S2: Movie_reactor without a nozzle.

Acknowledgments

This work was financially supported by the Knut & Alice Wallenberg Foundation, the Swedish Research Council and the Royal Physiographic Society of Lund.

Author Contributions

Jianfeng Zhou, Sara Blomberg and Johan Zetterberg designed the experiments; Jianfeng Zhou and Sara Blomberg performed the experiments; Jianfeng Zhou analyzed the data and wrote the manuscript; Sara Blomberg, Johan Gustafson, Johan Zetterberg and Edvin Lundgren improved the manuscript; Johan Zetterberg and Edvin Lundgren supervised the project.

Conflicts of Interest

The authors declare no conflict of interest.

References

  1. Bowker, M. The Basis and Applications of Heterogeneous Catalysis; Oxford University Press Inc.: New York, NY, USA, 1998. [Google Scholar]
  2. Ertl, G.; Knözinger, H.; Weitkamp, J. Handbook of Heterogeneous Catalysis; Wiley-VCH: Weinheim, Germany, 2008. [Google Scholar]
  3. Hüfner, S. Photoelectron Spectroscopy; Springer: Berlin, Germany, 1995. [Google Scholar]
  4. Starr, D.E.; Liu, Z.; Havecker, M.; Knop-Gericke, A.; Bluhm, H. Investigation of solid/vapor interfaces using ambient pressure X-ray photoelectron spectroscopy. Chem. Soc. Rev. 2013, 42, 5833–5857. [Google Scholar] [CrossRef] [PubMed]
  5. Gao, F.; McClure, S.M.; Cai, Y.; Gath, K.K.; Wang, Y.; Chen, M.S.; Guo, Q.L.; Goodman, D.W. CO oxidation trends on Pt-group metals from ultrahigh vacuum to near atmospheric pressures: A combined in situ PM-IRAS and reaction kinetics study. Surf. Sci. 2009, 603, 65–70. [Google Scholar] [CrossRef]
  6. Rupprechter, G.; Weilach, C. Mind the gap! Spectroscopy of catalytically active phases. Nano Today 2007, 2, 20–29. [Google Scholar] [CrossRef]
  7. Hendriksen, B.L.M.; Bobaru, S.C.; Frenken, J.W.M. Oscillatory CO oxidation on Pd(100) studied with in situ scanning tunneling microscopy. Surf. Sci. 2004, 552, 229–242. [Google Scholar] [CrossRef]
  8. Gustafson, J.; Shipilin, M.; Zhang, C.; Stierle, A.; Hejral, U.; Ruett, U.; Gutowski, O.; Carlsson, P.-A.; Skoglundh, M.; Lundgren, E. High-energy surface X-ray diffraction for fast surface structure determination. Science 2014, 343, 758–761. [Google Scholar] [CrossRef] [PubMed]
  9. Bañares, M.A. Operando methodology: Combination of in situ spectroscopy and simultaneous activity measurements under catalytic reaction conditions. Catal. Today 2005, 100, 71–77. [Google Scholar] [CrossRef]
  10. Blomberg, S.; Zhou, J.; Gustafson, J.; Zetterberg, J.; Lundgren, E. 2D and 3D imaging of the gas phase close to an operating model catalyst by planar laser induced fluorescence. J. Phys. Condens. Matter 2016, 28, 453002. [Google Scholar] [CrossRef] [PubMed]
  11. Zellner, A.; Suntz, R.; Deutschmann, O. Two-dimensional spatial resolution of concentration profiles in catalytic reactors by planar laser-induced fluorescence: NO reduction over diesel oxidation catalysts. Angew. Chem. Int. Ed. 2015, 54, 2653–2655. [Google Scholar] [CrossRef] [PubMed]
  12. Blomberg, S.; Zetterberg, J.; Zhou, J.; Merte, L.R.; Gustafson, J.; Shipilin, M.; Trinchero, A.; Miccio, L.A.; Magaña, A.; Ilyn, M.; et al. Strain dependent light-off temperature in catalysis revealed by planar laser-induced fluorescence. ACS Catal. 2016, 110–114. [Google Scholar] [CrossRef]
  13. Zetterberg, J.; Blomberg, S.; Gustafson, J.; Evertsson, J.; Zhou, J.; Adams, E.C.; Carlsson, P.-A.; Aldén, M.; Lundgren, E. Spatially and temporally resolved gas distributions around heterogeneous catalysts using infrared planar laser-induced fluorescence. Nat. Commun. 2015, 6, 7076. [Google Scholar] [CrossRef] [PubMed]
  14. Blomberg, S.; Brackmann, C.; Gustafson, J.; Aldén, M.; Lundgren, E.; Zetterberg, J. Real-time gas-phase imaging over a Pd(110) catalyst during CO oxidation by means of planar laser-induced fluorescence. ACS Catal. 2015, 5, 2028–2034. [Google Scholar] [CrossRef] [PubMed]
  15. Toyoshima, R.; Yoshida, M.; Monya, Y.; Kousa, Y.; Suzuki, K.; Abe, H.; Mun, B.S.; Mase, K.; Amemiya, K.; Kondoh, H. In situ ambient pressure XPS study of CO oxidation reaction on Pd(111) surfaces. J. Phys. Chem. C 2012, 116, 18691–18697. [Google Scholar] [CrossRef]
  16. Blomberg, S.; Hoffmann, M.J.; Gustafson, J.; Martin, N.M.; Fernandes, V.R.; Borg, A.; Liu, Z.; Chang, R.; Matera, S.; Reuter, K.; et al. In-situ X-ray photoelectron spectroscopy of model catalysts: At the edge of the gap. Phys. Rev. Lett. 2013, 110, 117601. [Google Scholar] [CrossRef] [PubMed]
  17. Toyoshima, R.; Yoshida, M.; Monya, Y.; Suzuki, K.; Mun, B.S.; Amemiya, K.; Mase, K.; Kondoh, H. Active surface oxygen for catalytic CO oxidation on Pd(100) proceeding under near ambient pressure conditions. J. Phys. Chem. Lett. 2012, 3, 3182–3187. [Google Scholar] [CrossRef] [PubMed]
  18. Toyoshima, R.; Yoshida, M.; Monya, Y.; Suzuki, K.; Amemiya, K.; Mase, K.; Mun, B.S.; Kondoh, H. In situ photoemission observation of catalytic CO oxidation reaction on Pd(110) under near-ambient pressure conditions: Evidence for the Langmuir–Hinshelwood mechanism. J. Phys. Chem. C 2013, 117, 20617–20624. [Google Scholar] [CrossRef]
  19. Matera, S.; Reuter, K. Transport limitations and bistability for in situ CO oxidation at RuO2(110): First-principles based multiscale modeling. Phys. Rev. B 2010, 82, 085446. [Google Scholar] [CrossRef]
  20. Matera, S.; Blomberg, S.; Hoffmann, M.J.; Zetterberg, J.; Gustafson, J.; Lundgren, E.; Reuter, K. Evidence for the active phase of heterogeneous catalysts through in situ reaction product imaging and multiscale modeling. ACS Catal. 2015, 5, 4514–4518. [Google Scholar] [CrossRef]
  21. Blomberg, S.; Zetterberg, J.; Gustafson, J.; Zhou, J.; Brackmann, C.; Lundgren, E. Comparison of AP-XPS and PLIF measurements during CO oxidation over Pd single crystals. Top. Catal. 2016, 59, 478–486. [Google Scholar] [CrossRef]
  22. Bluhm, H.; Hävecker, M.; Knop-Gericke, A.; Kiskinova, M.; Schlögl, R.; Salmeron, M. In situ X-ray photoelectron spectroscopy studies of gas-solid interfaces at near-ambient conditions. MRS Bull. 2007, 32, 1022–1030. [Google Scholar] [CrossRef]
  23. Kahk, J.M.; Villar-Garcia, I.J.; Grechy, L.; Bruce, P.J.K.; Vincent, P.E.; Eriksson, S.K.; Rensmo, H.; Hahlin, M.; Åhlund, J.; Edwards, M.O.M.; et al. A study of the pressure profiles near the first pumping aperture in a high pressure photoelectron spectrometer. J. Electron Spectrosc. Relat. Phenom. 2015, 205, 57–65. [Google Scholar] [CrossRef]
  24. Matera, S.; Reuter, K. When atomic-scale resolution is not enough: Spatial effects on in situ model catalyst studies. J. Catal. 2012, 295, 261–268. [Google Scholar] [CrossRef]
  25. Matera, S.; Maestri, M.; Cuoci, A.; Reuter, K. Predictive-quality surface reaction chemistry in real reactor models: Integrating first-principles kinetic monte carlo simulations into computational fluid dynamics. ACS Catal. 2014, 4, 4081–4092. [Google Scholar] [CrossRef]
  26. Schnadt, J.; Knudsen, J.; Andersen, J.N.; Siegbahn, H.; Pietzsch, A.; Hennies, F.; Johansson, N.; Martensson, N.; Ohrwall, G.; Bahr, S.; et al. The new ambient-pressure X-ray photoelectron spectroscopy instrument at MAX-lab. J. Synchrotron Radiat. 2012, 19, 701–704. [Google Scholar] [CrossRef] [PubMed]
  27. Maibach, J.; Xu, C.; Eriksson, S.K.; Åhlund, J.; Gustafsson, T.; Siegbahn, H.; Rensmo, H.; Edström, K.; Hahlin, M. A high pressure X-ray photoelectron spectroscopy experimental method for characterization of solid-liquid interfaces demonstrated with a Li-ion battery system. Rev. Sci. Instrum. 2015, 86, 044101. [Google Scholar] [CrossRef] [PubMed]
  28. Takagi, Y.; Wang, H.; Uemura, Y.; Ikenaga, E.; Sekizawa, O.; Uruga, T.; Ohashi, H.; Senba, Y.; Yumoto, H.; Yamazaki, H.; et al. In situ study of an oxidation reaction on a Pt/C electrode by ambient pressure hard X-ray photoelectron spectroscopy. Appl. Phys. Lett. 2014, 105, 131602. [Google Scholar] [CrossRef]
  29. Zetterberg, J.; Blomberg, S.; Gustafson, J.; Sun, Z.W.; Li, Z.S.; Lundgren, E.; Aldén, M. An in situ set up for the detection of CO2 from catalytic CO oxidation by using planar laser-induced fluorescence. Rev. Sci. Instrum. 2012, 83, 053104. [Google Scholar] [CrossRef] [PubMed]
Figure 1. CO2 distribution over a Pd(100) single-crystal catalyst: (a) schematic of the nozzle which is connected to a vacuum pump and a mass spectrometer; (b) average CO2 planar laser-induced fluorescence (PLIF) signal inside the white hollow box above the sample indicated by the white solid box; (c) Mass spectrometer (MS) profiles of O2, CO and CO2; (df) CO2 PLIF images (10 laser-shot averaged, representing a time interval of 1 s) recorded at 300, 330 and 348 °C during the temperature ramp at a constant rate of 16 °C/min.
Catalysts 07 00029 g001
Figure 2. The CO2 signals (here normalized to the initial CO partial pressures for comparison) measured by (a) PLIF at 150 mbar; (b) PLIF at 50 mbar; (c) PLIF at 25 mbar; (d) MS at 150 mbar; (e) MS at 50 mbar; (f) MS at 25 mbar. For 150 and 50 mbar pressures, three different flow rates are shown for comparison, while for 25 mbar only one flow rate is shown. All reactions are performed using 1:1 ratio of CO and O2 and the same temperature ramp-up speed. A 4:4:92 ratio of CO, O2 and Ar is used in 150 mbar with total flow of 120, 60 and 30 mLn/min, and in 50 mbar with total flow of 40 and 20 mLn/min. A 5:5:90 ratio of CO, O2 and Ar is used in 50 mbar with total flow of 10 mLn/min, and in 25 mbar with total flow of 10 mLn/min. The dashed line is for guidance in temperature reading.
Catalysts 07 00029 g002
Figure 3. Pressure and flow dependence of the CO2 distribution over a Pd(100) single-crystal catalyst in the mass transfer limited (MTL) regime: (ac) chamber pressure at 150 mbar, gas exchange rate at 40, 20 and 10 per minute, respectively; (df) chamber pressure at 50 mbar, gas exchange rate at 40, 20 and 10 per minute, respectively; (g) chamber pressure at 25 mbar, gas exchange rate at 20 per minute. All PLIF images are 1000 laser-shot averaged (acquisition time of 100 s). The nozzle is used as the gas outlet, which is connected to a vacuum pump and a mass spectrometer.
Catalysts 07 00029 g003
Figure 4. Normalized CO2 profiles (averaged over five rows) at 0.5 mm above the sample in the MTL regime. (a) Chamber pressure at 150 mbar for different gas exchange rates; (b) Gas exchange rate of 20 per minute for different chamber pressures.
Catalysts 07 00029 g004
Figure 5. CO2 distribution in the MTL regime for different flow configurations: (a) model ambient pressure X-ray photoelectron spectroscopy (AP-XPS) reactor where the nozzle is used as the gas outlet; (b) reactor with a nozzle but the gas outlet is located approximately 3 cm below the sample holder; (c) reactor without a nozzle, and the gas outlet is also located below the sample holder. All images are recorded under the same gas conditions, i.e., 6 mbar each of CO and O2 and 138 mbar of Ar (total flow of 120 mLn/min). All images are 1000 laser-shot averaged. In all configurations, the gas outlet is connected to both the vacuum pump and the MS. X denotes the CO2 partial pressures measured by the MS.
Catalysts 07 00029 g005

