
Catalytic Behaviour of CuO-CeO2 Systems Prepared by Different Synthetic Methodologies in the CO-PROX Reaction under CO2-H2O Feed Stream

 ,
,  ,
, 

Abstract
:1. Introduction
2. Results and Discussion
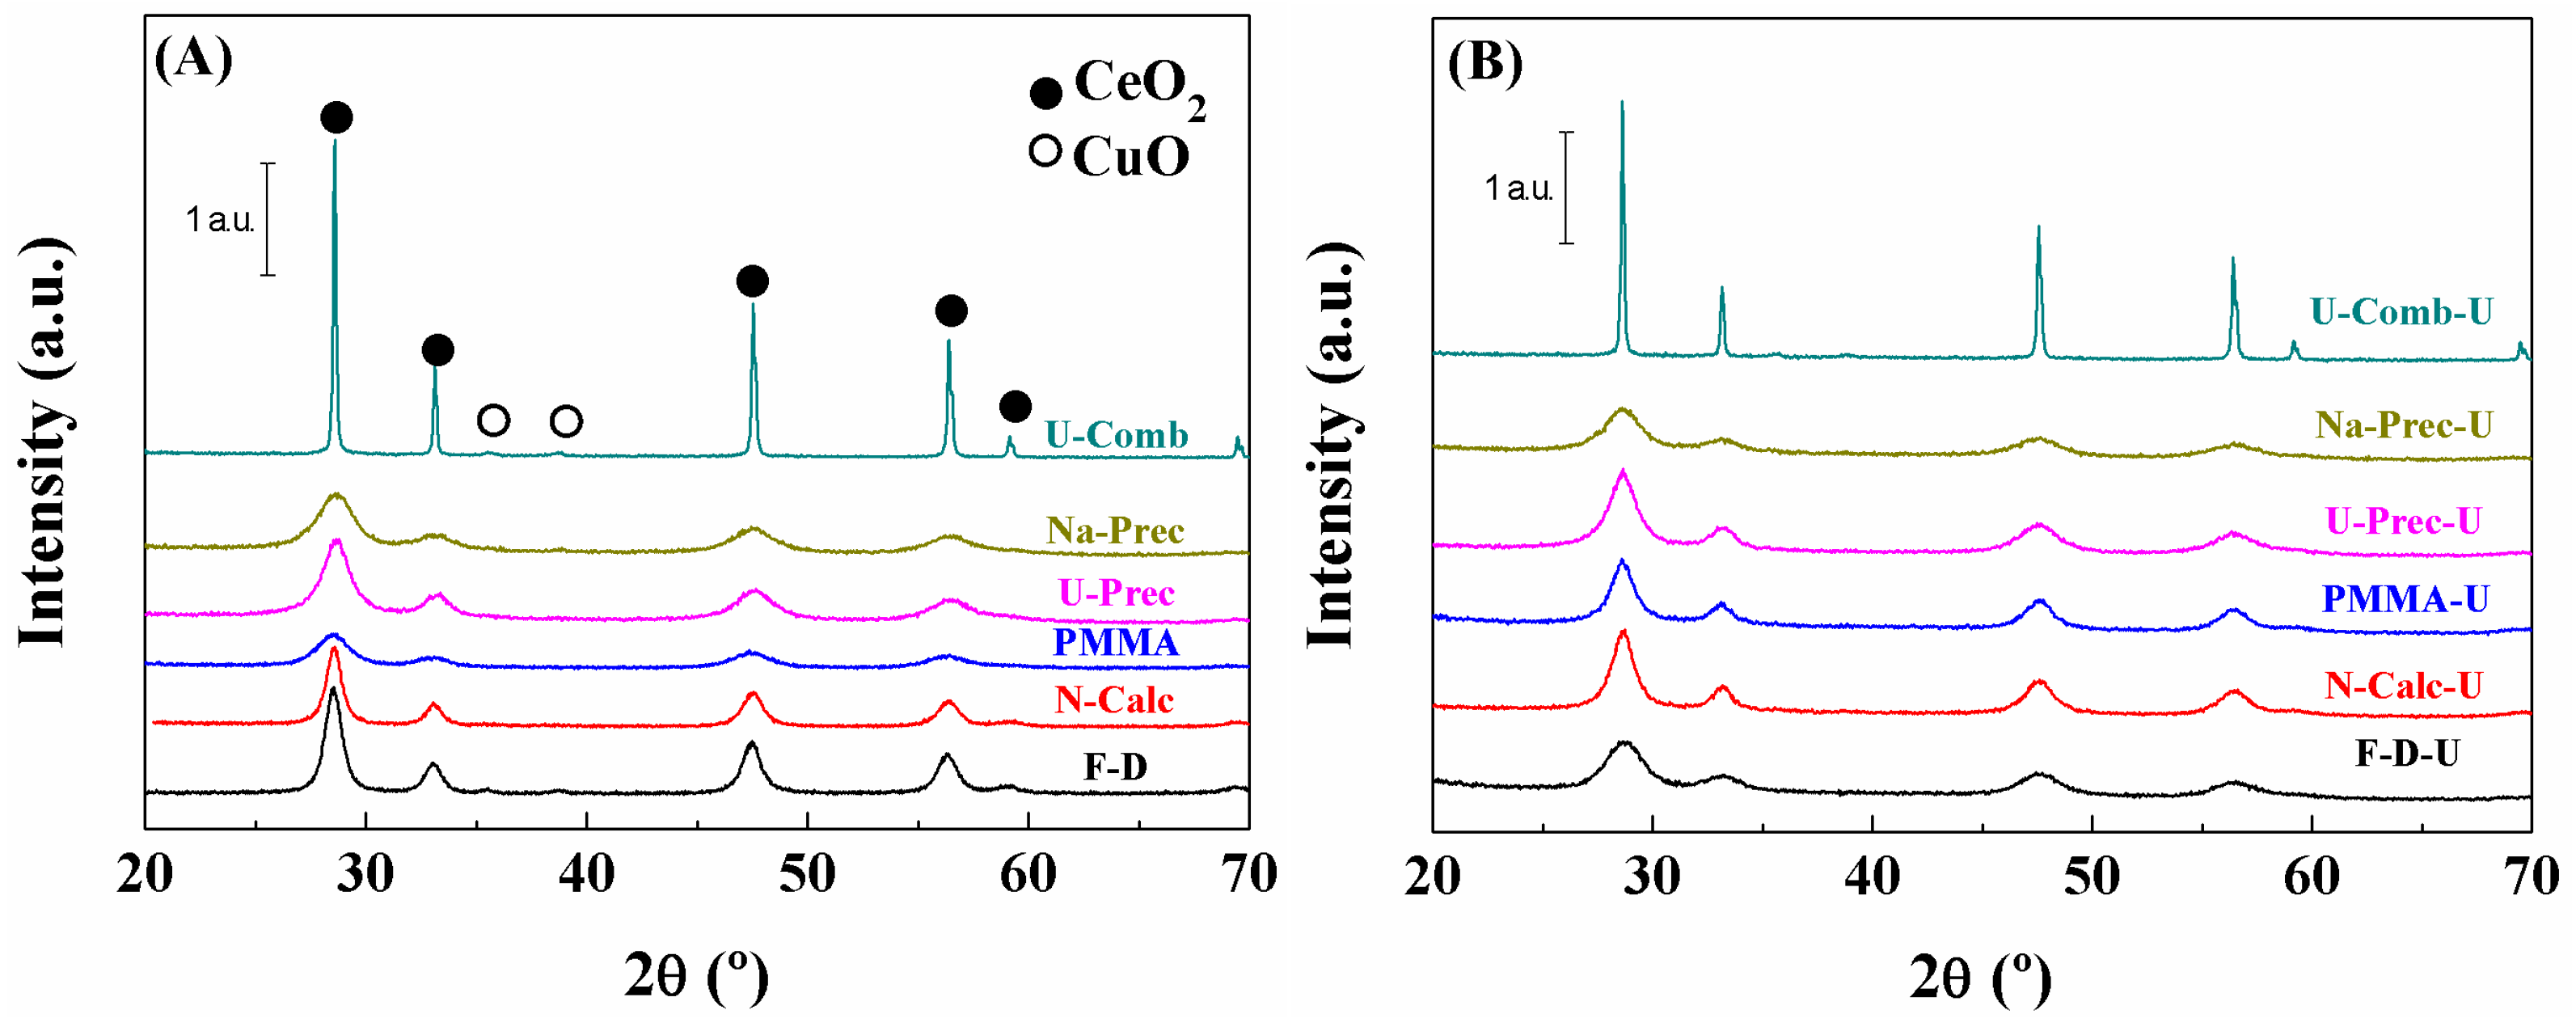
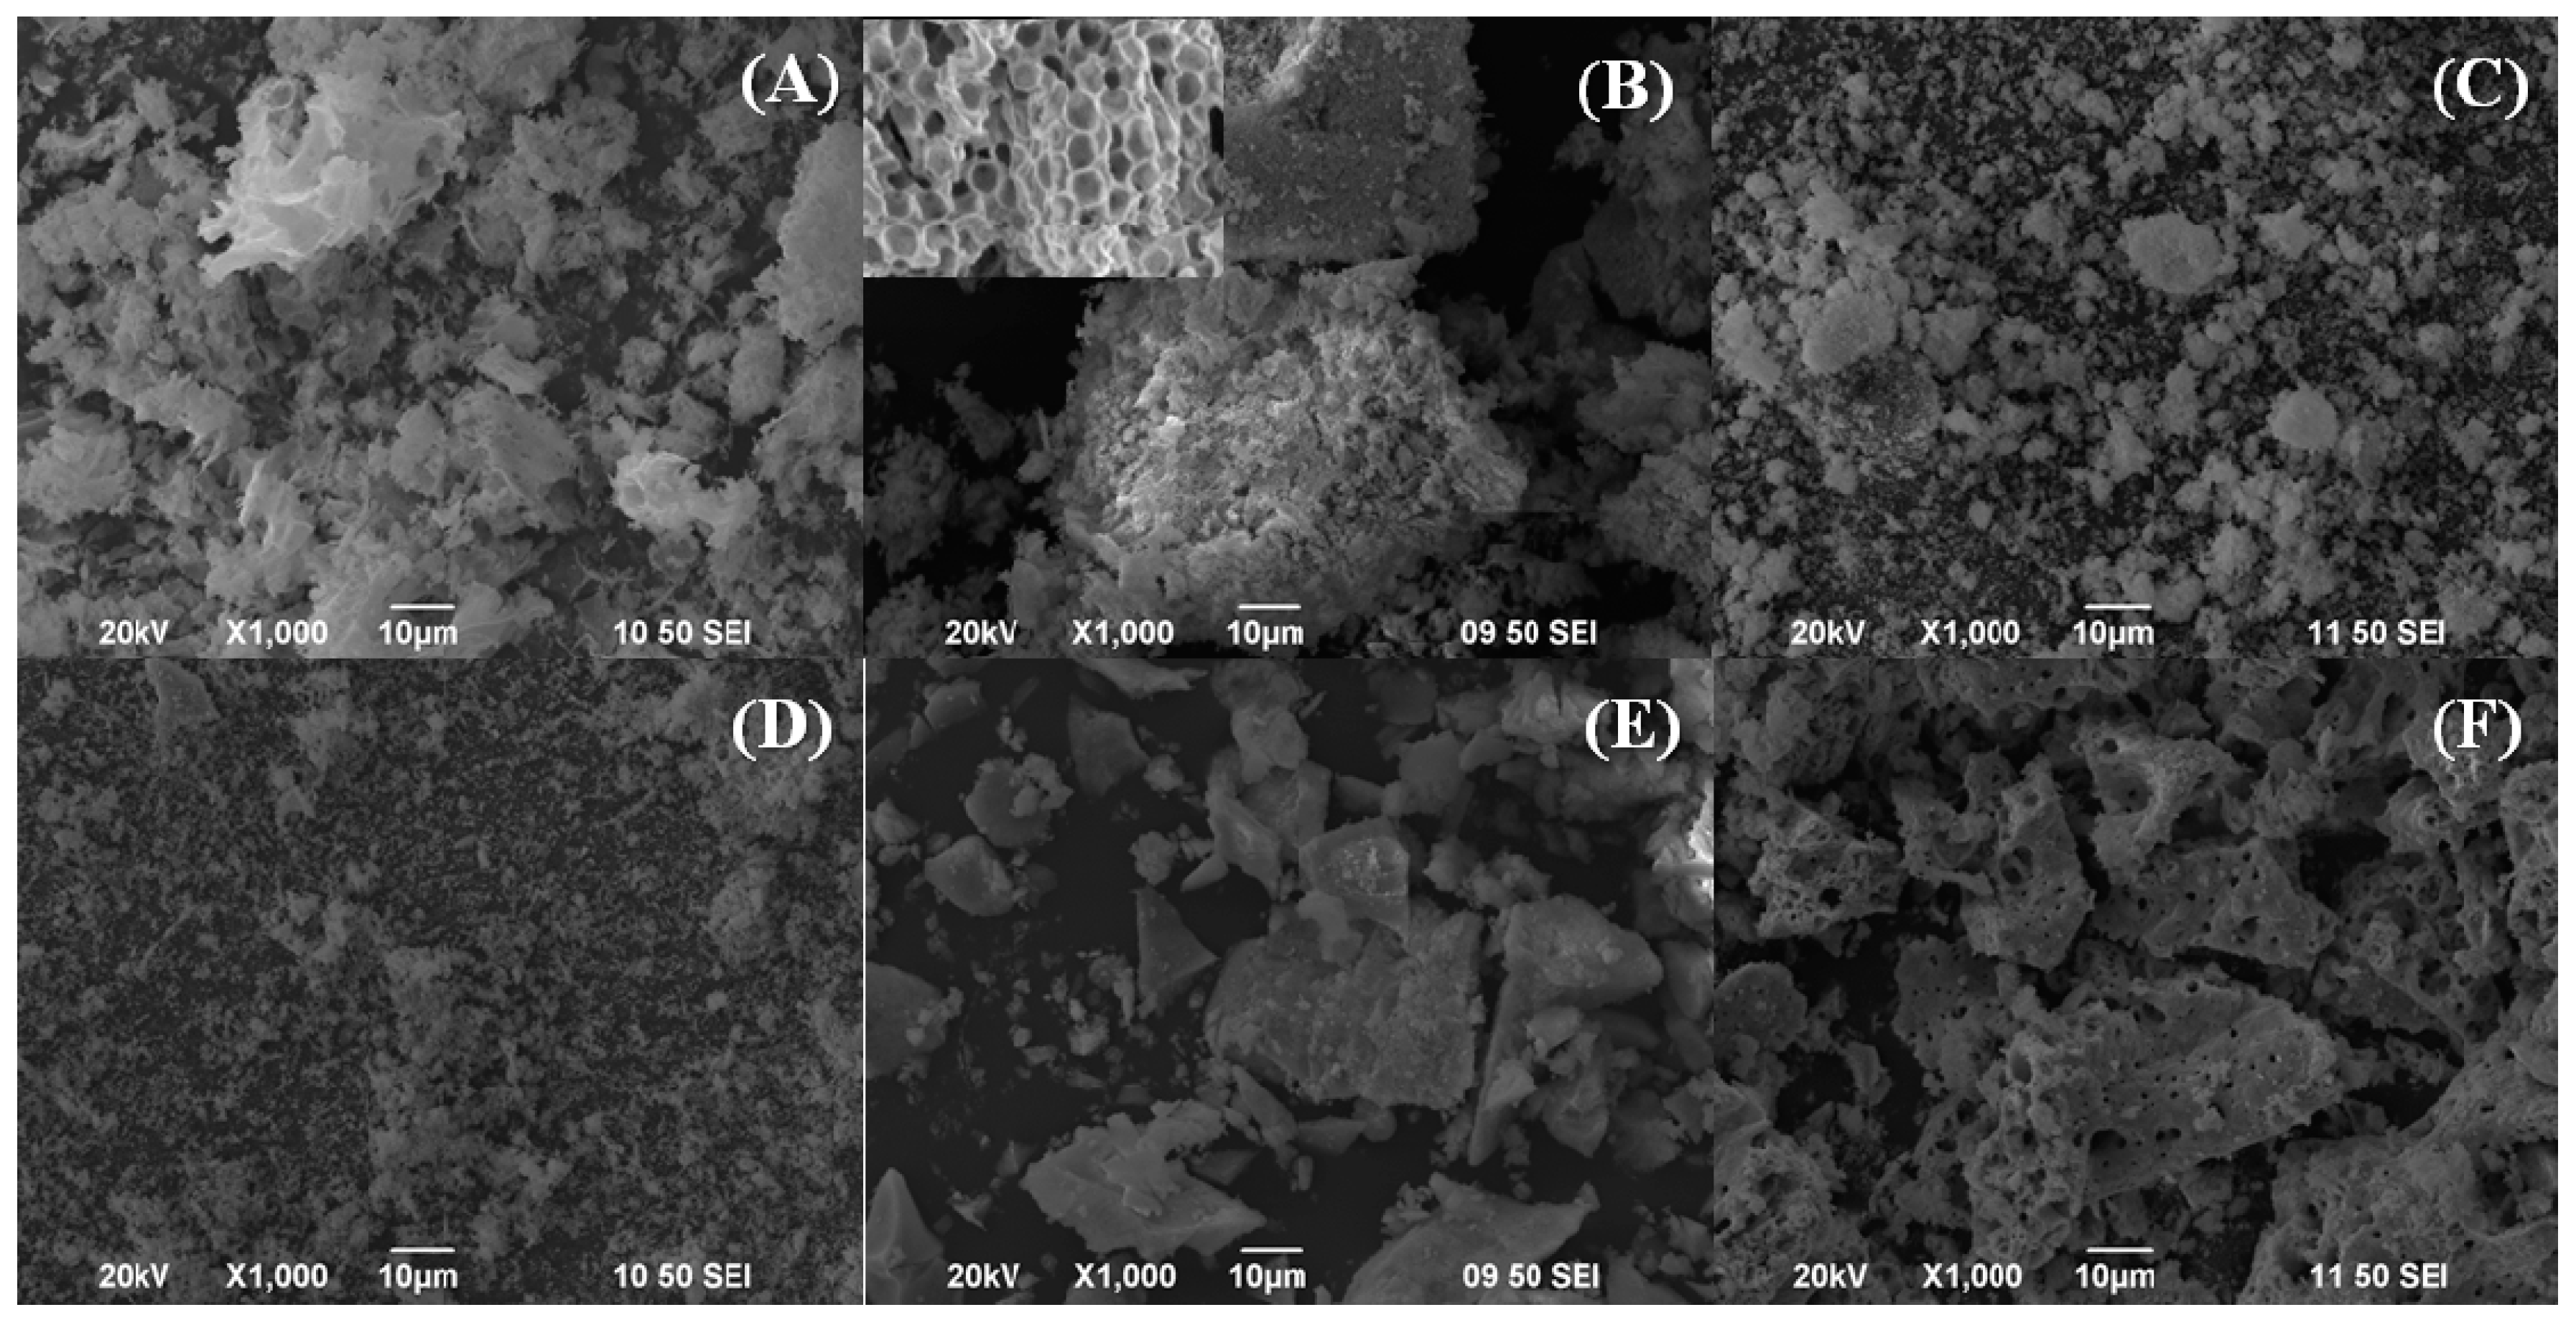
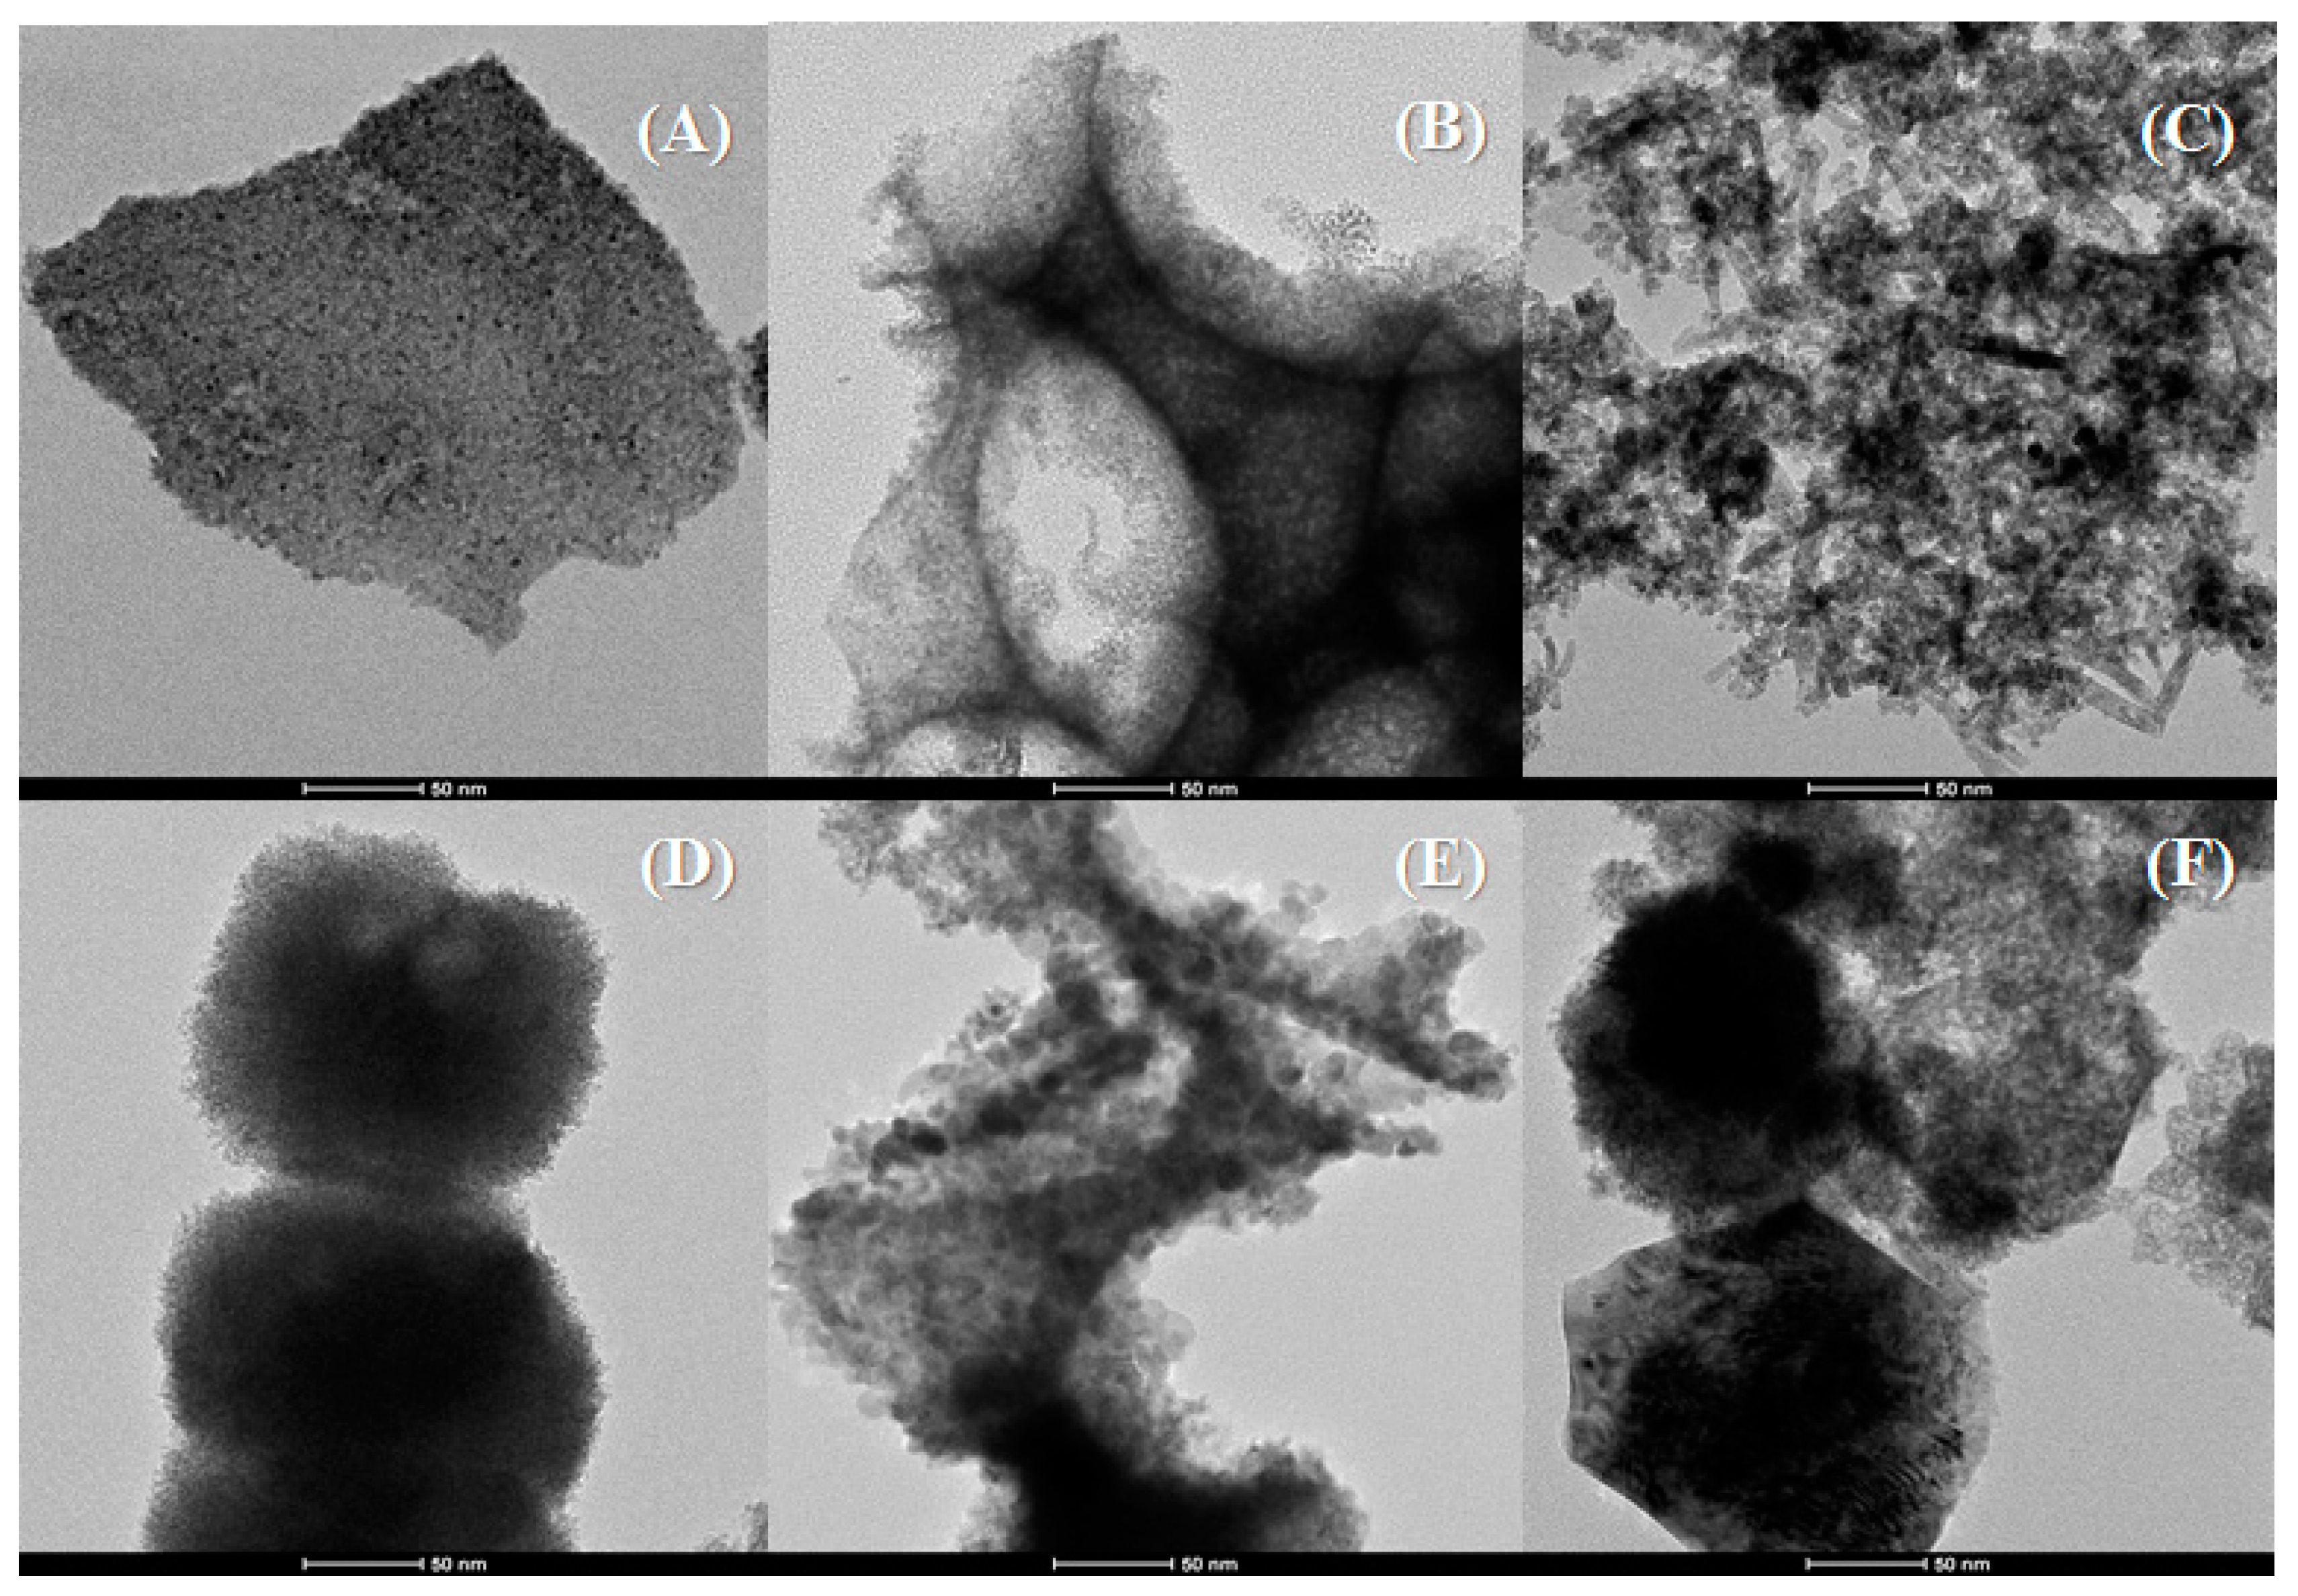
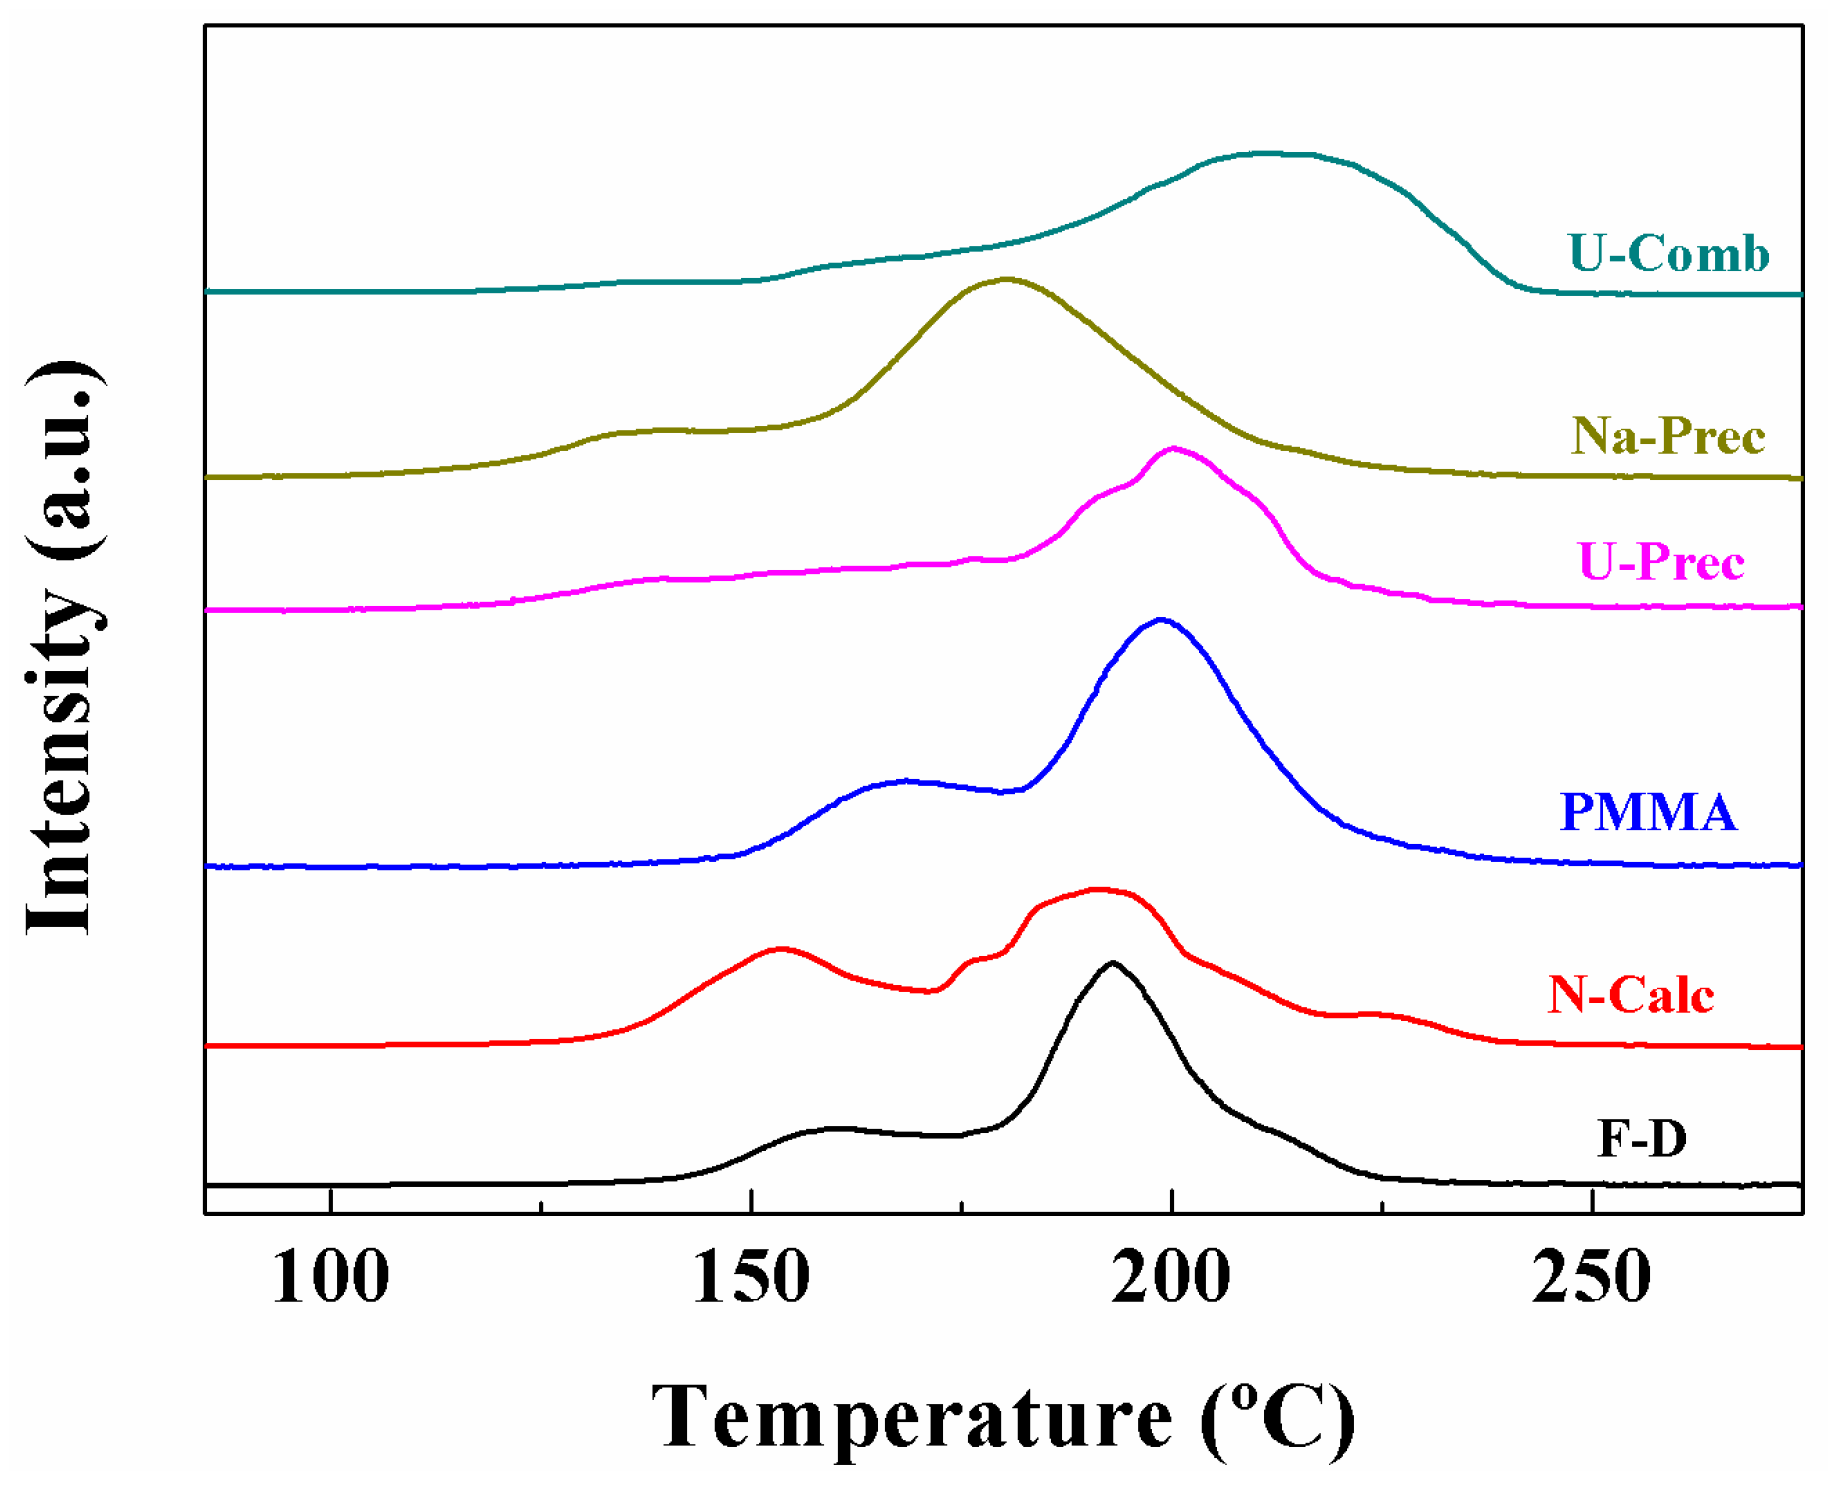
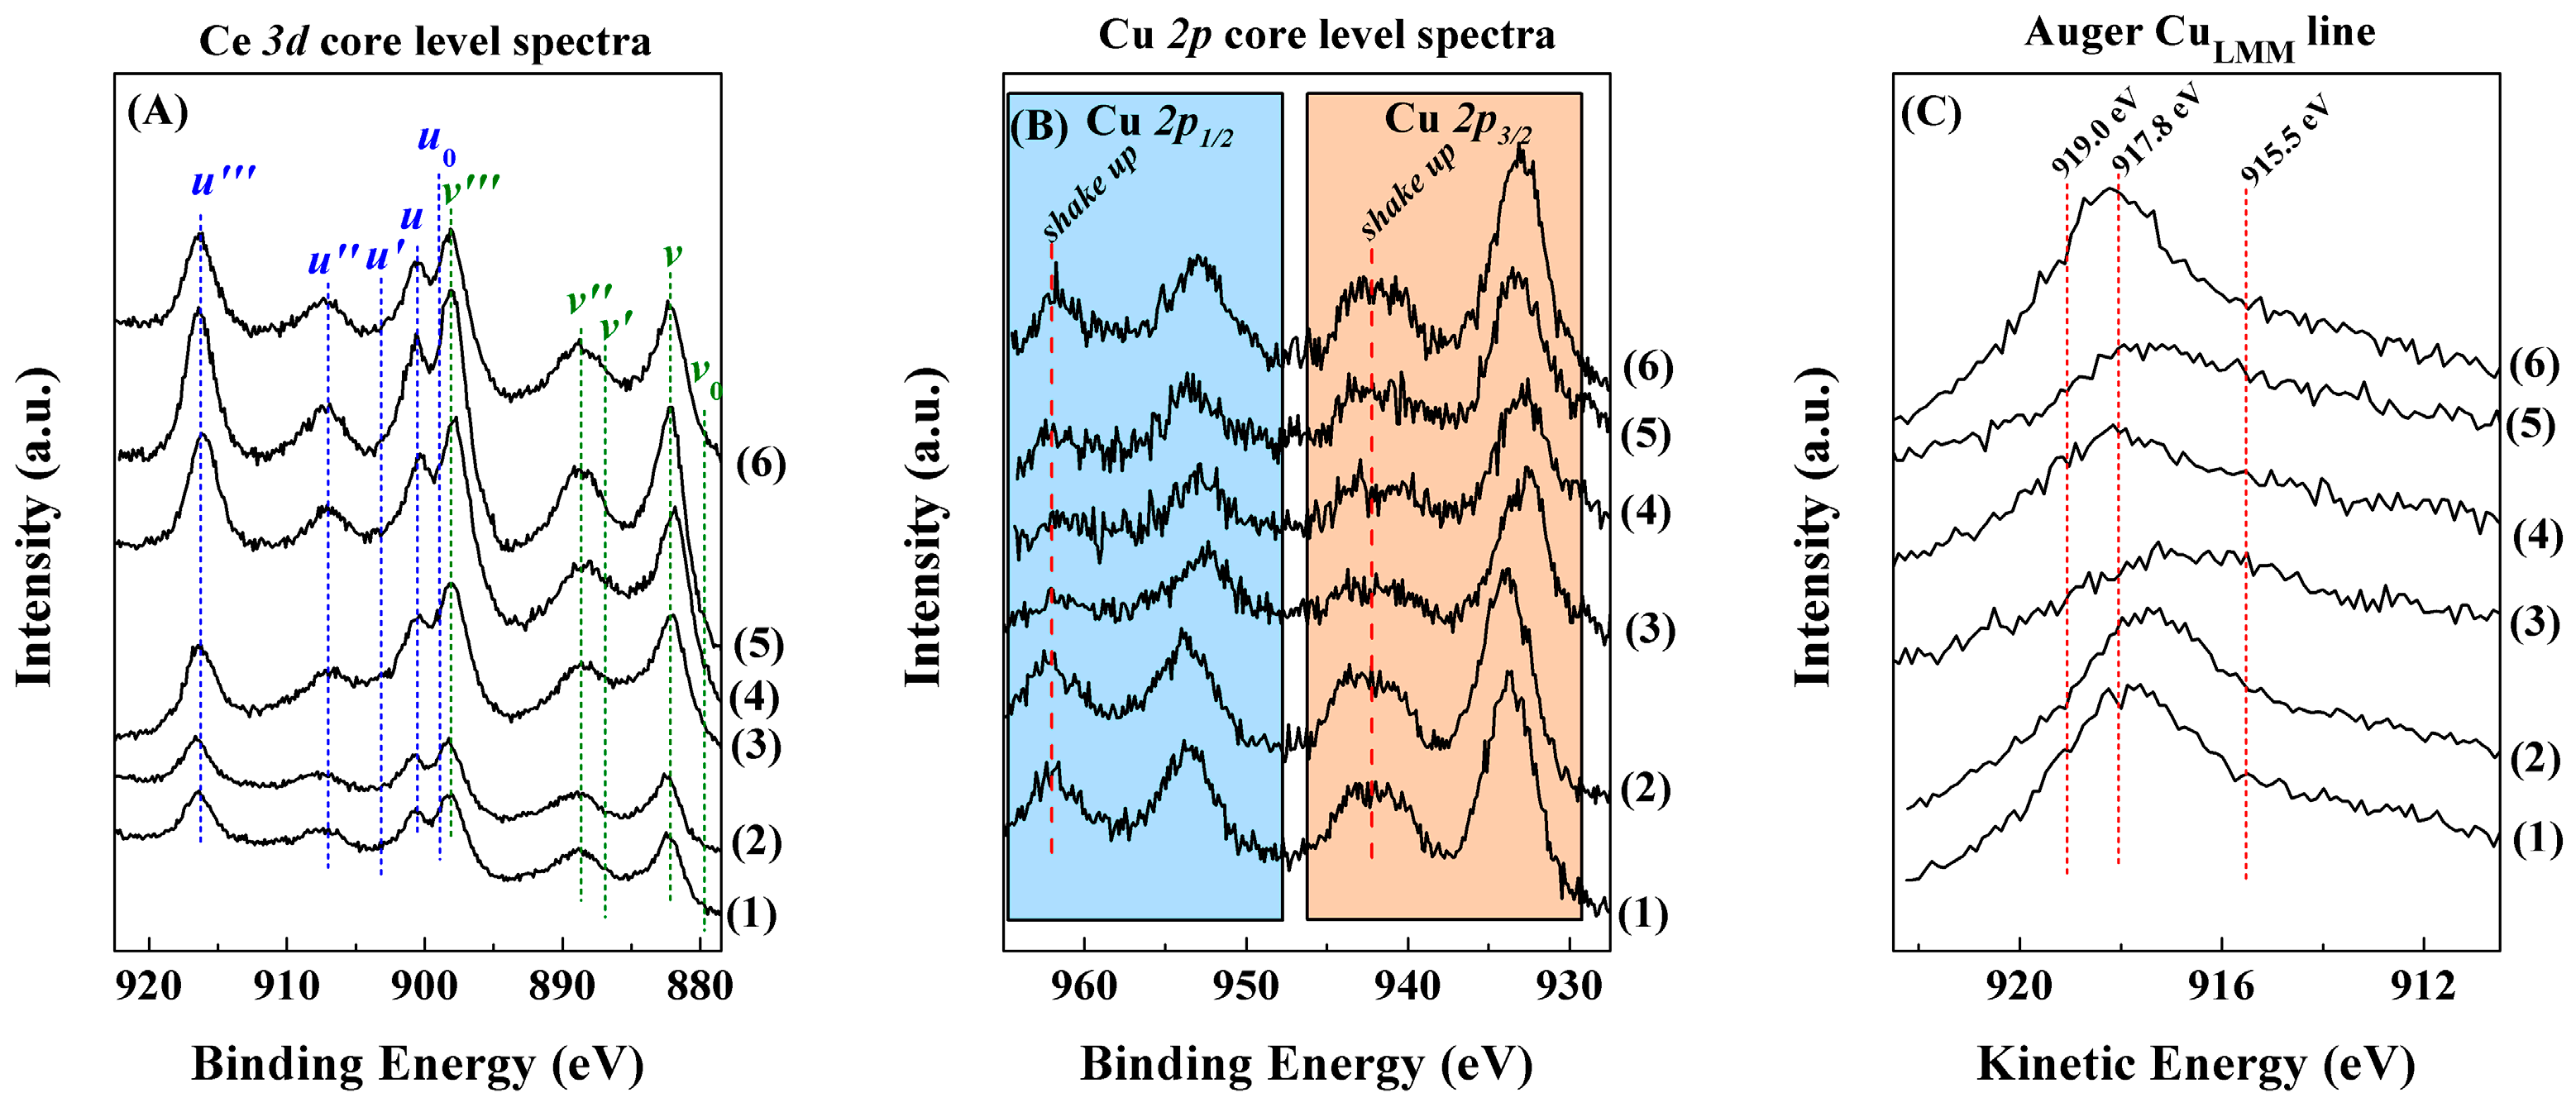
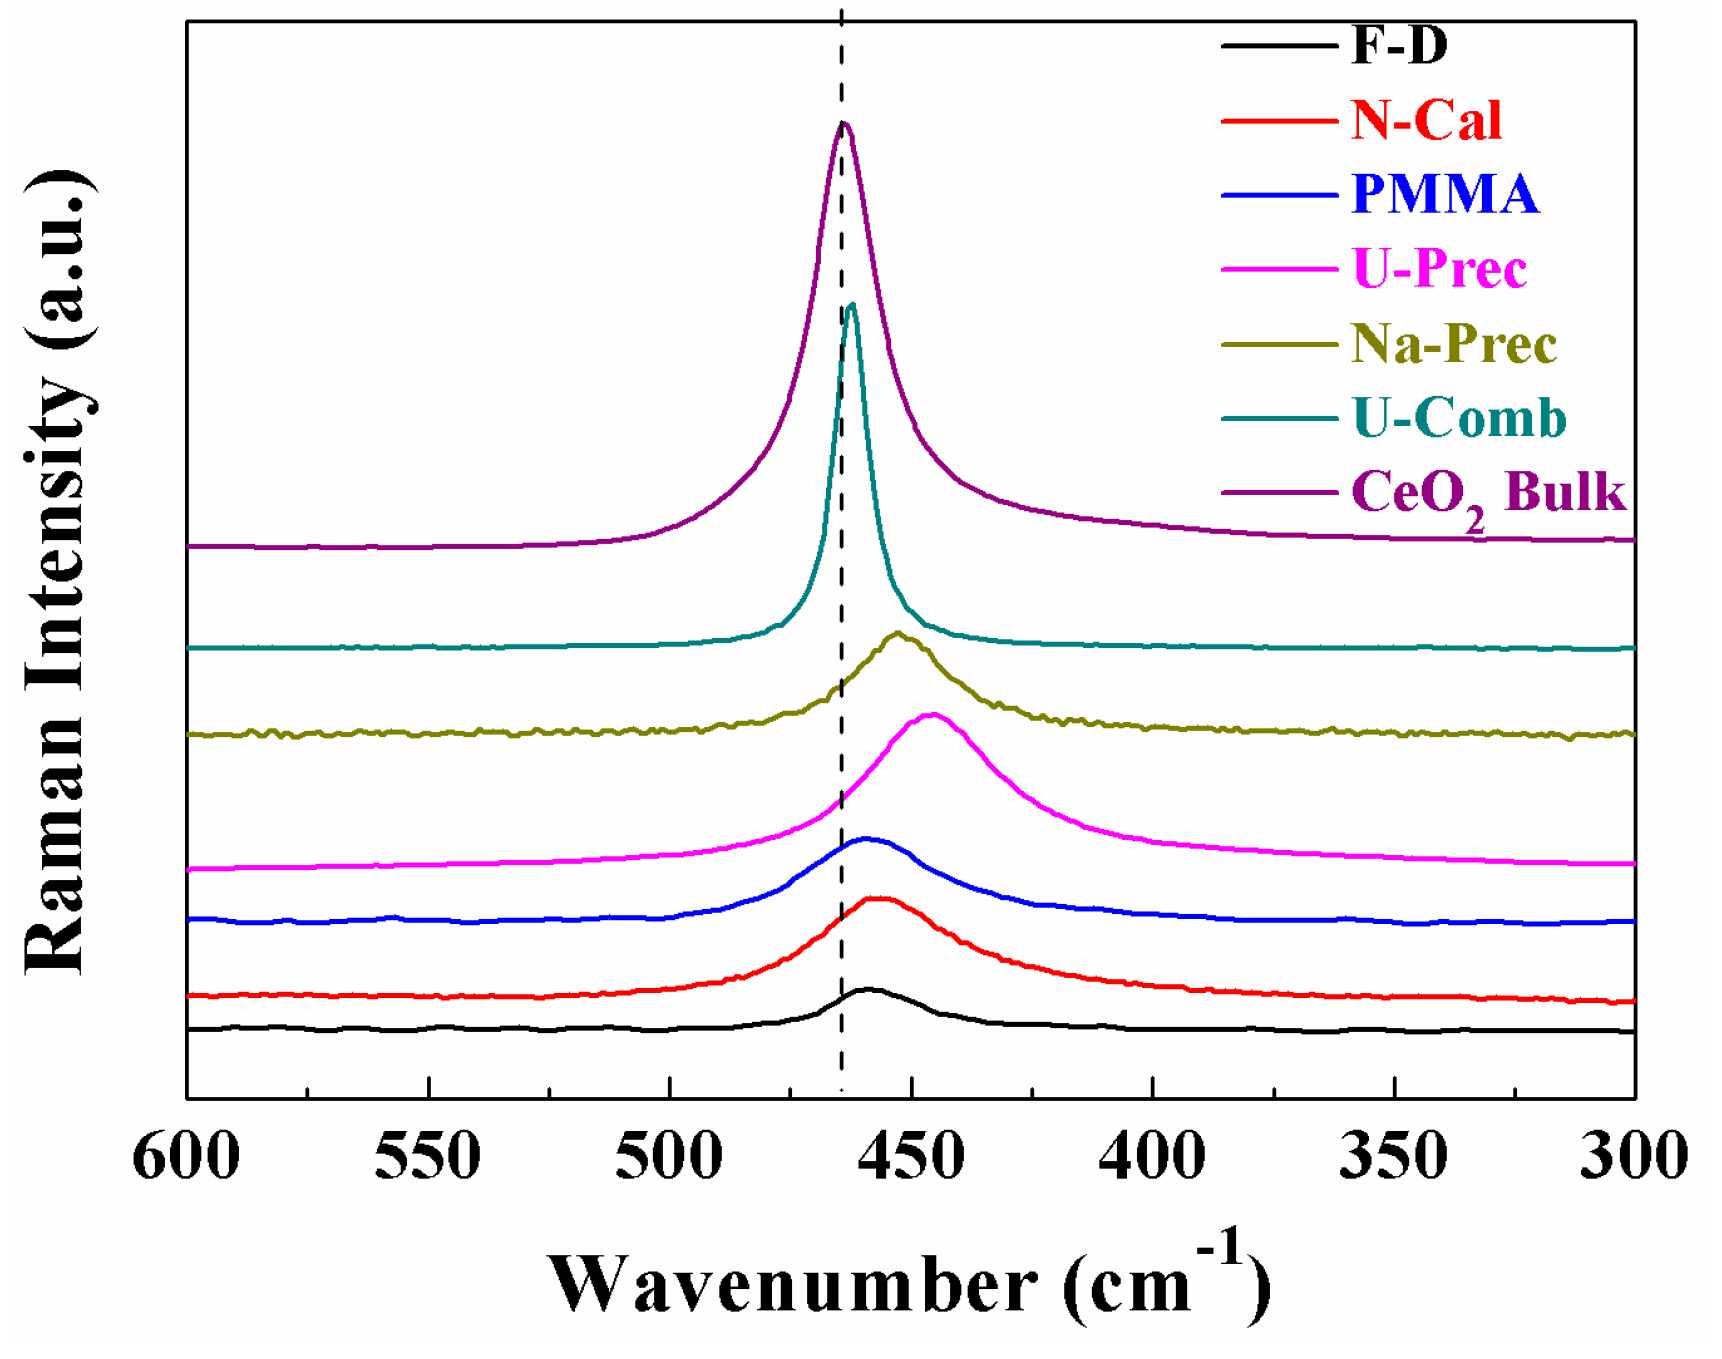
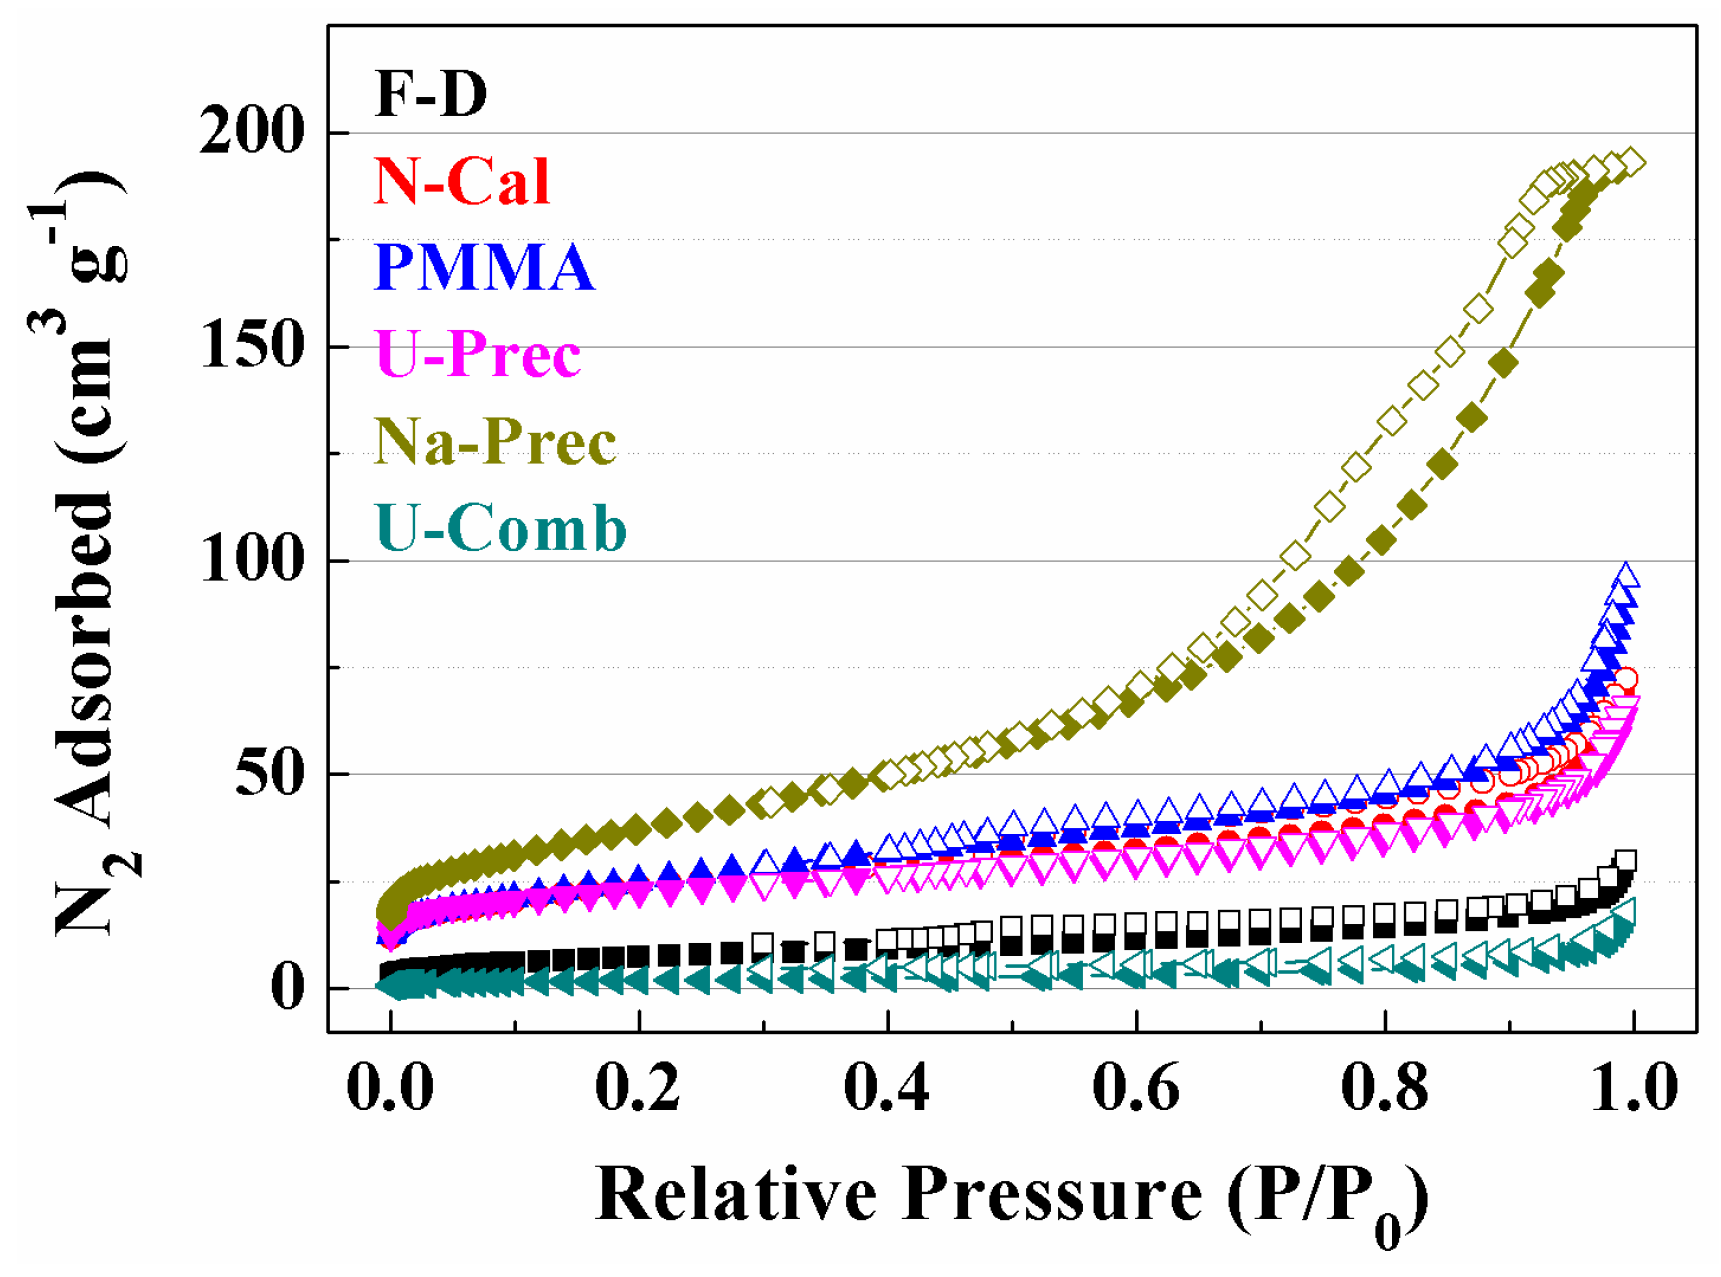
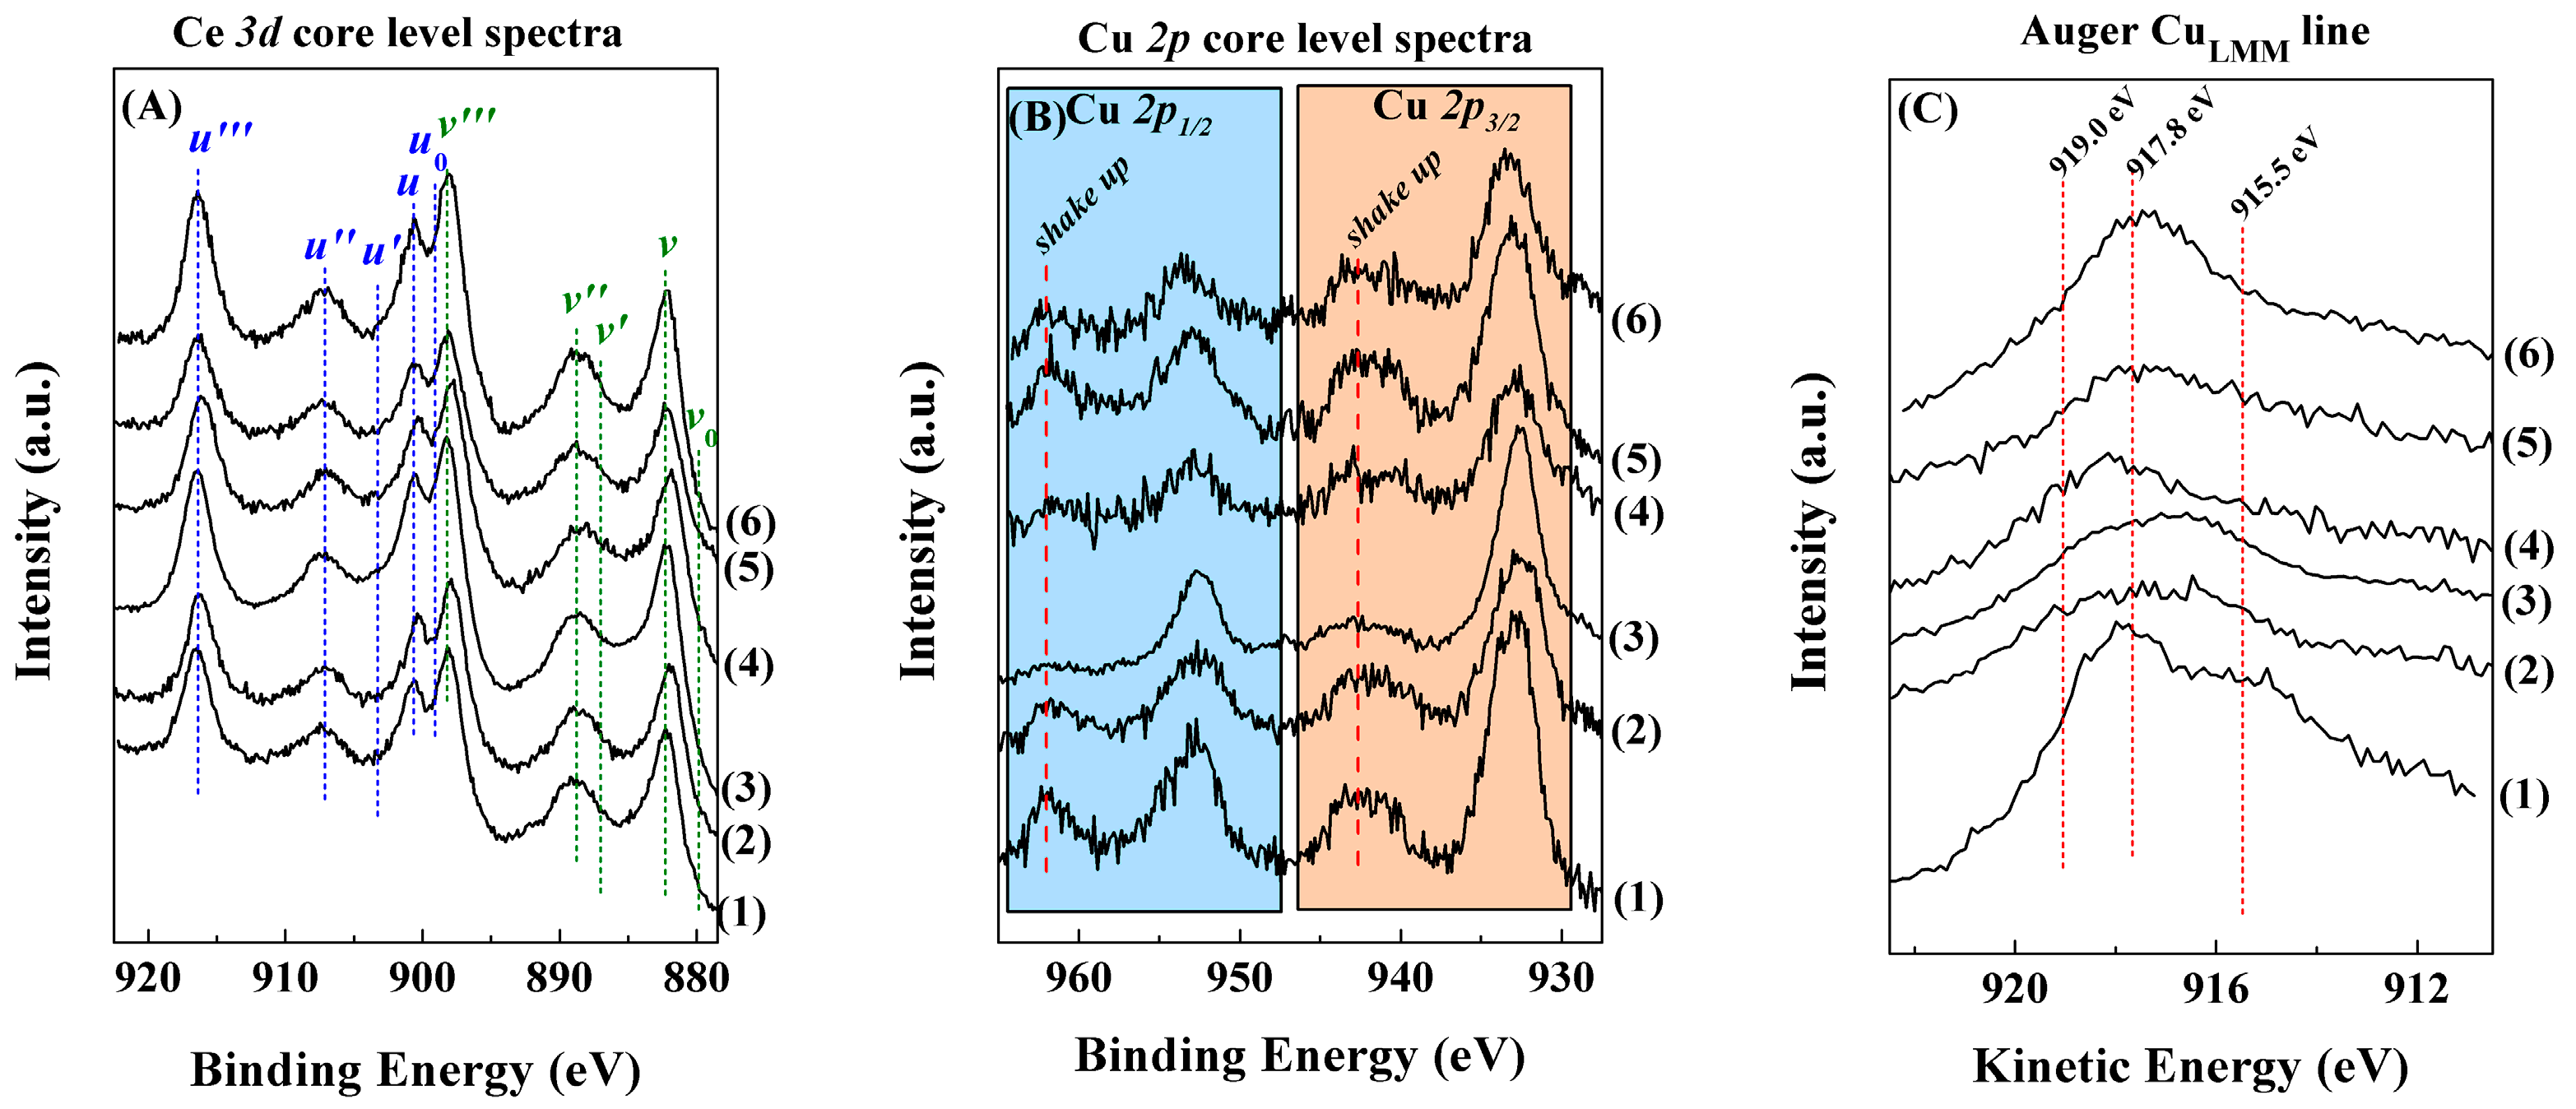
Characterisation of the Catalysts
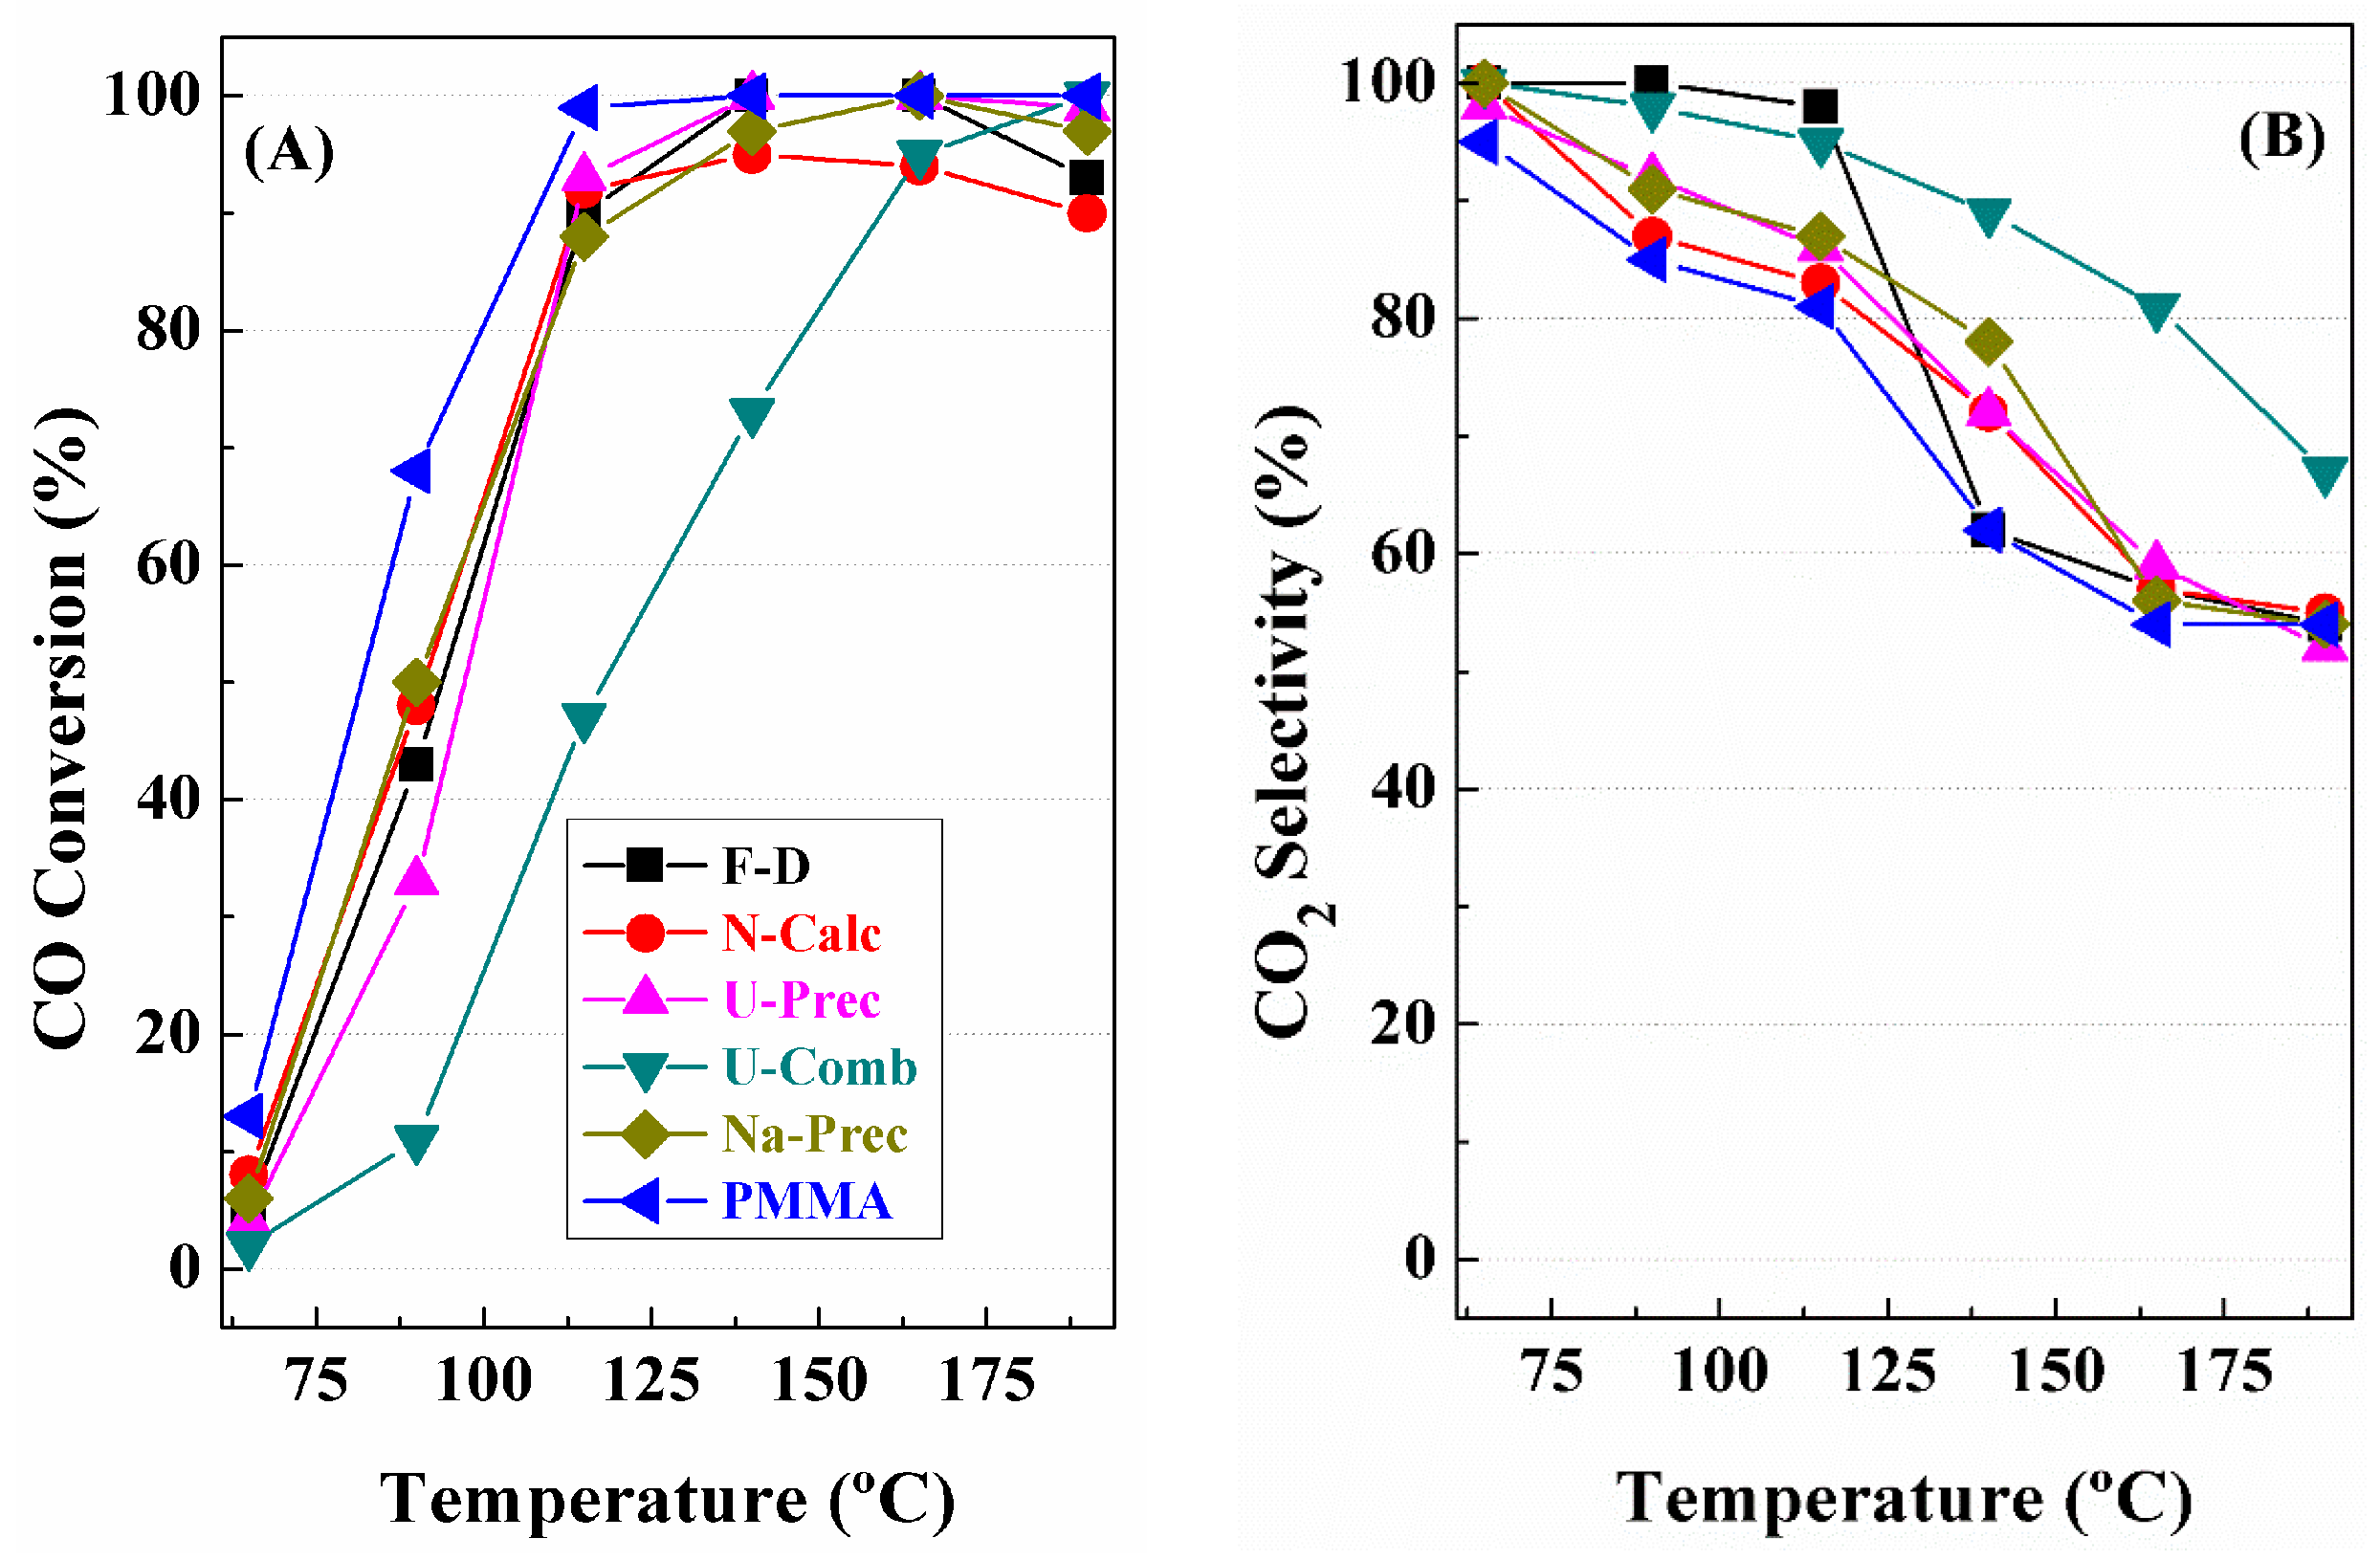
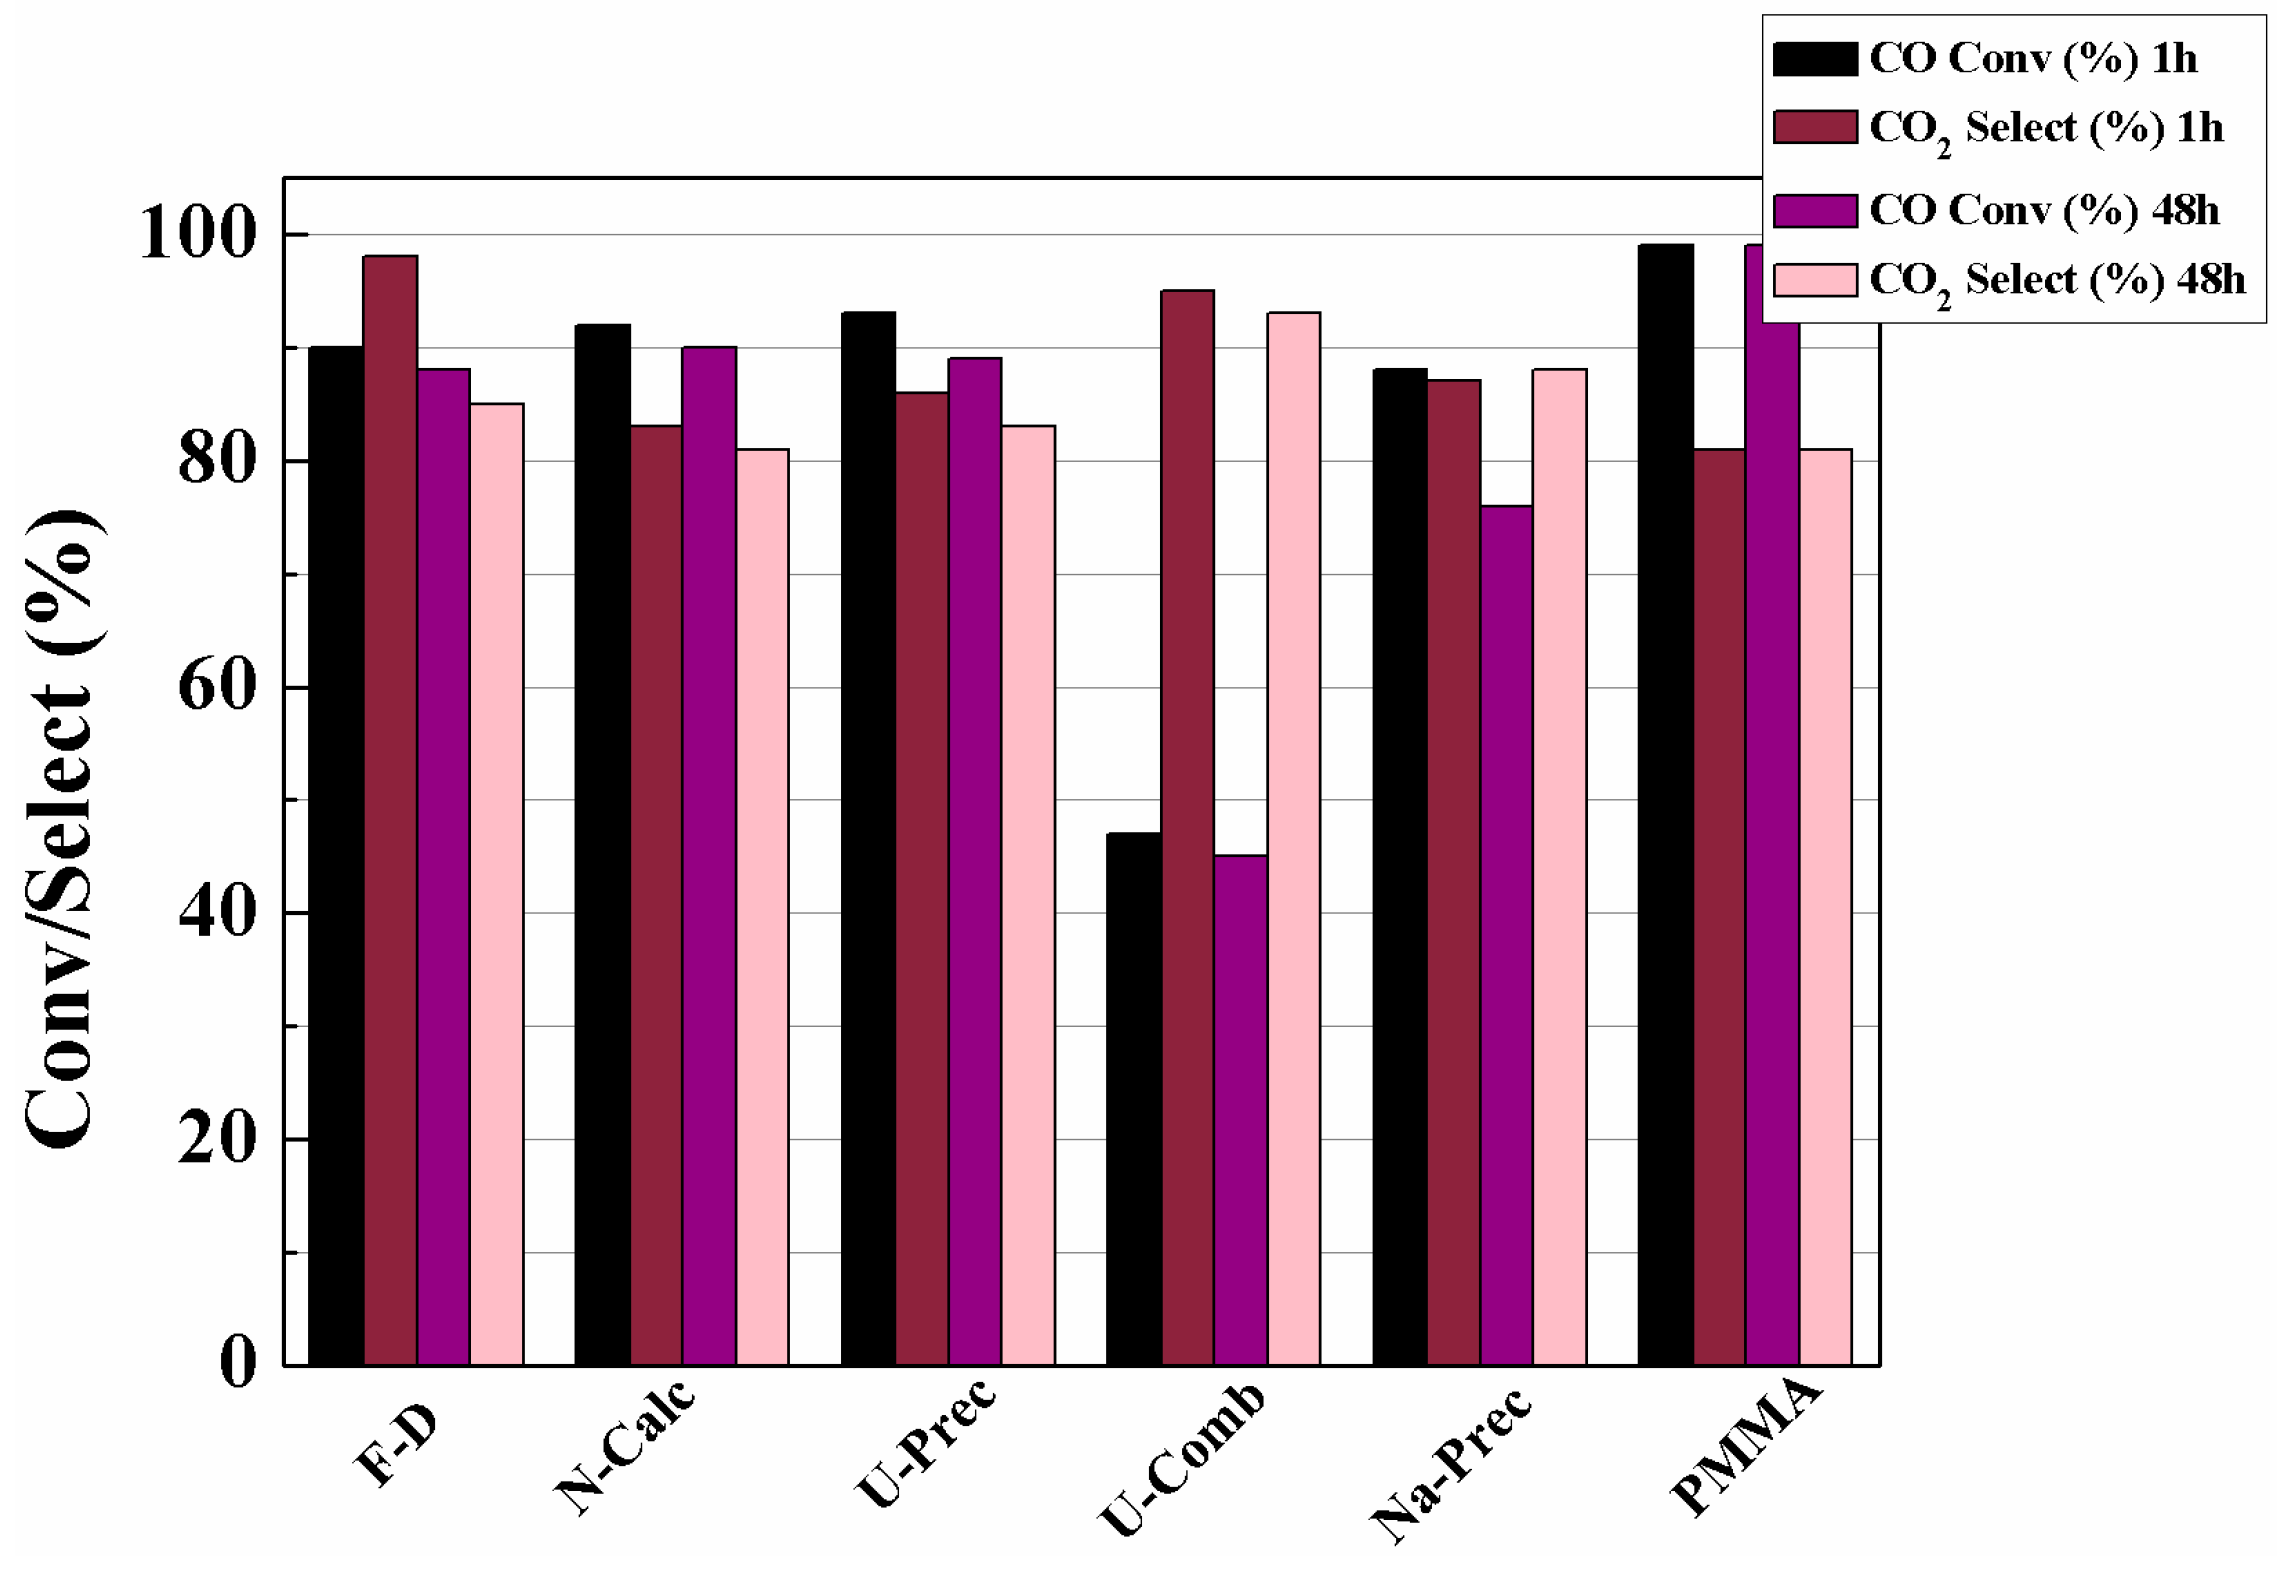
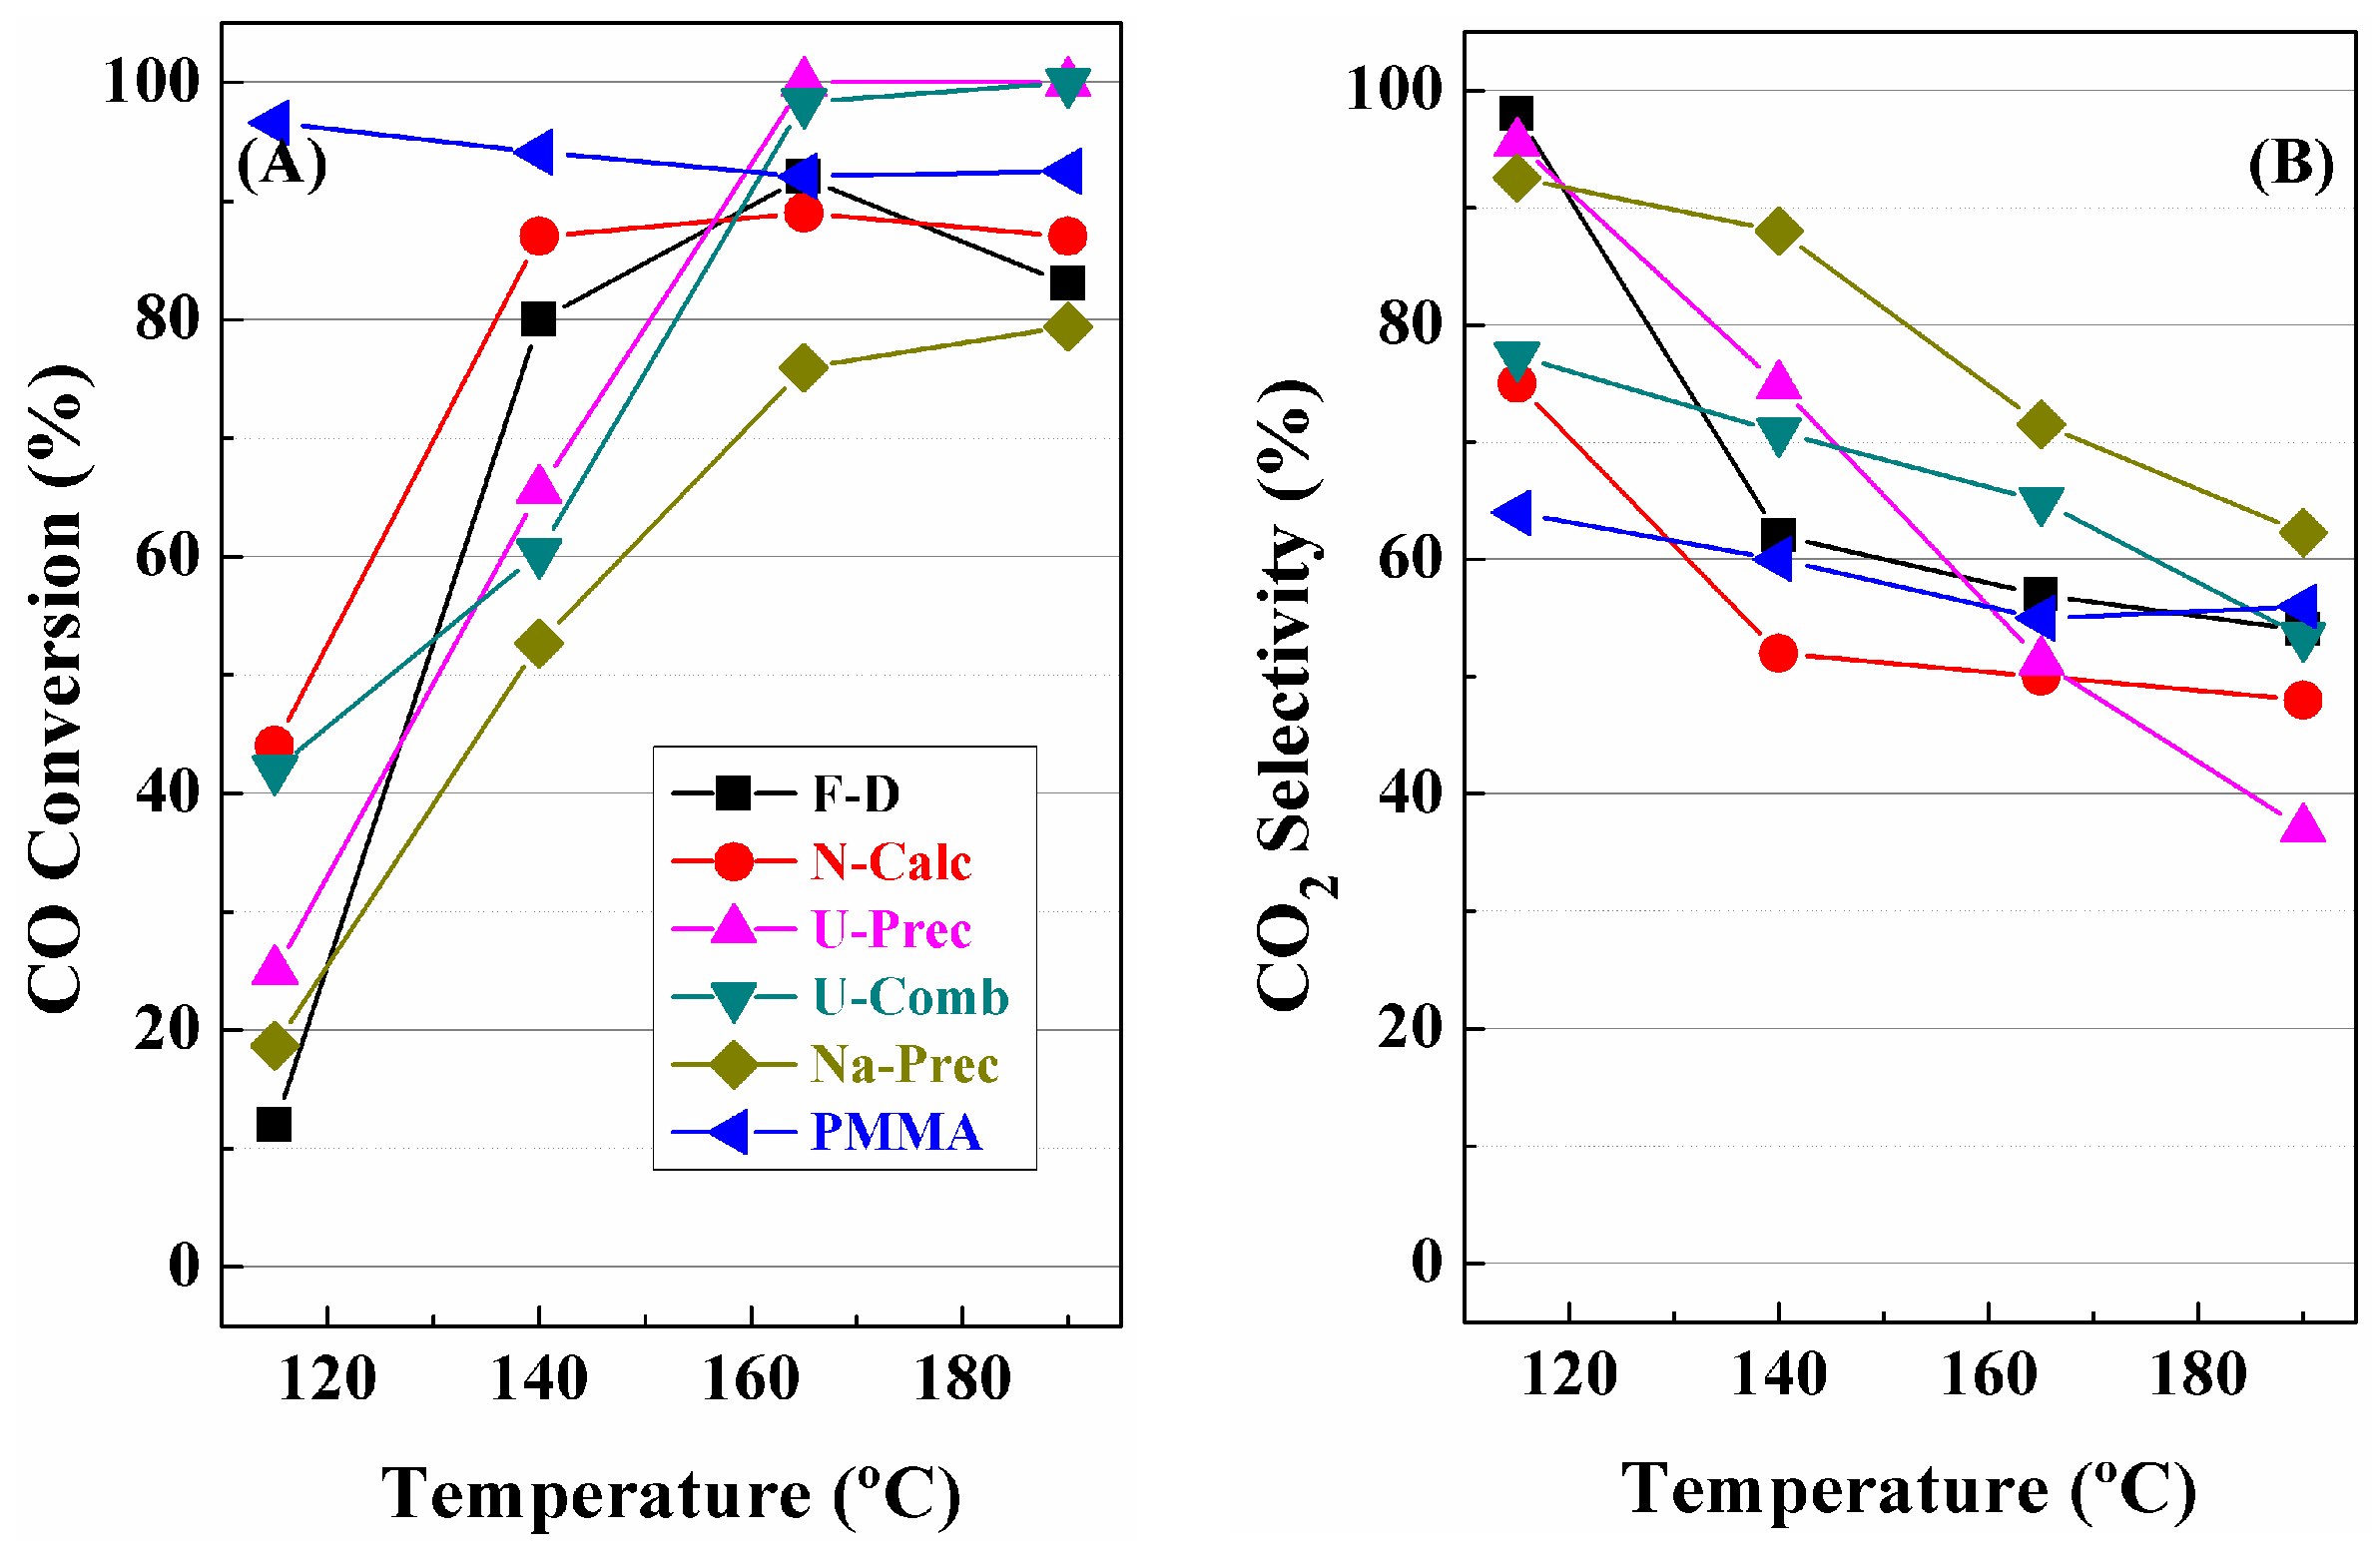
3. Catalytic Results
4. Materials and Methods
4.1. Catalyst Preparation
4.1.1. CeO2-CuO from Calcination of Nitrate Precursors (N-Calc)
4.1.2. CeO2-CuO from Thermal Urea-Nitrate Combustion (U-Comb)
4.1.3. CeO2-CuO from Freeze-Drying (F-D)
4.1.4. CeO2-CuO Using Poly(methyl metacrylate) (PMMA) as a Template
4.1.5. CeO2-CuO from Precipitation Method Using NaOH as a Precipitating Agent (Na-Prec)
4.1.6. CeO2-CuO Synthesised from the Combustion of Urea as a Precipitating Agent (U-Prec)
4.2. Characterisation of the Catalysts
4.3. Catalytic Tests
5. Conclusions
Supplementary Materials
Acknowledgments
Author Contributions
Conflicts of Interest
References
- Steele, B.C.H.; Heinzel, A. Materials for fuel-cell technologies. Nature 2001, 414, 345–352. [Google Scholar] [CrossRef] [PubMed]
- Wu, J.; Yuan, X.Z.; Martin, J.J.; Wang, H.; Zhang, J.; Shen, J.; Wu, S.; Merida, W. A review of PEM fuel cell durability: Degradation mechanisms and mitigation strategies. J. Power Sources 2008, 184, 104–119. [Google Scholar] [CrossRef]
- Moretti, E.; Storaro, L.; Talon, A.; Chitsazan, S.; Garbarino, G.; Busca, G.; Finocchio, E. Ceria-zirconia based catalysts for ethanol steam reforming. Fuel 2015, 153, 166–175. [Google Scholar] [CrossRef]
- Palo, D.R.; Dagle, R.A.; Holladay, J.D. Methanol steam reforming for hydrogen production. Chem. Rev. 2007, 107, 3992–4021. [Google Scholar] [CrossRef] [PubMed]
- Moretti, E.; Lenarda, M.; Storaro, L.; Frattini, R.; Patrono, P.; Pinzari, F. One-step incorporation of Pd-Zn catalytic sites into organized mesoporous alumina for use in the oxidative steam reforming of methanol. J. Colloid Interface Sci. 2007, 306, 89–95. [Google Scholar] [CrossRef] [PubMed]
- O’Connell, M.; Kolb, G.; Schelhaas, K.; Schuerer, J.; Tiemann, D.; Ziogas, A.; Hessel, V. The development and evaluation of microstructured reactors for the water gas shift and preferential oxidation reactions in the 5 kW range. Int. J. Hydrogen Energy 2010, 35, 2317–2327. [Google Scholar] [CrossRef]
- Trimm, D.L. Minimisation of carbon monoxide in a hydrogen stream for fuel cell application. Appl. Catal. A 2005, 296, 1–11. [Google Scholar] [CrossRef]
- Jiménez, S.; Soler, J.; Valenzuela, R.X.; Daza, L. Assessment of the performance of a PEMFC in the presence of CO. J. Power Sources 2005, 151, 69–73. [Google Scholar] [CrossRef]
- Lemons, R.A. Fuel cells for transportation. J. Power Sources 1990, 29, 251–264. [Google Scholar] [CrossRef]
- Gray, P.G.; Frost, J.C. Impact on clean energy in road transportation. Energy Fuels 1998, 12, 1121–1129. [Google Scholar] [CrossRef]
- Thomas, C.E.; James, B.D.; Lomax, F.D.; Kuhn, I.F. Fuel options for the fuel cell vehicle: Hydrogen, methanol or gasoline? Int. J. Hydrogen Energy 2000, 25, 551–567. [Google Scholar] [CrossRef]
- Liu, K.; Wang, A.; Zhang, T. Recent advances in preferential oxidation of CO reaction over platinum group metal catalysts. ACS Catal. 2012, 2, 1165–1178. [Google Scholar] [CrossRef]
- Guo, Z.; Liu, B.; Zhang, Q.; Deng, W.; Wang, W.; Wang, Y.; Yang, Y. Recent advances in heterogeneous selective oxidation catalysis for sustainable chemistry. Chem. Soc. Rev. 2014, 43, 3480–3524. [Google Scholar] [CrossRef] [PubMed]
- Mishra, A.; Prasad, R. A review on preferential oxidation of carbon monoxide in hydrogen rich gases. Bull. Chem. React. Eng. Catal. 2011, 6, 1–14. [Google Scholar] [CrossRef]
- Kipnis, M. Gold in CO oxidation and PROX: The role of reaction exothermicity and nanometer-scale particle size. Appl. Catal. B 2014, 152, 38–45. [Google Scholar] [CrossRef]
- Rossignol, C.; Arrii, S.; Morfin, F.; Piccolo, L.; Caps, V.; Rousset, J.L. Selective oxidation of CO over model gold-based catalysts in the presence of H2. J. Catal. 2005, 230, 476–483. [Google Scholar] [CrossRef]
- Luengnaruemitchai, A.; Osuwan, S.; Gulari, E. Selective catalytic oxidation of CO in the presence of H2 over gold catalyst. Int. J. Hydrogen Energy 2004, 29, 429–435. [Google Scholar] [CrossRef]
- Zhang, Q.; Shore, L.; Farrauto, R.J. Selective CO oxidation over a commercial PROX monolith catalyst for hydrogen fuel cell applications. Int. J. Hydrogen Energy 2012, 37, 10874–10880. [Google Scholar] [CrossRef]
- Gamarra, D.; Hornés, A.; Koppány, Z.; Schay, Z.; Munuera, G.; Soria, J.; Martínez-Arias, A. Catalytic processes during preferential oxidation of CO in H2-rich streams over catalysts based on copper-ceria. J. Power Sources 2007, 169, 110–116. [Google Scholar] [CrossRef]
- Martínez-Arias, A.; Hungría, A.B.; Munuera, G.; Gamarra, D. Preferential oxidation of CO in rich H2 over CuO/CeO2: Details of selectivity and deactivation under the reactant stream. Appl. Catal. B 2006, 3, 207–216. [Google Scholar] [CrossRef]
- Avgouropoulos, G.; Ionnides, T. Selective CO oxidation over CuO-CeO2 catalysts prepared via the urea-nitrate combustion method. Appl. Catal. A 2003, 244, 155–167. [Google Scholar] [CrossRef]
- Ayastuy, J.L.; Gurbani, A.; González-Marcos, M.P.; Gutiérrez-Ortiz, M.A. Effect of copper loading on copper-ceria catalysts performance in CO selective oxidation for fuel cell applications. Int. J. Hydrogen Energy 2010, 35, 1232–1244. [Google Scholar] [CrossRef]
- Caputo, T.; Lisi, L.; Pirone, R.; Russo, G. On the role of redox properties of CuO/CeO2 catalysts in the preferential oxidation of CO in H2-rich gases. Appl. Catal. A 2008, 348, 42–53. [Google Scholar] [CrossRef]
- Arango-Díaz, A.; Cecilia, J.A.; Moretti, E.; Talon, A.; Núñez, P.; Marrero-Jerez, J.; Jiménez-Jiménez, J.; Jiménez-López, A.; Rodríguez-Castellón, E. Comparative study of CuO supported on CeO2, Ce0.8Zr0.2O2 and Ce0.8Al0.2O2 based catalysts in the CO-PROX reaction. Int. J. Hydrogen Energy 2014, 39, 4102–4109. [Google Scholar] [CrossRef]
- Arango-Díaz, A.; Cecilia, J.A.; dos Santos-Gómez, L.; Marrero-López, D.; Losilla, E.R.; Jiménez-Jiménez, J.; Rodríguez-Castellón, E. Characterization and performance in preferential oxidation of CO of CuO-CeO2 catalysts synthesized using polymethyl metacrylate (PMMA) as template. Int. J. Hydrogen Energy 2015, 40, 11254–11260. [Google Scholar] [CrossRef]
- Cecilia, J.A.; Arango-Díaz, A.; Rico-Pérez, V.; Bueno-López, A.; Rodríguez-Castellón, E. The influence of promoters (Zr, La, Tb, Pr) on the catalytic performance of CuO-CeO2 systems for the preferential oxidation of CO in the presence of CO2 and H2O. Catal. Today 2015, 253, 115–125. [Google Scholar] [CrossRef]
- Moretti, E.; Storaro, L.; Talon, A.; Lenarda, M.; Riello, P.; Frattini, R.; Martínez de Yuso, M.V.; Jiménez-López, A.; Rodríguez-Castellón, E.; Ternero, F.; et al. Effect of thermal treatments on the catalytic behaviour in the CO preferential oxidation of a CuO–CeO2–ZrO2 catalyst with a flower-like morphology. Appl. Catal. B 2011, 102, 627–637. [Google Scholar] [CrossRef]
- Trovarelli, A.; Fornasiero, P. Catalysts by Ceria and Related Materials; Imperial College Press: London, UK, 2002. [Google Scholar]
- Martı́nez-Arias, A.; Fernández-Garcı́a, M.; Soria, J.; Conesa, J.C. Spectroscopic study of a Cu/CeO2 catalyst subjected to redox treatments in carbon monoxide and oxygen. J. Catal. 1999, 182, 367–377. [Google Scholar] [CrossRef]
- Maciel, C.G.; Silva, T.F.; Hirooka, M.I.; Belgacem, M.N.; Assaf, J.M. Effect of nature of ceria support in CuO/CeO2 catalyst for PROX-Co reaction. Fuel 2012, 97, 245–252. [Google Scholar] [CrossRef]
- Mishra, A.; Tripathi, B.D.; Rai, A.K.; Prasad, R. Comparative study of various preparation methods of CuO-CeO2 catalysts for oxidation of n-hexane and iso-octane. Bull. Chem. React. Eng. Catal. 2013, 7, 172–178. [Google Scholar] [CrossRef]
- Gurbani, A.; Ayastuy, J.L.; González-Marcos, M.P.; Gutiérrez-Ortiz, M.A. CuO-CeO2 catalysts synthesized by various methods: Comparative study of redox properties. Int. J. Hydrogen Energy 2010, 35, 11582–11590. [Google Scholar] [CrossRef]
- Moretti, E.; Lenarda, M.; Riello, P.; Storaro, L.; Talon, A.; Frattini, R.; Reyes-Carmona, A.; Jiménez-López, A.; Rodríguez-Castellón, E. Influence of synthesis parameters on the performance of CeO2-CuO and CeO2-ZrO2-CuO systems in the catalytic oxidation of CO in excess of hydrogen. Appl. Catal. B 2013, 129, 556–565. [Google Scholar] [CrossRef]
- Liu, Y.; Fu, Q.; Stephanopoulos, M.F. Preferential oxidation of CO in H2 over CuO-CeO2 catalysts. Catal. Today 2004, 93, 241–246. [Google Scholar] [CrossRef]
- Barbato, P.S.; Colussi, S.; Di Benedetto, A.; Landi, G.; Lisi, L.; Llorca, J.; Trovarelli, A. Origin of high activity and selectivity of CuO/CeO2 catalysts prepared by solution combustion synthesis in CO-PROX reaction. J. Phys. Chem. C 2016, 120, 13039–13048. [Google Scholar] [CrossRef]
- Liu, B.; Liu, Y.; Hou, H.; Liu, Y.; Wang, Q.; Zhang, J. Variation of redox activity and synergistic effect for improving the preferential oxidation of CO in H2-rich gases in porous Pt/CeO2–Co3O4 catalysts. Catal. Sci. Technol. 2015, 5, 5139–5152. [Google Scholar] [CrossRef]
- Liu, Z.; Zhou, R.; Zheng, X. Preferential oxidation of CO in excess hydrogen over CuO-CeO2 catalyst prepared by chelating method. J. Nat. Gas. Chem. 2007, 16, 167–172. [Google Scholar] [CrossRef]
- Yang, J.; Lukashuk, L.; Li, H.; Föttinger, K.; Rupprechter, G.; Schubert, U. High surface area ceria for CO oxidation prepared from cerium t-butoxide by combined sol–gel and solvothermal processing. Catal. Lett. 2014, 144, 403–412. [Google Scholar] [CrossRef] [PubMed]
- Suzuki, K.; Sinha, A.K. Monodisperse, bimodal mesoporous ceria catalysts and adsorbents for air purification. J. Mater. Chem. 2007, 17, 2547–2551. [Google Scholar] [CrossRef]
- Mariño, F.; Descorme, C.; Duprez, D. Supported based metal catalysts for the preferential oxidation of carbon monoxide in the presence of excess hydrogen (PROX). Appl. Catal. B 2005, 58, 175–183. [Google Scholar] [CrossRef]
- Avgouropoulos, G.; Ioannides, T.; Matralis, M. Influence of the preparation method on the performance of CuO-CeO2 catalysts for the selective oxidation of CO. Appl. Catal. B 2005, 56, 87–93. [Google Scholar] [CrossRef]
- Avgouropoulos, G.; Ionnides, T. Effect of the synthesis parameters on catalytic properties of CuO-CeO2. Appl. Catal. B 2006, 67, 1–11. [Google Scholar] [CrossRef]
- Laguna, O.H.; Dominguez, M.I.; Oraá, S.; Navajas, A.; Arzamendi, G.; Gandía, L.M.; Centeno, M.A.; Montes, M.; Odriozola, J.A. Influence of the O2/CO ratio and the presence of H2O and CO2 in the feed-stream during the preferential oxidation of CO (PROX) over a CuOx/CeO2 coated microchannel reactor. Catal. Today 2013, 203, 182–187. [Google Scholar] [CrossRef]
- Gamarra, D.; Martínez-Arias, A. Preferential oxidation of CO in rich H2 over CuO/CeO2: Operando-DRIFTS analysis of deactivating effect of CO2 and H2O. J. Catal. 2009, 263, 189–195. [Google Scholar] [CrossRef]
- Lee, H.C.; Kim, D.H. Kinetics of CO and H2 oxidation over CuO-CeO2 catalyst in H2 mixtures with CO2 and H2O. Catal. Today 2008, 132, 109–116. [Google Scholar] [CrossRef]
- Wu, Z.; Zhu, H.; Qin, Z.; Wang, H.; Ding, J.; Huang, L.; Wang, J. CO preferential oxidation in H2-rich steam over a CuO/CeO2 catalyst with high H2O and CO2 tolerance. Fuel 2013, 104, 41–45. [Google Scholar] [CrossRef]
- Di Benedetto, A.; Landi, G.; Lisi, L.; Russo, G. Role of CO2 on CO preferential oxidation over CuO/CeO2 catalyst. Appl. Catal. B 2013, 142–143, 169–177. [Google Scholar] [CrossRef]
- Williamson, G.K.; Hall, W.H. X-ray line broadening from filed aluminum and wolfram. Metall. Acta 1954, 1, 22–31. [Google Scholar] [CrossRef]
- Konsolakis, M. The role of Copper-Ceria interactions in catalysis science: Recent theoretical and experimental advances. Appl. Catal. B 2016, 198, 49–66. [Google Scholar] [CrossRef]
- Yao, S.Y.; Wu, W.Q.; Johnson-Peck, A.C.; Zhao, F.Z.; Liu, Z.Y.; Luo, S.; Senanayake, S.D.; Martínez-Arias, A.; Liu, W.J.; Rodriguez, J.A. Morphological effects of the nanostructured ceria support on the activity and stability of CuO/CeO2 catalysts for the water-gas shift reactions. Phys. Chem. Chem. Phys. 2014, 16, 17183–17195. [Google Scholar] [CrossRef] [PubMed]
- Spanier, J.E.; Robinson, R.D.; Zhang, F.; Chan, S.W.; Herman, I.P. Size-dependent properties of CeO2-nanoparticles as studied by Raman scattering. Phys. Rev. B 2001, 64, 245407. [Google Scholar] [CrossRef]
- Popovic, Z.; Dohcevic-Mitrovic, Z.; Konstantinovic, M.; Scepanovi, M. Raman scattering characterization of nanopowders and nanowires (rods). J. Raman Spectrosc. 2007, 38, 750–755. [Google Scholar] [CrossRef]
- Shan, W.J.; Feng, Z.C.; Li, Z.I.; Jing, Z.; Shen, W.J.; Can, L. Oxidative steam reforming of methanol on CeO0.9Cu0.1OY catalysts prepared by deposition-precipitation, and complexation-combustion methods. J. Catal. 2004, 228, 206–217. [Google Scholar] [CrossRef]
- Thommes, M.; Kaneko, K.; Neimark, A.V.; Olivier, J.P.; Rodríguez-Reinoso, F.; Roquerol, J.; Sing, K.S.W. Physisorption of gases, with special reference to the evaluation of surface area and pores size distribution (IUPAC Technical Report). Pure Appl. Chem. 2015, 87, 1051–1069. [Google Scholar] [CrossRef]
- Marbán, G.; Fuentes, A.B. Highly active and selective CuOx/CeO2 catalyst prepared by a single-step citrate method for preferential oxidation of carbon monoxide. Appl. Catal. B 2005, 57, 43–53. [Google Scholar] [CrossRef]
- Rao, K.N.; Venkataswamy, P.; Reddy, B.M. Structural characterization and catalytic evaluation of supported copper-ceria catalysts for soot oxidation. Ind. Eng. Chem. Res. 2011, 50, 11960–11969. [Google Scholar] [CrossRef]
- Senanayake, S.D.; Rodríguez, J.A.; Stacchiola, D. Electronic metal-support interactions and the production of hydrogen through the water-gas shift reactions and ethanol steam reforming: Fundamental studies with well-defined model catalyst. Top. Catal. 2013, 53, 1488–1498. [Google Scholar] [CrossRef]
- Hu, P.; Huang, Z.; Amghouz, Z.; Makkee, M.; Xu, F.; Kapteijn, F.; Dikhtiarenko, A.; Chen, Y.; Gu, X.; Tang, X. Electronic metal-support interactions in single-atoms catalysts. Angew. Chem. Int. Ed. 2014, 53, 3418–3421. [Google Scholar] [CrossRef] [PubMed]
- Lu, Z.; Yang, Z.; He, B.; Castleton, C.; Hermansson, K. Cu-doped ceria oxygen vacancy formation made easy. Chem. Phys. Lett. 2011, 510, 60–66. [Google Scholar] [CrossRef]
- Zhang, F.; Wang, P.; Koberstein, J.; Khalid, S.; Chan, S. Cerium oxidation state in ceria nanoparticles studied with X-ray photoelectron spectroscopy and absorption near edge spectroscopy. Surf. Sci. 2004, 563, 74–82. [Google Scholar] [CrossRef]
- Konsolakis, M.; Carabineiro, S.A.C.; Papista, E.; Marnellos, G.E.; Tavares, P.B.; Moreira, J.A.; Romaguera-Barcelay, Y.; Figuereido, J.L. Effect of the preparation method on the solid state properties and the deN2O performance of CuO-CeO2 oxides. Catal. Sci. Technol. 2015, 5, 3714–3727. [Google Scholar] [CrossRef]
- Arango-Díaz, A.; Moretti, E.; Talon, A.; Storaro, L.; Lenarda, M.; Núñez, P.; Marrero-Jerez, J.; Jiménez-Jiménez, J.; Jiménez-López, A.; Rodríguez-Castellón, E. Preferential CO oxidation (CO-PROX) catalyzed by CuO supported on nanocrystalline CeO2 prepared by a freeze-drying method. Appl. Catal. A 2014, 477, 54–63. [Google Scholar] [CrossRef]
- Martínez-Arias, A.; Gamarra, D.; Hungría, A.B.; Fernández-García, M.; Munuera, G.; Hornés, A.; Bera, P.; Conesa, J.C.; López-Cámara, A. Characterization of active sites/entities and redox/catalytic correlations in copper-ceria-based catalysts for preferential oxidation of CO in H2-rich streams. Catalysts 2013, 3, 378–400. [Google Scholar] [CrossRef]
- Cecilia, J.A.; Arango-Díaz, A.; Franco, F.; Jiménez-Jiménez, J.; Storaro, L.; Moretti, E.; Rodríguez-Castellón, E. CuO-CeO2 supported on montmorillonite-derived porous clay heterostructures (PCH) for preferential CO oxidation in H2-rich stream. Catal. Today 2015, 253, 126–136. [Google Scholar] [CrossRef]
- Zou, D.; Aklonis, J.J.; Salovey, R. Model filled polymers. Synthesis of monodisperse crosslinked polymethacrylonitrile beads. J. Polym. Sci. Part A 1992, 30, 2443–2449. [Google Scholar] [CrossRef]
- Jiménez-Gómez, C.P.; Cecilia, J.A.; Márquez-Rodríguez, I.; Moreno-Tost, R.; Santamaría-González, J.; Mérida-Robles, J.; Maireles-Torres, P. Gas-phase hydrogenation of furfural over Cu/CeO2 catalysts. Catal. Today 2017, 279, 327–338. [Google Scholar] [CrossRef]
- Brunauer, S.; Emmett, P.H.; Teller, E. Adsorption of gases in multimolecular layers. J. Am. Chem. Soc. 1938, 60, 309–319. [Google Scholar] [CrossRef]


| Sample | Lattice Parameter (a/Å) | CeO2 Particle Size (nm) a | Cu (wt %) b | Cu/Ce b | SBET (m2·g−1) | t-Plot (m2·g−1) | |
|---|---|---|---|---|---|---|---|
| Fresh | Used | ||||||
| F-D | 5.412 | 9.9 | 4.9 | 6.1 | 0.06 | 18 | 7 |
| N-Comb | 5.411 | 6.7 | 7.3 | 7.1 | 0.06 | 85 | 49 |
| PMMA | 5.412 | 5.6 | 6.7 | 6.4 | 0.08 | 97 | 34 |
| U-Prec | 5.413 | 5.7 | 5.6 | 5.8 | 0.06 | 81 | 50 |
| Na-Prec | 5.421 | 4.7 | 4.6 | 7.2 | 0.07 | 135 | 74 |
| U-Comb | 5.410 | 101.0 | 91.7 | 5.5 | 0.06 | 7 | 1 |
| Sample | α Peak (%) | β Peak (%) | γ Peak (%) | TMAX (°C) | H2 Consumption (µmol·g−1) | H2 Consumed/H2 Theoretical |
|---|---|---|---|---|---|---|
| F-D | 24.6 | 59.3 | 16.1 | 193 | 1088 | 1.20 |
| N-Calc | 30.0 | 64.0 | 6 | 192 | 1184 | 1.26 |
| PMMA | 35.8 | 64.2 | - | 176 | 1162 | 1.23 |
| U-Prec | 16.8 | 83.2 | - | 202 | 1284 | 1.36 |
| Na-Prec | 26.7 | 56.2 | 17.1 | 180 | 1312 | 1.39 |
| U-Comb | 2.8 | 10.4 | 86.8 | 215 | 972 | 1.03 |
| Sample | ISat/Imp | Ce3+/Ce4+ | Cu/Ce | CuLMM (eV) |
|---|---|---|---|---|
| F-D | 0.36 (0.31) | 0.32 (0.40) | 0.27 (0.47) | 917.8 (917.9) |
| N-Calc | 0.29 (0.24) | 0.08 (0.03) | 0.45 (0.67) | 917.4 (916.8) |
| PMMA | 0.45 (0.37) | 0.10 (0.18) | 0.35 (0.37) | 916.7 (916.0) |
| U-Prec | 0.40 (0.33) | 0.12 (0.07) | 0.28 (0.36) | 918.1 (918.2) |
| Na-Prec | 0.38 (0.34) | 0.11 (0.09) | 0.19 (0.22) | 917.2 (918.0) |
| U-Comb | 0.42 (0.35) | 0.06 (0.07) | 0.48 (0.55) | 918.1 (917.5) |
© 2017 by the authors. Licensee MDPI, Basel, Switzerland. This article is an open access article distributed under the terms and conditions of the Creative Commons Attribution (CC BY) license (http://creativecommons.org/licenses/by/4.0/).
Share and Cite
Cecilia, J.A.; Arango-Díaz, A.; Marrero-Jerez, J.; Núñez, P.; Moretti, E.; Storaro, L.; Rodríguez-Castellón, E. Catalytic Behaviour of CuO-CeO2 Systems Prepared by Different Synthetic Methodologies in the CO-PROX Reaction under CO2-H2O Feed Stream. Catalysts 2017, 7, 160. https://doi.org/10.3390/catal7050160
Cecilia JA, Arango-Díaz A, Marrero-Jerez J, Núñez P, Moretti E, Storaro L, Rodríguez-Castellón E. Catalytic Behaviour of CuO-CeO2 Systems Prepared by Different Synthetic Methodologies in the CO-PROX Reaction under CO2-H2O Feed Stream. Catalysts. 2017; 7(5):160. https://doi.org/10.3390/catal7050160
Chicago/Turabian StyleCecilia, Juan Antonio, Ana Arango-Díaz, Jaasiel Marrero-Jerez, Pedro Núñez, Elisa Moretti, Loretta Storaro, and Enrique Rodríguez-Castellón. 2017. "Catalytic Behaviour of CuO-CeO2 Systems Prepared by Different Synthetic Methodologies in the CO-PROX Reaction under CO2-H2O Feed Stream" Catalysts 7, no. 5: 160. https://doi.org/10.3390/catal7050160
APA StyleCecilia, J. A., Arango-Díaz, A., Marrero-Jerez, J., Núñez, P., Moretti, E., Storaro, L., & Rodríguez-Castellón, E. (2017). Catalytic Behaviour of CuO-CeO2 Systems Prepared by Different Synthetic Methodologies in the CO-PROX Reaction under CO2-H2O Feed Stream. Catalysts, 7(5), 160. https://doi.org/10.3390/catal7050160