Next Article in Journal
A Review on the Synthesis and Characterization of Metal Organic Frameworks for Photocatalytic Water Purification
Next Article in Special Issue
The Use of Zeolites for VOCs Abatement by Combining Non-Thermal Plasma, Adsorption, and/or Catalysis: A Review
Previous Article in Journal
Metal-Catalyzed and Metal-Mediated Approaches to the Synthesis and Functionalization of Tetramic Acids
Previous Article in Special Issue
Isotope Labelling for Reaction Mechanism Analysis in DBD Plasma Processes
 
 
Correction published on 30 November 2020, see Catalysts 2020, 10(12), 1401.
Article

Altering Conversion and Product Selectivity of Dry Reforming of Methane in a Dielectric Barrier Discharge by Changing the Dielectric Packing Material

Department of Chemistry, University of Antwerp, Universiteitsplein 1, B-2610 Wilrijk, Belgium
*
Author to whom correspondence should be addressed.
Catalysts 2019, 9(1), 51; https://doi.org/10.3390/catal9010051
Submission received: 11 December 2018 / Revised: 23 December 2018 / Accepted: 2 January 2019 / Published: 7 January 2019
(This article belongs to the Special Issue Plasma Catalysis)

Abstract

:
We studied the influence of dense, spherical packing materials, with different chemical compositions, on the dry reforming of methane (DRM) in a dielectric barrier discharge (DBD) reactor. Although not catalytically activated, a vast effect on the conversion and product selectivity could already be observed, an influence which is often neglected when catalytically activated plasma packing materials are being studied. The α-Al2O3 packing material of 2.0–2.24 mm size yields the highest total conversion (28%), as well as CO2 (23%) and CH4 (33%) conversion and a high product fraction towards CO (~70%) and ethane (~14%), together with an enhanced CO/H2 ratio of 9 in a 4.5 mm gap DBD at 60 W and 23 kHz. γ-Al2O3 is only slightly less active in total conversion (22%) but is even more selective in products formed than α-Al2O3. BaTiO3 produces substantially more oxygenated products than the other packing materials but is the least selective in product fractions and has a clear negative impact on CO2 conversion upon addition of CH4. Interestingly, when comparing to pure CO2 splitting and when evaluating differences in products formed, significantly different trends are obtained for the packing materials, indicating a complex impact of the presence of CH4 and the specific nature of the packing materials on the DRM process.

1. Introduction

An increasing energy and resource demand from a growing population and the impact it has on the environment, necessitate enhancing the share of renewable energy and replacing (part of the) fossil fuels, by recycling waste streams. These challenges have given the incentive for new methodologies that allow converting (two) greenhouse gasses (CO2 and CH4) into value added chemicals (like syngas, basic chemicals) and fuels [1,2].
Although syngas (CO and H2) can be obtained in a two-step process, where hydrogen is added to CO—originating from CO2 splitting into CO and O2—it is much more efficient to produce it directly through dry reforming of methane (DRM) in a one-step process, with the possibility of directly forming higher hydrocarbons [3,4]. A recent study suggests that, together with the Fischer-Tropsch process, DRM is economically the most promising method for CO2 conversion [5]. Indeed, when executing thermal DRM, a conversion of 100% can be reached (accompanied by an energy efficiency of 60%) or a maximum energy efficiency of 70% (of the thermal thermodynamic optimum for syngas formation), coinciding with a conversion of 83% [1]. These high values for conversion and energy efficiency are a definite advantage of thermal DRM but require a high temperature (900–1200 K) and a catalyst. Moreover, this reaction is prone to coking, deactivating the catalyst and therefore decreasing the conversion and energy efficiency [6,7,8,9,10].
To avoid the need for severe reaction conditions and thus to provide a possible energy efficient alternative, plasma technology can be used for DRM. Although multiple different types of plasma reactors are being studied for their performance in DRM, the dielectric barrier discharge (DBD) is the most applied [1]. It operates at or near room temperature (far away from local thermal equilibrium) and the highest conversion and corresponding energy efficiency reported up to now (for a non-packed DBD reactor) are 60% and 12.8%, respectively [1]. A DBD reactor has the advantages of operating under mild reaction conditions, being easy to scale-up (evidenced via industrial ozone generation) and having the possibility to operate with renewable energy (e.g., it is highly intermittent) [3,11]. Moreover, in contrast to thermal dry reforming, plasma-based DRM can directly yield higher hydrocarbons, apart from syngas [1,12]. To steer the selectivity of the products formed and to further increase the conversion [1], a (catalytic) packing can be added to the DBD reactor. When combining plasma with a catalyst, another advantage compared to thermal DRM arises: plasma also reduces the susceptibility of the catalyst to coking [13].
For this reason, an increasing amount of research is being conducted towards CO2 splitting and DRM in a DBD reactor, both with and without (catalytic) packing materials, as summarised in Table 1 and Table 2, respectively. Even though there is a growing number of literature reports, the current literature indicates that still a substantial amount of work lies ahead to unravel all aspects of DRM in a packed bed DBD. Indeed, some important observations can be made when comparing literature, that underline the need for further research. For example, some papers contradict each other with respect to the influence of frequency on CO2 splitting in a non-packed reactor, reporting either a rise or a drop or no influence of frequency on the results (see details in Table 1) [14,15,16]. Similar discrepancies have been observed for DRM in packed bed DBD plasma reactors. For instance, adding a packing has been reported to increase the conversion [17,18,19,20,21,22,23,24], while several other report a decrease in conversion of both CO2 and CH4 [24,25,26] and still other papers show only an effect on one of the two reacting gasses [12,23,27,28] (see Table 2). Moreover, also vast differences in selectivity are being described, even for similar packing materials, as detailed in Table 2. Also, it is clear that even for the non-packed reactor, both the process conditions and the reactor design already affect the selectivity tremendously [12,17,29].
Furthermore, very often catalytically activated packing materials are being introduced and discussed, without evaluating the impact of the non-activated packing on the DRM process [17,18,19,20,23,24,25,30,31], even though the latter can be expected to have an influence on the conversion and selectivity as well [12,13,32]. Indeed, in those papers where the packing materials are being studied with and without catalytic activation, an influence of the packing material itself can be observed [21,26,27,29,32]. For instance, Wang et al. reported the formation of liquid products and a significant influence on the selectivity, when comparing different catalytic activations with non-activated packing. Unfortunately, they only compared to one type of packing material [12]. Krawczyk et al. [21] and Sentek et al. [26] indicated only minor alterations in selectivity and conversion when adding a catalytic element on a certain packing, whereas different packing materials with the same active elements yielded major changes, suggesting that the packing itself could be responsible for the selectivity and conversion and not the catalytic element. Other research [23,29] shows a larger influence of the catalytic element on the conversion and selectivity. Unfortunately, these studies are limited to specific packing materials and do not allow to compare the impact of different non-activated packing materials, which would be necessary to elucidate a synergic combination of packing material and catalytic active site. However, a large influence on (and possible control over) the conversion and selectivity is in principle possible, depending on the packing, the catalytic element, the reactor and the operating conditions. The packing material on itself is not necessarily catalytically active (although it can have some catalytic activity or promoting effect as well) but it is typically used as support and/or influences the plasma characteristics in a physical way (e.g., through changes in electric field, discharge, sorption processes). Most used catalytic elements for catalytic activation of the packing are Ni, Co, Fe, Mn, Cu, Ag and Pd [1].
Also for other plasma-assisted processes, such as the abatement of diluted VOC’s, numerous studies have shown that physical size and material properties of the packing materials in a DBD reactor play a role to convert chemicals [33,34,35,36,37,38,39,40]. Even more, VOC decomposition is mainly influenced by the adsorption process, rather than by the discharge characteristics [13,41].
Our previous work [32] suggested a large effect of the reactor setup and reactor/bead size combination on the impact of the packing material on conversion of pure CO2. Thus, comparing results obtained in different reactor setups should be done with care. Therefore, the results obtained in different literature reports cannot be easily compared to one another and no general conclusion towards the impact of the packing material itself on DRM can be drawn. This points towards an important gap in the knowledge required to achieve a maximal synergy between the packing, the active catalytic element and the plasma, ultimately yielding higher conversions and a better selectivity towards the desired components in plasma-based DRM.
The aim of this work is thus to provide better insights in the influence of five different (dense, spherical) packing materials, with different chemistry and size, on the conversion and product fractions of DRM in a DBD reactor. Additionally, γ-alumina is evaluated as porous packing material. Although it is not possible to distinguish between catalytic effects of the packing material itself and physical effects caused by inserting the packing, it is important to note that there is no explicit catalytic activation of the packing materials in the present study, that is, we have not introduced an active element, such as applied in many literature reports (e.g., Cu, Fe, Ni, Co, Pd, Ag and so forth. See Table 2 and [1]) on or in the packing materials. Furthermore, the impact of these packing materials in DRM is being compared to the insights gained for pure CO2 splitting, providing surprising and valuable information on the influence of adding CH4. To our knowledge, such a detailed comparison has not yet been carried out before in literature.

2. Results

2.1. CO2 Conversion in DRM and Comparison with CO2 Splitting

The influence of four different packing materials (SiO2, ZrO2, α-Al2O3 and BaTiO3) and three different sphere sizes (1.25–1.4; 1.6–1.8 and 2.0–2.24 mm diameter) on the CO2, CH4 and total conversion is displayed in Figure 1, Figure 2 and Figure 3, respectively. Figure 1 shows the CO2 conversion in DRM, compared to the conversion that we obtained before for pure CO2 splitting [32], evidencing a clear impact of the presence of CH4. Figure S1 in the Supplementary Materials shows all data on conversion (CO2−, CH4− and total conversion) combined in one graph, for comparison.
The CO2 conversion in DRM shows that, when comparing the packed bed reactor to the non-packed reactor, only the largest α-Al2O3 spheres achieve a higher CO2 conversion than the non-packed reactor at the same flow rate. This indicates that only in this case, the positive influence of the packing compensates for the volume loss (and thus lower residence time) caused by introducing the packing. SiO2, ZrO2, α-Al2O3 (with the smaller bead sizes) and γ-Al2O3 do not reach this CO2 conversion but still surmount the CO2 conversion for the non-packed reactor at the same residence time. In the case of BaTiO3, a negative effect of the packing is observed, even at the same residence time. Furthermore, a clear impact of the size of the packing materials can be observed, although the effect itself depends on the type of material. The order in which the materials perform is BaTiO3 < ZrO2 < SiO2 < α-Al2O3, although SiO2 only performs better than ZrO2 for the largest bead size. When looking at the effect of bead size, only SiO2 and α-Al2O3 show a significantly increased conversion for the largest bead size, in comparison to the other bead sizes. In case of BaTiO3 and ZrO2, no significant impact of the bead size can be seen.
Interesting differences can be observed when comparing the CO2 conversion in DRM with pure CO2 splitting obtained in our previous experiments [32]. It is important to clarify that the total flow rate (and thus the residence time) is kept constant for CO2 splitting and DRM but with DRM, the concentration of CO2 is halved, as it has been ‘diluted’ with 50% CH4. Diluting with another gas can influence the conversion, even when the diluting gas does not actively participate in the reactions [45]. Indeed, Ramakers et al. have shown that the absolute conversion increases (from 5% to 41%) with a decreasing percentage (from 100 to 5% in argon) of CO2 [45]. In a 50/50 CO2/Ar mixture, the rise in conversion of CO2 is around a factor 1.6, compared to pure CO2 splitting. Note, however, that the effective CO2 conversion drops upon dilution with argon, because there is less CO2 in the mixture. Our experiments clearly reveal that the absolute CO2 conversion is also higher for DRM than for CO2 splitting, with the exception of BaTiO3. Indeed, in the non-packed reactor at 50 mL/min and 192 mL/min (straight lines in Figure 1), the conversion is (on average) a factor 1.8 and 1.5 higher in case of DRM, indicating that CH4 aids the conversion of CO2. This is confirmed by computer simulations for DRM in a non-packed DBD reactor, where the CO2 conversion was largely determined by collision with CH2 radicals [46], originating from CH4 dissociation.
For DRM in the packed reactor, the CO2 conversion is always higher when using SiO2, ZrO2 and α-Al2O3 packing materials than for pure CO2 splitting. However, the enhancement of the CO2 conversion due to CH4 depends on the size and chemistry of the spherical packing material. Finally, CH4 addition has a clearly negative effect on all BaTiO3 packing materials. Thus, although BaTiO3 in general performs best for CO2 splitting, compared to the other packing materials, it yields the worst results for DRM.

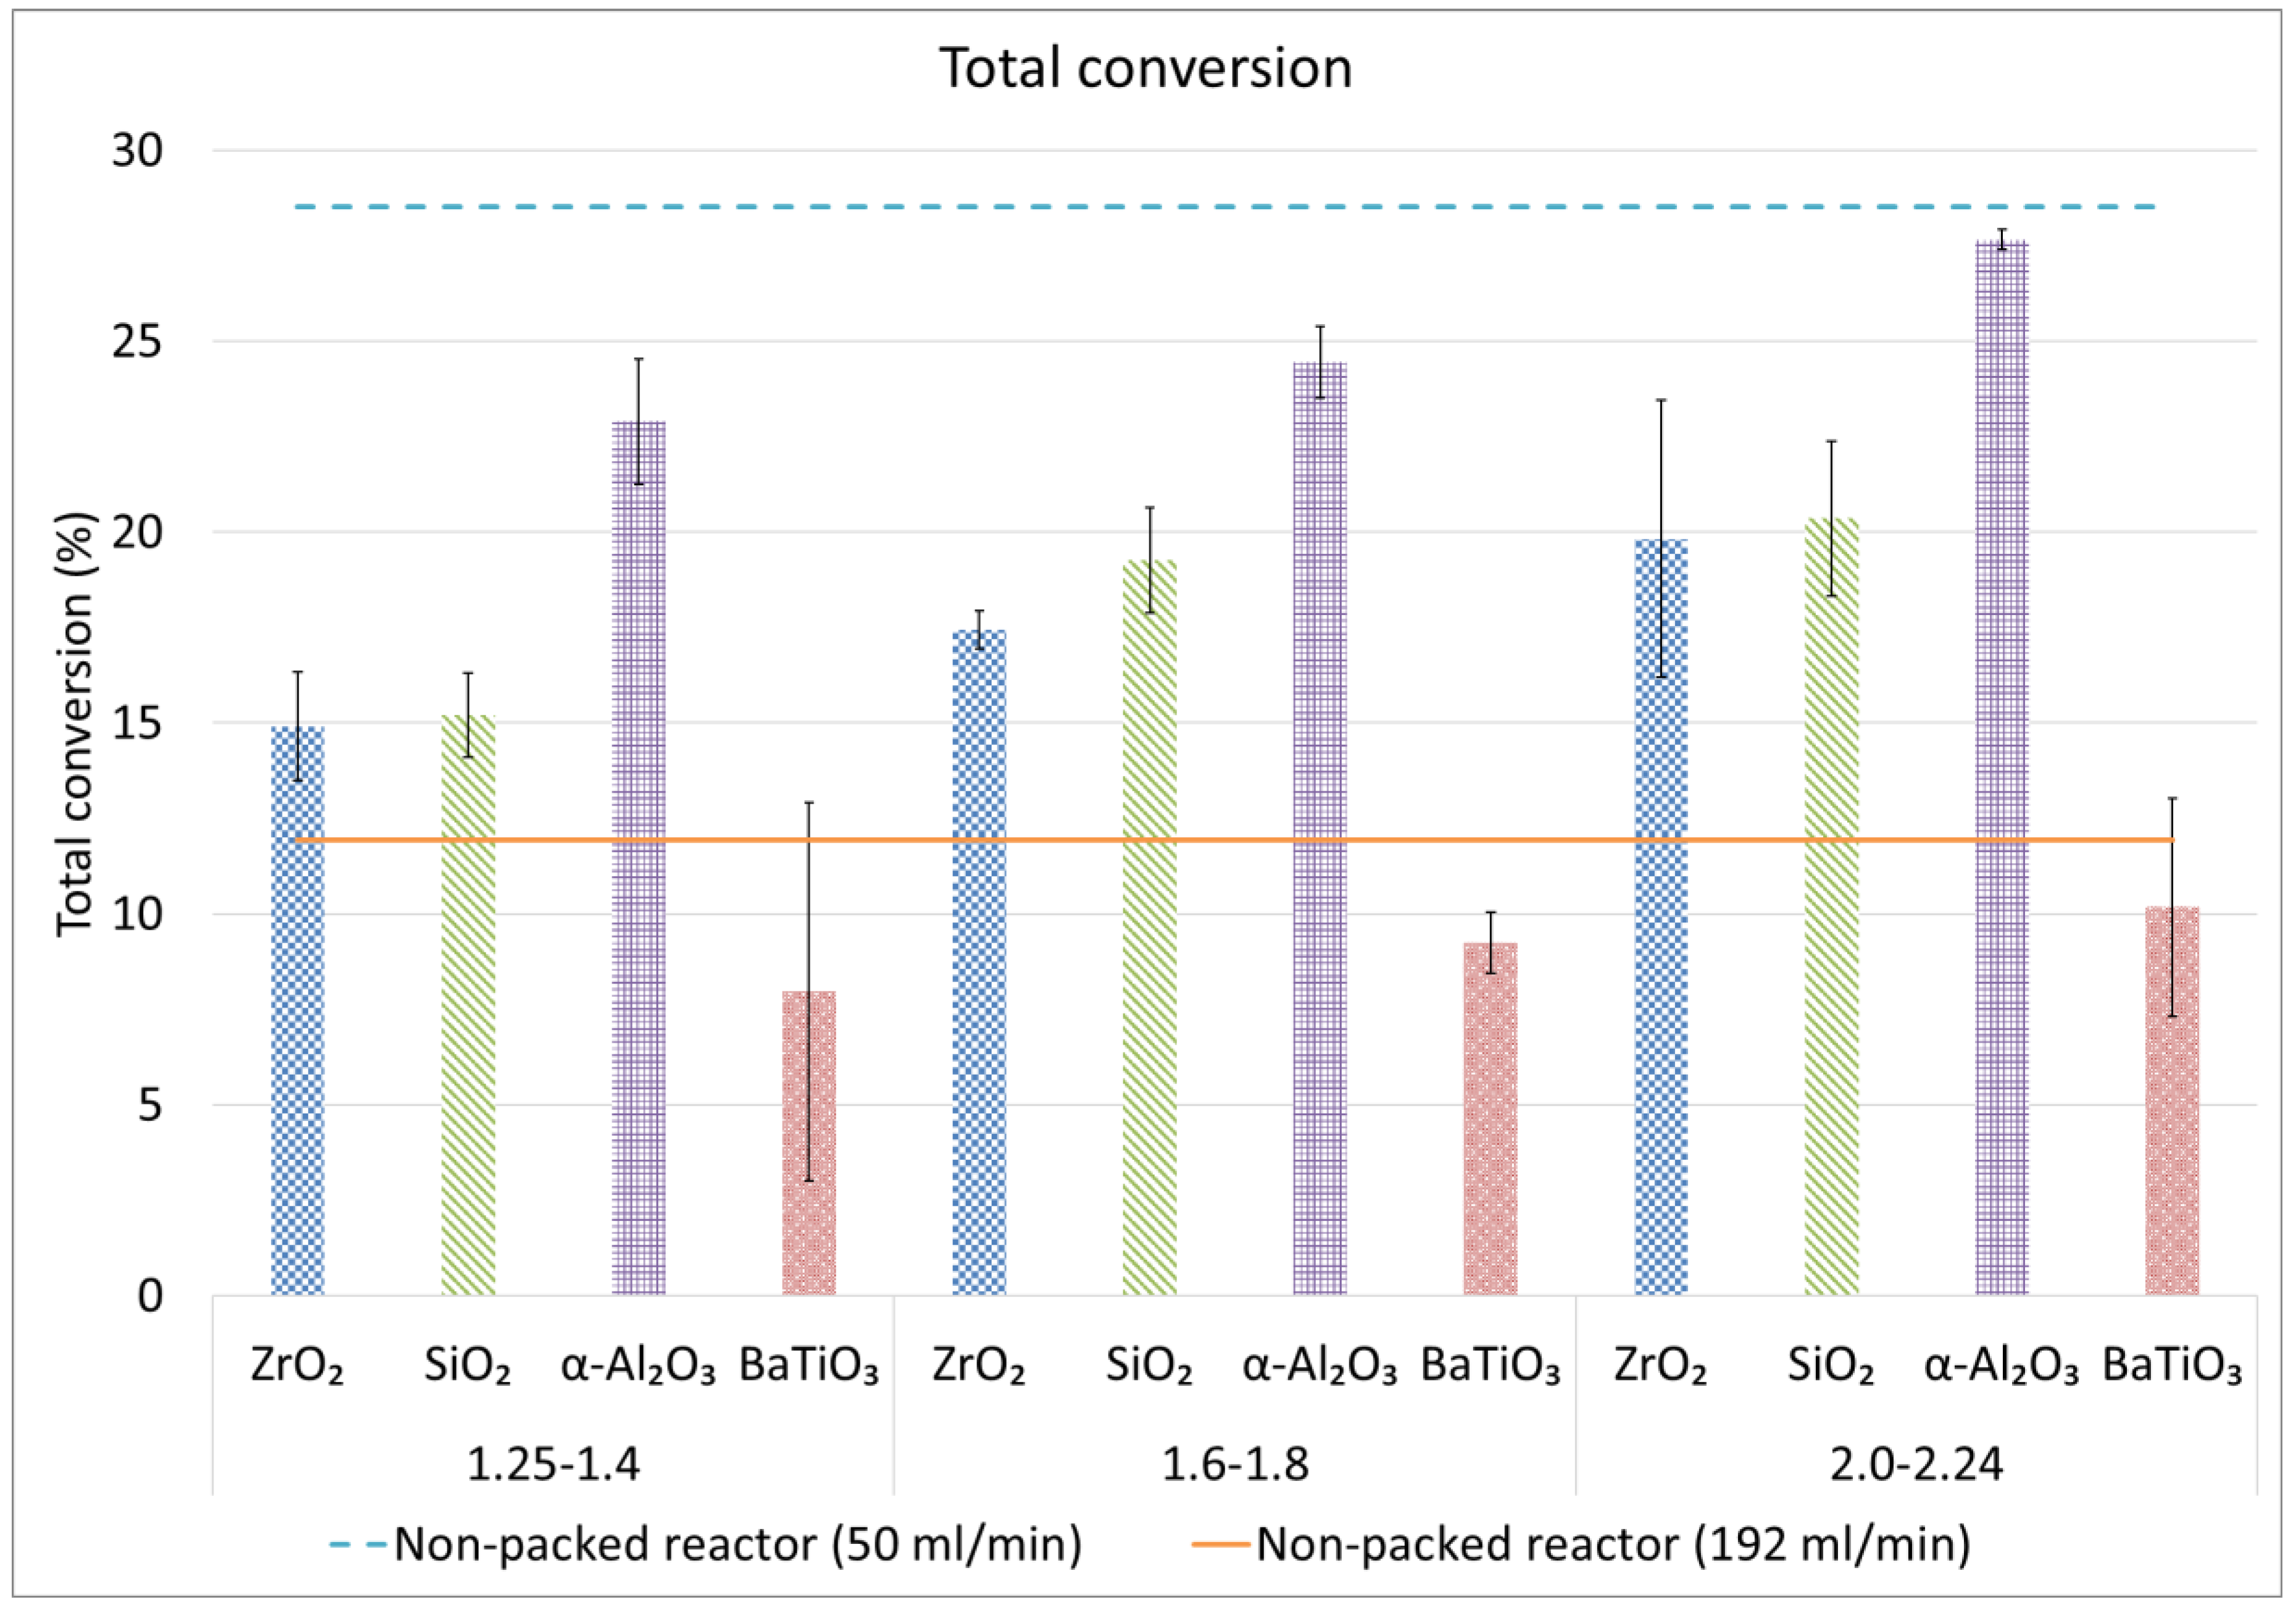
2.2. CH4 and Total Conversion

The first observation to be made from Figure 2 is that the CH4 conversion is always higher than the CO2 conversion, which is logical, since the dissociation energy of a C-H bond in CH4 is 412 kJ/mol, while it is 743 kJ/mol for a C=O bond in CO2 [47].
Comparing again to the non-packed reactor, it can be seen that in contrast to the CO2 conversion, none of the packing materials allow a better conversion at the same flow rate. However, with the exception of BaTiO3, all materials do perform better than the non-packed reactor at the same residence time. BaTiO3 again performs worse than the non-packed reactor, even at the same residence time. The same trend is seen for the total conversion (Figure 3).
When comparing the results for the different bead sizes and materials, we can make the following observations: Similar to the CO2 conversion, BaTiO3 performs worst and α-Al2O3 performs best, for the four materials tested. Although the bead size had little impact on CO2 conversion in case of ZrO2, increasing the ZrO2 bead size has a positive effect on the CH4 conversion. On the other hand, the upward trend in conversion of CO2 with increasing bead size of SiO2 is much less pronounced for CH4 conversion, showing even a slight drop for the largest SiO2 bead size. Finally, also for α-Al2O3 the dependence of bead size is somewhat different for CH4 and CO2 conversion. In Table 3, we list the CH4/CO2 conversion ratios for all packing materials and sizes.
To interpret the above results, we compare to modelling results obtained by Snoeckx et al. [46], keeping in mind the differences between their work and this work (70 W and 35 kHz in a non-packed reactor, versus 62 W and 23.5 kHz in both non-packed and packed bed reactors, respectively). The conversion of both CO2 and CH4 as a function of residence time, as predicted by the model, is plotted in Figure 4. In our work, the residence time is kept constant at 5.52 s, for which the model predicts a CO2 and CH4 conversion of 4.6 and 9.2%, respectively. We obtained 8.1% and 15.8% conversion for CO2 and CH4, respectively, in the non-packed reactor, while the packed bed reactor (with 2.0–2.24 mm α-Al2O3) can reach 22.5% (CO2) and 32.8% (CH4) conversion. Note that our obtained values in the non-packed reactor are almost a factor 2 higher than the calculated values but it is not possible to make an exact comparison, due to the different conditions (cf. above) and geometry. Moreover, the exact calculated values are subject to uncertainties, due to uncertainties in the reaction rate coefficients [48,49]. Hence, they should be interpreted merely based on trends. It is clear, however, that the packed bed reactor can improve the conversion of both CO2 and CH4 with more than a factor two, at the same residence time.
Moreover, the data clearly exhibits that the CH4 conversion is always higher than the CO2 conversion, both in the model and in the experiments (both for non-packed and packed reactor). In addition, the model predicts that the CH4 conversion is typically twice as high as the CO2 conversion, in good agreement with our results for the non-packed reactor, while the packed bed reactors reveal a ratio of CH4/CO2 conversion varying between 1.5 and 2.2, with the exception of the largest SiO2 beads, where the ratio is only 1.2 (see Table 3), indicating a vast impact of the packing materials on the conversion process. The underlying reasons for these differences in conversion are difficult to link to specific material properties, as the materials diverge in many properties and there is no direct (linear) correlation in the trends in properties that coincide with the trends in conversions (see material characteristics in the Supplementary Materials). Hence, more research will be needed, using materials that are modified, in a controlled way, in specific material properties that are expected to play a key role.

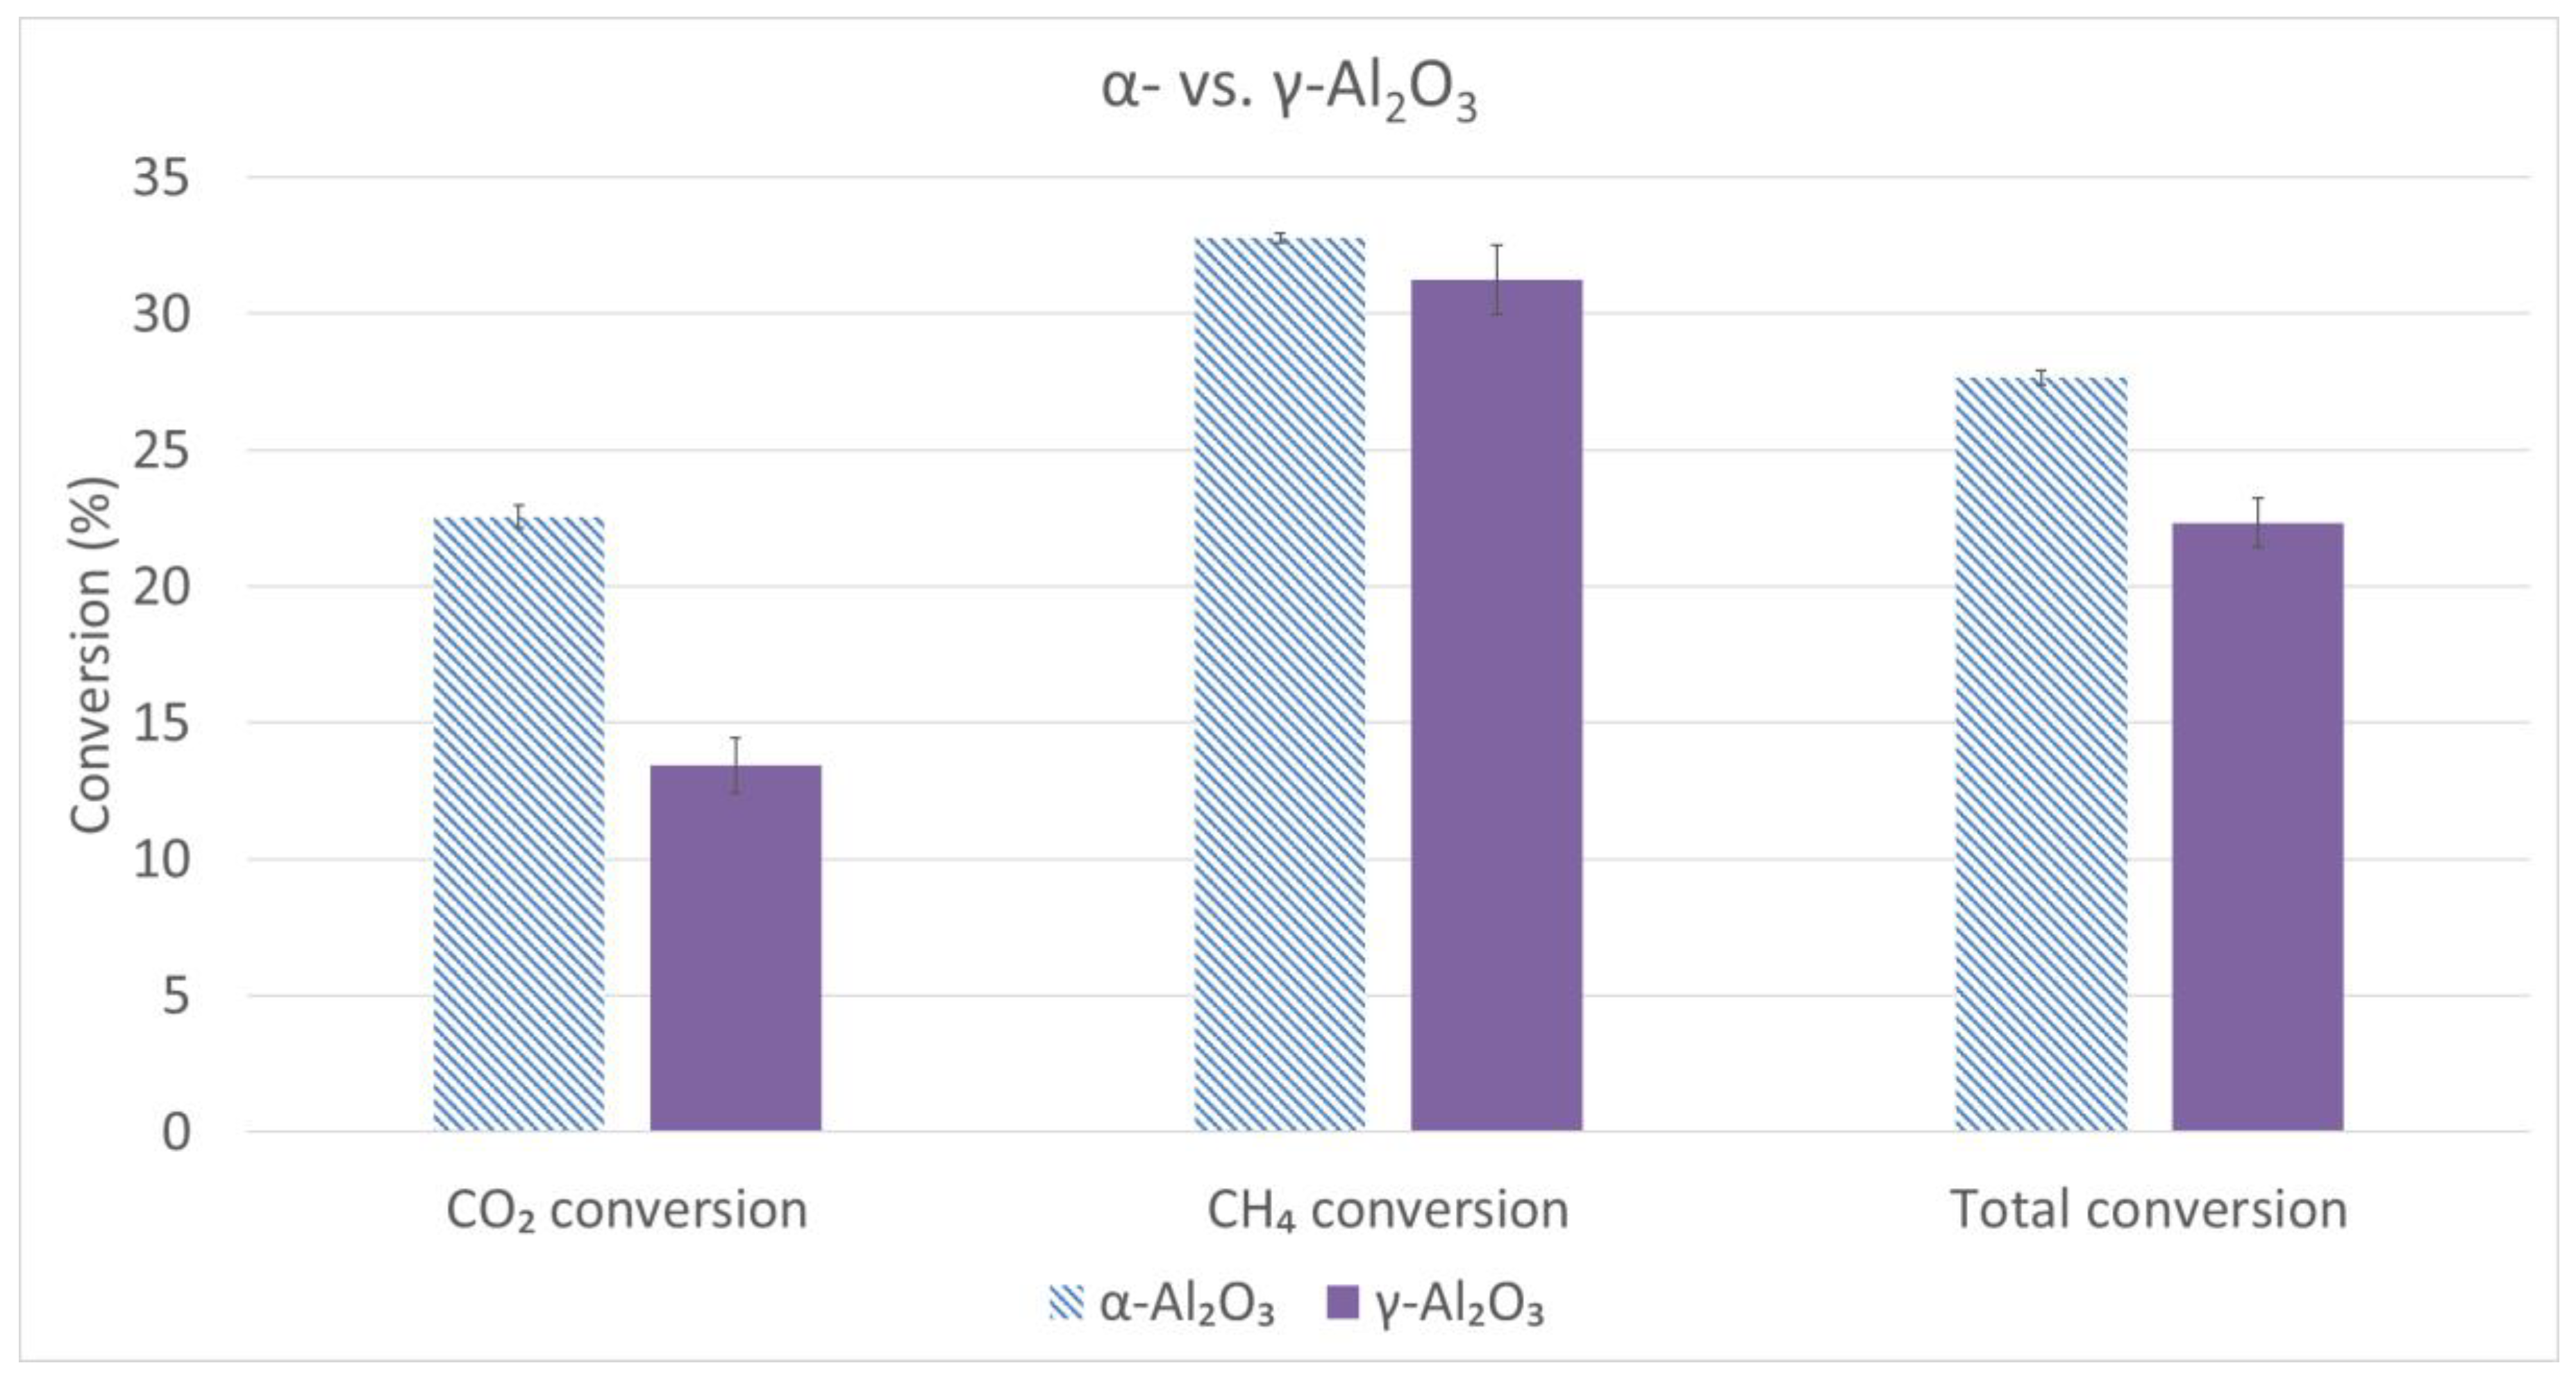
2.3. Comparison Studies α/γ-Al2O3

To obtain more insight in the effect of material parameters, we made a comparison between α-Al2O3 and γ-Al2O3 spheres of 2.0–2.24 mm. The CO2, CH4 and total conversion are depicted in Figure 5.
The CO2 conversion appears a factor 1.7 higher for the α-Al2O3 spheres than for the γ-Al2O3 spheres (i.e., 22.5% vs. 13.4%), while the CH4 conversion is only a factor 1.05 higher (i.e., 32.8% vs. 31.2%). The total conversion is a factor 1.24 higher for α-Al2O3 (i.e., 27.7% vs. 22.3%). These results show a clear impact of the bead material properties and/or surface area on conversion, possibly due to a higher BET-surface, a difference in crystallinity, acidity, higher porosity and/or total open pore volume of the γ-Al2O3, as shown in the Supplementary Materials (Table S1). However, to understand the underlying reasons for this effect, more detailed (operando) surface experiments would be needed, which are outside the scope of this paper. In conclusion, these differences show the importance of indicating as much as possible the material properties of packing materials applied, something that is not systematically done in the majority of the plasma catalysis papers.

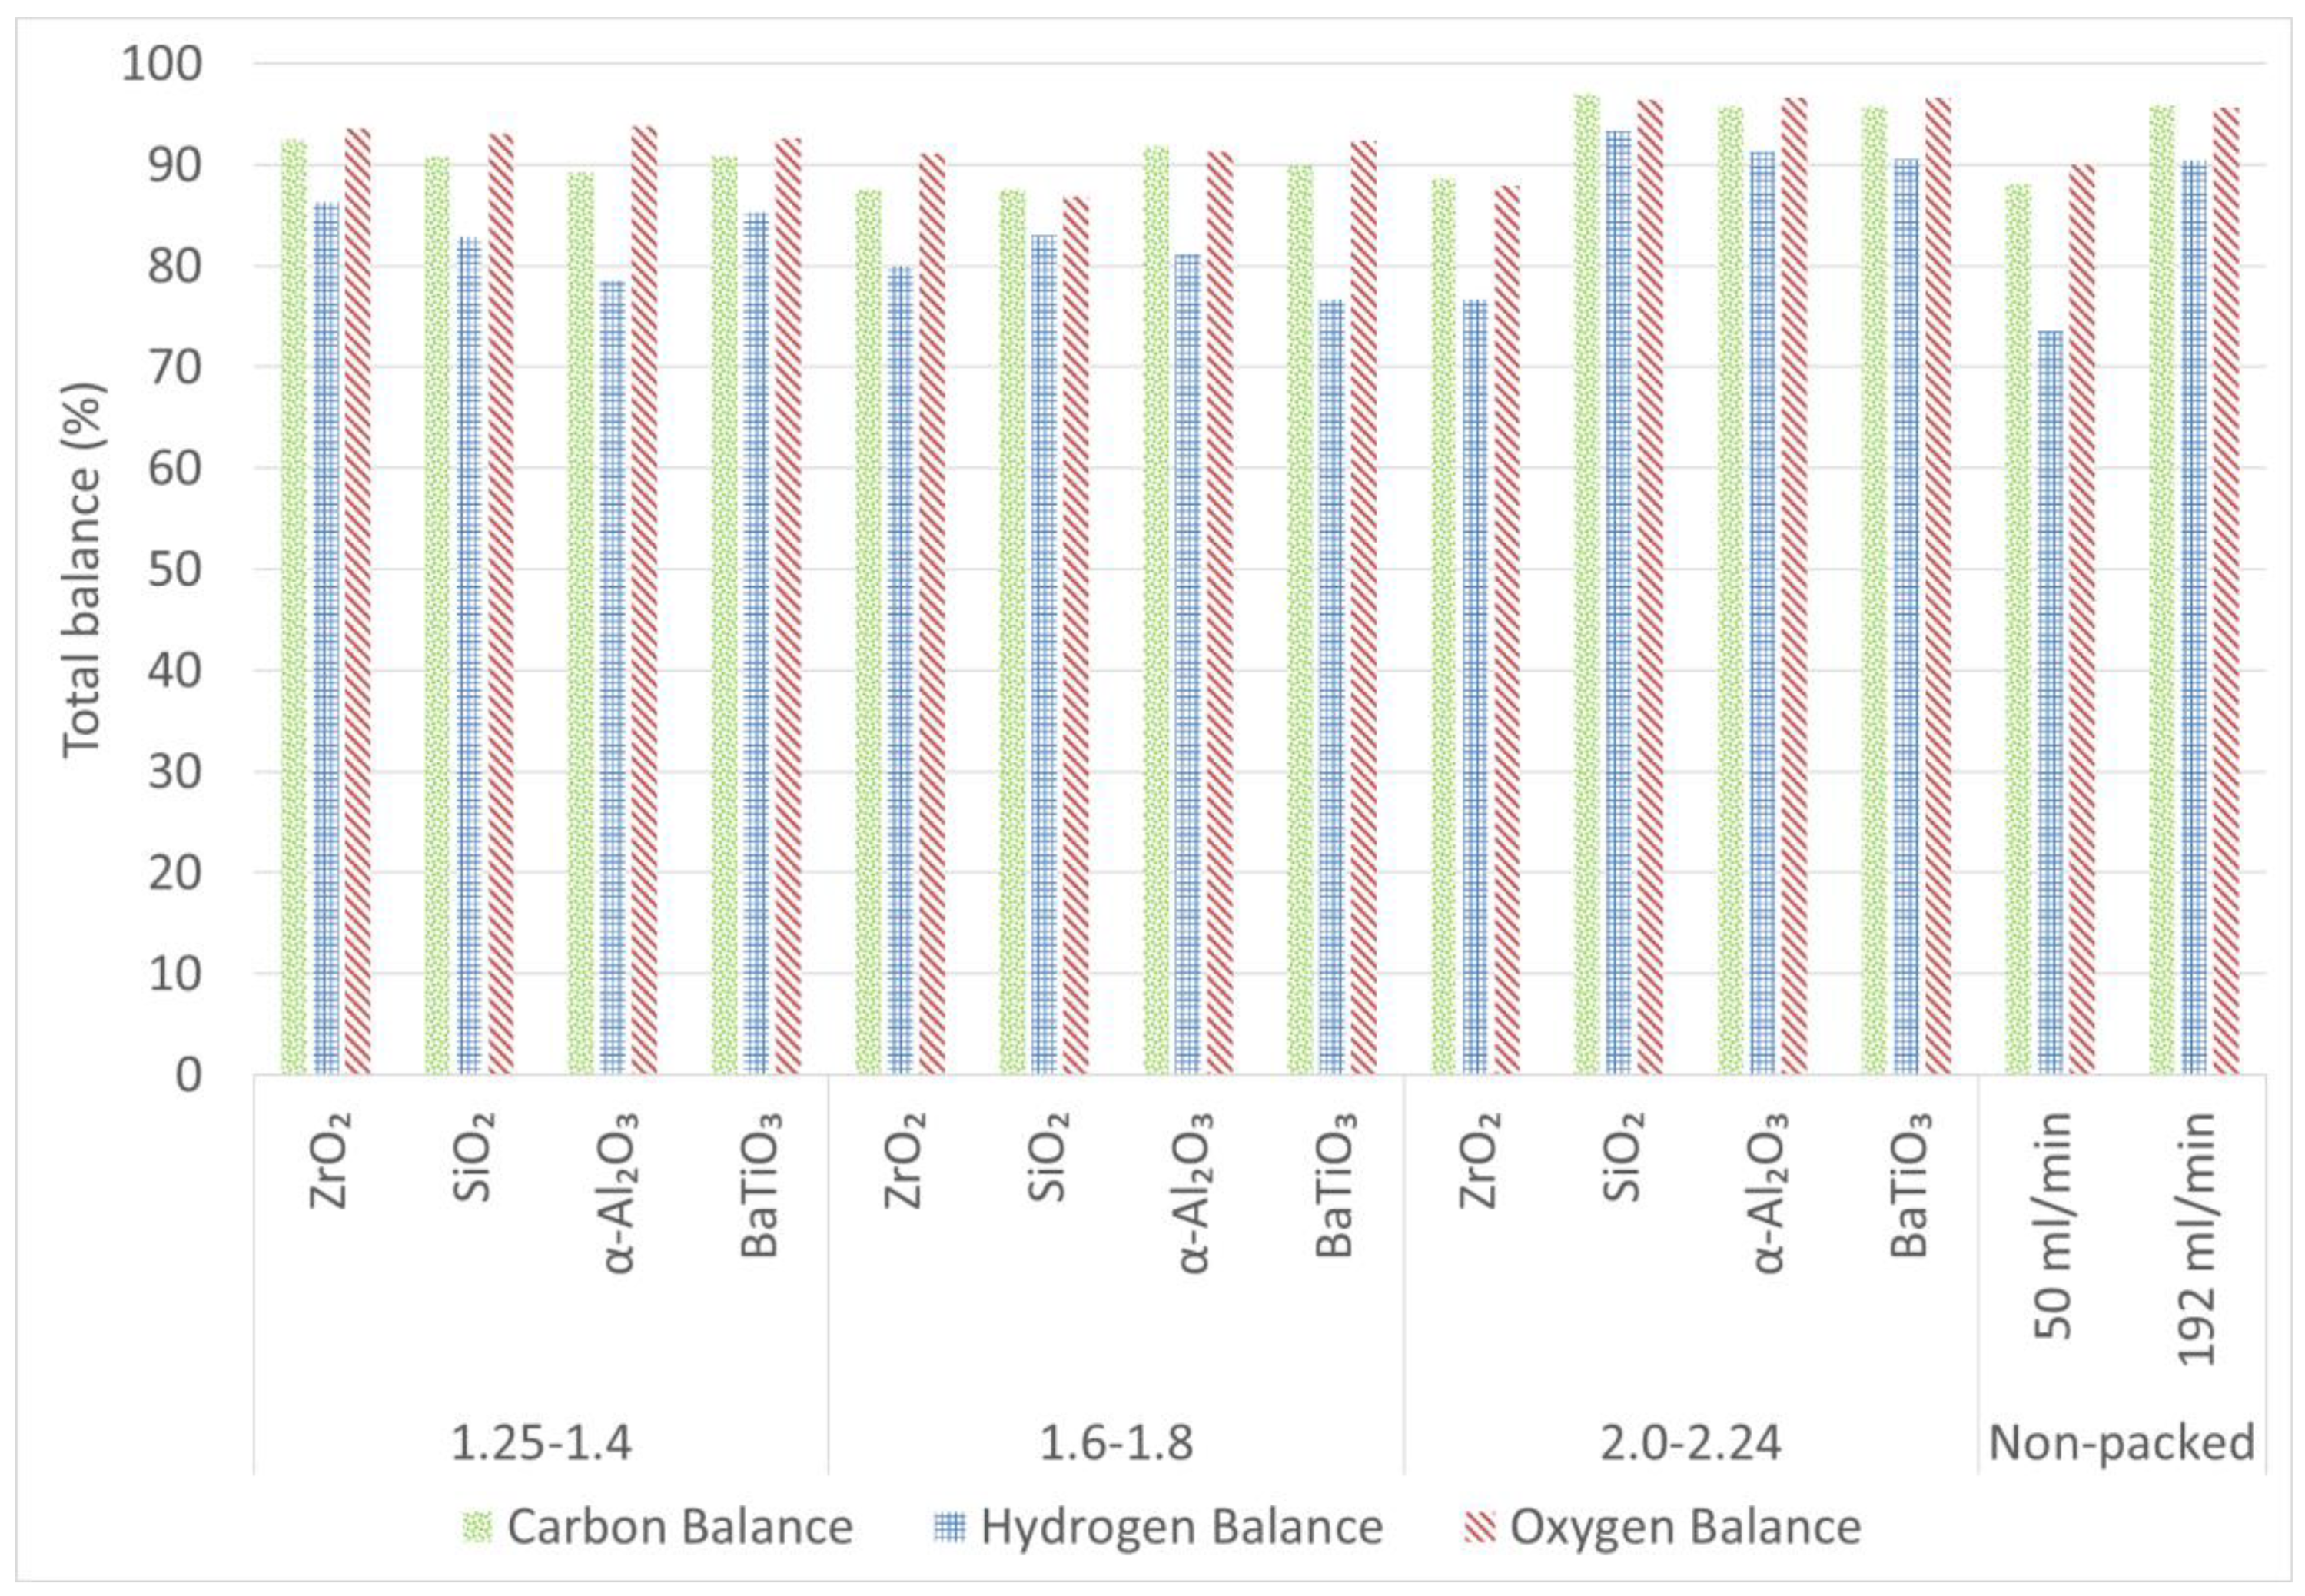
2.4. Carbon, Hydrogen and Oxygen Balances

To determine whether all products have been identified by the GC (Gas Chromatograph), we present the mass balances for carbon, hydrogen and oxygen in Figure 6. Important to note here is that part of the deficit is possibly caused by the gas expansion, as explained above (see materials and methods). As can be seen, the carbon, hydrogen and oxygen balances seldom reach 100%. The largest deficit (between 20% and 30% loss of product) is in the hydrogen balance of the non-packed reactor at 50 mL/min, as well as for the BaTiO3 spheres of 1.6–1.8 mm, the α-Al2O3 spheres of 1.2–1.4 mm and the ZrO2 spheres of 2.0–2.4 mm. In all other cases, less than 20% product remains unaccounted for. Moreover, the oxygen and carbon balances reach much higher values: close to 90% (and even up to 95%) and thus less than 10% loss. It thus suggests that mainly products with more than one hydrogen atom are not taken into account in the converted products. We presume that mostly the formation of H2O and the sum of less abundant (oxygenated) hydrocarbons, that were not calibrated on the GC, lie at the basis of these incomplete balances. Indeed, the deficit in the hydrogen balance is for the majority of the experiments double of the deficit in the oxygen balance, suggesting the formation of H2O. An example of a chromatogram, showing the number (and type) of products that have not been calibrated and accounted for in the mass balances, is shown in Supplementary Materials (Figure S15). In addition, also coke deposition could be at the basis of carbon losses. When looking at the Raman measurements (see Supplementary Materials; Figures S16–S23), it is clear that SiO2 and to a limited extent also α-Al2O3 and ZrO2 suffer from coking at the sphere’s surface, unlike the γ-Al2O3 and BaTiO3 spheres. To visually show the amount of cokes deposited on the spheres, photos are added in the Supplementary Materials (Figure S24).
More detailed carbon, hydrogen and oxygen balances (with the contribution of the different components identified and calibrated by the GC) are shown in the Supplementary Materials (Figures S25–S27 for the carbon balance, Figures S28–S30 for the hydrogen balance and Figures S31–S33 for the oxygen balance). They allow a clear view on all identified products in the treated gas stream, as well as their relative contribution to the total converted products. From these balances, clear differences in product fractions also become apparent when comparing different packing materials. These are discussed in more detail in the following part.

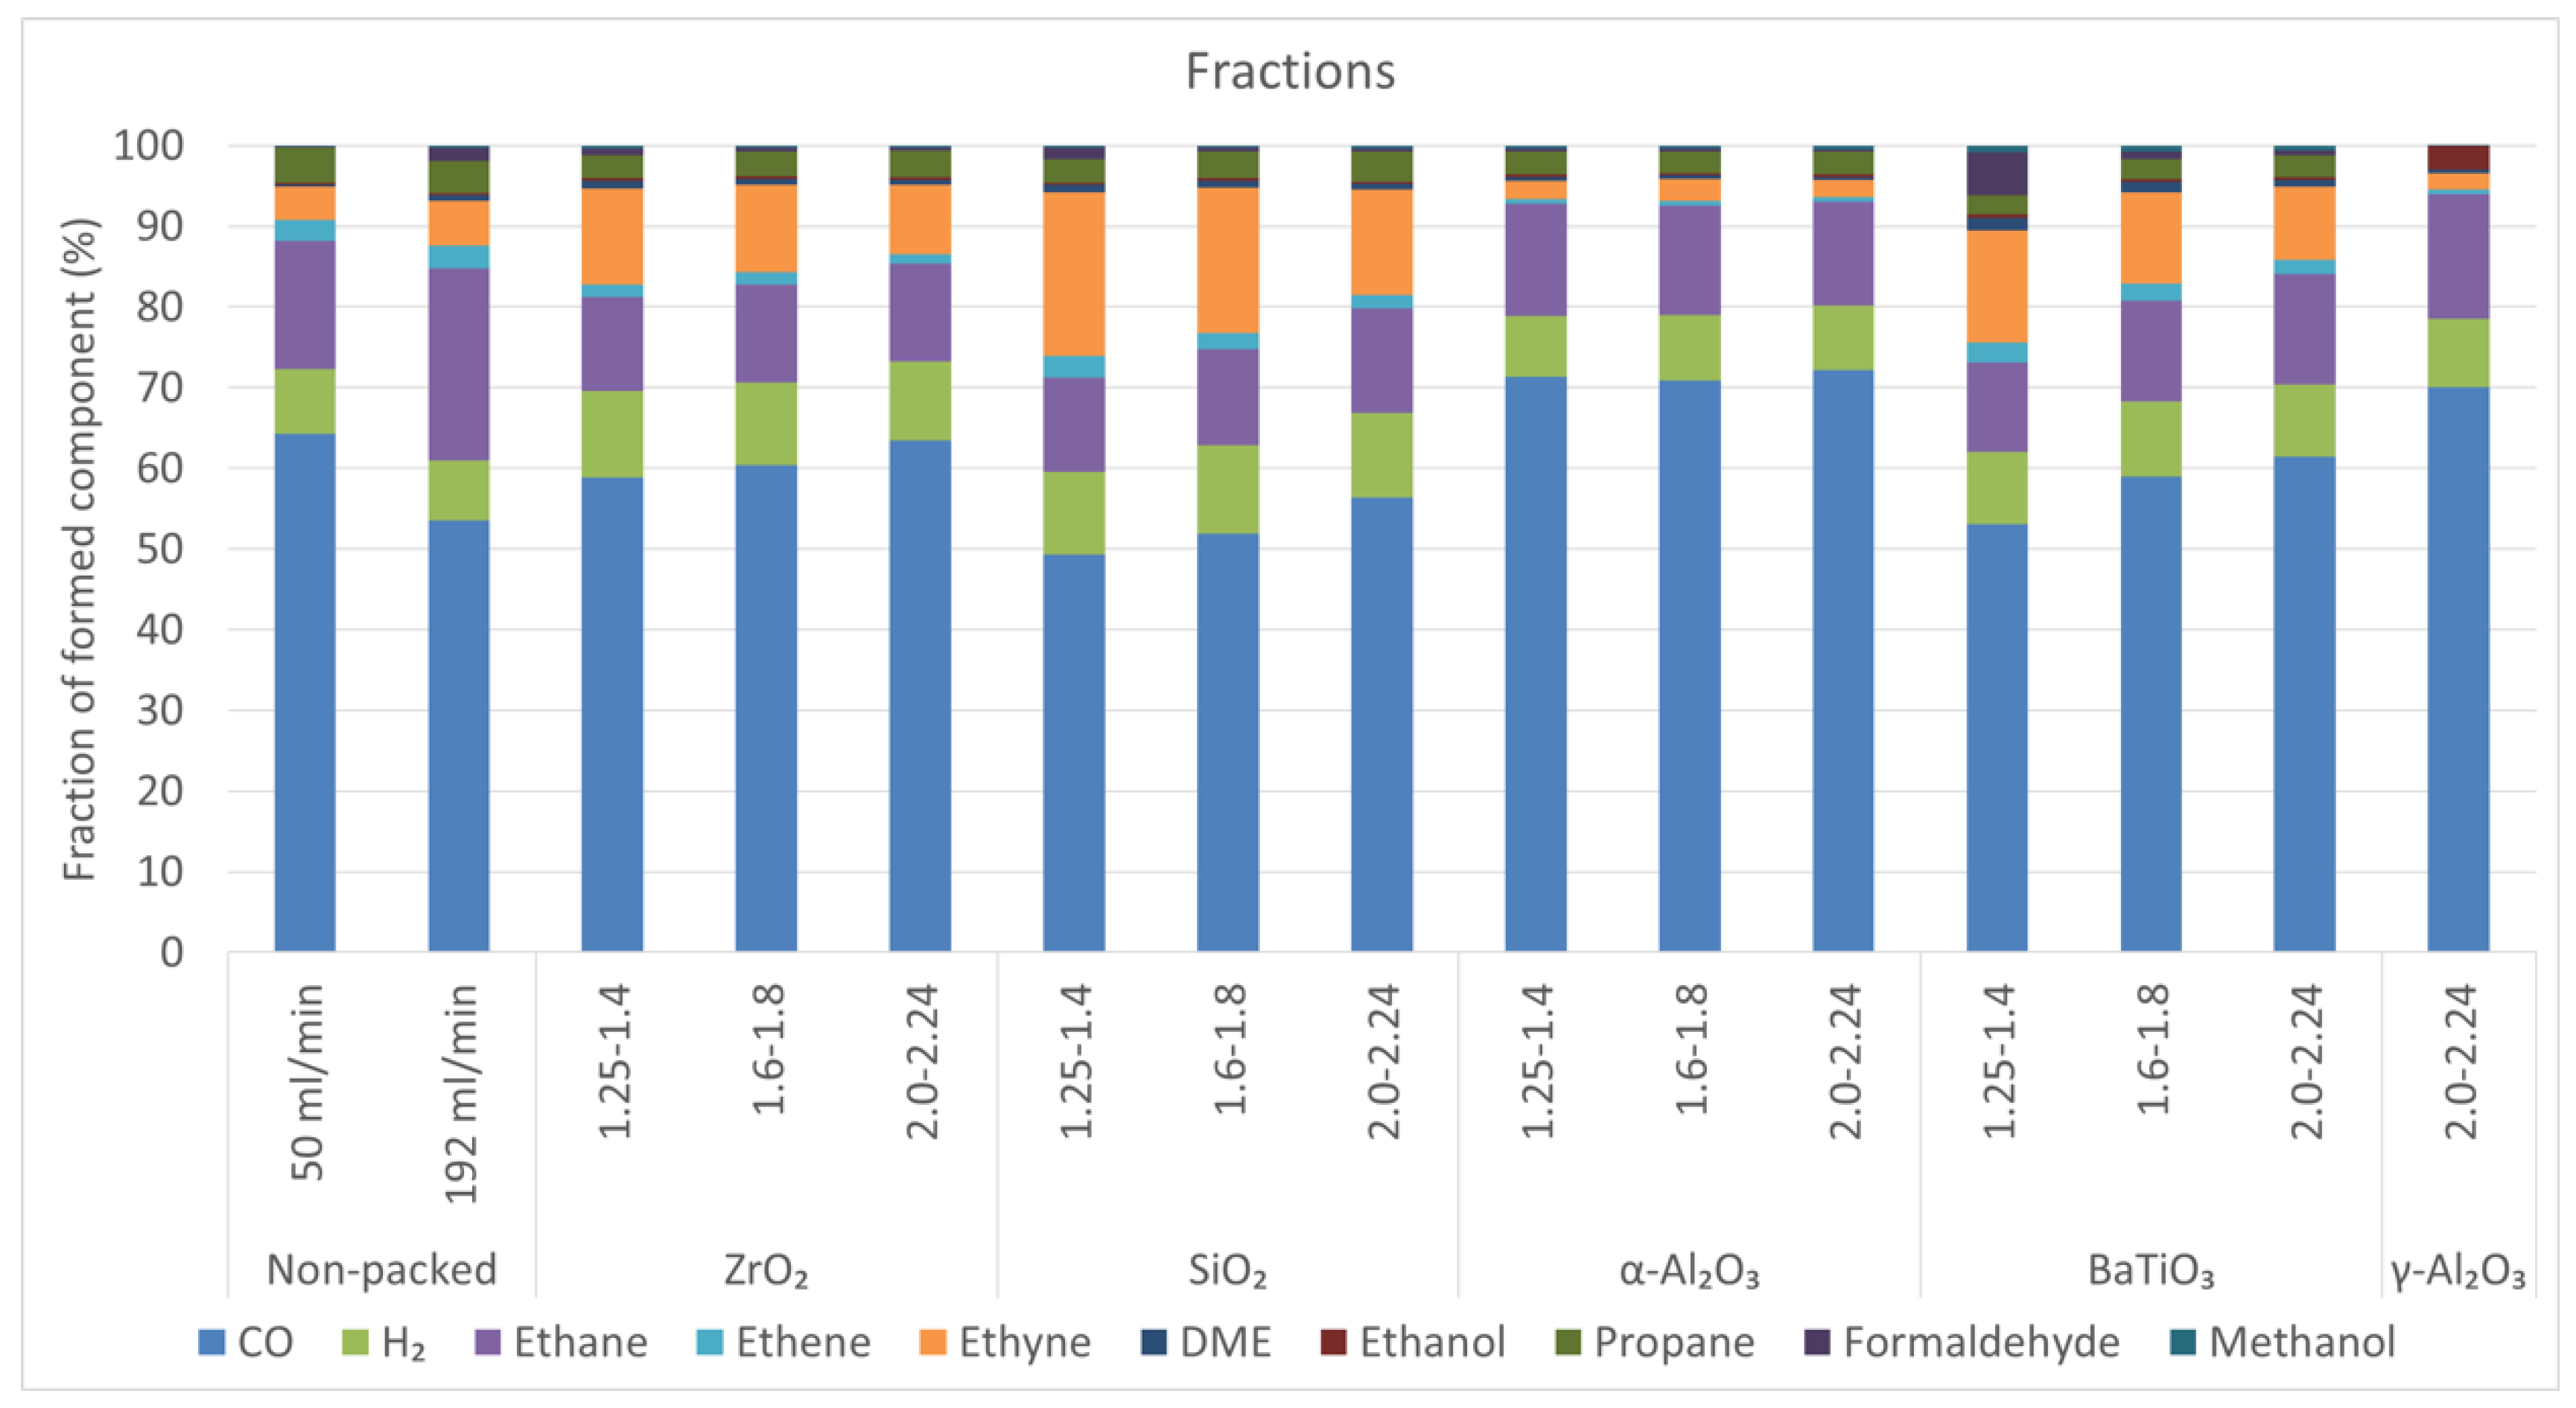
2.5. Product Fractions

As explained in the materials and methods section, the calculation of selectivities and balances induces an uncertainty, caused by the gas expansion. Therefore, we calculated the product fractions in this work (see Equation (4)), as these values only show the relative contribution of each product in the total identified product mixture, which is not subject to the gas expansion. The product fractions are plotted in Figure 7, to provide a general overview and are also listed in Table 4, to better compare the trends, based on quantitative data.
Before going into more detail on differences for the different packing materials, we can make a general observation for the non-packed reactor. Indeed, it seems that the product fraction is to some extent determined by the flow rate, although the ratio of CH4 over CO2 conversion is very similar (see Table 3). Mainly the formation of CO, ethane, ethyne, DME (Dimethylether) and formaldehyde seem to be affected by this. This can be attributed to different formation rates of different products, as explained in the Discussion section, because the different flow rate yields a different residence time.
Table 4 and Figure 7 clearly show that CO is always the largest fraction, for all packing materials and for the non-packed reactors. Moreover, by altering the flow rate (non-packed reactor) or packing materials, the relative amount of CO versus higher hydrocarbons or oxygenates can be altered. Indeed, the CO product fraction can vary from about 53% up to 72%. Therefore, we list in Table 3 also the obtained CO/H2 ratio for the different sphere sizes and materials. This value ranges from 4.7 to above 9, which is quite striking, because the ratio of CH4 over CO2 conversion is always between roughly 1 and 2. It indicates that the majority of C (especially of CO2) is converted into CO, while the H (originating from CH4) preferentially takes part in the formation of many products, not only for H2 but also for higher hydrocarbons.
Furthermore, it is clear from Table 4 and Figure 7 that the type of packing material has a vast impact on the product fractions. Moreover, in case of BaTiO3 and SiO2, also the sphere size seems to have a clear impact, while this is much less visible for ZrO2 and α-Al2O3. For example, when high fractions of ethyne are envisioned, the smallest size of the SiO2 spheres seems to be the best choice. The α- or γ-Al2O3 packing seems to produce the highest CO/H2 ratios (see also Table 3), while at the same time producing substantially less dehydrogenated hydrocarbons (ethene and ethyne).
When comparing the different types of Al2O3 supports (non-porous α- and porous γ-Al2O3), we do not only see differences in conversion (cf. Figure 5 and Table 3), causing a large discrepancy in CH4/CO2 conversion ratio (i.e., 1.5 vs. 2.3, respectively) but also interesting changes in the product fractions. Indeed, although the CO fraction is similar, a larger fraction of ethane and ethanol is obtained for the γ-Al2O3 packing, while the fractions of ethyne and propane are lower and formaldehyde, DME and methanol do not even reach the detection limits.
Furthermore, the BaTiO3 packing with smallest bead size is the only material able to produce a substantial fraction of formaldehyde and produces overall relatively more oxygenated products, including higher amounts of DME, compared to the other materials.
When looking more closely to the results, four different trends can be observed when taking into account the four largest component fractions (excluding CO, which is always the largest fraction):
  • For the non-packed reactor at 50 mL/min and all α-Al2O3 spheres, the order is: ethane > H2 > propane > ethyne.
  • For the non-packed reactor at 192 mL/min, the order is: ethane > H2 > ethyne > propane > ethene.
  • For the smallest ZrO2 and BaTiO3 spheres and all SiO2 spheres, the order is: ethyne ≊ ethane > H2 > propane (formaldehyde in case of BaTiO3).
  • For the two largest BaTiO3 spheres and the intermediate ZrO2 spheres, the order is: ethane > ethyne ≊ H2 > propane > ethene.
Also the oxygenated fractions, which are much smaller, show clear differences depending on the packing material and size, as detailed in Table 4.

3. Discussion

The results of the non-packed reactor show an interesting way of tuning product fractions. By reducing the residence time (higher flow rate), the ratio of CO2/CH4 conversion is similar but the fraction of the products can be altered. Indeed, shorter residence times seem to produce less CO and more oxygenates, hinting towards a kinetic effect that will determine the product fractions. Indeed, model calculations predict that the rates of formation of different products are different [50]: some products rise quickly, while others rise more slowly as a function of time or go over a maximum, because they are converted into another product. Hence, depending on the residence time (and thus flow rate), the product fractions can be altered.
Not only the residence time in the plasma/reactor has an influence on the conversion and product fractions but also the residence time of species in contact with the packing material’s surfaces. Indeed, according to the Sabatier principle, the residence time and binding energy between the adsorbing molecule and the surface should be long/strong enough for conversion to take place, while the residence time and binding energy between the products and the surface should be short/weak, so that the product can easily desorb. However, in case of plasma-assisted conversion, also many other underlying mechanisms, both physical and chemical, that take place simultaneously, can influence the reactions (both partial chemical equilibrium and kinetics) and thus conversion and product distribution.
Indeed, based on the results, also packing materials clearly influence the plasma chemistry, as can be deduced from the different CO2/CH4 conversion ratios and product fractions. The difference in the CO2/CH4 conversion ratio can be caused by many factors, such as differences in discharge type, the number and transferred energy of the streamers, the streamer propagation, electric field enhancement, electron temperature difference, surface adsorption effects and so forth. We present the electrical characteristics for the different sphere sizes and materials in the Supplementary Materials but they do not reveal clear trends that can explain the observed differences in conversion ratios. Probably it is a combination of different effects. Similarly, no clear correlation can be made to the material properties (also presented in the Supplementary Materials). Indeed, all these differences influence the CO2 and CH4 conversion and thus the resulting products formed, due to differences in gain and loss reactions. In our previous work for pure CO2 splitting, we could correlate the impact of bead size and material to differences in number of contact points, size of void spaces and to some extent the dielectric constant of the material but it could not explain all data, so other underlying mechanisms must be present as well [32]. Even though we expect differences induced by changes in the discharge mode and discharge properties, due to the differences in for example, dielectric constants of the packing materials, the data extracted from the electrical characterisation (Supplementary Materials: Table S2) display no straightforward correlation to the observed differences in CO2/CH4 conversion. Nevertheless, not all differences in discharge behaviour can be measured. For example, modelling has revealed important differences in streamer propagation and/or streamer versus surface discharge behaviour, positive restrikes and local discharges, for packed bed reactors, depending on the dielectric constant of the packing material [51]. Moreover, the same modelling study showed that the impact of the discharge mode will be different for different chemical species and thus its impact on CO2 and CH4 conversion, as well as on the intermediate species and products, might vary, resulting in the observed differences in CO2/CH4 conversion and product distribution. This complex interplay induced by the packing is too complex to postulate the underlying mechanisms for the observed differences in the data [51] and requires much more extended research, focused on materials with systematically altered properties, as well as extensive modelling.
Furthermore, some packing materials, such as Al2O3, behave superior to the others, both in case of CO2 and CH4 conversion, indicating that the observed results are not only related to the dielectric constant and its effects on the electrical properties of the plasma. Indeed, otherwise, BaTiO3 (which has the highest dielectric constant) would provide the best results, which is clearly not the case. Moreover, if the results would only be correlated to the dielectric constant of the material, α- and γ- Al2O3, both having the same dielectric constant, would yield the same conversion. This indicates that other effects, like for example, the surface area and/or the surface acidity, may lie at the base of this difference. Nevertheless, the fact that BaTiO3 performs worse than the other materials can also be correlated to some extent to the electrical properties, because Wang et al. predicted by modelling that materials with higher dielectric constant constrain the discharge to the contact points of the packing materials. They suggested that this can limit surface activation due to a lower surface area in contact with the discharge [51]. On the other hand, materials with a higher dielectric constant result in a higher electric field enhancement, which will also be beneficial for CO2 and CH4 conversion [52,53]. Hence, these are opposite effects and this could explain why Al2O3 is a superior material, having an “intermediate” dielectric constant of 9, while BaTiO3 (with a dielectric constant of ~4000 [54]) is performing worse. It should be noted that BaTiO3 gave the best results in pure CO2 splitting, indicating that the effect of electric field enhancement was in that case more important than the effect of the surface discharges. The role of surface discharge behaviour on CH4 conversion (and vice versa) thus seems important, although this is only a hypothesis.
Other literature reports also support this careful hypothesis, suggesting a difference in behaviour of CH4 and CO2 conversion. Indeed, Snoeckx et al. predicted by modelling that CO2 is not only converted during the microdischarge filaments in a DBD reactor but is also able to react further in the afterglow (both in between filaments as well as post-plasma), whereas CH4 is mainly converted during the filaments and is being formed again (by recombination of reaction products) in the afterglow [46]. Nevertheless, the effect of different packing materials and sizes on the CH4/CO2 conversion ratios might be more complicated, as a result of several other mechanisms as well, so it is not possible to explain all differences in detail. Thus, due to the complex and intertwined nature of the chemistry and physical effects at play, extensive modelling would be needed to confirm or reject this first hypothesis as part of the possible underlying mechanisms.
In addition to the above possible mechanisms, also other interesting hypotheses can be made, based on the surprising result of the difference in performance of BaTiO3 in DRM versus pure CO2 splitting.
Based on the results of pure CO2 splitting, it is possible that BaTiO3 strongly promotes the equilibrium of CO2 splitting towards CO and O. In combination with a high CH4 conversion (CH4/CO2 conversion ratio of 2), which results in a high fraction of H atoms, the O atoms might recombine with H atoms into OH. The latter can further react towards oxygenated components (explaining the higher fractions of oxygenates in the presence of BaTiO3), as well as towards H2O (and possibly HO2 and H2O2). The trapping of O atoms into OH radicals and H2O, when small amounts of CH4 are added to CO2 streams, has been predicted by modelling [55]. In the latter paper, it was described as a positive effect, because it allowed easier separation of the produced gas mixture but the study was only applied for a few % of CH4 addition to CO2. Due to the high performance of BaTiO3 towards CO2 splitting, as demonstrated in our previous work [32], a much higher concentration of OH radicals might be present here, engaging in other (more negative) reactions, lowering the conversion. Indeed, recent modelling studies of CH4/O2 mixtures have indicated a preferential formation of H2O from OH radicals [50]. These H2O molecules will promote the back reaction of CO into CO2, as suggested based on CO2/H2O models [56]. This can explain the lower CO2 conversion in DRM for a BaTiO3 packing, compared to pure CO2 splitting. We cannot measure H2O with our GC but the deficits in the oxygen and hydrogen balance (see Figure 6) suggest that indeed a large amount of H2O might be formed. However, more research is needed to verify the above hypotheses. Note that the high amounts of OH radicals can not only cause back reactions of CO into CO2 but can also explain the higher oxygenate content in case of the BaTiO3 packing, compared to the other materials. It is thus advised, when aiming for a suitable catalyst for plasma-based DRM, to search for a material that benefits the reaction of OH towards CHO or further towards CH3O2 instead of towards H2O. The different reaction pathways mentioned in this reasoning, are shown in the Supplementary Materials (Figures S34–S36).
Nevertheless, this is still a hypothesis which needs further experimental and modeling proof to substantiate it and reveal the underlying mechanisms.
Finally, the CH4 conversion is always higher than the CO2 conversion, due to the lower C–H bond dissociation energy compared to C=O bond dissociation energy, for all packing materials and sphere sizes. However, the CH4/CO2 conversion ratio varies from 1.2 to 2.3 (see Table 3), so the difference is more pronounced for some materials than for others. This suggests that for those packing materials with a lower CH4/CO2 conversion ratio (e.g., 1.25–1.4 mm α-Al2O3 and BaTiO3 and 2.0–2.24 mm SiO2 and α-Al2O3; see Table 3), the situation is more complicated, for example, a back reaction or an impact on the kinetics of CH4 conversion or CO2 conversion is taking place.

4. Materials and Methods

We applied the same setup as described in our previous work [32]. It comprises two concentric electrodes: a grounded inner electrode made of stainless steel and the live outer electrode (10 cm) consisting of a stainless steel mesh, wrapped around the dielectric barrier. The dielectric barrier forms the reactor tube that encloses the gap with the inner electrode and is made of Al2O3. The gap is confined between the inner electrode (8 mm outer diameter) and the dielectric barrier (inner diameter 17 mm, thickness 2.4 mm), resulting in a gap size of 4.5 mm. In this gap, we inserted the spherical dielectric packing material. The packing spans the full discharge volume with a length of 10 cm (the outer electrode length). To prevent the spherical packing from shifting, the beads were secured with glass wool at both ends of the discharge zone. The high voltage was supplied by a generator, a transformer and a power supply (AFS GmbH, Horgau, Germany). The voltage was measured with a high voltage probe (Tektronix P6015A, Beaverton, OR, USA), while the current was measured with a Rogowski coil (Pearson 4100, London, UK) and the condenser (10 nF) measures the charge. The electrical signals were recorded with an oscilloscope (PicoScope 6402 A, Tyler, TX, USA).
Plotting Q versus U results in Q-U Lissajous figures, giving insight in the electrical characteristics. Analysing the Lissajous data and the oscillograms with Matlab yields six different data. The plasma power is calculated by multiplying the measured current and voltage. The burning voltage (Ubur) and peak-to-peak voltage (Upp) are calculated from the Lissajous graphs. Furthermore, the root-mean-square current ( I R M S ), number of micro discharges per period and displaced charge per micro discharge are extracted from the oscillograms. More information about how these data are obtained from the Lissajous plots and oscillograms can be found in ref. [32,57]. The data are summarised in Table S2 of the Supplementary Materials. All packing materials result in a lower burning voltage, which has already been observed before [58], as well as more micro discharges per period and a larger root-mean-square current.
The reaction conditions and packing materials tested in this work are listed in Table 5.
Five different spherical packing materials were used in this work, that is, SiO2 (SiLiBeads, Warmensteinach, Germany), Y-stabilised ZrO2 (SiLiBeads, Warmensteinach, Germany), BaTiO3 (Catal, Sheffield, UK), γ-Al2O3 (BASF) and α-Al2O3 (in-house formulated by droplet coagulation at VITO (Vlaamse Instelling voor Technologisch Onderzoek—Flemish institute for technological research), with the α-Al2O3 being purchased from Almatis, Rotterdam, The Netherlands [32]). The different physical and chemical characteristics of each material are reported in the Supplementary Materials: Table S1 and Section 1 (Figures S2–S14 and Table S4). The stability of the materials is also discussed in the Supplementary Materials. (Section 2, Figures S16–S24), which focuses on coking resistance.
The gas feed flow rates for both CO2 and CH4 are regulated with thermal mass flow controllers (Bronkhorst, Ruurlo, The Netherlands) and the outlet gas is analysed with a custom made online gas chromatograph (Trace GC 1310, Interscience, Bretèche, France). The GC is equipped with a TCD (thermal conductivity detector) and an FID (flame ionization detector) with a methanizer. The separation of the gasses is accomplished with four columns: a Molsieve 5A, 2 RT-Q-bonds and a RTX-f column.
The experiments are carried out as follows: the reactor is always packed with fresh packing. A vibration step is applied during packing to ensure dense packing of the reactor and uniform void spaces. Subsequently, the gas is flushed through the reactor for 10 min, followed by a blanc (i.e., without plasma) measurement, consisting of four consecutive GC measurements and electrical measurements, confirming the feed concentration CO2,in and CH4,in (a constant CO2/CH4 ratio of 1/1 is applied in this study). Then, the plasma is ignited and stabilised for a duration of 40 min, followed by four consecutive GC and electrical measurements. This plasma measurement is repeated three times, each time with fresh packing. This way, the uncertainties introduced by packing the reactor are included in the final result. The error bars on the data-points below are thus based on the 12 measurements executed as explained above.
Based on the peak areas of the GC chromatogram obtained from the plasma measurements (CO2,out and CH4,out) and the blanc measurement, the conversions for CO2 and CH4 are calculated (Equations (1) and (2)). The total conversion is calculated using the fractions of both gasses in the inlet gas flow (in our case, both 50%; Equation (3)).
X C O 2 = C O 2 , i n C O 2 , o u t C O 2 , i n 100 %
X C H 4 = C H 4 , i n C H 4 , o u t C H 4 , i n 100 %
X T o t a l = X C O 2 + X C H 4 2
As explained in our previous work [32], the conversion of gasses into a larger number of molecules leads to an expansion of the volume of the gas, causing a pressure increase. As the GC depressurizes the gas to 1 bar upon sampling (sample loop volume of 100 μL), some converted volume could thus be lost upon depressurizing, relative to the blanc experiment executed at a constant pressure of 1 bar. The formation of higher hydrocarbons, on the other hand, would lead to an increase in density. The extent of conversion, the type of products formed (density) and the product distribution, thus determine the extent of pressure increase and thus the possible loss of converted gas upon sampling. For CO2 splitting, this can be easily accounted for, as demonstrated in refs. [32,45,57,59,60]. However, for DRM, it is nearly impossible to take this into account, because a plethora of products can be formed, which are not a priori known or can even not all be identified in the GC. Yet, it is still important to know that this process can play a role and expansion of the gas can influence (slightly overestimate) the conversions. More details about the extent of its impact on the obtained results can be found in the work of Pinhão et al. [59]. As it does not only affect the conversions but also the way to calculate the product selectivities, we report the data as relative fractions of products to the total of identified products. Indeed, these product fractions are not affected by the gas expansion. The relative product fractions are defined as follows (shown for H2 as example):
F H 2 =   H 2 C O +   H 2   + C 2 H 6 + C 2 H 4 + C 2 H 2 + C 2 H 6 O + C 2 H 5 O H + C 3 H 8 + C H 2 O + C H 3 O H
For information of the reader, the yields and selectivities (albeit with the uncertainties due to the gas expansion) are also calculated and shown in the Supplementary Materials (Tables S5 and S6).
Next to the conversion, also the carbon, hydrogen and oxygen balances (CB, HB, OB) were calculated, to give insights in the presence of products not yet identified in the analysis (or not possible to identify in our analysis, for example, H2O) or losses such as in cokes. These are calculated as follows:
CB   ( % )   =   C O 2 ,   o u t   + C H 4 ,   o u t + C O + 2 C 2 H 6 + 2 C 2 H 4 + 2 C 2 H 2 + 2 C 2 H 5 O H + 2 C 2 H 6 O + 3 C 3 H 8 +   C H 2 O +   C H 3 O H C O 2 ,   i n   + C H 4 ,   i n
HB   ( % )   =   2 H 2   + 4 C H 4 ,   o u t + 6 C 2 H 6 + 4 C 2 H 4 + 2 C 2 H 2 + 6 C 2 H 5 O H + 6 C 2 H 6 O + 8 C 3 H 8 + 2   C H 2 O +   4 C H 3 O H 4 C H 4 ,   i n
OB   ( % )   =   2 C O 2 ,   o u t   + C O + C 2 H 5 O H + C 2 H 6 O +   C H 2 O +   C H 3 O H 2 C O 2 ,   i n  
In Formulas (5)–(7), the terms in the nominator are subject to the gas expansion explained before, whereas the terms in the denominator are not. Hence, the mass balance percentage might be slightly under- or overestimated, depending on the product mix.
The SEI (specific energy input) is defined as
S E I   ( k J L ) = P l a s m a   p o w e r   ( k W ) T o t a l   g a s   f l o w   r a t e   ( L min ) 60   ( s min )
The total gas flow rate is the sum of the flow rates of CO2 and CH4. For all experiments in the packed bed reactor, this value is 50 mL/min, while in the non-packed reactor, we use a flow rate of 50 mL/min or 192 mL/min. Indeed, the experiments with a non-packed reactor at 50 mL/min provide comparison with the packed bed reactor at equal flow rate, while the experiments at 192 mL/min compare at the same residence time. This way, the reduction in the reactor volume caused by the addition of the packing (estimated as 74% volume, independent of the packing size [61]), is accounted for.
The plasma power in the above formula is the power generated in the plasma reactor, calculated based on the measured voltage and current and not the power that is set on the power supply (typically there is a power loss of ~40%, from 100 Watt to 60 Watt). The analysis of the obtained Lissajous data gives a more correct value of the actual power that is supplied to the plasma (see Supplementary Materials: Table S2).

5. Conclusions

The aim of this research was to study the influence of different packing materials on the conversion and product fractions formed in the dry reforming of CH4 in a packed bed DBD reactor and to compare this to our previous work on CO2 splitting.
For this purpose, five different packing materials in three different sizes, that were not explicitly activated with catalytically active elements but could be catalytic in nature, were compared. The following conclusions can be drawn:
The highest CO2, CH4 and total conversion obtained in the packed bed reactor was 22.5%, 32.8% and 27.7%, respectively, for α-Al2O3 spheres with a diameter of 2.0–2.24 mm. In the non-packed reactor at equal flow rate, the CH4 and total conversion yielded still higher values of 37.3% and 28.5%, respectively, due to the longer residence time. Analysis of the packing materials before and after plasma confirmed that most of the packing materials have a high resistance to coking, although SiO2 showed clear D and G bands.
It was clearly evidenced that the type and size of packing materials cannot only influence the overall conversion but also the CH4/CO2 conversion ratio and the product fractions, even without being activated with catalytic elements. This emphasizes the importance of studying all essential aspects of a catalyst in case of plasma catalysis, including the non-catalytically activated support material.
Depending on the packing material applied, very high CO/H2 ratios can be obtained, hinting to mechanisms where the H atoms (originating from CH4) are mainly involved in the formation of hydrocarbons or oxygenated products, rather than into H2.
By studying two types of Al2O3 (α and γ), with the same dielectric constant, we can conclude that apart from differences in electrical characteristics and discharge behaviour, other materials chemistry or structural (e.g., porosity) related features have a vast impact on product formation, leading to a very different product distribution, in case of α-Al2O3 versus γ-Al2O3. It has to be noted that γ-Al2O3 results in the highest product selectivity (higher than α-Al2O3), with no detectable fractions of oxygenated products, except for a 10-fold higher ethanol formation (fraction of 3%), in combination with a high CO content (~70%), the latter being similar to α-Al2O3.
Another interesting observation was the discrepancy between the high CO2 conversion of BaTiO3 for CO2 splitting, in contrast to the low CO2 conversion in case of DRM. A possible explanation for this was put forward, based on models that hint towards the recombination of O and H atoms into OH and possibly enhanced back reactions. However, further studies, including both extensive modelling and plasma catalysis with materials with systematically altered properties, are required to confirm the complicated interplay of the different mechanisms.
In general, we can conclude that, even without a catalytic activation, the packing material already has a vast effect on the conversions and product fractions. This indicates the importance of studying all materials aspects in case of plasma catalysis, including the non-activated packing materials. Furthermore, it shows that more research is needed, combining extensive modelling with material research, to unravel the mechanisms at play. Finally, it exemplifies the tremendous future opportunities to create catalysts with true synergy in packing material and active element, that can significantly impact both conversion and selective production of chemicals, allowing to steer DRM to different types of products, ranging from oxygenates to higher hydrocarbons in a one-step process, making plasma-catalytic DRM competitive with thermal DRM in the future.

Supplementary Materials

The following are available online at https://www.mdpi.com/2073-4344/9/1/51/s1. Figure S1: UV-DR spectra of SiO2 before (blue graph) and after (red graph) plasma exposure (milled spheres). Figure S2: UV-DR spectra for ZrO2 before (blue graph) and after (red graph) plasma exposure (milled spheres). Figure S3: UV-DR spectra for BaTiO3 before (blue graph) and after (red graph) plasma exposure (milled spheres). Figure S4: Nitrogen Sorption for SiO2. Figure S5: Nitrogen Sorption for ZrO2. Figure S6: Nitrogen Sorption for α-Al2O3. Figure S7: Nitrogen Sorption for γ-Al2O3. Figure S8: Nitrogen Sorption for BaTiO3. Figure S9: Hg-porosimetry for SiO2. Figure S10: Hg-porosimetry for ZrO2. Figure S11: Hg-porosimetry α-Al2O3. Figure S12: Hg-porosimetry γ-Al2O3. Figure S13: Hg-porosimetry BaTiO3. Figure S14: Raman spectrum for SiO2, before and after plasma exposure. Figure S15: Raman spectrum for ZrO2, before and after plasma exposure. Figure S16: Raman spectrum for α-Al2O3, before and after plasma exposure. For both spheres (before and after plasma), 2 spectra are recorded: one with 90% of the light filtered out and one with 99% of the light filtered out. Figure S17: Zoomed-in (at coking regions) Raman spectrum for α-Al2O3, before and after plasma exposure. For both spheres (before and after plasma), 2 spectra are recorded: one with 90% of the light filtered out and one with 99% of the light filtered out. Figure S18: Raman spectrum for γ-Al2O3, before and after plasma exposure. Figure S19: Zoomed-in (at coking regions) Raman spectrum for γ-Al2O3, before and after plasma exposure. Figure S20: Raman spectrum for BaTiO3, before and after plasma exposure. Figure S21: Zoomed-in (at coking regions) Raman spectrum for BaTiO3, before and after plasma exposure. Figure S22: visual image of the spheres before and after plasma treatment. Figure S23: CO2, CH4 and total conversion for different sphere sizes and materials, compared to the results for the non-packed reactor, at the same flow rate (50 mL/min) and at the same residence time (5.52 s; flow rate of 192 mL/min). Figure S24: Part of a gas chromatogram obtained in this work, zoomed in on the baseline. Figure S25: Total carbon balance for different sphere sizes and materials. Figure S26: Detailed carbon balance for different sphere sizes and materials, without CO2 and CH4 contribution. Figure S27: Normalized carbon balance for different sphere sizes and materials, without CO2 and CH4 contribution. Figure S28: Total hydrogen balance for different sphere sizes and materials. Figure S29: Detailed hydrogen balance for different sphere sizes and materials, without CH4 contribution. Figure S30: Normalized hydrogen balance for different sphere sizes and materials, without CH4 contribution. Figure S31: Total oxygen balance for different sphere sizes and materials. Figure S32: Detailed oxygen balance for different sphere sizes and materials, without CO2 contribution. Figure S33: Normalized oxygen balance for different sphere sizes and materials, without CO2 contribution. Figure S34: Reaction scheme to illustrate the main pathways for the conversions of CH4 and O2 and their interactions. Adopted with permission from ref. [17]. Copyright 2018 American Chemical Society. Figure S35: Reaction scheme to illustrate the main pathways for dry reforming of methane. Adopted with permission from ref. [17]. Copyright 2018 American Chemical Society. Figure S36: Reaction scheme to illustrate the main pathways for the conversions of CO2 and H2O and their interactions. Adopted with permission from ref. [18]. Copyright 2018 Wiley-VCH. Table S1: Electrical characterisation for all experiments. Table S2: Physical and chemical characteristics of the packing materials. Table S3: Specifics of the equipment for all characterization techniques. Table S4: SEM-EDX measurements for all spheres before and after plasma, measured at 3 points per sphere. Table S5: Identified products, ranked in decreasing order of their yields, for the different packing materials and the non-packed reactor. The components highlighted are present for more than 1%, the others for more than 100 ppm. Table S6: Product selectivities (%) for the different packing materials and sizes and for the non-packed reactor. The highest selectivities for each component are highlighted.

Author Contributions

Data curation, I.M.; Formal analysis, I.M.; Investigation, I.M. and Y.U.; Supervision, A.B. and V.M.; Writing–original draft, I.M.; Writing–review & editing, A.B. and V.M.

Funding

The authors acknowledge financial support from the Institute for the Promotion of Innovation by Science and Technology in Flanders (IWT Flanders) for I. Michielsen (IWT-141093), from an IOF-SBO project from the University of Antwerp, from the Fund for Scientific Research (FWO; grant number: G.0254.14 N) and from the European Fund for Regional Development through the cross-border collaborative Interreg V program Flanders-the Netherlands (project EnOp).

Acknowledgments

We would also like to thank the Judith Pype and Bart Michielsen from VITO (Vlaamse Instelling voor Technologisch Onderzoek—Flemish institute for technological research) for the shaping of the α-Al2O3 beads, the characterisation thereof and the Hg porosimetry and XRD measurements and Jeremy Mertens and François Reniers from ULB for the profilometry measurements.

Conflicts of Interest

The authors declare no conflict of interest

References

  1. Snoeckx, R.; Bogaerts, A. Plasma technology—A novel solution for CO2 conversion? Chem. Soc. Rev. 2017, 46, 5805–5863. [Google Scholar] [CrossRef] [PubMed]
  2. Song, C. Global challenges and strategies for control, conversion and utilization of CO2 for sustainable development involving energy, catalysis, adsorption and chemical processing. Catal. Today 2006, 115, 2–32. [Google Scholar] [CrossRef]
  3. Chung, W.C.; Chang, M.B. Review of catalysis and plasma performance on dry reforming of CH4 and possible synergistic effects. Renew. Sustain. Energy Rev. 2016, 62, 13–31. [Google Scholar] [CrossRef]
  4. Usman, M.; Wan Daud, W.M.A.; Abbas, H.F. Dry reforming of methane: Influence of process parameters—A review. Renew. Sustain. Energy Rev. 2015, 45, 710–744. [Google Scholar] [CrossRef]
  5. Jarvis, S.M.; Samsatli, S. Technologies and infrastructures underpinning future CO2 value chains: A comprehensive review and comparative analysis. Renew. Sustain. Energy Rev. 2018, 85, 46–68. [Google Scholar] [CrossRef]
  6. Chung, W.; Pan, K.; Lee, H.; Chang, M. Dry Reforming of Methane with Dielectric Barrier Discharge and Ferroelectric Packed-Bed Reactors. Energy Fuels 2014, 28, 7621–7631. [Google Scholar] [CrossRef]
  7. Arkatova, L.A. The deposition of coke during carbon dioxide reforming of methane over intermetallides. Catal. Today 2010, 157, 170–176. [Google Scholar] [CrossRef]
  8. Pakhare, D.; Spivey, J. A review of dry (CO2) reforming of methane over noble metal catalysts. Chem. Soc. Rev. 2014, 43, 7813–7837. [Google Scholar] [CrossRef] [PubMed]
  9. Samukawa, S.; Hori, M.; Rauf, S.; Tachibana, K.; Bruggeman, P.; Kroesen, G.; Whitehead, J.C.; Murphy, A.B.; Gutsol, A.F.; Starikovskaia, S.; et al. The 2012 Plasma Roadmap. J. Phys. D Appl. Phys. 2012, 45, 253001. [Google Scholar] [CrossRef]
  10. Lavoie, J.-M. Review on dry reforming of methane, a potentially more environmentally-friendly approach to the increasing natural gas exploitation. Front. Chem. 2014, 2, 81. [Google Scholar] [CrossRef] [PubMed]
  11. Kogelschatz, U. Dielectric-barrier discharges: Their history, discharge physics, and industrial applications. Plasma Chem. Plasma Process. 2003, 23, 1–46. [Google Scholar] [CrossRef]
  12. Wang, L.; Yi, Y.; Wu, C.; Guo, H.; Tu, X. One-Step Reforming of CO2 and CH4 into High-Value Liquid Chemicals and Fuels at Room Temperature by Plasma-Driven Catalysis. Angew. Chem. Int. Ed. 2017, 56, 13679–13683. [Google Scholar] [CrossRef] [PubMed]
  13. Neyts, E.C.; Bogaerts, A. Understanding plasma catalysis through modelling and simulation—A review. J. Phys. D Appl. Phys. 2014, 47, 224010. [Google Scholar] [CrossRef]
  14. Aerts, R.; Somers, W.; Bogaerts, A. Carbon Dioxide Splitting in a Dielectric Barrier Discharge Plasma: A Combined Experimental and Computational Study. ChemSusChem 2015, 8, 702–716. [Google Scholar] [CrossRef] [PubMed]
  15. Paulussen, S.; Verheyde, B.; Tu, X.; De Bie, C.; Martens, T.; Petrovic, D.; Bogaerts, A.; Sels, B. Conversion of carbon dioxide to value-added chemicals in atmospheric pressure dielectric barrier discharges. Plasma Sources Sci. Technol. 2010, 19, 034015. [Google Scholar] [CrossRef]
  16. Ozkan, A.; Bogaerts, A.; Reniers, F. Routes to increase the conversion and the energy efficiency in the splitting of CO2 by a dielectric barrier discharge. J. Phys. D Appl. Phys. 2017, 50, 084004. [Google Scholar] [CrossRef]
  17. Zhang, A.-J.; Zhu, A.-M.; Guo, J.; Xu, Y.; Shi, C. Conversion of greenhouse gases into syngas via combined effects of discharge activation and catalysis. Chem. Eng. J. 2010, 156, 601–606. [Google Scholar] [CrossRef]
  18. Zheng, X.; Tan, S.; Dong, L.; Li, S.; Chen, H. Plasma-assisted catalytic dry reforming of methane: Highly catalytic performance of nickel ferrite nanoparticles embedded in silica. J. Power Sources 2015, 274, 286–294. [Google Scholar] [CrossRef]
  19. Zheng, X.; Tan, S.; Dong, L.; Li, S.; Chen, H. LaNiO3@SiO2 core–shell nano-particles for the dry reforming of CH4 in the dielectric barrier discharge plasma. Int. J. Hydrog. Energy 2014, 39, 11360–11367. [Google Scholar] [CrossRef]
  20. Karuppiah, J.; Manoj Kumar Reddy, P.; Linga Reddy, E.; Subrahmanyam, C. Catalytic non-thermal plasma reactor for decomposition of dilute chlorobenzene. Plasma Process. Polym. 2013, 10, 1074–1080. [Google Scholar] [CrossRef]
  21. Krawczyk, K.; Młotek, M.; Ulejczyk, B.; Schmidt-Szałowski, K. Methane conversion with carbon dioxide in plasma-catalytic system. Fuel 2014, 117, 608–617. [Google Scholar] [CrossRef]
  22. Wang, Q.; Cheng, Y.; Jin, Y. Dry reforming of methane in an atmospheric pressure plasma fluidized bed with Ni/γ-Al2O3 catalyst. Catal. Today 2009, 148, 275–282. [Google Scholar] [CrossRef]
  23. Zeng, Y.; Zhu, X.; Mei, D.; Ashford, B.; Tu, X. Plasma-catalytic dry reforming of methane over-Al2O3 supported metal catalysts. Catal. Today 2015, 256, 80–87. [Google Scholar] [CrossRef]
  24. Zhang, K.; Mukhriza, T.; Liu, X.; Greco, P.P.; Chiremba, E. A study on CO2 and CH4 conversion to synthesis gas and higher hydrocarbons by the combination of catalysts and dielectric-barrier discharges. Appl. Catal. A Gen. 2015, 502, 138–149. [Google Scholar] [CrossRef]
  25. Tu, X.; Gallon, H.J.; Twigg, M.V.; Gorry, P.A.; Whitehead, J.C. Dry reforming of methane over a Ni/Al2O3 catalyst in a coaxial dielectric barrier discharge reactor. J. Phys. D Appl. Phys. 2011, 44, 274007. [Google Scholar] [CrossRef]
  26. Sentek, J.; Krawczyk, K.; Młotek, M.; Kalczewska, M.; Kroker, T.; Kolb, T.; Schenk, A.; Gericke, K.-H.; Schmidt-Szałowski, K. Plasma-catalytic methane conversion with carbon dioxide in dielectric barrier discharges. Appl. Catal. B Environ. 2010, 94, 19–26. [Google Scholar] [CrossRef]
  27. Pham, M.H.; Goujard, V.; Tatibouët, J.M.; Batiot-Dupeyrat, C. Activation of methane and carbon dioxide in a dielectric-barrier discharge-plasma reactor to produce hydrocarbons-Influence of La2O3/γ-Al2O3 catalyst. Catal. Today 2011, 171, 67–71. [Google Scholar] [CrossRef]
  28. Gallon, H.J.; Tu, X.; Whitehead, J.C. Effects of Reactor Packing Materials on H2 Production by CO2 Reforming of CH4 in a Dielectric Barrier Discharge. Plasma Process. Polym. 2012, 9, 90–97. [Google Scholar] [CrossRef]
  29. Song, H.K.; Choi, J.-W.; Yue, S.H.; Lee, H.; Na, B.-K.; Songu, H.K. Synthesis gas production via dielectric barrier discharge over Ni/γ-Al2O3 catalyst. Catal. Today 2004, 89, 27–33. [Google Scholar] [CrossRef]
  30. Tu, X.; Whitehead, J.C. Plasma-catalytic dry reforming of methane in an atmospheric dielectric barrier discharge: Understanding the synergistic effect at low temperature. Appl. Catal. B Environ. 2012, 125, 439–448. [Google Scholar] [CrossRef]
  31. Wang, Q.; Yan, B.; Jin, Y.; Cheng, Y. Dry Reforming of Methane in a Dielectric Barrier Discharge Reactor with Ni/Al2O3 Catalyst: Interaction of Catalyst and Plasma. Energy Fuels 2009, 23, 4196–4201. [Google Scholar] [CrossRef]
  32. Michielsen, I.; Uytdenhouwen, Y.; Pype, J.; Michielsen, B.; Mertens, J.; Reniers, F.; Meynen, V.; Bogaerts, A. CO2 dissociation in a packed bed DBD reactor: First steps towards a better understanding of plasma catalysis. Chem. Eng. J. 2017, 326, 477–488. [Google Scholar] [CrossRef]
  33. Vandenbroucke, A.M.; Morent, R.; De Geyter, N.; Leys, C. Non-thermal plasmas for non-catalytic and catalytic VOC abatement. J. Hazard. Mater. 2011, 195, 30–54. [Google Scholar] [CrossRef] [PubMed]
  34. Futamura, S.; Zhang, A.; Einaga, H.; Kabashima, H. Involvement of catalyst materials in nonthermal plasma chemical processing of hazardous air pollutants. Catal. Today 2002, 72, 259–265. [Google Scholar] [CrossRef]
  35. Kim, H.-H. Nonthermal Plasma Processing for Air-Pollution Control: A Historical Review, Current Issues, and Future Prospects. Plasma Process. Polym. 2004, 1, 91–110. [Google Scholar] [CrossRef]
  36. Subrahmanyam, C.; Magureanu, M.; Renken, A.; Kiwi-Minsker, L. Catalytic abatement of volatile organic compounds assisted by non-thermal plasma. Appl. Catal. B Environ. 2006, 65, 150–156. [Google Scholar] [CrossRef] [Green Version]
  37. Kim, H.H.; Ogata, A. Interaction of Nonthermal Plasma with Catalyst for the Air Pollution Control. Int. J. Plasma Environ. Sci. Technol. 2012, 6, 43–48. [Google Scholar]
  38. Francke, K.-P.; Miessner, H.; Rudolph, R. Plasmacatalytic processes for environmental problems. Catal. Today 2000, 59, 411–416. [Google Scholar] [CrossRef]
  39. Pasquiers, S. Removal of pollutants by plasma catalytic processes. Eur. Phys. J. Appl. Phys 2004, 28, 319–324. [Google Scholar] [CrossRef]
  40. Guaitella, O.; Thevenet, F.; Puzenat, E.; Guillard, C.; Rousseau, A. C2H2 oxidation by plasma/TiO2 combination: Influence of the porosity, and photocatalytic mechanisms under plasma exposure. Appl. Catal. B Environ. 2008, 80, 296–305. [Google Scholar] [CrossRef]
  41. Van Durme, J.; Dewulf, J.; Leys, C.; Van Langenhove, H. Combining non-thermal plasma with heterogeneous catalysis in waste gas treatment: A review. Appl. Catal. B Environ. 2008, 78, 324–333. [Google Scholar] [CrossRef] [Green Version]
  42. Aerts, R.; Somers, W.; Bogaerts, A. A detailed description of the CO2 splitting by dielectric barrier discharges. ChemSusChem 2015, 8, 702–716. [Google Scholar] [CrossRef] [PubMed]
  43. Yu, Q.; Kong, M.; Liu, T.; Fei, J.; Zheng, X. Characteristics of the Decomposition of CO2 in a Dielectric Packed-Bed Plasma Reactor. Plasma Chem. Plasma Process. 2012, 32, 153–163. [Google Scholar] [CrossRef]
  44. Mei, D.; Zhu, X.; He, Y.-L.Y.Y.; Yan, J.D.; Tu, X. Plasma-assisted conversion of CO2 in a dielectric barrier discharge reactor: Understanding the effect of packing materials. Plasma Sources Sci. Technol. 2015, 24, 15011. [Google Scholar] [CrossRef]
  45. Ramakers, M.; Michielsen, I.; Aerts, R.; Meynen, V.; Bogaerts, A. Effect of argon or helium on the CO2 conversion in a dielectric barrier discharge. Plasma Process. Polym. 2015, 12, 755–763. [Google Scholar] [CrossRef]
  46. Snoeckx, R.; Aerts, R.; Tu, X.; Bogaerts, A. Plasma-Based Dry Reforming: A Computational Study Ranging From Nanoseconds to Seconds Timescale. J. Phys. Chem. 2013, 117, 4957–4970. [Google Scholar] [CrossRef]
  47. Atkins, P.; Jones, L. Chemical Principles: The Quest for Insight, 4th ed.; Craig Bleyer: New York, NY, USA, 2008. [Google Scholar]
  48. Wang, W.; Berthelot, A.; Zhang, Q.; Bogaerts, A. Modelling of plasma-based dry reforming: How do uncertainties in the input data affect the calculation results? J. Phys. D Appl. Phys. 2018, 51, 204003. [Google Scholar] [CrossRef]
  49. Berthelot, A.; Bogaerts, A. Modeling of CO2 plasma: Effect of uncertainties in the plasma chemistry. Plasma Sources Sci. Technol. 2017, 26, 115002. [Google Scholar] [CrossRef]
  50. De Bie, C.; Van Dijk, J.; Bogaerts, A. The Dominant Pathways for the Conversion of Methane into Oxygenates and Syngas in an Atmospheric Pressure Dielectric Barrier Discharge. J. Phys. Chem. C 2015, 119, 22331–22350. [Google Scholar] [CrossRef]
  51. Wang, W.; Kim, H.H.; Van Laer, K.; Bogaerts, A. Streamer propagation in a packed bed plasma reactor for plasma catalysis applications. Chem. Eng. J. 2018, 334, 2467–2479. [Google Scholar] [CrossRef]
  52. Van Laer, K.; Bogaerts, A. Influence of Gap Size and Dielectric Constant of the Packing Material on the Plasma Behaviour in a Packed Bed DBD Reactor: A Fluid Modelling Study. Plasma Process. Polym. 2017, 14, e1600129. [Google Scholar] [CrossRef]
  53. Van Laer, K.; Bogaerts, A. How bead size and dielectric constant affect the plasma behaviour in a packed bed plasma reactor: A modelling study. Plasma Sources Sci. Technol. 2017, 26, 085007. [Google Scholar] [CrossRef]
  54. Butterworth, T.D. The Effects of Particle Size on CO2 reduction in Packed Bed Dielectric Barrier Discharge Plasma Reactors. Ph.D. Thesis, University of Sheffield, Sheffield, UK, 2015. [Google Scholar]
  55. Aerts, R.; Snoeckx, R.; Bogaerts, A. In-Situ Chemical Trapping of Oxygen in the Splitting of Carbon Dioxide by Plasma. Plasma Process. Polym. 2014, 11, 985–992. [Google Scholar] [CrossRef]
  56. Snoeckx, R.; Ozkan, A.; Reniers, F.; Bogaerts, A. The Quest for Value-Added Products from Carbon Dioxide and Water in a Dielectric Barrier Discharge: A Chemical Kinetics Study. ChemSusChem 2017, 10, 409–424. [Google Scholar] [CrossRef] [PubMed]
  57. Uytdenhouwen, Y.; Van Alphen, S.; Michielsen, I.; Meynen, V.; Cool, P.; Bogaerts, A. A packed-bed DBD micro plasma reactor for CO2 dissociation: Does size matter? Chem. Eng. J. 2018, 348, 557–568. [Google Scholar] [CrossRef]
  58. Whitehead, J.C. Plasma–catalysis: The known knowns, the known unknowns and the unknown unknowns. J. Phys. D Appl. Phys. 2016, 49, 243001. [Google Scholar] [CrossRef]
  59. Pinhão, N.; Moura, A.; Branco, J.B.; Neves, J. Influence of gas expansion on process parameters in non-thermal plasma plug-flow reactors: A study applied to dry reforming of methane. Int. J. Hydrog. Energy 2016, 41, 9245–9255. [Google Scholar] [CrossRef]
  60. Snoeckx, R.; Heijkers, S.; Van Wesenbeeck, K.; Lenaerts, S.; Bogaerts, A. CO2 conversion in a dielectric barrier discharge plasma: N2 in the mix as a helping hand or problematic impurity? Energy Environ. Sci. 2016, 9, 30–39. [Google Scholar] [CrossRef]
  61. Dullien, F.A. Porous Media-Fluid Transport and Pore Structure; Academic Press: Cambridge, MA, USA, 1991; ISBN 9780122236518. [Google Scholar]
Figure 1. CO2 conversion for different sphere sizes and materials, compared to the results for the non-packed reactor, at the same flow rate (50 mL/min) and at the same residence time (5.52 s; flow rate of 192 mL/min), all at 23 kHz frequency, in a 4.5 mm gap and a set 100 Watt power for both DRM (dry reforming of methane) and pure CO2 splitting. The bars with pattern fill show the results for DRM, whereas the full bars show the correct results for CO2 splitting, obtained from our previous work [32].
Catalysts 09 00051 g001
Figure 2. CH4 conversion for different sphere sizes and materials, compared to the results for the non-packed reactor, at the same flow rate (50 mL/min) and at the same residence time (5.52 s; flow rate of 192 mL/min).
Catalysts 09 00051 g002
Figure 3. Total conversion for different sphere sizes and materials, compared to the results for the non-packed reactor, at the same flow rate (50 mL/min) and at the same residence time (5.52 s; flow rate of 192 mL/min).
Catalysts 09 00051 g003
Figure 4. Calculated CH4 and CO2 conversion as a function of residence time in a non-packed DBD reactor, adopted from modelling. Adopted with permission from ref. [46]. Copyright 2018 American Chemical Society.
Catalysts 09 00051 g004
Figure 5. Comparison of the CO2, CH4 and total conversion between γ-Al2O3 and α-Al2O3 (2.0–2.24 mm spheres).
Catalysts 09 00051 g005
Figure 6. Carbon, Hydrogen and oxygen balance for different sphere sizes and materials, as well as the non-packed reactor.
Catalysts 09 00051 g006
Figure 7. Product fractions for different sphere sizes and materials, as well as for the non-packed reactor.
Catalysts 09 00051 g007
Table 1. Summary of a selection of literature for CO2 splitting in a non-packed and a packed DBD reactor.
StudyReactorOperating ConditionsImplementing Packing and/or CatalystsConclusionHighest ConversionRef.
Gap (mm)Power (Watt)Flow (mL/min)Reactor Volume (cm3)FrequencySEI (kJ/L)Packing/CatalystShapePacking Size
CO2 splitting/non-packed1.57015021.95–65 kHz28 No influence of frequency10%[42]
2100–20050–50013.5610–90 kHz12–240Conversion Catalysts 09 00051 i001 when flow rate Catalysts 09 00051 i002, Tgas Catalysts 09 00051 i001, P Catalysts 09 00051 i001. Best frequency depends on power30%[15]
210–9750–200015.116.2–28.6 kHz0.3–116Conversion Catalysts 09 00051 i001 when flow rate Catalysts 09 00051 i002, barrier thickness Catalysts 09 00051 i002, frequency Catalysts 09 00051 i002 and power Catalysts 09 00051 i00135%[16]
421.6–35.34030.1713 kHz32.4–53Conversion Catalysts 09 00051 i001 when power Catalysts 09 00051 i001 and discharge length Catalysts 09 00051 i001
Cokes: small on inner electrode
13%[43]
4.5, 3.5, 2.5 or 2605017.6726.5 kHz72Conversion Catalysts 09 00051 i001 when flow rate Catalysts 09 00051 i00212%[32]
CO2 splitting/packed421.6–35.34030.1713 kHz32.4–53Silica gelBeads20–40 meshsilica gel < α-Al2O3 < quartz ≈ γ-Al2O3 < CaTiO3
Cokes: limited on inner electrode
14%[43]
QuartzPellets with rigid edges20–40 meshsilica gel < α-Al2O3 < quartz ≈ γ-Al2O3 < CaTiO3
Cokes: limited on inner electrode
16%
γ-Al2O3Beads20–40 meshsilica gel < α-Al2O3 < quartz ≈ γ-Al2O3 < CaTiO3
Cokes: limited on inner electrode
16%
α-Al2O3Beads20–40 meshsilica gel < α-Al2O3 < quartz ≈ γ-Al2O3 < CaTiO3
Cokes: limited on inner electrode
15%
CaTiO3Beads20–40 meshsilica gel < α-Al2O3 < quartz ≈ γ-Al2O3 < CaTiO3
Cokes: limited on inner electrode
20.5%
320–505010.19 kHz24–60GlassBeads1 mmGlass < BaTiO322% (16% without packing)[44]
BaTiO3Beads1 mmGlass < BaTiO328% (16% without packing)
4.5, 3.5, 2.5 or 2605017.6726.5 kHz72Glass woolBeads1.25–2.24 mmConversion Catalysts 09 00051 i001 when # contact points Catalysts 09 00051 i001, void space volumes Catalysts 09 00051 i001 and bead/gap size ratio Catalysts 09 00051 i001. Impact of the packing material (chemistry and physical), also influenced by setup10%[32]
Quartz woolBeads1.25–2.24 mmConversion Catalysts 09 00051 i001 when # contact points Catalysts 09 00051 i001, void space volumes Catalysts 09 00051 i001 and bead/gap size ratio Catalysts 09 00051 i001. Impact of the packing material (chemistry and physical), also influenced by setup10%
SiO2Beads1.25–2.24 mmConversion Catalysts 09 00051 i001 when # contact points Catalysts 09 00051 i001, void space volumes Catalysts 09 00051 i001 and bead/gap size ratio Catalysts 09 00051 i001. Impact of the packing material (chemistry and physical), also influenced by setup16%
ZrO2Beads1.25–2.24 mmConversion Catalysts 09 00051 i001 when # contact points Catalysts 09 00051 i001, void space volumes Catalysts 09 00051 i001 and bead/gap size ratio Catalysts 09 00051 i001. Impact of the packing material (chemistry and physical), also influenced by setup19%
α-Al2O3Beads1.25–2.24 mmConversion Catalysts 09 00051 i001 when # contact points Catalysts 09 00051 i001, void space volumes Catalysts 09 00051 i001 and bead/gap size ratio Catalysts 09 00051 i001. Impact of the packing material (chemistry and physical), also influenced by setup17%
BaTiO3Beads1.25–2.24 mmConversion Catalysts 09 00051 i001 when # contact points Catalysts 09 00051 i001, void space volumes Catalysts 09 00051 i001 and bead/gap size ratio Catalysts 09 00051 i001. Impact of the packing material (chemistry and physical), also influenced by setup26%
Table 2. Summary of a selection of literature for DRM in a non-packed and a packed DBD reactor.
StudyReactorOperating ConditionsImplementing Packing and/or CatalystsSelectivityConclusionHighest ConversionRef.
Gap (mm)Power (Watt)Flow (mL/min)Reactor volume (cm3)FrequencyRatio CO2/CH4TSEI (kJ/L)Packing/CatalystShapePacking sizeHighest achieved selectivity per component
DRM/ non-packed330–6025–10011.430–40 kHz1/18–144 45% CO, 29% H2, 5% C2H2/C2H4, 22% C2H6, 2% C3H6, 12% C3H8 (estimation)Conversion Catalysts 09 00051 i001 when flow rate Catalysts 09 00051 i002 and P Catalysts 09 00051 i00150.4% CH4, 30.5% CO2[30]
125–7530–754.430 kHz0.66–3/20–15076% CO, 57% H2Conversion Catalysts 09 00051 i001 when flow rate Catalysts 09 00051 i002, P Catalysts 09 00051 i001. CH4 conversion Catalysts 09 00051 i002, CO2 conversion ≈ when ratio Catalysts 09 00051 i00259.7% CH4, 36.9% CO2[17]
180–13010–404.720 kHz0.25–1/120–78073.8% CO, 65.9% H2, 18.0% C2, 10.2% C3, 6.2% C4Conversion Catalysts 09 00051 i001 when flow rate Catalysts 09 00051 i002, P Catalysts 09 00051 i001. CH4 conversion Catalysts 09 00051 i002, CO2 conversion ≈ when ratio Catalysts 09 00051 i00264% CH4, 34% CO2[29]
310402.1212 kHz4/1520% CO, 34% H2, <1% C2H2, <1% C2H4, 12% C2H6, 1% C3H8, <1% C4H10, 11.9% methanol, 11.9% ethanol, 33.7% acetic acid, 1.6% acetone, 0% HCHOImpact depends on catalyst, both Catalysts 09 00051 i001 and Catalysts 09 00051 i002 conversion and differs from pure packing18% CH4, 15% CO2[12]
DRM/ packed330–6025–10011.430–40 kHz1/18–14410 wt% Ni@γ-Al2O3Pellets0.5–1.7 mm55% CO, 33% H2, 10% C2H2/C2H4, 47% C2H6, 2% C3H6, 25% C3H8 (estimation)Conversion Catalysts 09 00051 i001 when pellet size Catalysts 09 00051 i001, quartz wool is best, impact packing on selectivity40.2% CH4, 30.5% CO2[30]
125–7530–754.430 kHz1450 °C20–15012% Ni/γ-Al2O3??43% CO, 53% H212% Cu–12% Ni/γ-Al2O3 performs best, Ni content influences CO selectivity30% CH4, 24% CO2[17]
12% Cu/γ-Al2O3??50% CO, 31% H212% Cu–12% Ni/γ-Al2O3 performs best, Ni content influences CO selectivity7% CH4, 5% CO2
1%Cu-12% Ni/γ-Al2O3??45% CO, 51% H212% Cu–12% Ni/γ-Al2O3 performs best, Ni content influences CO selectivity33% CH4, 25% CO2
DRM/ packed5%Cu-12% Ni/γ-Al2O3??47% CO, 54% H212% Cu–12% Ni/γ-Al2O3 performs best, Ni content influences CO selectivity37% CH4, 24% CO2
12%Cu-12% Ni/γ-Al2O3??75% CO, 56% H212% Cu–12% Ni/γ-Al2O3 performs best, Ni content influences CO selectivity69% CH4, 75% CO2
16%Cu-12% Ni/γ-Al2O3??64% CO, 57% H212% Cu–12% Ni/γ-Al2O3 performs best, Ni content influences CO selectivity43% CH4, 47% CO2
5% Ni-12%Cu/γ-Al2O3??75% CO, 56% H212% Cu–12% Ni/γ-Al2O3 performs best, Ni content influences CO selectivity43% CH4, 45% CO2
16% Ni-12%Cu/γ-Al2O3??71% CO, 58% H212% Cu–12% Ni/γ-Al2O3 performs best, Ni content influences CO selectivity57% CH4, 57% CO2
20% Ni-12%Cu/γ-Al2O3??62% CO, 58% H212% Cu–12% Ni/γ-Al2O3 performs best, Ni content influences CO selectivity35% CH4, 32% CO2
1130304.720 kHz1/260γ-Al2O3Crushed flakes10–20 mesh49.2% CO, 51% H2, 9.7% C2, 5.5% C3, 3% C4Packing: CO2 conversion Catalysts 09 00051 i001, CH4 conversion Catalysts 09 00051 i002. After activation: conversion Catalysts 09 00051 i001, selectivity Catalysts 09 00051 i002 for H2 and C257.6% CH4, 30.9% CO2[29]
2 wt% Ni @ γ-Al2O3Crushed flakes10–20 mesh60.6% CO, 52.3% H2, 9.8% C2, 5.9% C3, 3.2% C4Packing: CO2 conversion Catalysts 09 00051 i001, CH4 conversion Catalysts 09 00051 i002. After activation: conversion Catalysts 09 00051 i001, selectivity Catalysts 09 00051 i002 for H2 and C255.4% CH4, 32.7% CO2
5 wt% Ni @ γ-Al2O3Crushed flakes10–20 mesh60.9% CO, 51.9% H2, 10.1% C2, 5.9% C3, 3.2% C4Packing: CO2 conversion Catalysts 09 00051 i001, CH4 conversion Catalysts 09 00051 i002. After activation: conversion Catalysts 09 00051 i001, selectivity Catalysts 09 00051 i002 for H2 and C255.7% CH4, 33.5% CO2
7 wt% Ni @ γ-Al2O3Crushed flakes10–20 mesh63.9%CO, 53.5% H2, 10.6% C2, 6.1% C3, 3.6% C4Packing: CO2 conversion Catalysts 09 00051 i001, CH4 conversion Catalysts 09 00051 i002. After activation: conversion Catalysts 09 00051 i001, selectivity Catalysts 09 00051 i002 for H2 and C255.5% CH4, 32.6% CO2
10 wt% Ni @ γ-Al2O3Crushed flakes10–20 mesh61.4% CO, 53% H2, 10.6% C2, 6.2% C3, 3.4% C4Packing: CO2 conversion Catalysts 09 00051 i001, CH4 conversion Catalysts 09 00051 i002. After activation: conversion Catalysts 09 00051 i001, selectivity Catalysts 09 00051 i002 for H2 and C255.2% CH4, 32.7% CO2
310402.129 kHz1/15γ-Al2O3??23% CO, 55% H2, <1% C2H2, <1% C2H4, 20% C2H6, 2% C3H8, <1% C4H10, 13% methanol, 9% ethanol, 20% acetic acid, 2% acetone, 0% HCHOImpact depends on catalyst, both Catalysts 09 00051 i001 and Catalysts 09 00051 i002 conversion and differs from pure packing15% CH4, 12.5% CO2[12]
DRM/packedCu/γ-Al2O4??14% CO, 35% H2, <1% C2H2, <1% C2H4, 15% C2H6, 2% C3H8, <1% C4H10, 11% methanol, 11% ethanol, 42% acetic acid, 2% acetone, 0% HCHOImpact depends on catalyst, both Catalysts 09 00051 i001 and Catalysts 09 00051 i002 conversion and differs from pure packing16% CH4, 7.5% CO2
Au/γ-Al2O5??20% CO, 42% H2, <1% C2H2, <1% C2H4, 16% C2H6, 2% C3H8, <1% C4H10, 10% methanol, 10% ethanol, 30% acetic acid, 2% acetone, 5% HCHOImpact depends on catalyst, both Catalysts 09 00051 i001 and Catalysts 09 00051 i002 conversion and differs from pure packing16% CH4, 15% CO2
Pt/γ-Al2O6??20% CO, 40% H2, <1% C2H2, <1% C2H4, 17% C2H6, 2% C3H8, <1% C4H10, 10% methanol, 9% ethanol, 25% acetic acid, 2% acetone, 11% HCHOImpact depends on catalyst, both Catalysts 09 00051 i001 and Catalysts 09 00051 i002 conversion and differs from pure packing17.5% CH4, 13% CO2
5.94080?300 Hz0.07–1RT-600 °C30GlassBeads2 mm70% CO, 19.5% H2, 42.9% C2, 15% C3, 8.7% C4CH4 concentration Catalysts 09 00051 i001 = C2 Catalysts 09 00051 i001. Influence catalyst only > 200 ◦C, for CO2. Effect glass = Al2O325% CH4, 56.1% CO2[27]
γ-Al2O3Beads2 mm70% CO, 19.5% H2, 42.9% C2, 15% C3, 8.7% C4CH4 concentration Catalysts 09 00051 i001 = C2 Catalysts 09 00051 i001. Influence catalyst only > 200 ◦C, for CO2. Effect glass = Al2O325% CH4, 56.1% CO2
La2O3/γ-Al2O3Beads2 mm70% CO, 19.5% H2, 42.9% C2, 15% C3, 8.7% C4CH4 concentration Catalysts 09 00051 i001 = C2 Catalysts 09 00051 i001. Influence catalyst only > 200 ◦C, for CO2.25% CH4, 56.1% CO2
240–24040?5–20 kHz1/60–360Ni/γ-Al2O3Nano-particles100 nm86% CO, 73% H2NiFe2O4#SiO2 conversion and selectivity Catalysts 09 00051 i001, carbon deposit Catalysts 09 00051 i00264.6% CH4, 58% CO2[18]
Ni-Fe/γ-Al2O3Nano-particles100 nm87% CO, 74% H2NiFe2O4#SiO2 conversion and selectivity Catalysts 09 00051 i001, carbon deposit Catalysts 09 00051 i00268.7% CH4, 60.5% CO2
Ni-Fe/SiO2Nano-particles100 nm88% CO, 75% H2NiFe2O4#SiO2 conversion and selectivity Catalysts 09 00051 i001, carbon deposit Catalysts 09 00051 i00273.5% CH4, 62.7% CO2
NiFe2O4Nano-particles100 nm89% CO, 77% H2NiFe2O4#SiO2 conversion and selectivity Catalysts 09 00051 i001, carbon deposit Catalysts 09 00051 i00277.4% CH4, 67.1% CO2
NiFe2O4#SiO2Nano-particles100 nm90% CO, 81% H2NiFe2O4#SiO2 conversion and selectivity Catalysts 09 00051 i001, carbon deposit Catalysts 09 00051 i00280% CH4, 70.3% CO2
215040?5–100 kHz1/225Ni/SiO2??87% CO, 73% H2Packing: conversion Catalysts 09 00051 i001, selectivity Catalysts 09 00051 i00165% CH4, 52% CO2[19]
LaNiO3/SiO2??89% CO, 79% H2Packing: conversion Catalysts 09 00051 i001, selectivity Catalysts 09 00051 i00182% CH4, 69% CO2
DRM/packedLaNiO3??90% CO, 81% H2Packing: conversion Catalysts 09 00051 i001, selectivity Catalysts 09 00051 i00184% CH4, 72% CO2
LaNiO3@SiO2??92% CO, 84% H2Packing: conversion Catalysts 09 00051 i001, selectivity Catalysts 09 00051 i00188% CH4, 78% CO2
4.55050?30–40 kHz1/60Ni/Al2O3Pellets0.85–5 mm25% CO, 45% H2, 10% C2, 5% C3non-packed: filamentary discharge, packed: combination of surface discharges microdischarges, breakdown voltage and conversion Catalysts 09 00051 i00218% CH4, 13% CO2[25]
3.51.4–4.84027.250 Hz0.5–2/2–7.2Ni/Al2O3Pellets1 mm35% CO, 56% H2Conversion Catalysts 09 00051 i001 with packing. Conversion Catalysts 09 00051 i002 when ratio Catalysts 09 00051 i00252% CH4, 43% CO2 (38% CH4, 23% CO2 non-packed)[20]
31916.7–33.3?6 kHz1130–340 °C34–68Al2O3?1–2 mm19% CO, 24% H2, 0.6% C2H2/C2H4, 10% C2H6, 0.3% C3H6, 6% C3H8, 1.3% CH3OHConversion Catalysts 09 00051 i001 with packing52% CH4, 31% CO2[21]
Fe/Al2O3?1–2 mm14% CO, 21% H2, 1.3% C2H2/C2H4, 9% C2H6, 0.3% C3H6, 5% C3H8, 1% CH3OHNo effect of T or flow rate, Conversion Catalysts 09 00051 i001 with packing46% CH4, 20% CO2
zeolite NaY??10% CO, 21% H2, 1% C2H2/C2H4, 6% C2H6, 0.2% C3H6, 3% C3H8, 0% CH3OHNo effect of T or flow rate, Conversion Catalysts 09 00051 i001 with packing49% CH4, 19% CO2
zeolite Na ZSM-5??5% CO, 21% H2, 0.1% C2H2/C2H4, 9% C2H6, 0% C3H6, 5% C3H8, 0% CH3OHConversion Catalysts 09 00051 i001 with packing65% CH4, 40% CO2
415–605–50?1–100 kHz1325–525 °C18–720Ni/γ-Al2O3Grains70–100 mesh?Conversion Catalysts 09 00051 i001 with packing (fluidized bed)48% CH4, 40% CO2[22]
31916.7–33.3?5.7–6 kHz1–2120–290 °C34–68Al2O3?1–2 mm38% CO, 28% H2, 11% C2, 6% C3, 4% C4, 2% CH3OHConversion Catalysts 09 00051 i002 with packing55% CH4, 31% CO2[26]
Pd/Al2O3?1–2 mm40% CO, 29% H2, 15% C2, 5% C3, 3% C4, 1% CH3OHConversion Catalysts 09 00051 i002 with packing51% CH4, 28% CO2
Ag/Al2O3?1–2 mm38% CO, 29% H2, 10% C2, 5% C3, 4% C4, 2% CH3OHConversion Catalysts 09 00051 i002 with packing52% CH4, 30% CO2
4.510–405016.530–40 kHz1/12–48Quartz wool??28% CO, 22% H2, 1% C2H2/C2H4, 7% C2H6, 0.5% C3H6, 4% C3H8 (estimation)CH4 conversion: quartz wool> no packing > Al2O3 > zeolite 3A30% CH4, 12% CO2[28]
γ-Al2O3pellets500–850 μm32% CO, 18% H2, 2% C2H2/C2H4, 8% C2H6, 0.5% C3H6, 4% C3H8 (estimation)CH4 conversion: quartz wool> no packing > Al2O3 > zeolite 3A23% CH4, 8% CO2
DRM/ packedzeolite 3Abeads2 mm22% CO, 30% H2, 19% C2H2/C2H4, 8% C2H6, 1% C3H6, 6% C3H8 (estimation)CH4 conversion: quartz wool> no packing > Al2O3 > zeolite 3A7% CH4, 3% CO2
2.57.5–1525–20011.650 Hz0.11–9/2–36Ni/γ-Al2O3??37% CO, 33% H2, 22% C2H6Ni/γ-Al2O3 and Mn/γ-Al2O3: CH4 conversion Catalysts 09 00051 i001, yields CO and H2 Catalysts 09 00051 i001.19% CH4, 9% CO2[23]
Co/γ-Al2O4??42% CO, 43% H2, 30% C2H6Ni/γ-Al2O3 and Mn/γ-Al2O3: CH4 conversion Catalysts 09 00051 i001, yields CO and H2 Catalysts 09 00051 i00115% CH4, 8% CO2
Cu/γ-Al2O5??43% CO, 44% H2, 30% C2H6Ni/γ-Al2O3 and Mn/γ-Al2O3: CH4 conversion Catalysts 09 00051 i001, yields CO and H2 Catalysts 09 00051 i00114% CH4, 8% CO2
Mn/γ-Al2O6??35% CO, 34% H2, 24% C2H6Ni/γ-Al2O3 and Mn/γ-Al2O3: CH4 conversion Catalysts 09 00051 i001, yields CO and H2 Catalysts 09 00051 i00118% CH4, 10% CO2
7.546–10625–10010025 kHz1110 °C28–254BaTiO3Beads3 mm50% CO, 56% H2BaTiO3 size Catalysts 09 00051 i002 = conversions Catalysts 09 00051 i00233% CH4, 20% CO2[24]
Ni/SiO2Pellets2–3 mm56% CO, 54% H2Packing = conversions Catalysts 09 00051 i00220% CH4, 12% CO2
NiFe/SiO2Pellets2–3 mm54% CO, 56% H2Packing = conversions Catalysts 09 00051 i00128% CH4, 15% CO2
Table 3. Ratio of CH4 conversion over CO2 conversion and of the CO over H2 product fraction, for the different sphere sizes and materials, as well as for the non-packed reactor.
CH4 Conversion/CO2 ConversionCO/H2
1.25–1.4 mmZrO21.75.5
SiO21.74.8
α-Al2O31.59.5
BaTiO31.66.0
1.6–1.8 mmZrO21.85.9
SiO21.94.7
α-Al2O31.88.8
BaTiO31.96.3
2.0–2.24 mmZrO22.26.4
SiO21.25.3
α-Al2O31.59.0
BaTiO32.06.9
γ-Al2O32.38.3
Non-packed reactor50 mL/min1.97.9
192 mL/min2.07.2
Table 4. Product fractions for different sphere sizes and materials (the highest fractions for each component are highlighted).
COH2C2H6C2H4C2H2C3H8C2H6OC2H5OHCH2OCH3OHCO/H2 Ratio
EthaneEtheneEthynePropaneDMEEthanolFormaldehydeMethanol
Non-packed (50 mL/min)64.28.115.92.74.14.30.20.220.140.157.9
Non-packed (192 mL/min)53.57.423.82.85.64.00.70.271.630.287.2
ZrO21.25–1.458.810.811.61.611.92.90.90.330.870.365.5
1.6–1.860.410.212.21.510.93.10.70.330.420.315.9
2.0–2.2463.49.812.01.28.63.30.50.340.320.326.4
SiO21.25–1.449.310.311.72.720.32.90.90.241.440.264.8
1.6–1.851.911.011.82.018.03.30.80.280.510.264.7
2.0–2.2456.310.613.0 13.13.70.60.310.410.335.3
α-Al2O31.25–1.471.37.514.00.52.22.90.50.280.290.439.5
1.6–1.870.98.013.60.62.72.70.40.250.360.418.8
2.0–2.2472.28.012.90.52.22.90.40.290.290.469
BaTiO31.25–1.453.18.911.12.513.82.41.60.405.280.866
1.6–1.859.09.312.42.111.42.51.30.370.960.696.3
2.0–2.2461.48.913.71.89.02.80.80.330.590.576.9
γ-Al2O32.0–2.2470.18.515.40.62.00.40.03.00.00.08.3
Table 5. Operating conditions and materials used in this work.
ParameterSpecification
Gap (mm)4.5
Frequency (kHz)23.5
Power (Watt)100
Gas flow rate (mL/min)50 (or 192, for non-packed, to have the same residence time as in the packed reactor)
Type of materialNon-packed reactor versus SiO2, α-Al2O3, γ-Al2O3, ZrO2 and BaTiO3
Diameter spheres (mm) a1.25–1.4; 1.6–1.8; 2.0–2.24
CO2/CH4 ratio1/1
TemperatureAmbient (no external heating)
PressureAtmospheric (±1.2 atm)
a The γ-Al2O3 spheres were only tested for a diameter of 2.0–2.24 mm.

