Effect of Direct Reduction Treatment on Pt–Sn/Al2O3 Catalyst for Propane Dehydrogenation


1
Department of Chemical Engineering, RCCT, Hankyong National University, Anseong 456-749, Korea
2
R&D Business Lab., Hyosung Co., Hoge-dong, Dongan-ku, Anyang, Gyeounggi 431-080, Korea
3
Carbon Resources Institute, Korea Research Institute of Chemical Technology, 141, Gajeong-ro, Yuseong-gu, Daejeon 34114, Korea
4
Chemical and Environmental Technology Department, Inha Technical College, Inha-ro 100, Michuhol-gu, Incheon 22212, Korea
*
Author to whom correspondence should be addressed.
Catalysts 2019, 9(5), 446; https://doi.org/10.3390/catal9050446
Submission received: 19 April 2019
/
Revised: 8 May 2019
/
Accepted: 10 May 2019
/
Published: 14 May 2019
(This article belongs to the Special Issue Catalysis by Precious Metals, Past and Future)
Abstract
:Pt–Sn/Al2O3 catalysts were prepared by the direct reduction method at temperatures from 450 to 900 °C, denoted as an SR series (SR450 to SR900 according to reduction temperature). Direct reduction was performed immediately after catalyst drying without a calcination step. The activity of SR catalysts and a conventionally prepared (Cal600) catalyst were compared to evaluate its effect on direct reduction. Among the SR catalysts, SR550 showed overall higher conversion of propane and propylene selectivity than Cal600. The nano-sized dispersion of metals on SR550 was verified by transmission electron microscopy (TEM) observation. The phases of the bimetallic Pt–Sn alloys were examined by X-ray diffraction, TEM, and energy dispersive X-ray spectroscopy (EDS). Two characteristic peaks of Pt3Sn and PtSn alloys were observed in the XRD patterns, and these phases affected the catalytic performance. Moreover, EDS confirmed the formation of Pt3Sn and PtSn alloys on the catalyst surface. In terms of catalytic activity, the Pt3Sn alloy showed better performance than the PtSn alloy. Relationships between the intermetallic interactions and catalytic activity were investigated using X-ray photoelectron spectroscopy. Furthermore, qualitative analysis of coke formation was conducted after propane dehydrogenation using differential thermal analysis.
1. Introduction
Light olefins such as ethylene and propylene are important chemical intermediates, and demand for these materials has increased continuously [1,2]. Propane dehydrogenation (PDH) is used to produce propylene and has drawn interest from researchers. As the price of propane has fallen, propylene supply is also becoming important. In addition to the steam cracking of light olefins or naphtha, the dehydrogenation of light alkanes is also popular nowadays. Since the 2010s, increasing shale gas exploitation has motivated the development of dehydrogenation processes because significant amounts of propane and butane are generated (although the main product of shale gas is methane). The commercial PDH process uses Pt/Al2O3 catalysts or Cr/Al2O3 catalysts [3,4,5,6], but the demand for highly active catalysts is still growing. In this paper, we refer to Al2O3 without differentiating its α-, γ-, and θ-phases because the effect of the Al2O3 phase is not the objective of this study.
The Pt catalyst used in the PDH process is often impregnated with Sn as a co-catalyst [7,8,9,10,11]. Because the Pt–alkene interaction is stronger than the Pt–alkane interaction, unwanted side reactions such as hydrogenolysis and isomerization often occur [12]. When Sn is added to a Pt/Al2O3 catalyst, the Pt–alkene interaction is weakened and side reactions are suppressed [13,14,15,16,17]. Thus, Sn may enhance the propylene selectivity of the PDH reaction [18,19]. It has also been reported that Sn plays important roles in preventing Pt sintering, lowering the acidity of the oxide support, and removing the coke generated during the PDH process [4,20]. Previously, Pt–Sn alloys that use SiO2 as a support have been reported [10]. The formation of alloys and their catalytic activities depend upon the preparation conditions. Alloys of Pt–Sn have several forms, for example, PtSn, Pt3Sn, and PtSn2.
Deng and coworkers [10,21,22] used a direct reduction method to prepare PDH catalysts, which did not include a calcination step, unlike the conventional protocol for catalyst preparation involving drying, calcination, and reduction. They applied a hydrogen reduction stage at high temperature (800 °C) immediately after drying the catalyst without a calcination step. The direct reduction method yielded a catalyst with much higher performance than the conventionally calcined catalyst considering propane conversion, as well as propylene selectivity. They reported that the Pt3Sn alloy formed by direct reduction was responsible for the observed enhancement in catalytic activity. However, the role of the Pt3Sn alloy in promoting the PDH reaction is still controversial. For example, Vu [3] reported the reverse result, that is, the Pt3Sn alloy may cause catalytic deactivation, but the PtSn alloy provides active sites.
In our previous study [23], we reported that oxychlorination treatment was effective in regenerating Pt–Sn/Al2O3 catalysts after the PDH reaction, and we observed that catalysts containing Pt3Sn alloys after oxychlorination treatment showed improved PDH activity. When considering catalysts for commercial PDH applications, an Al2O3 support is more favorable than SiO2 because of its superior thermal and mechanical stabilities. Thus, the evaluation of the effects of the direct reduction of a catalyst on an Al2O3 support for the PDH reaction is of significant value. In this study, direct reduction was employed to prepare Pt–Sn/Al2O3 catalysts. The Pt–Sn/Al2O3 catalysts were prepared at temperatures from 450 to 900 °C, and the catalytic performance was evaluated in terms of propane conversion and propylene selectivity. As a reference, a calcined catalyst was also prepared. The catalysts characteristics were examined by X-ray diffraction (XRD), transmission electron microscopy (TEM), energy dispersive spectroscopy (EDS), thermogravimetric analysis (TGA)/differential thermal analysis (DTA), and X-ray photoelectron spectroscopy (XPS).
2. Results
2.1. Catalyst Performance
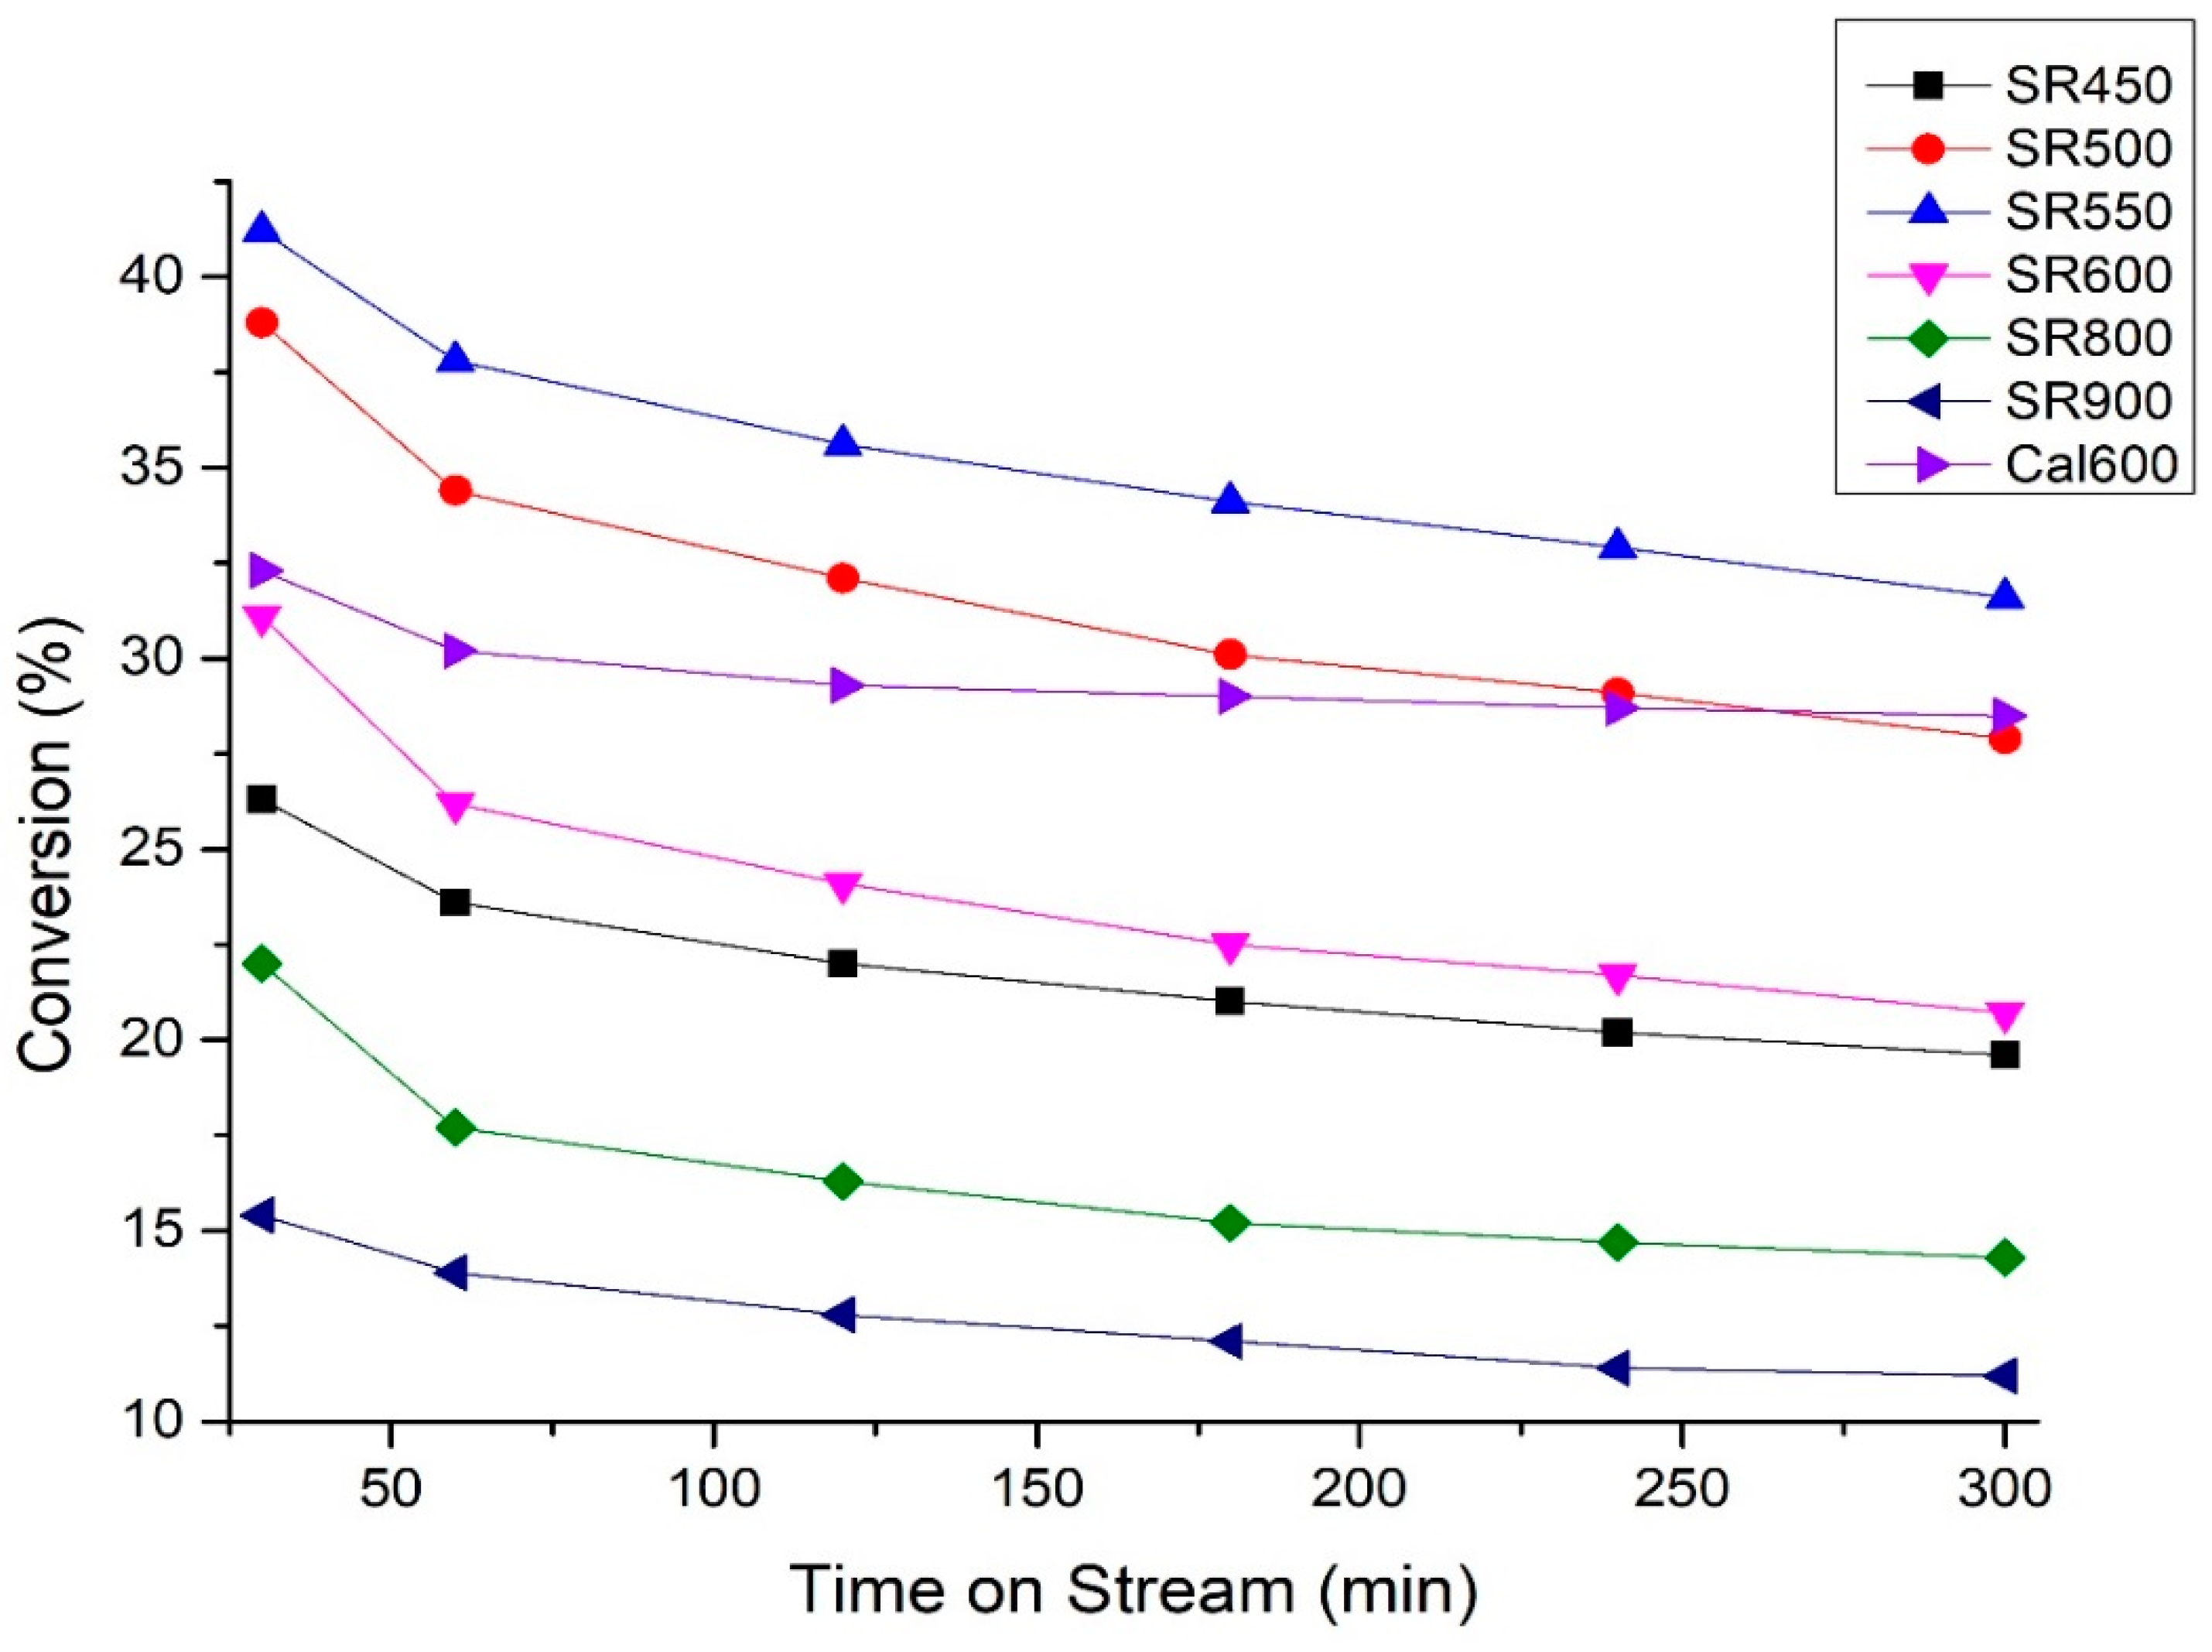
Figure 1 shows the propane conversion for the PDH reaction over the SR catalysts prepared by the direct reduction method, as well as that for the Cal600 catalyst prepared by conventional calcination. The SR550 catalyst showed the best performance in propane conversion over 5 h. The conversion of SR550 was initially 41.2%, but this gradually decreased to 31.6% over the 5 h period. The second best catalyst was SR500, which showed good performance for 4 h. The SR500 catalyst showed 38.8% initial conversion, which decreased to 29.1% after 5 h. Meanwhile, the reference catalyst, Cal600, had a conversion of 32.3%, making it the third best concerning initial conversion. The conversion subsequently decreased to 28.5%, making it the second best after 5 h. The remainder of the catalysts showed conversion values in the order of SR600 > SR450 > SR800 > SR900. Of the SR catalysts, higher conversion values were achieved after direct reduction for 500 and 550 °C. It was observed that reduction temperatures higher than 600 °C had a negative effect on the propane conversion.
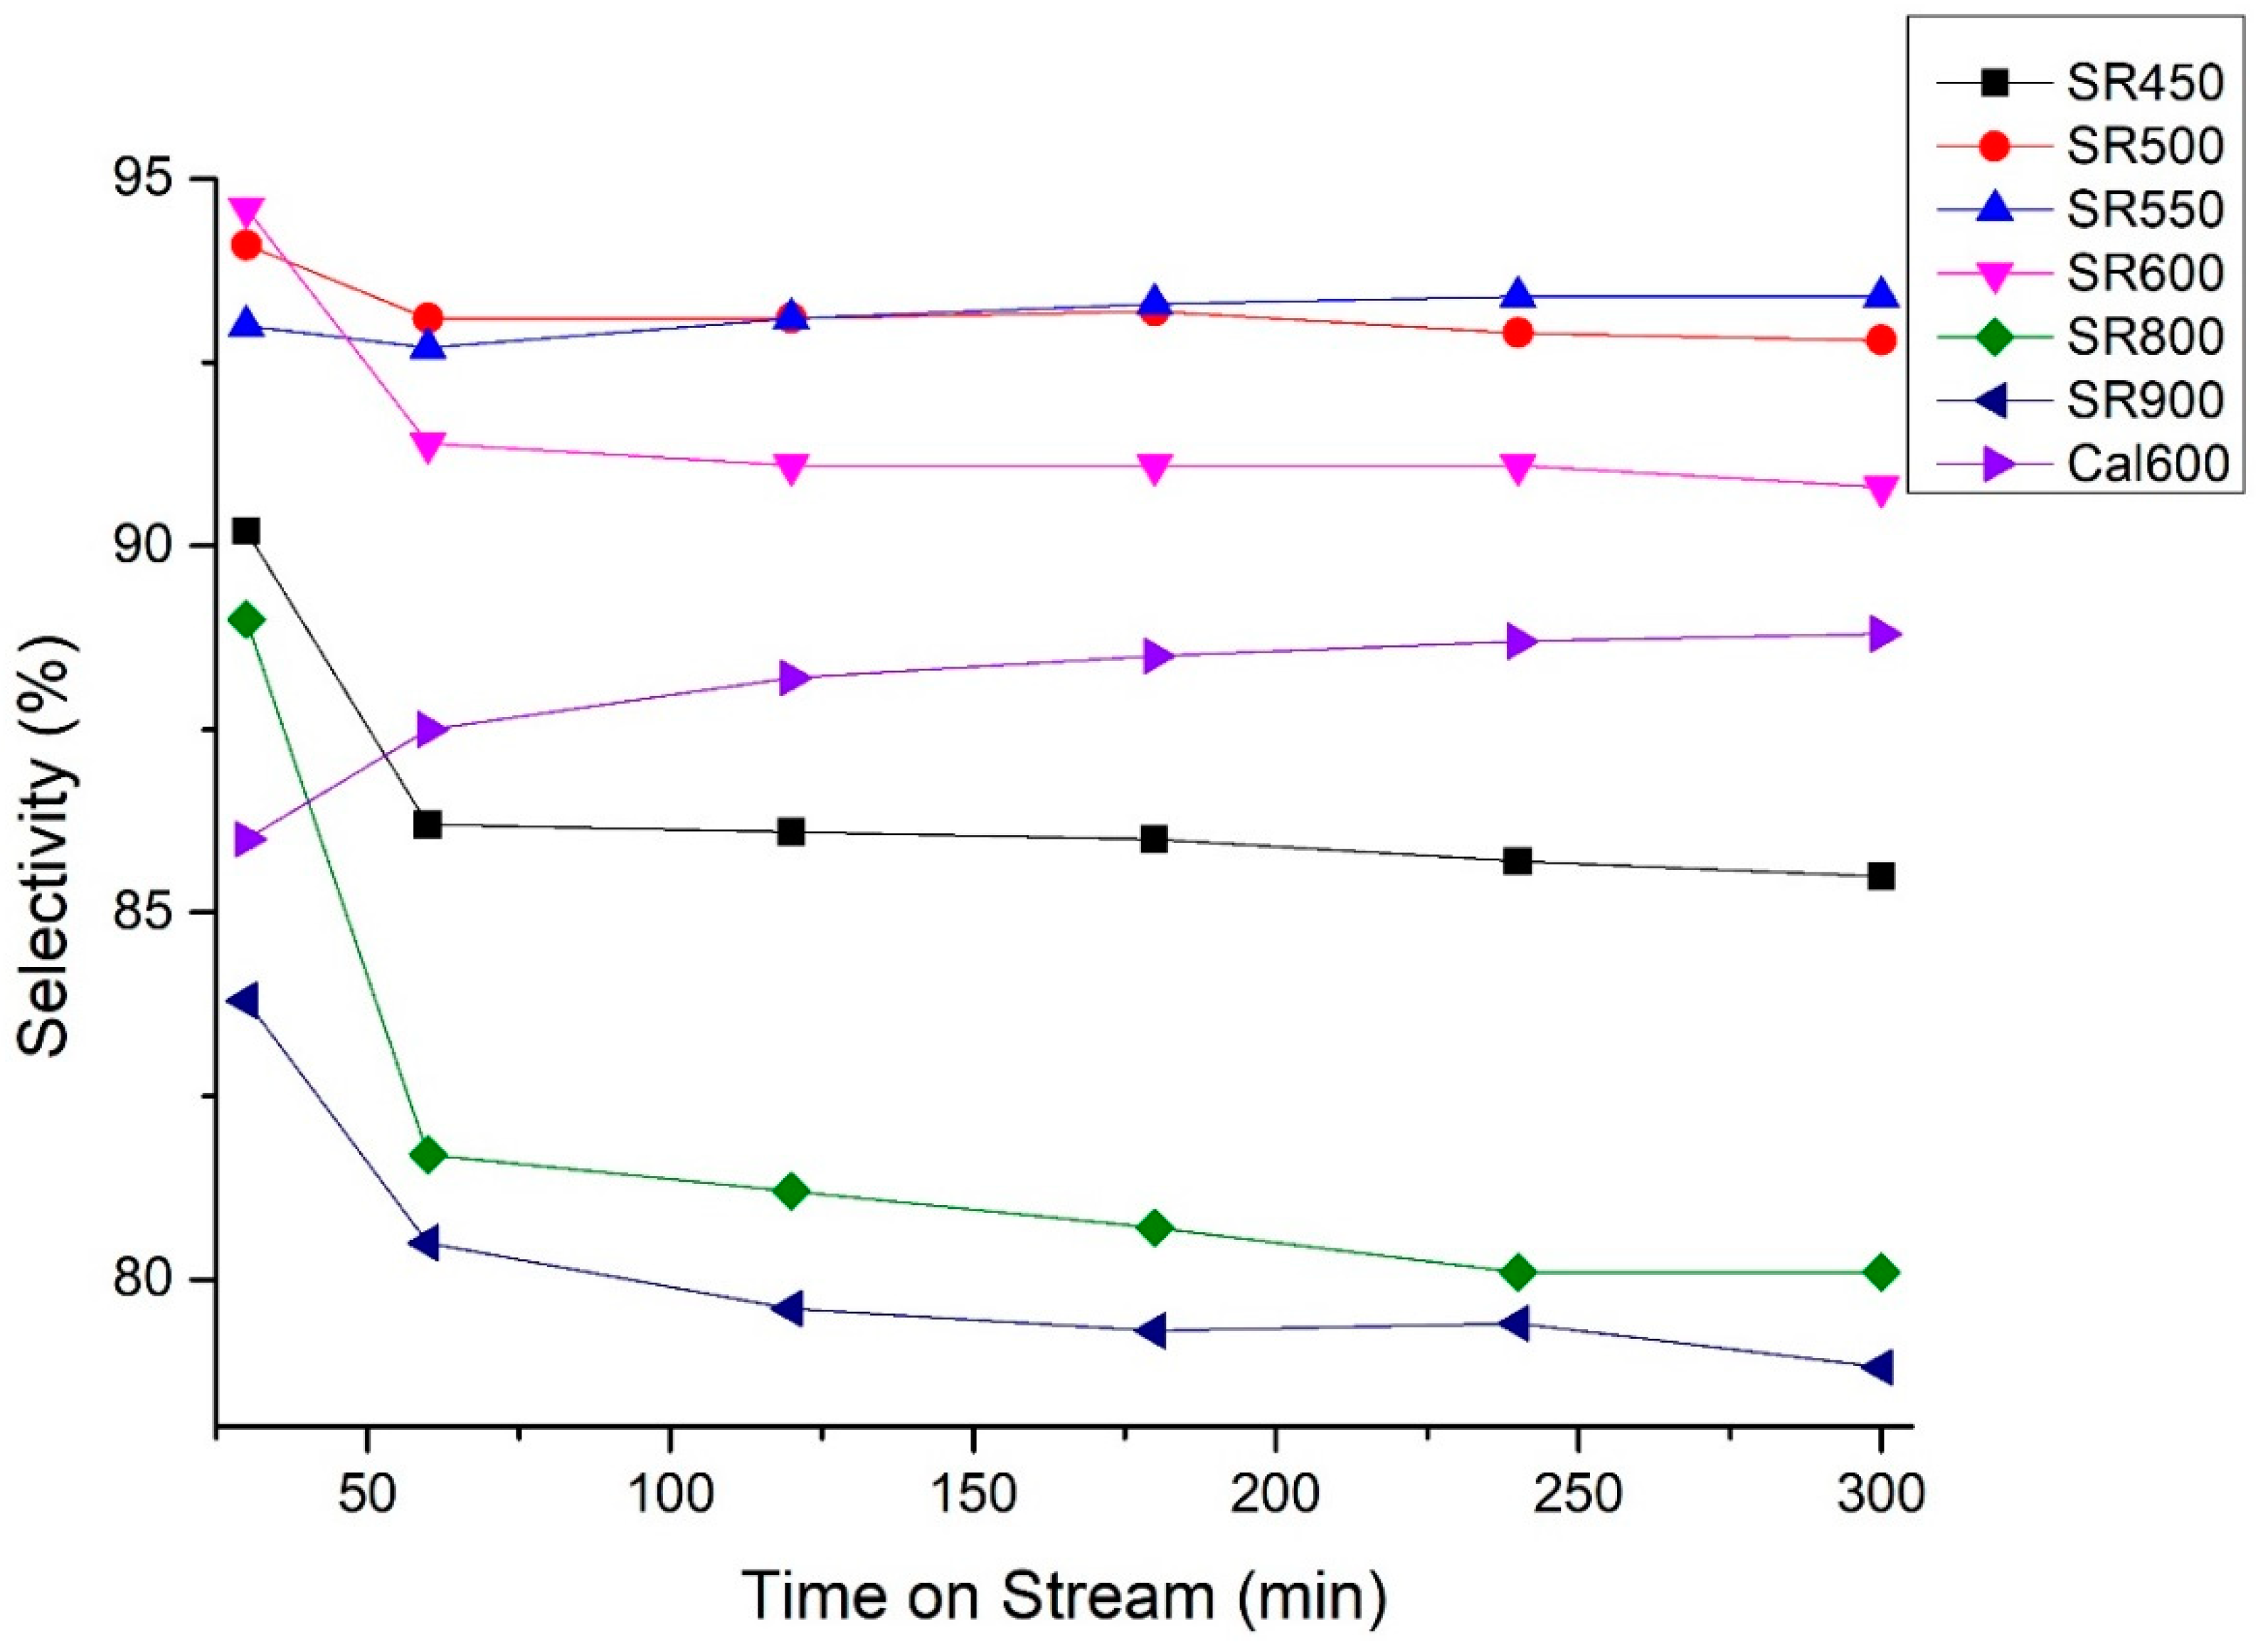
As shown in Figure 2, the propylene selectivity values determined after 1 h were in the order of SR500 > SR550 > SR600 > Cal600 > SR450 > SR800 > SR900. Similar to the trends in Figure 1, the selectivity values of SR500 and SR550 were similarly high until 180 min, after which SR550 showed slightly superior selectivity to SR500 until 5 h reaction time. As mentioned, the direct reduction method was first reported by Deng and coworkers [10,21]. They prepared Pt–Sn/SiO2 catalysts and evaluated the effects of the direct reduction method. On comparison with the activity of a conventionally calcined catalyst, they observed higher activity after direct reduction at 800 °C. However, because we are considering commercial applications, in our study, an Al2O3 support was chosen. Al2O3 is more favorable than SiO2 because Al2O3 is durable and more stable under the high temperature conditions of the PDH reaction. The main objective of this study was to verify whether Pt–Sn/Al2O3 prepared by a direct reduction will show similar superiority to the conventional catalyst for the PDH reaction.
2.2. Catalyst Characterization
2.2.1. X-ray Diffraction Analysis
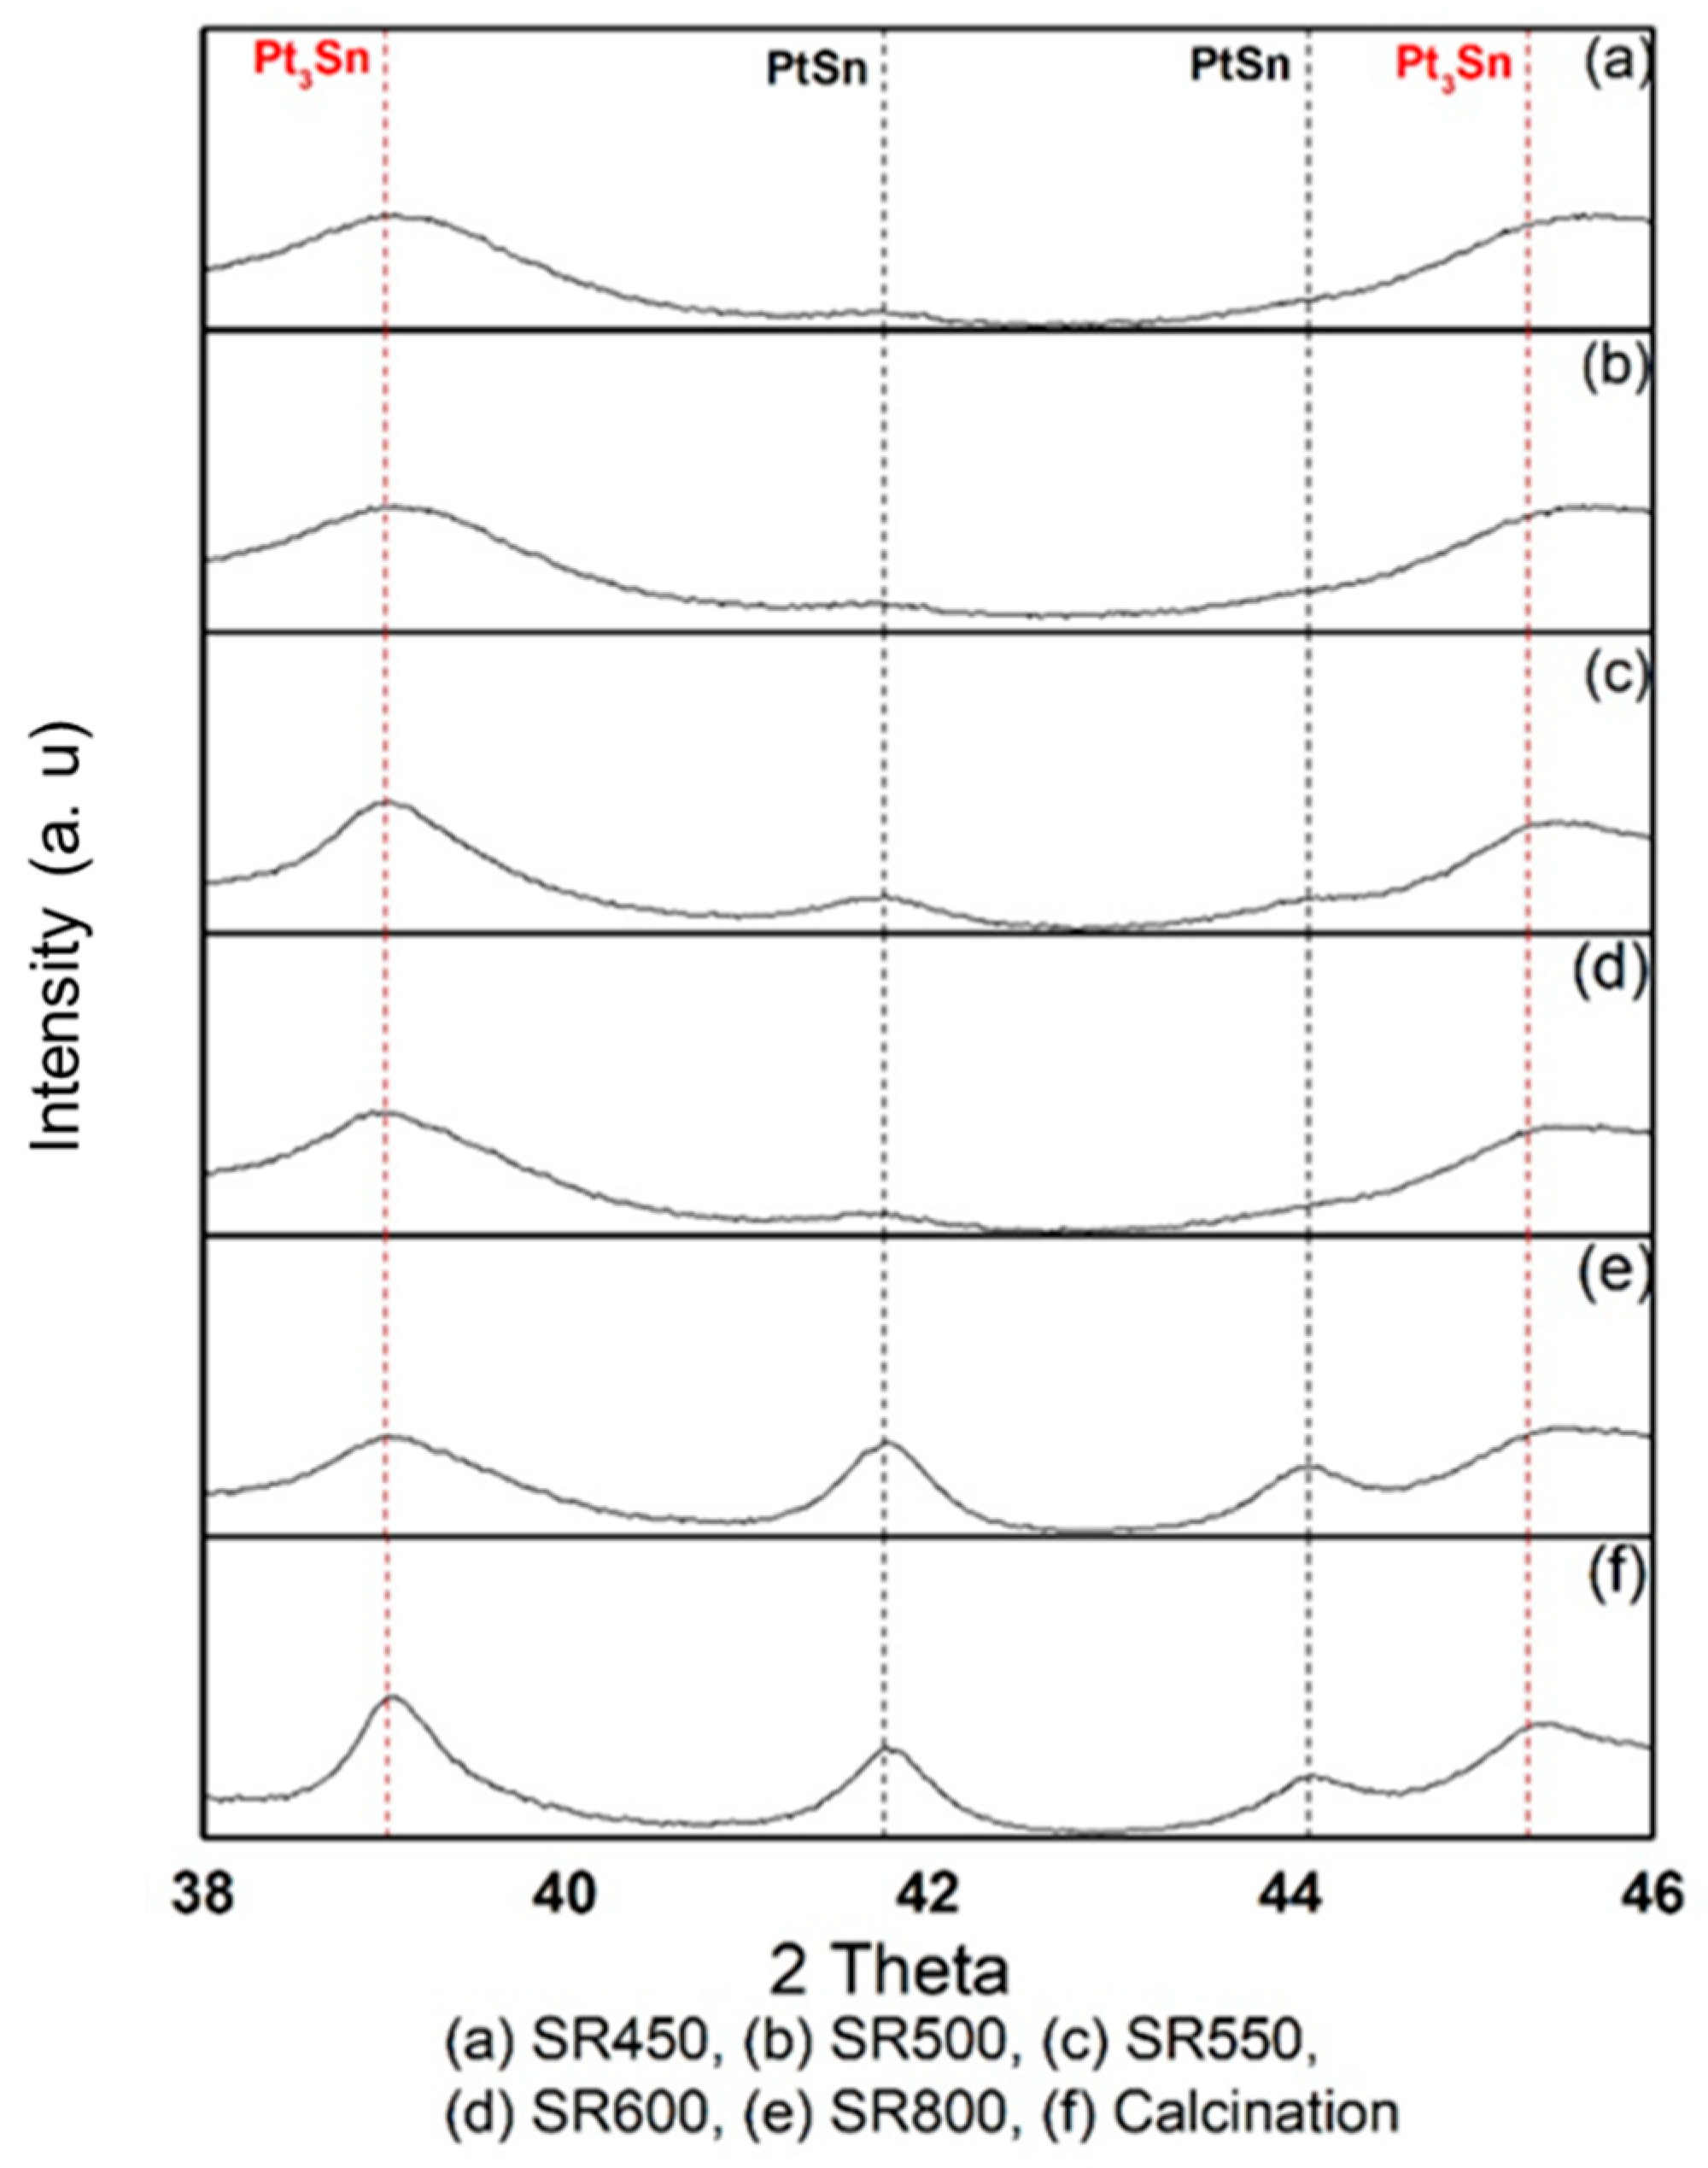
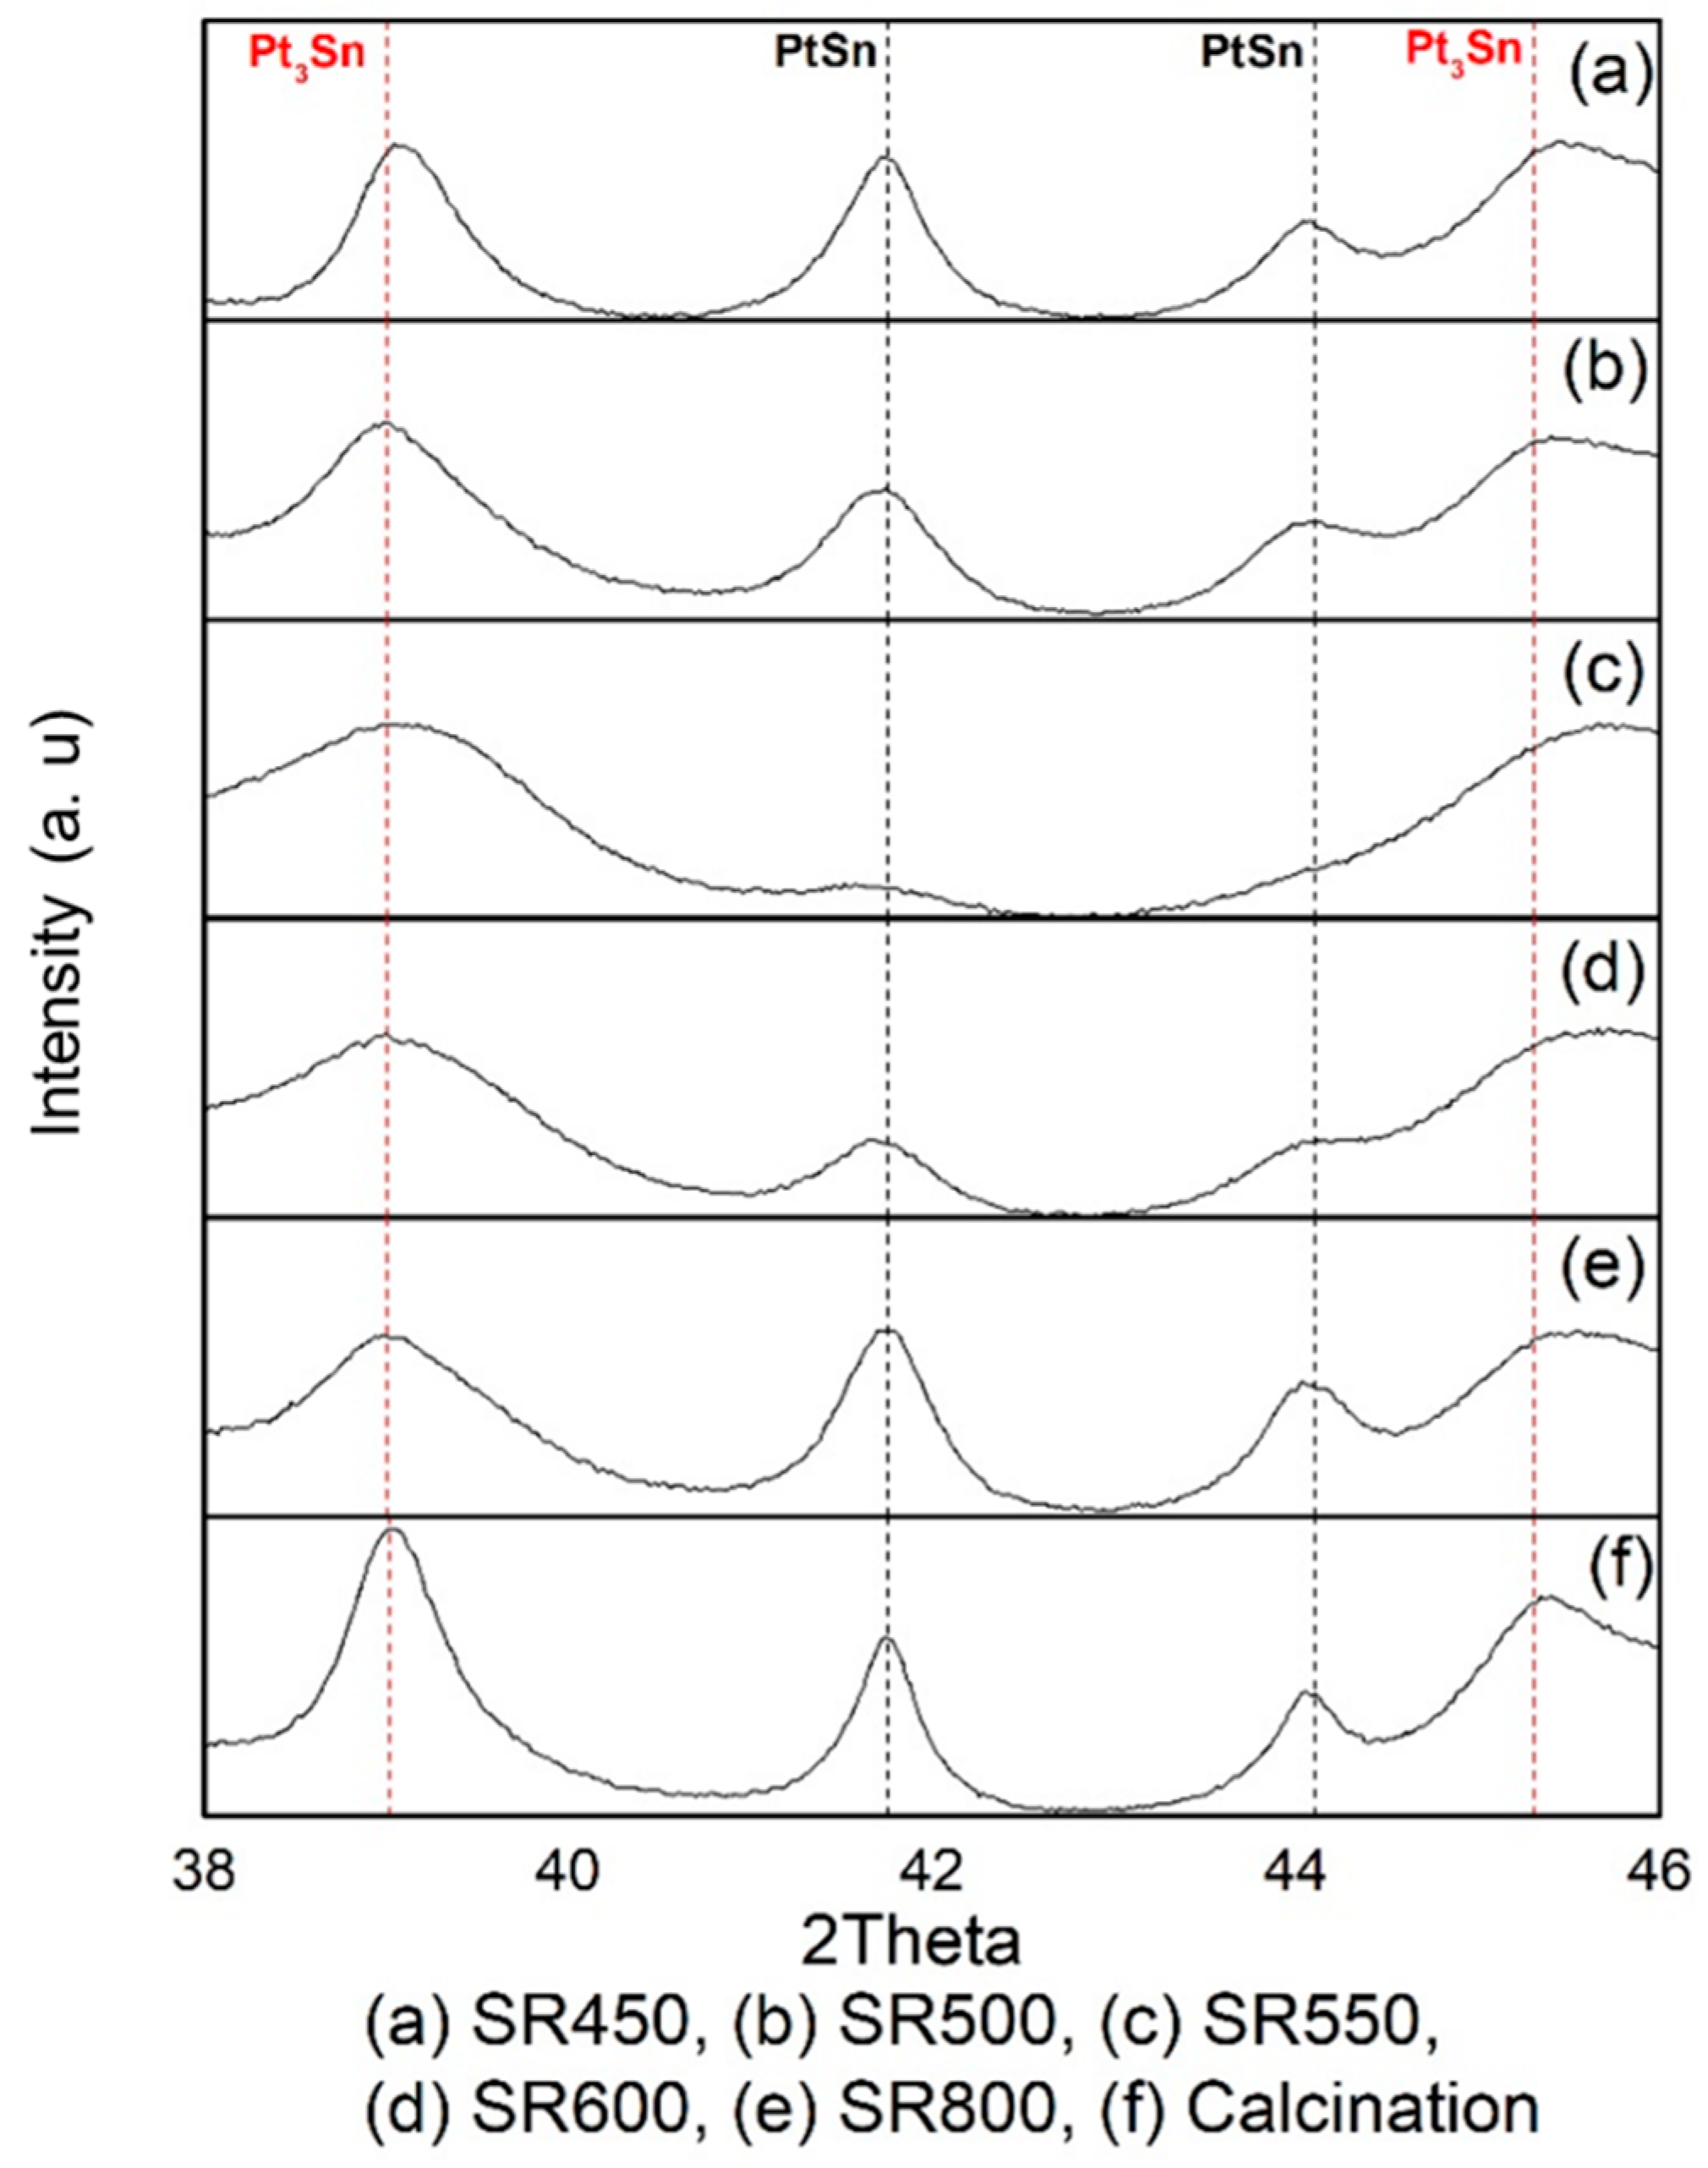
Figure 3 shows the XRD patterns of the five SR catalysts (SR450, SR500, SR550, SR600, and SR800) and the Cal600 catalyst. As shown in Figure 3, two different alloys, PtSn and Pt3Sn, were detected between 38° and 46° in 2θ. The peaks located at 2θ values of 41.71° and 44.01° are related to the PtSn alloy, and the peaks located at 2θ values of 39.16° and 45.51° correspond to the Pt3Sn alloy [10,21]. It has been reported that the Pt3Sn alloy is only formed when precursor’s molar ratios of Pt/Sn is higher than 1 [21]. In this study, both PtSn and Pt3Sn are clearly indicated by the XRD patterns. The precursor ratio was fixed to 3 to 1.8 by weight (1:1 by mole). Interestingly, the SR catalysts showed a slight shift to a higher angle in the characteristic Pt3Sn peak near 45°. Here, we infer that the PtxSny (x/y >3) alloy is possibly formed, and a small amount of Sn can be excluded from the existing Pt3Sn alloy phase, as reported previously [10,21]. After reduction (Figure 4), the characteristic peaks of the PtSn alloy are not present in the XRD patterns of SR450, SR500, SR550, and SR600, although they were observed in the XRD pattern of SR800. As shown in Figure 4, the intensities of the characteristic peaks of PtSn alloy were reduced as the reduction temperature increased from 450 to 550 °C, and the peaks grew sharper as the reduction temperatures increased from 600 to 800 °C. Considering the results of the catalytic activity tests and the XRD analysis, we inferred the presence of PtSn alloy, which must affect the PDH reaction negatively. Meanwhile, the intensities of the characteristic peaks of the Pt3Sn alloy did not change much with increasing direct reduction temperature. The characteristic Pt3Sn peak shifted slightly to the characteristic peaks of PtxSny (x/y > 3) near 45.5°. Conceivably, the abundant Pt in Pt3Sn or PtxSny (x/y > 3) provides more active sites for the PDH reaction. Thus, the activity for the PDH reaction was increased not by the increasing amount of PtSn alloy but the increasing amount of Pt3Sn or PtxSny (x/y > 3) alloy. In addition, the presence of broad peaks in the XRD patterns implies that the Pt3Sn alloy is more amorphous or dispersed and nano-sized [21]. In the case of Cal600, the characteristic peaks of both PtSn and Pt3Sn alloys were very sharp, as shown in Figure 4f. Thus, both Pt3Sn and PtSn alloys are highly crystalline in the Cal600 catalyst. Therefore, even though Pt3Sn alloy in Cal600 was present as a highly crystalline phase with large particle sizes, the presence of the PtSn alloy negatively affected the PDH reaction. After the PDH reaction, we found that the XRD peaks maintained similar peak intensities, as shown in Figure 4.
2.2.2. TEM
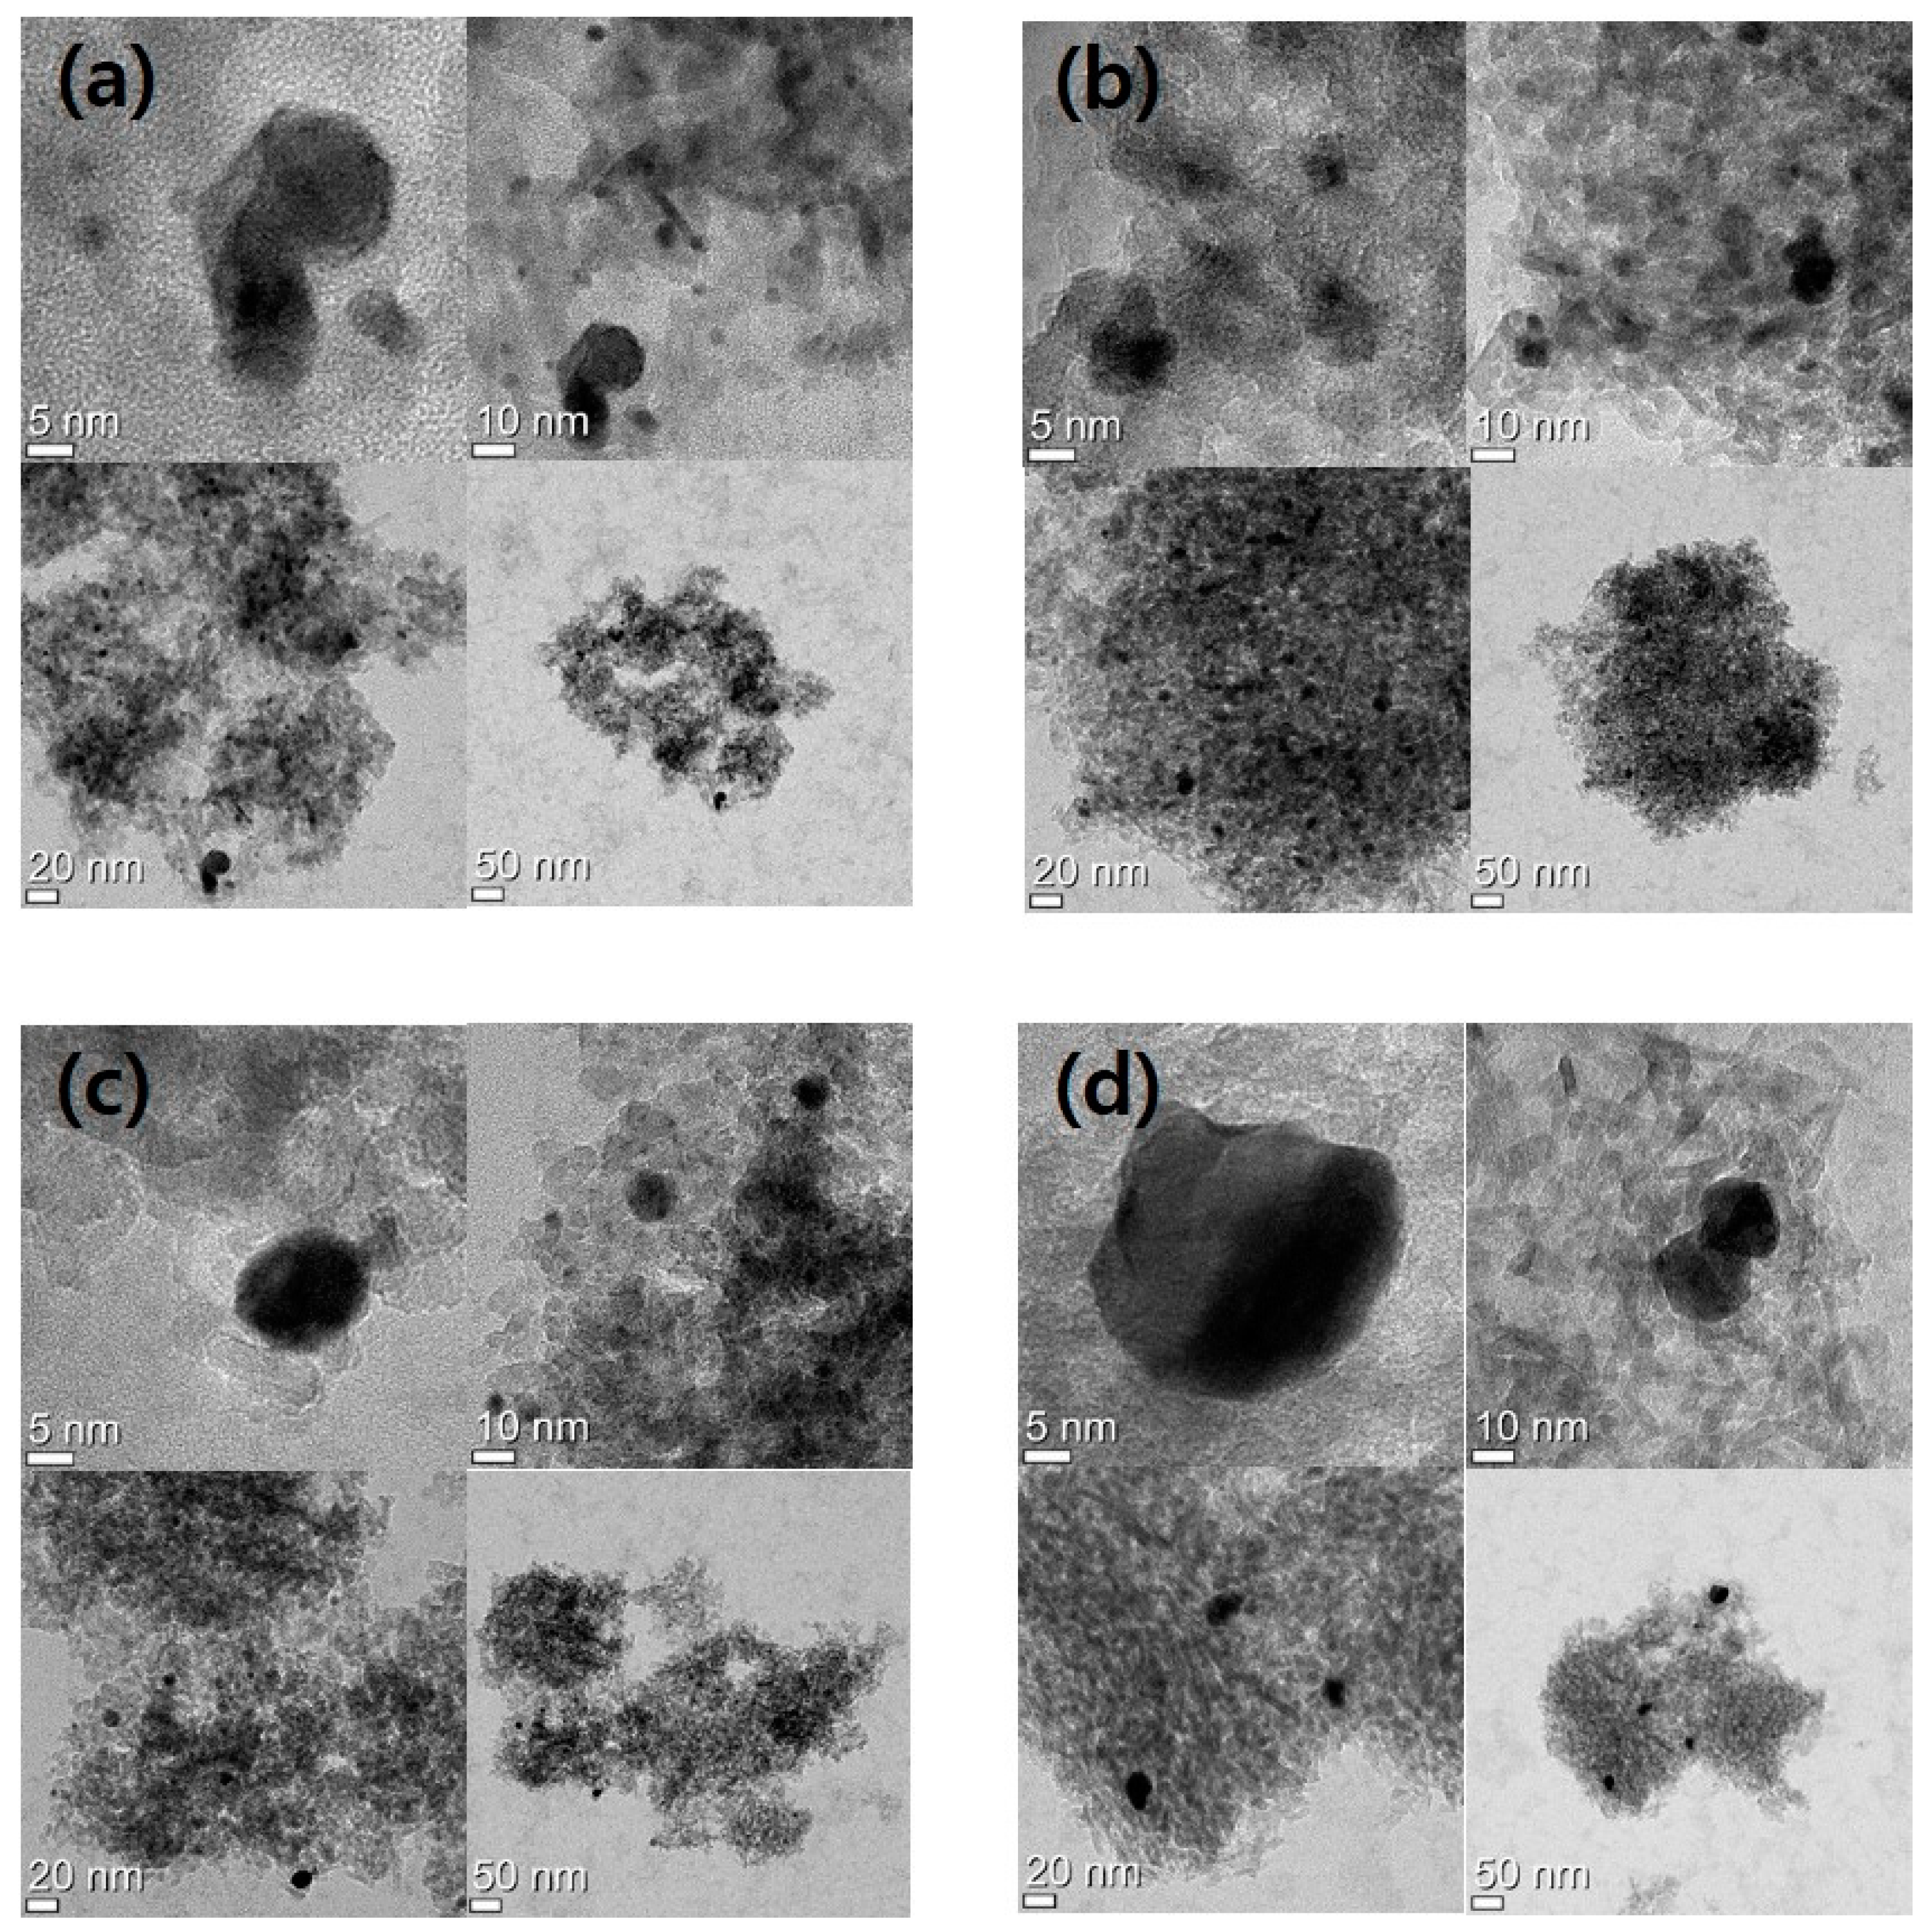
Figure 5 shows TEM images of SR450, SR500, SR600, and Cal600. Images of each catalyst are shown at four magnifications. Compared to Cal600, the SR catalysts contain much smaller alloy particles. In particular, the Pt–Sn particles of SR550 are the smallest and also distributed rather uniformly. This is consistent with the XRD results shown in Figure 3. Thus, the SR550 catalyst has well-dispersed Pt–Sn alloys, which are responsible for the high activity for the PDH reaction. In addition, large particles of Pt–Sn alloys were observed in Cal600.
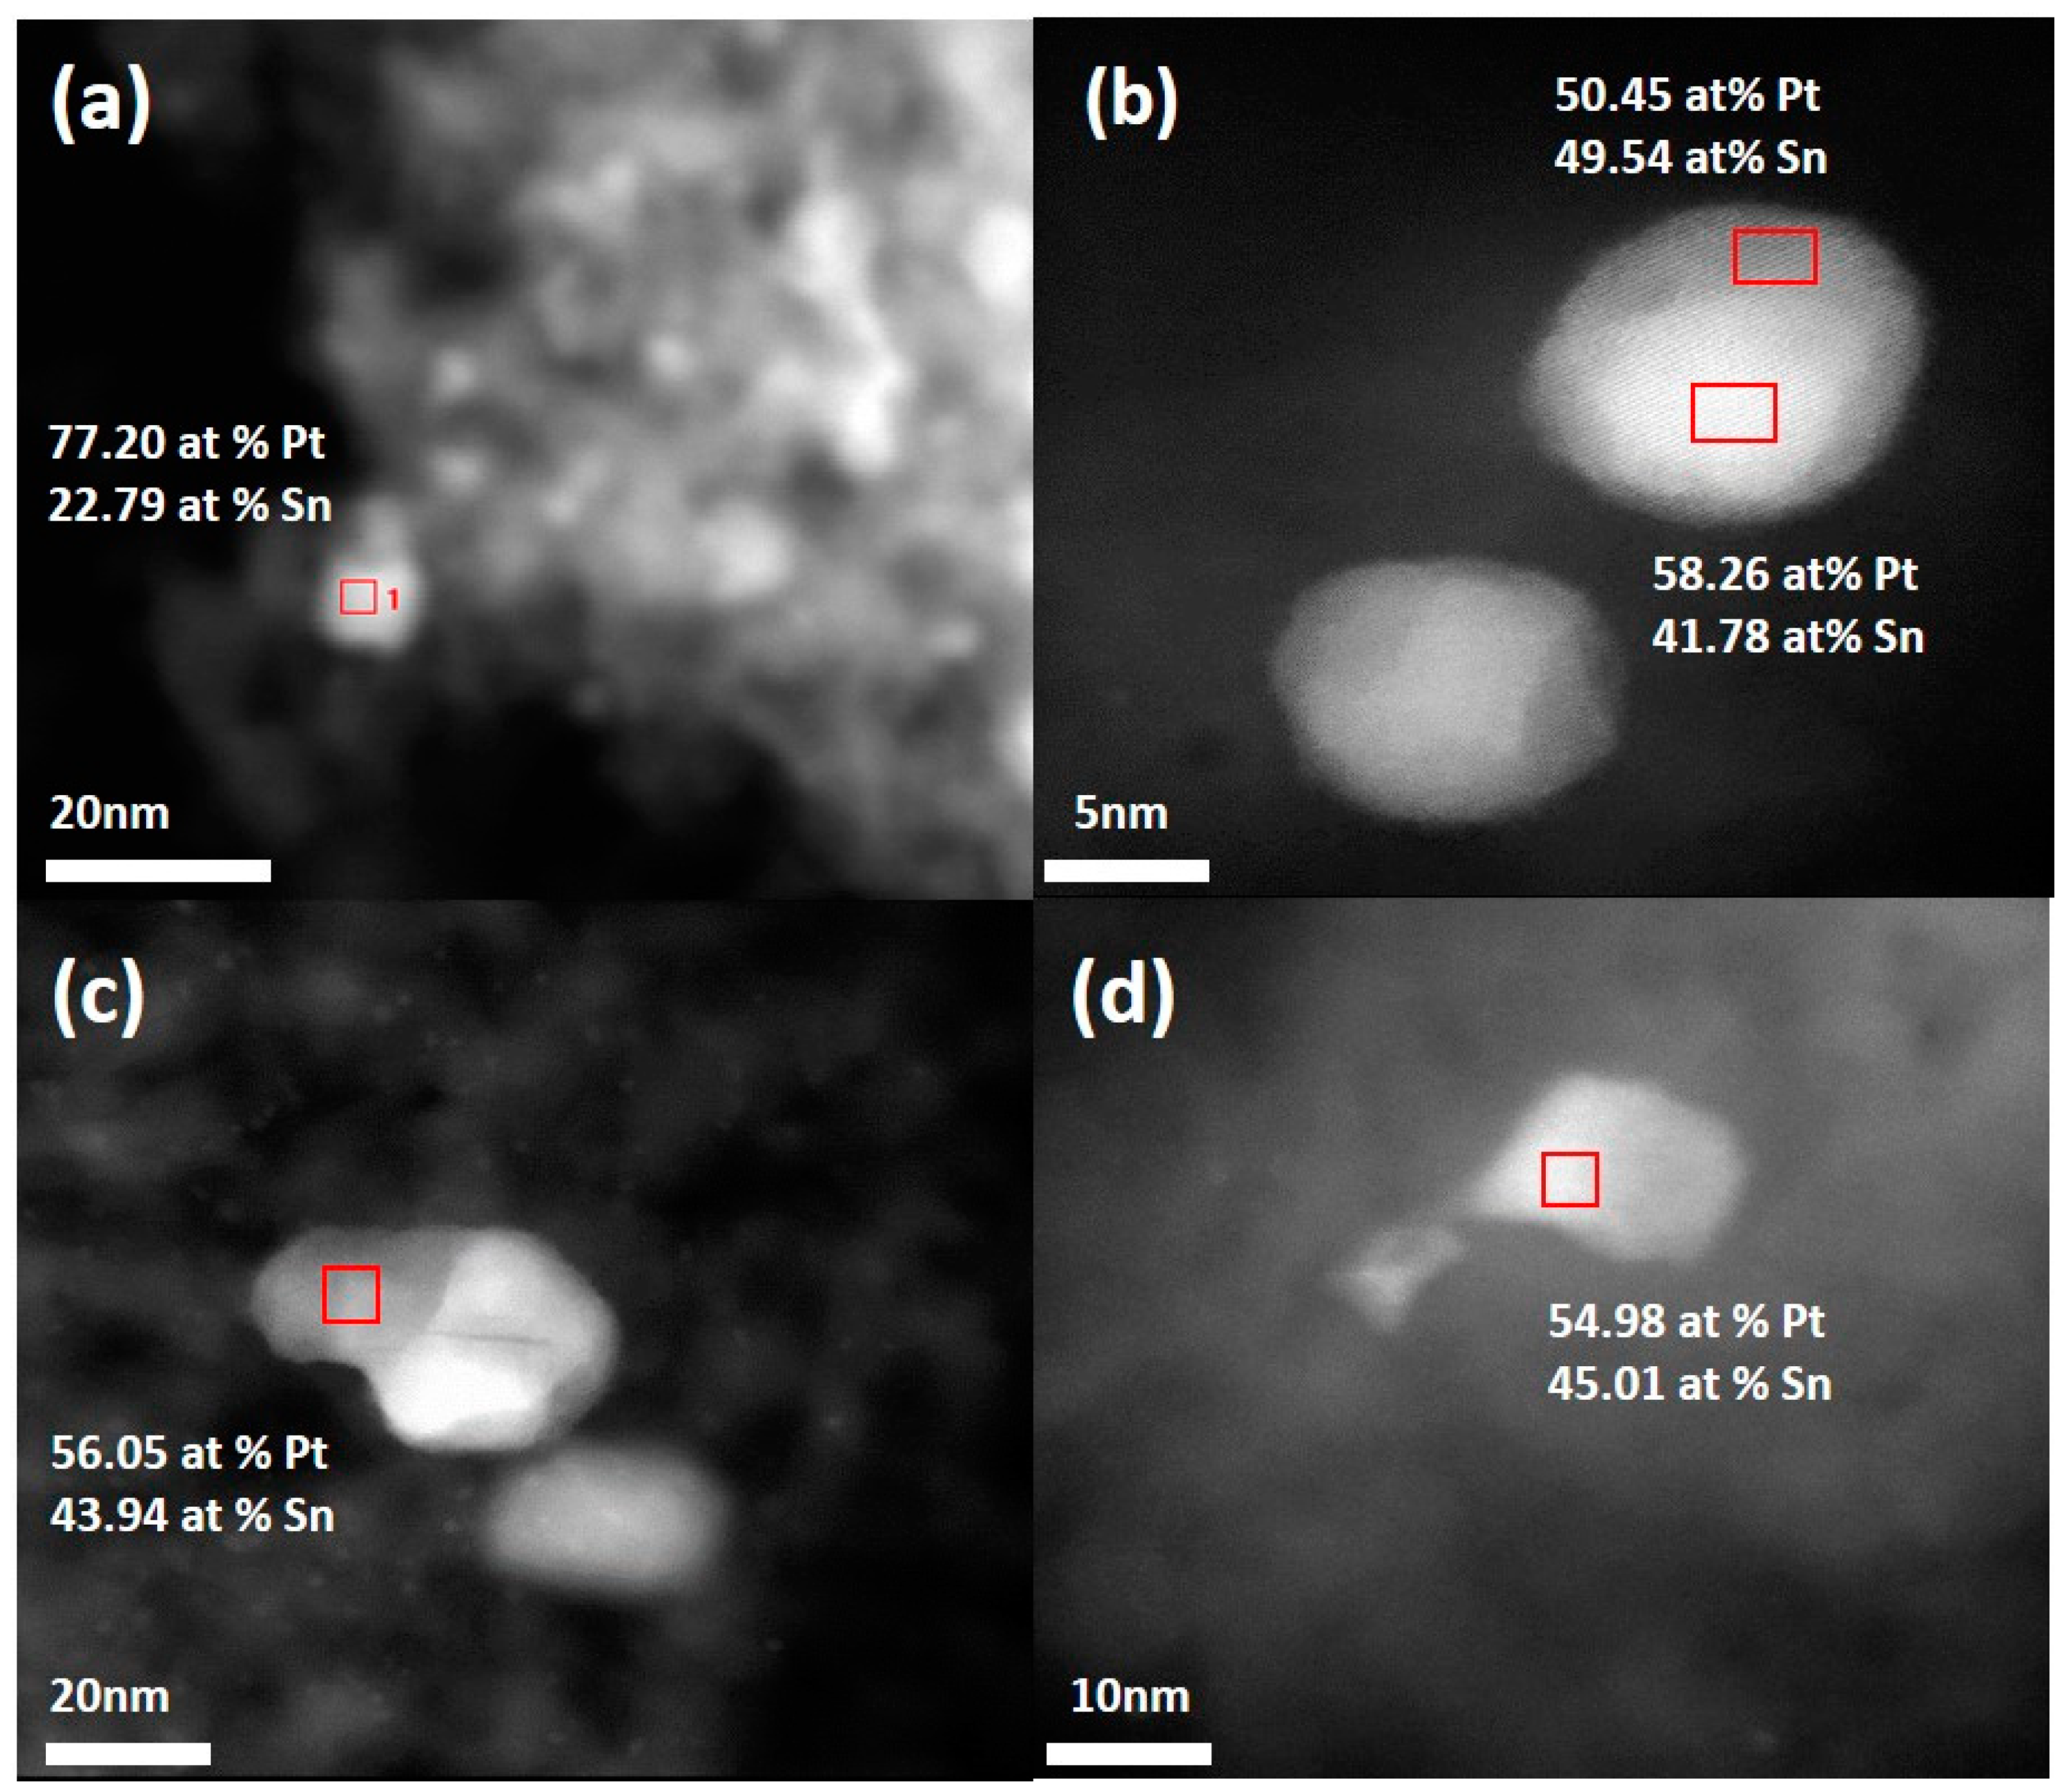
In Figure 6, EDS analyses of the SR550 and Cal600 catalysts are shown. Figure 6a shows the atomic percentages of Pt and Sn in SR550 catalyst (77.20 at.% Pt and 22.79 at.% Sn), which are close to the percentages of Pt and Sn in Pt3Sn alloy. In the case of the Cal600 catalyst, the atomic percentages (56.05 at.% Pt and 43.94 at.% Sn) are close to those of the PtSn alloy. Interestingly, different amounts of Pt in SR550 were observed at the edge as well as in the core of a metal alloy particle as shown in Figure 6b. Pt contents were 50.45 at.% at the edge and 58.26 at.% in the core of a metal (alloy) particle.
In the case of the SR550 catalyst, the difference in Pt contents was 50.45 at.% at the edge and 58.26 at.% in the core of a metal particle.
2.2.3. DTA Analysis
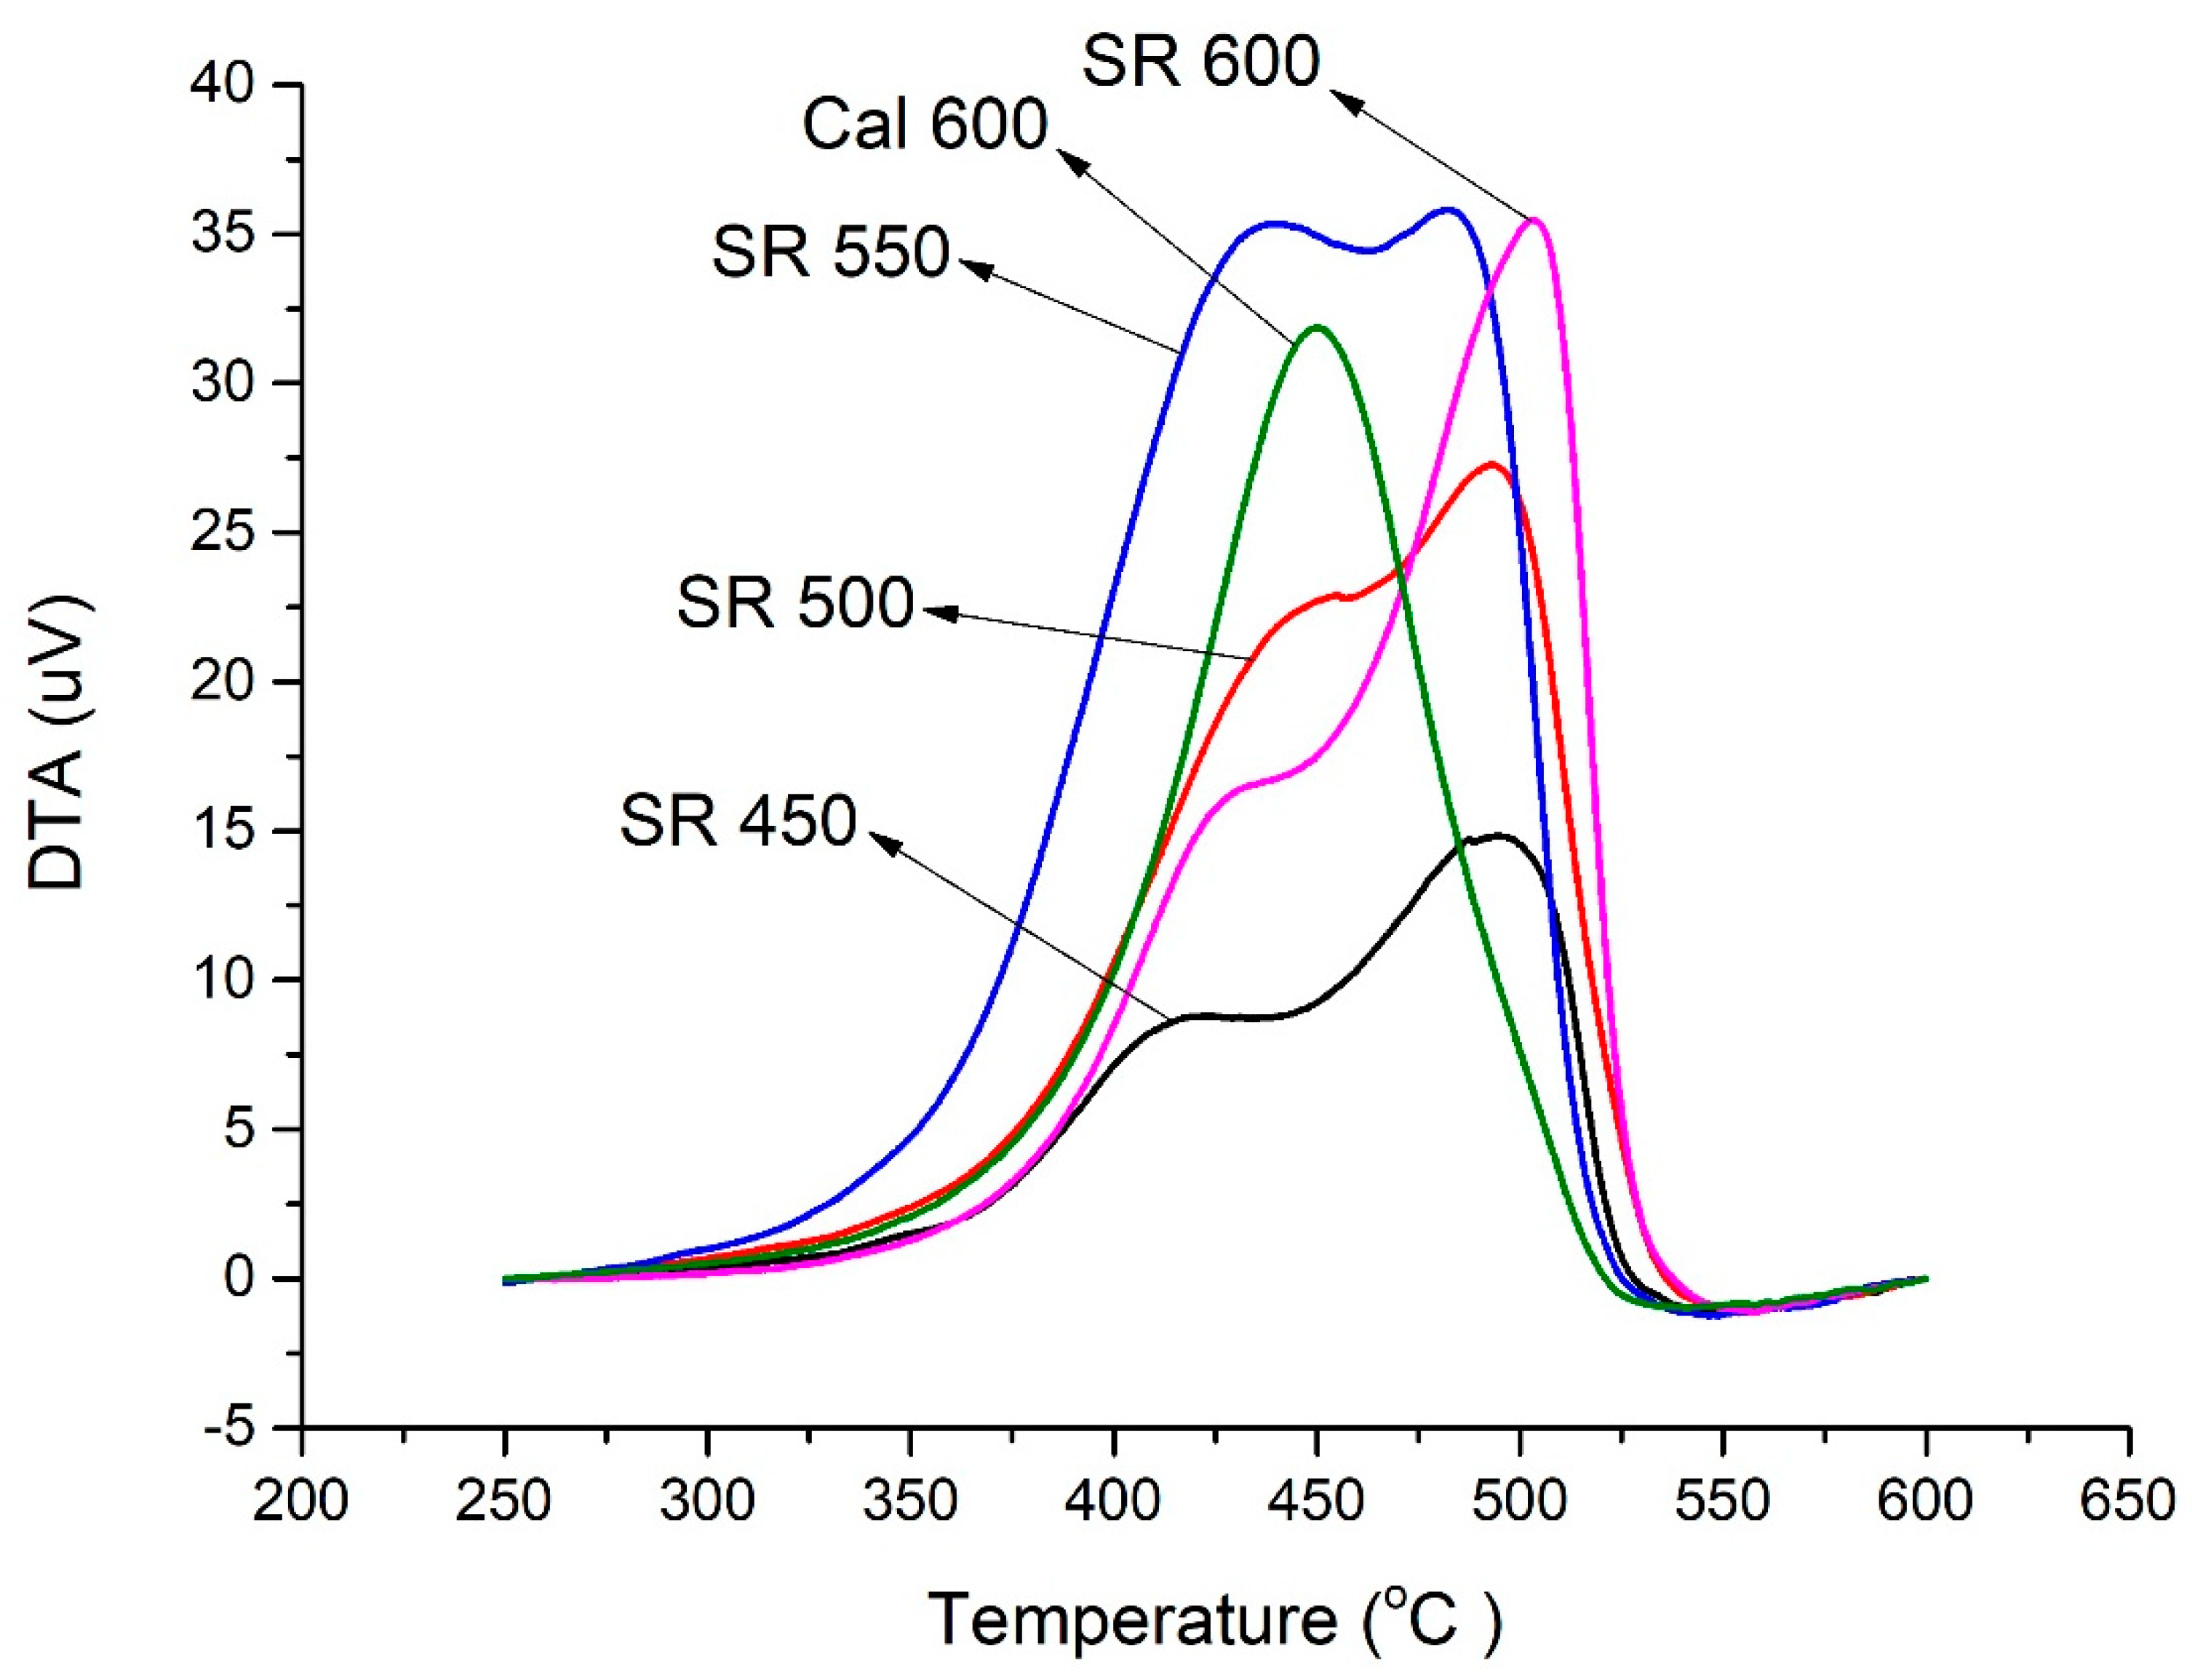
After the PDH reaction, coke is deposited on each catalyst, and this was characterized by DTA analysis. The amount of coke is summarized in Table 1 (in the Discussion section). As the direct reduction temperature increased from 450 to 550 °C, the amount of coke increased and then decreased again at 600 °C. The amount of coke gradually increased with increasing catalyst activity. As shown in Figure 7, the SR catalysts showed the first peak at 417–454 °C, and the second peak occurred at 482–503 °C during coke oxidation.
It has been reported [24] that the first peak near 417 °C can be attributed to coke combustion on either Pt or Pt–Sn alloy sites, whereas the second peak near 494.4 °C is due to the "drain-off’" effect. Here, drain-off is the case of the coke on metal sites migrating to the oxide support. The drain-off effect is known to be greater when Sn is added to Pt [5]. Comparing the results for the SR catalysts to that of Cal600, the second peak of the SR catalysts was larger. This is indirect evidence that the bimetallic catalysts induced the cokes to move from the metal sites to the surface of the catalyst support when coke accumulates. In particular, there are two inflection points of equal magnitude in the DTA curve of SR550. The first peak in the DTA curve of SR550 is relatively strong and is related to the large amount of coke on metal sites. Note that SR550 has the highest activity of all the catalysts for the PDH reaction. We suspect that the interaction between propane and the Pt–Sn alloys is greater for the Pt3Sn alloy than the PtSn alloy. Thus, the greater number of interactions enhances the PDH reaction and more coke is formed. When coke accumulates, the metal sites become covered, which could inhibit the PDH reaction. If drain-off occurs, the active sites of catalysts are recovered. Unlike that of SR550, the DTA curve of Cal600 showed a single peak at 450.2 °C. Thus, no drain-off effects occurred in the Cal600 catalyst.
2.2.4. XPS Analysis
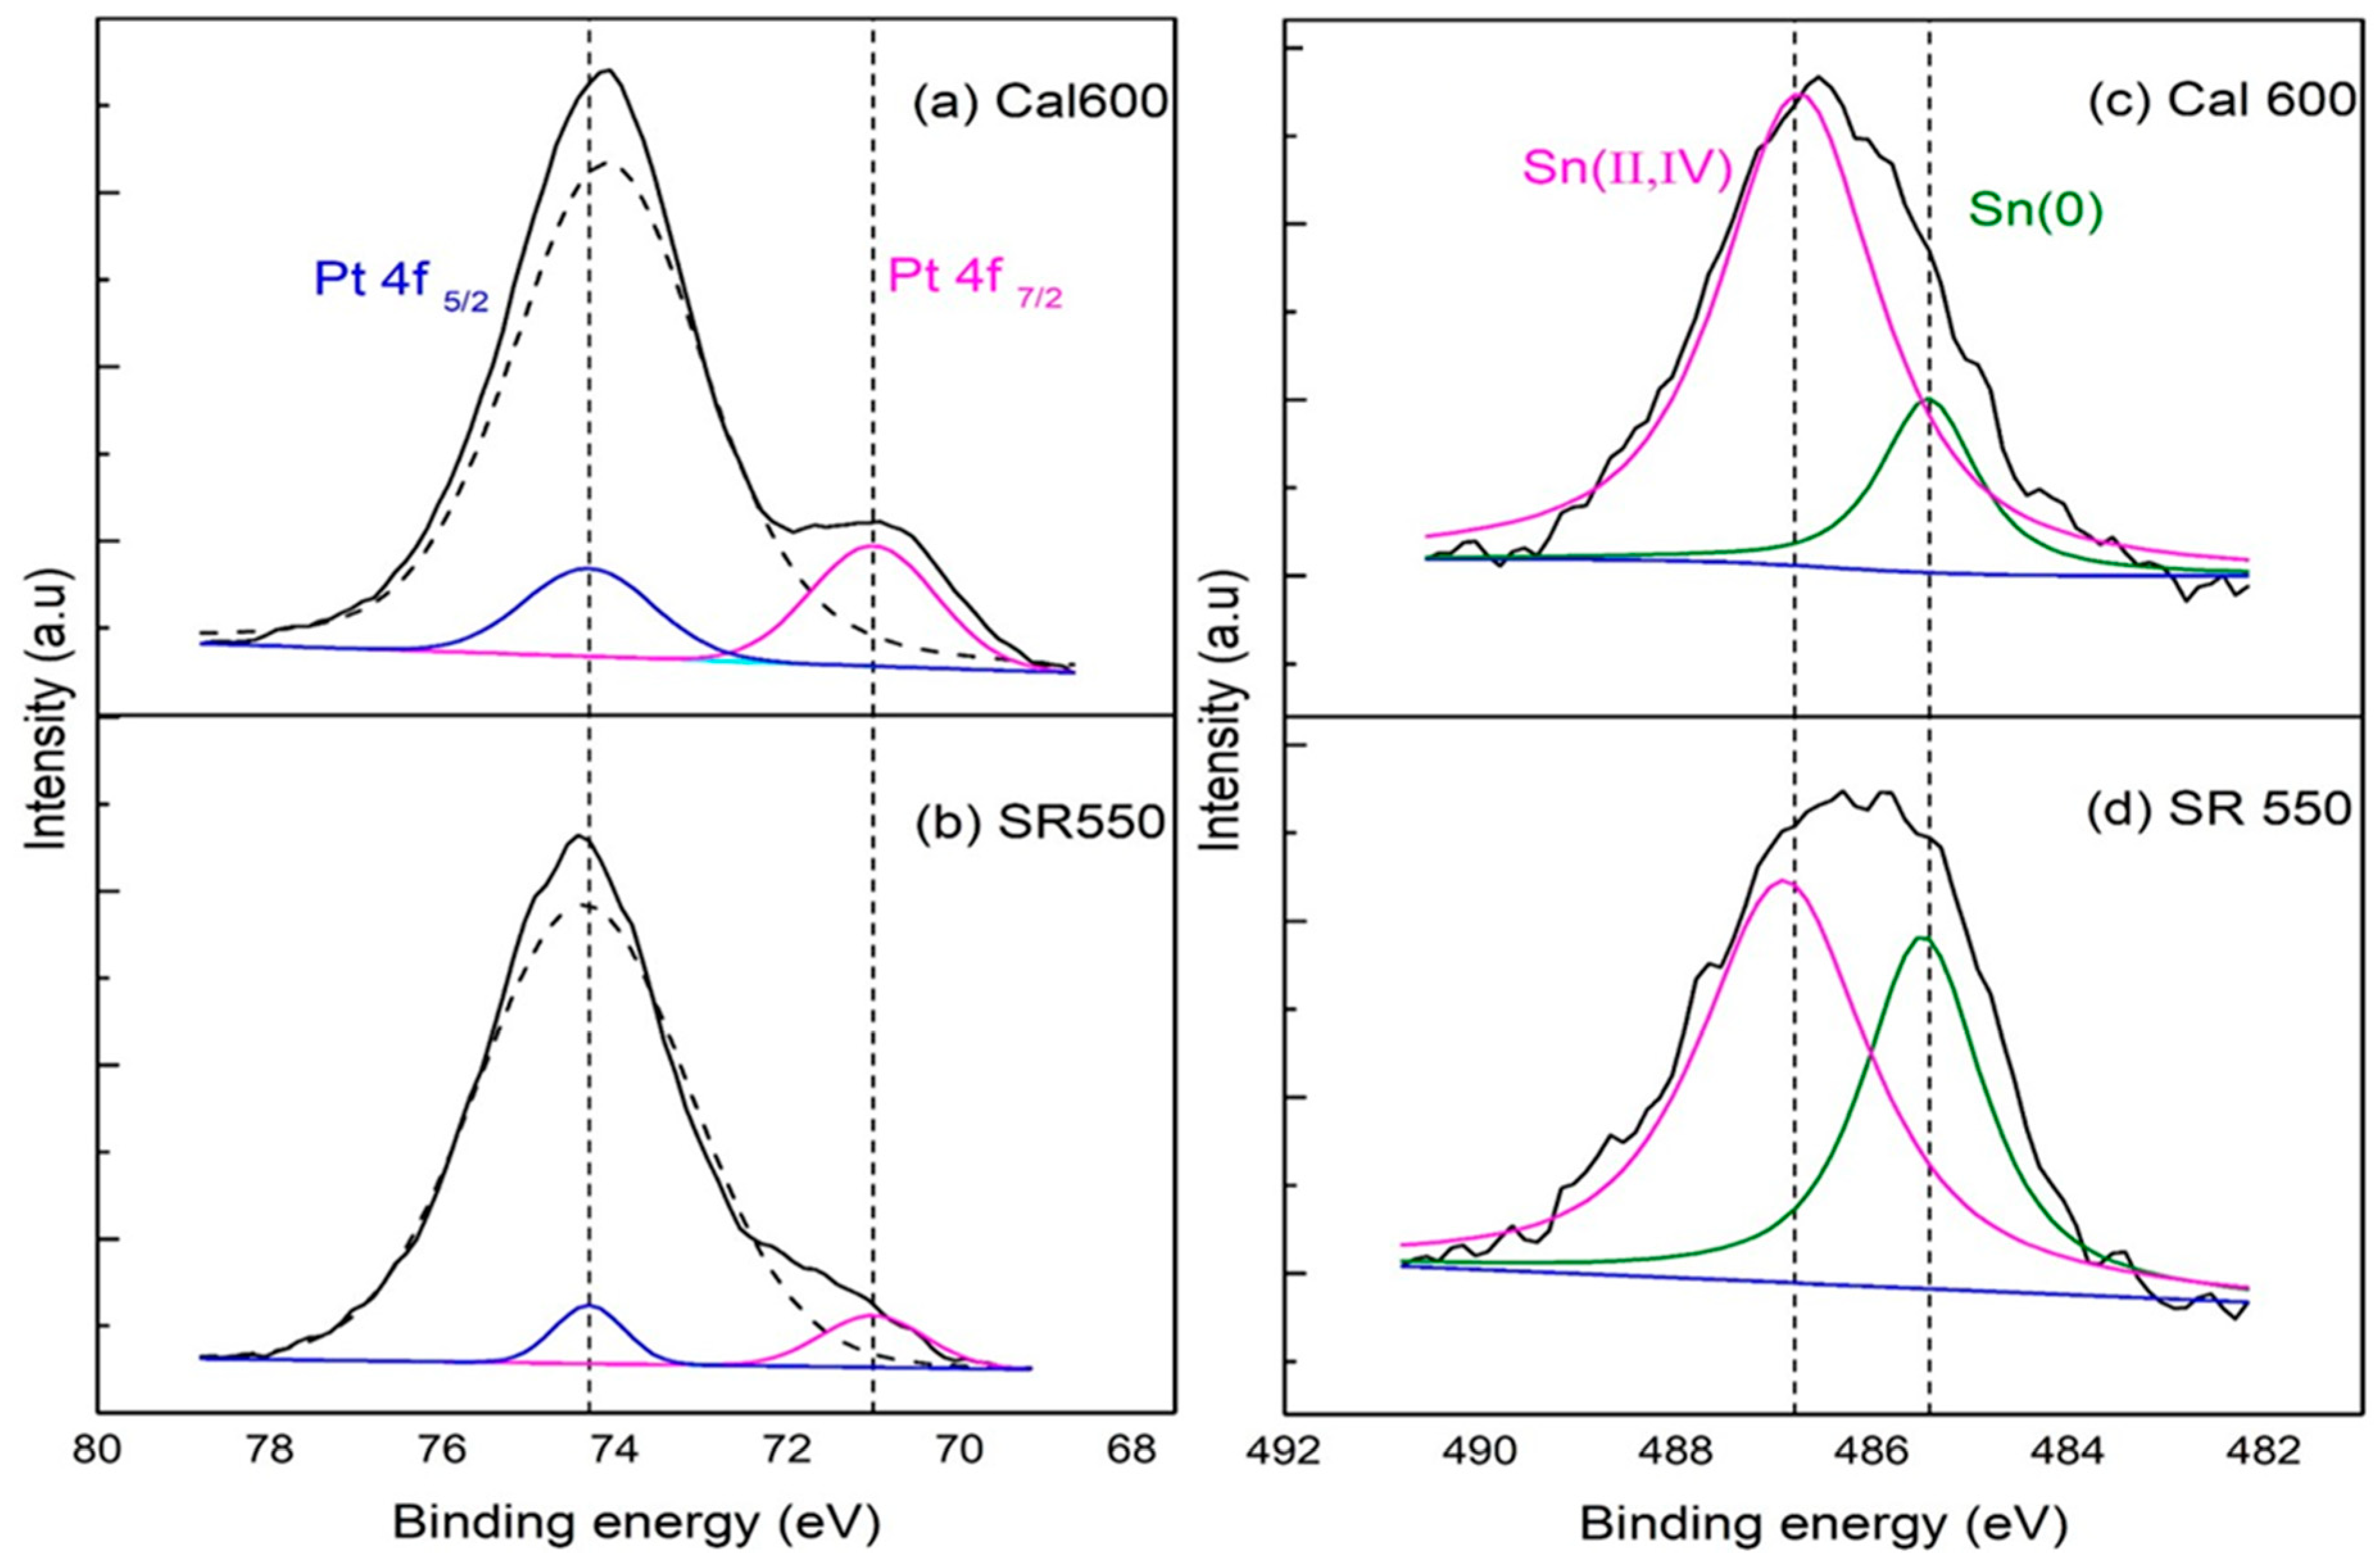
XPS spectra of the Pt 4f and Sn 3d regions of SR550 and Cal600 are shown in Figure 8. Peak deconvolution was conducted, and the overlap of the Pt 4f and Al 2p peaks was considered. The dashed curves show the Al 2p and Pt 4f peaks in Figure 8. The binding energies of Pt 4f 7/2 and 4f 5/2 peaks were 71.6 and 74.8 eV, respectively. On the basis of this binding energy, it can be confirmed that the state of Pt in both SR550 and Cal600 catalysts is zero valent (metallic Pt). A comparison of the Pt 4f peak areas between the catalysts reveals that Pt was distributed less on the surface of SR550 than that of Cal600. As shown in Figure 8c,d, the binding energies of the Sn 3d 5/2 peaks were 487 and 485 eV, and deconvolution was performed to compare the contents of Sn(II, IV) and Sn(0). Because the relative intensity of the Sn(II, IV) of Cal600 is greater than that of SR550, Sn may cover the surface of the Pt or Pt–Sn alloy in the SR550 catalyst
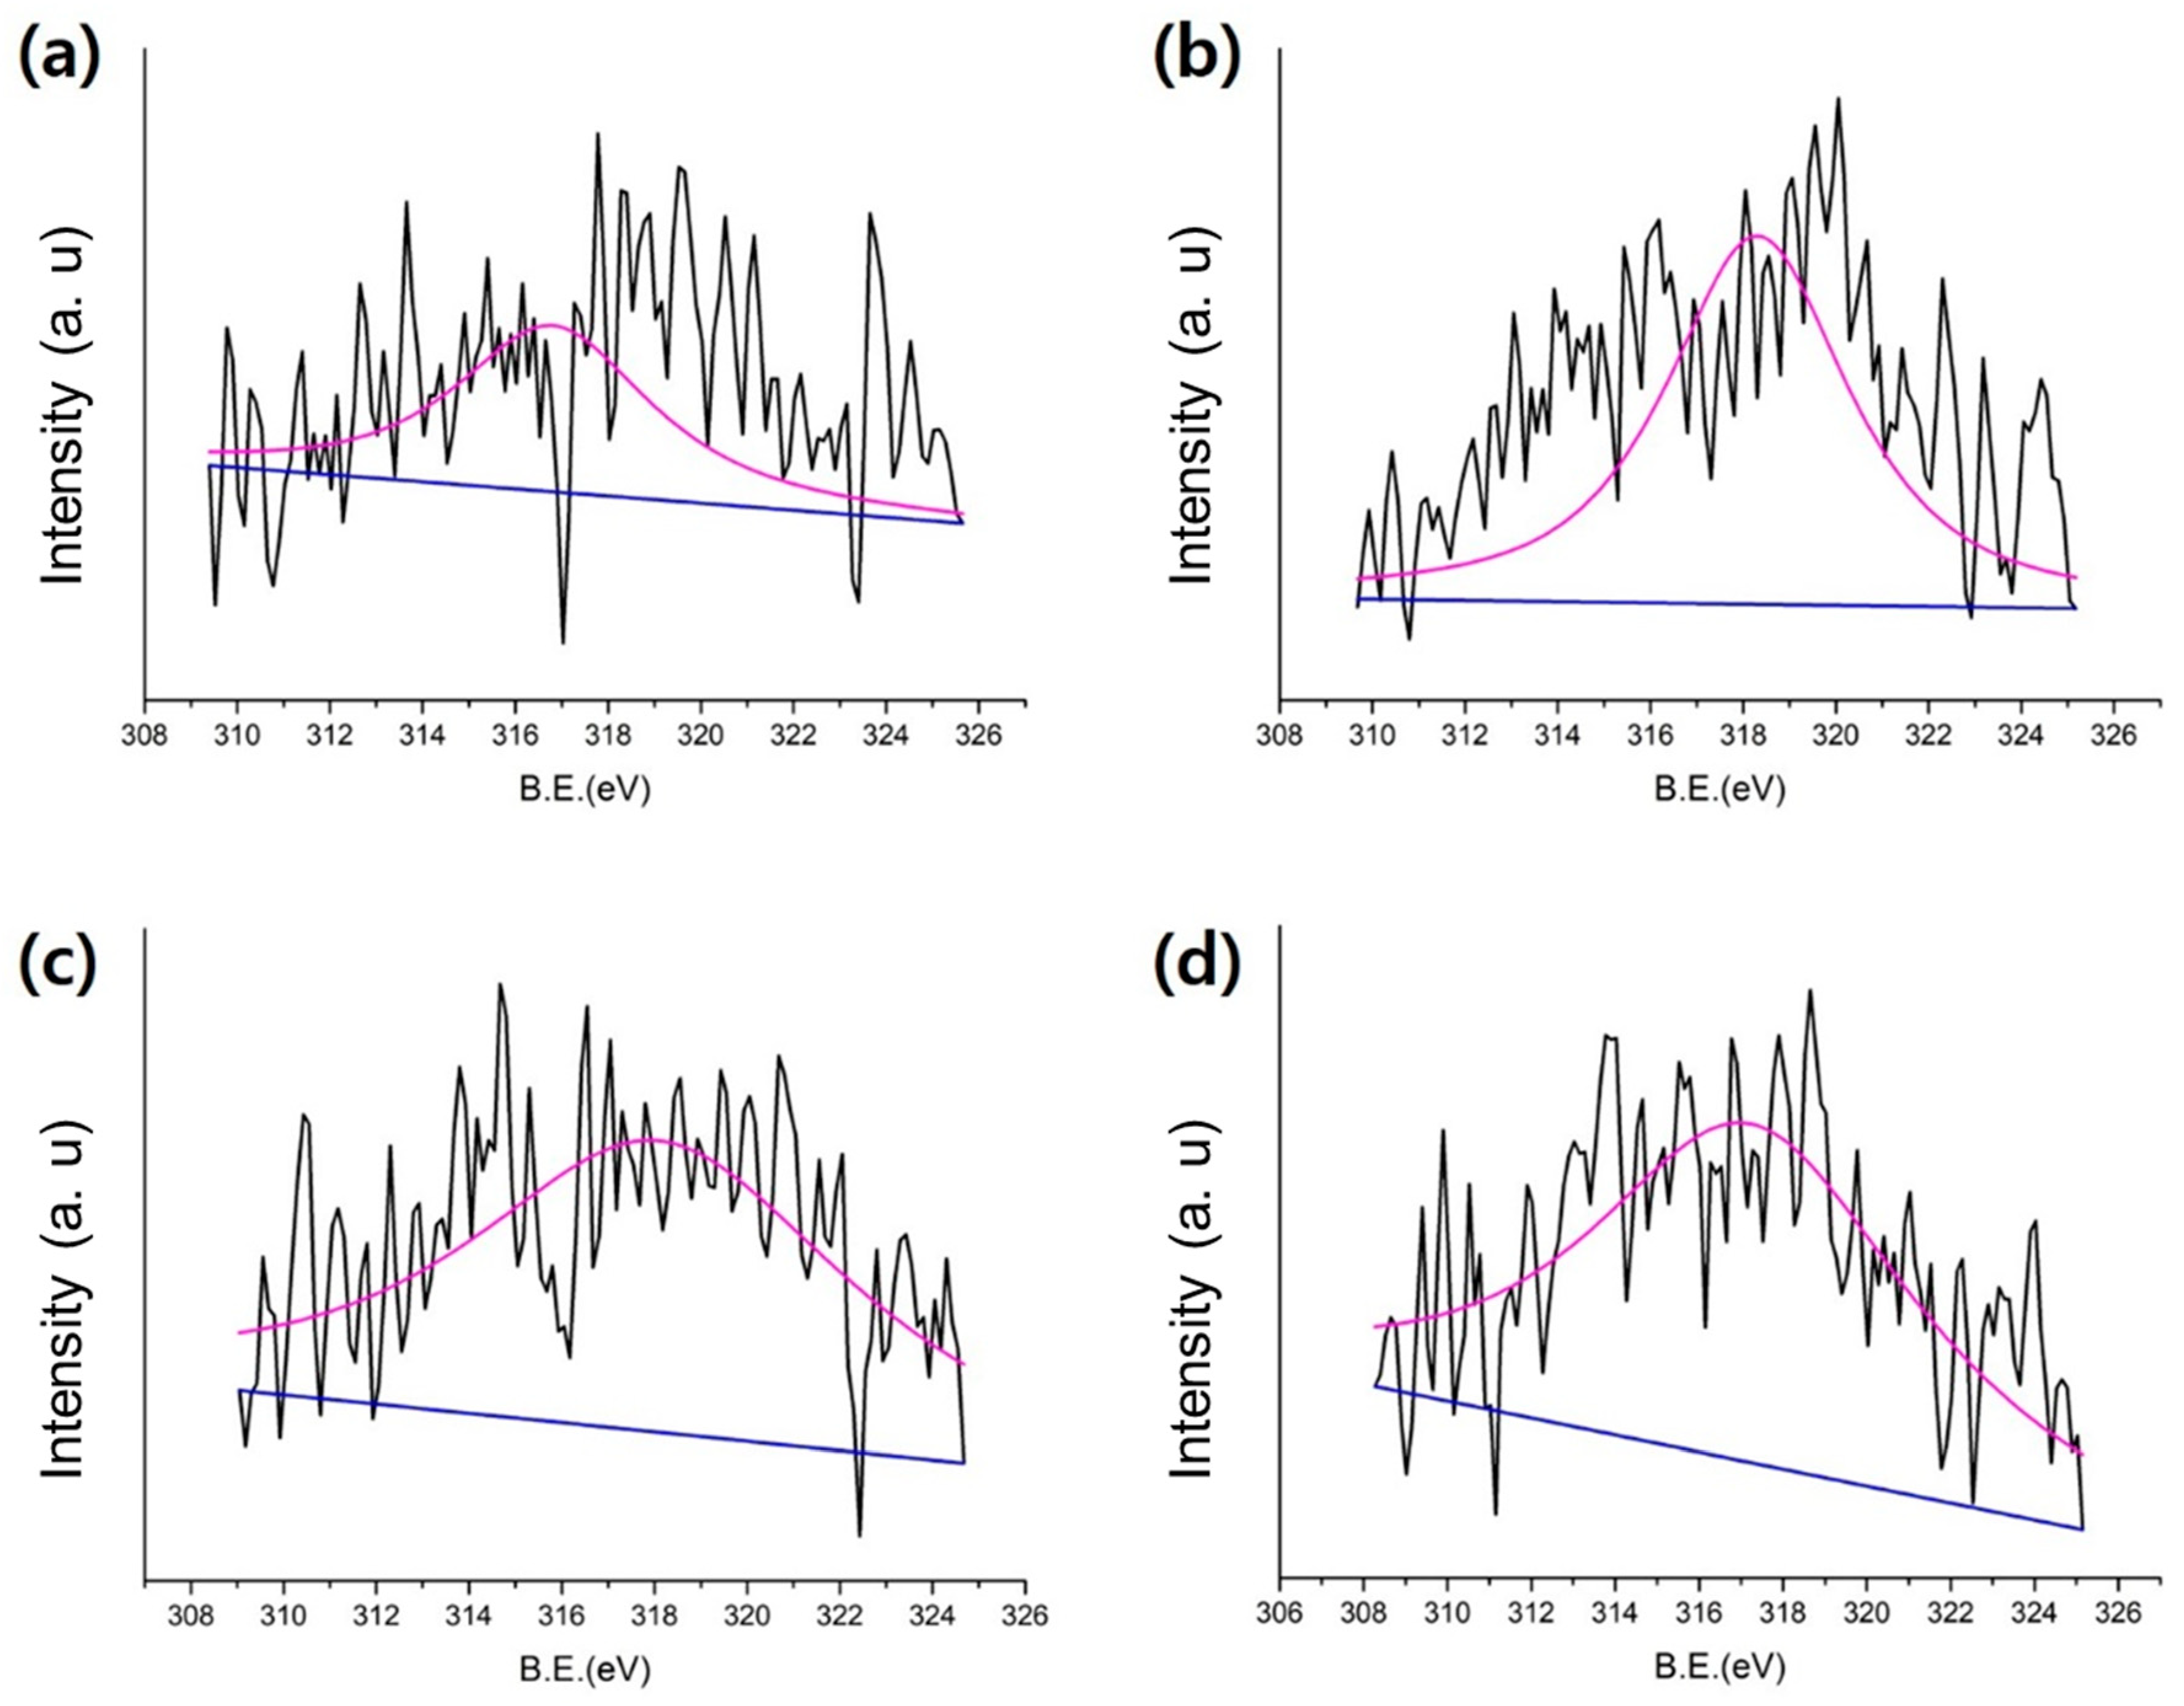
XPS spectra after depth-profiling sputtering with Ar ions for SR550 and Cal600 catalysts are shown in Figure 9. The results support the hypothesis that the surfaces of both metallic Pt or Pt–Sn alloys in the SR550 catalyst are covered with Sn. There was no change in the peak area of the Pt 4d for Cal600 catalyst after Ar ion sputtering for 6 and 18 s. On the other hand, the Pt 4d peak area of the SR550 catalyst after 18 s of Ar ion sputtering is larger than that after 6 s of Ar ion sputtering. The effect of Sn enrichment on the Pt particle surface has been reported elsewhere [9,22]. Zhu et al. [9] reported a Sn-surface-enriched Pt–Sn bimetallic nanoparticle catalyst prepared on a MgAl2O4 support using an organometallic chemistry concept, and the catalyst exhibited high selectivity and stability during the PDH reaction. Experiments by Deng and colleagues have shown that highly dispersed Sn-surface-enriched Pt–Sn alloy nanoparticles are formed when Pt–Sn/SiO2 catalysts are prepared by direct reduction [22]. In addition, when Pt is in a very electron-rich state, the dehydrogenation activity of n-butane could be greatly improved by the strong interaction of Pt and SnO2 (SMSI). Therefore, we can propose that the synergistic effect of the interaction of Pt and Sn covering the surface of Pt, as well as the accessible Pt sites, could improve the dehydrogenation performance of the catalyst prepared by the direct reduction method.
3. Discussion
The reduction time in the direct reduction method is less than the typical time required for calcination. In addition, the catalyst might be affected by the Pt and Sn precursors left behind because of the omission of a calcination step. According to Arteaga [25], the dispersion of Pt particles is due to oxychlorination with chlorine compounds followed by reduction. It was hypothesized that the calcination method may remove a considerable amount of chlorine originating from the Pt and Sn precursors. This can cause oxychlorination before the reduction treatment. However, in the direct reduction method, oxychlorination and reduction occur simultaneously in the presence of chlorine from the precursors, which enhances the Pt dispersion and results in the formation of the Pt3Sn alloy.
The XRD intensity ratios are listed in Table 1. These values were determined from the peak area of reflections at 39.2° for the Pt3Sn alloy and 41.7° for the PtSn alloy. The peak areas were measured after baseline adjustment for the individual XRD patterns. The effects of catalyst preparation, direct reduction, and the PDH reaction were considered and compared. It should be noted that the XRD intensity ratio values for SR catalysts changed significantly but showed a mixed trend for each stage, unlike the Cal600 catalyst. In the case of the SR450 catalyst, the initial XRD intensity ratio value was 9.15, the highest value, but this rapidly decreased to 1.08, the lowest value, after direct reduction. As shown in Figure 4a, the characteristic XRD peaks of the Pt3Sn and PtSn alloys were all sharp, which can be attributed to an increase in size of both alloy particles. Larger metallic sites would result in reduced catalytic activity. This trend is similar to that of the SR500 catalyst. In the case of the SR550 catalyst, the highest value of the XRD peak ratio was obtained after direct reduction. In Figure 4c, XRD characteristic peaks of Pt3Sn and PtSn alloys are not sharp but broad, indicating an amorphous-like state. The dominance of Pt3Sn alloy over PtSn alloy also induced the greatest production of coke after the PDH reaction. This result is consistent with the high propane conversion and propylene selectivity of the SR550 catalyst. Lower catalytic performance was observed for the SR600 catalyst. The XRD peak ratio values were decreased significantly in the SR600 catalyst.
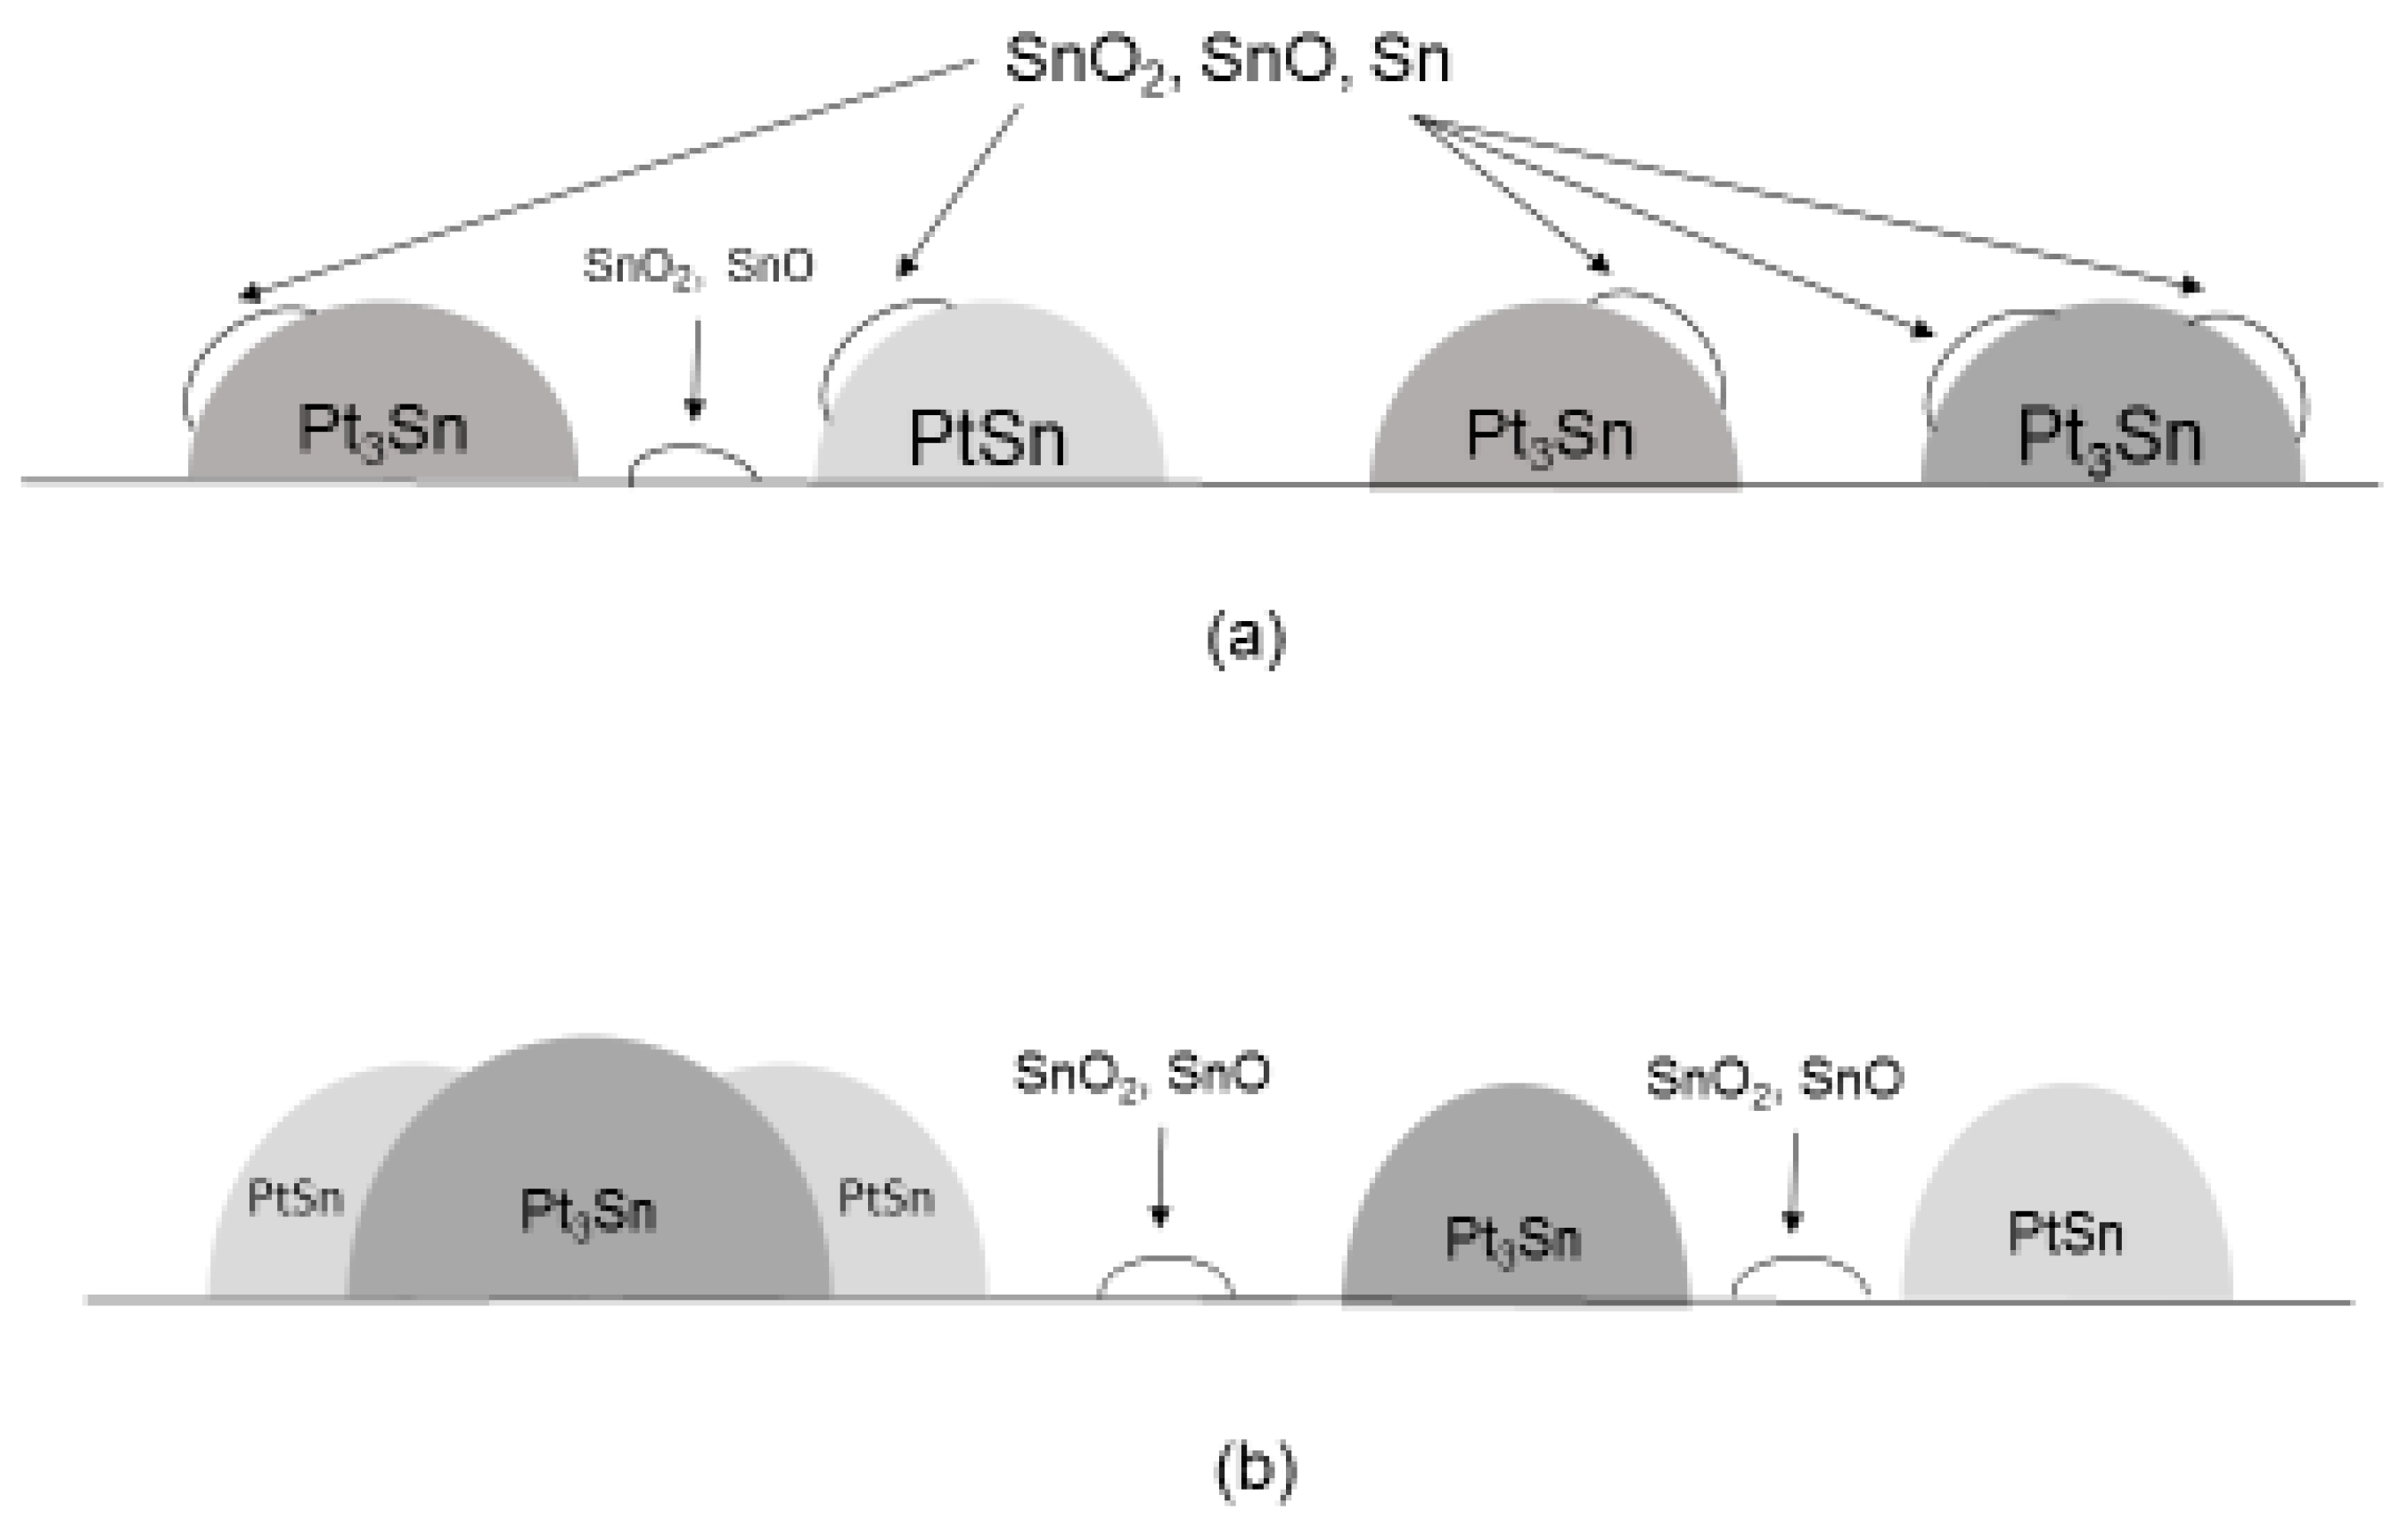
In Figure 10, hypothetical models of the catalyst dispersion are shown. In the case of the Cal600 catalyst, the large metal alloy particles are dispersed over the support, which may be covered with Sn and/or SnO2. Meanwhile, smaller alloy particles and a support only partly covered with SnO2 is shown for the SR550 catalyst. Based on Figure 8, the population of Pt3Sn alloy particles may be greater in the SR550 catalyst. In addition, metallic Sn could be present on the alloy surface. We have interpreted the presence of zero-valent Sn in Figure 8B as evidence of both Sn in alloys and isolated Sn particles.
4. Materials and Methods
4.1. Catalyst Preparation
Hydrogen hexachloroplatinate, (H2PtCl6·5.5H2O, Kojima Chemicals, Saitama, Japan) and stannous chloride (SnCl2, Sigma Aldrich, St. Louis, MO, USA) were used as metal precursors for the supported Pt–Sn catalysts. Al2O3 (γ-Al2O3, PURALOX® supplied by SASOL, Hamburg, Germany) was used as a catalyst support. H2PtCl6·5.5H2O and SnCl2 were dissolved in ethanol (C2H5OH, 99.5%, Daejung, Seoul, Korea), and Al2O3 was co-impregnated with these precursors. The co-impregnated Pt–Sn/Al2O3 catalyst was dried at 110 °C for 12 h. Subsequently, the Pt–Sn/Al2O3 catalysts were prepared by direct reduction at temperatures from 450 to 900 °C under H2:N2 flow (90 mL/min). The Pt content was controlled to be 3 wt.%, and the Sn content was 1.8 wt.%. It should be noted that direct reduction was performed immediately after drying the catalyst without calcination. Each SR sample was kept at the final reduction temperature for 30 min. Then, the sample was cooled or heated to 500 °C (10 °C/min) under H2, N2 flow (90 mL/min). Then, the catalyst samples were kept at 500 °C for 60 min again. For comparison, a calcined catalyst was also prepared (Cal600). Calcination was performed at 600 °C for 240 min in air.
4.2. Catalytic Activity Measurements
The catalytic activity during the PDH reaction was evaluated in a fixed-bed reactor (quartz, inner diameter 18 mm) using 0.1 g of each catalyst (20–40 mesh). The PDH reaction was carried out at 600 °C for 5 h at atmospheric pressure in the presence of C3H8 (30 mL/min), H2 (30 mL/min), and N2 (70 mL/min). Before the PDH reaction, the samples were heated to 600 °C at 10 °C/min in the presence of H2 (30 mL/min) and N2 (100 mL/min). The reaction product was collected at various time intervals, subsequently being analyzed by gas chromatography (flame ionization detector, 5890 Series2 Plus, Hewlett Packard, Wilmington, DE, USA). A 50 m × 0.53 mm GS-Alumina capillary column was used.
4.3. Characterization
XRD patterns were measured using a SMART LAB X-ray diffractometer (Rigaku, Tokyo, Japan) with Cu-Kα radiation. The X-ray tube was operated at 40 kV and 200 mA. XRD patterns were obtained from 2θ = 34° to 48° at a scanning speed of 4°/min. TEM images were obtained using an FEI TEM (TitanTM 80–300, Hillsboro, OR, USA) operating at an accelerating voltage of 300 kV. In addition, XPS spectra were obtained with a PHI 5000 Versa Probe spectrometer (Ulvac-PHI, Kanagawa, Japan) equipped with a monochromatic electro analyzer and a monochromatic Al-Kα 150 W X-ray source.
5. Conclusions
Pt–Sn/Al2O3 catalysts were prepared by direct reduction at temperatures from 450 to 900 °C, denoted SR450 to SR900 according to the reduction temperature. Direct reduction was performed by reduction treatment of the catalysts immediately after drying without conventional calcination. The effect of direct reduction was analyzed by comparison of the activity with that of a conventionally prepared catalyst (Cal600). Concerning catalytic performance, the SR catalysts showed overall higher values for the conversion of propane, as well as propylene selectivity, compared to Cal600. Of the SR catalysts, SR550 showed the highest activity. The direct reduction method results in the formation of different Pt–Sn alloys, and PtSn and Pt3Sn alloys were identified. A larger amount of Pt3Sn and a smaller amount of PtSn alloy was formed after direct reduction when the precursor ratio of Pt/Sn was 3 to 1.8 by weight (1:1 by mole), which is consistent with the literature [21]. This might be attributed to the difference in catalyst support. In our case, Al2O3 may provide more favorable conditions to form the Pt3Sn alloy than the SiO2 support during direct reduction. However, we agree that PtSn alloy can be formed on both supports, but the rearrangement of different alloys may occur when a direct reduction process is employed. Cal600 was found to contain larger metal particles, whereas the SR catalysts have nano-sized metal particles. Possibly, metal redistribution occurred during hydrogen reduction. The formation of smaller metal particles formed during reduction can result in increased interactions between nano-sized Pt and nano-size Sn particles. From a stoichiometric point of view, more Pt particles than Sn particles can interact to form a Pt3Sn alloy. In this study, the highest activity was obtained when a reduction temperature of 550 °C was used. In addition, the coke behavior was analyzed by DTA. The DTA curve for Cal600 has one inflection point. However, the DTA plots of the SR catalysts contained two inflection points, and the second peak is related to the coke "drain-off" effect. When the PDH reaction proceeds, coke is generated. High activity catalysts could generate more coke, which would accumulate and cover the catalyst active sites. The well-dispersed Pt3Sn alloy may accelerate the PDH reaction and generate more coke. However, the coke can migrate to the edge of Pt3Sn alloy and/or PtxSny (x/y > 3) alloy, resulting in the preservation of active sites, allowing the PDH reaction to proceed for longer.
Author Contributions
The experimental work was designed and performed by J.-W.J.; W.-I.K. and J.-R.K. analyzed the data; writing, review, and editing was done by K.S.O.; and writing and original draft preparation was done by H.L.K.
Funding
This work was financed by Basic Science Research Program through the National Research Foundation of Korea (NRF) funded by the Ministry of Education (2017R1D1A1B03034244).
Conflicts of Interest
The authors declare no conflicts of interest.
References
- Sattler, J.J.H.B.; Ruiz-Martinez, J.; Santillan-Jimenez, E.; Weckhuysen, B.M. Catalytic dehydrogenation of light alkanes on metals and metal oxides. Chem. Rev. 2014, 114, 10613–10653. [Google Scholar] [CrossRef] [PubMed]
- Nawaz, Z. Light alkane dehydrogenation to light olefin technologies: A comprehensive review. Rev. Chem. Eng. 2015, 31, 413–436. [Google Scholar] [CrossRef]
- Vu, B.K.; Song, M.B.; Ahn, I.Y.; Suh, Y.W.; Suh, D.J.; Kim, W.I.; Koh, H.L.; Choi, Y.G.; Shin, E.W. Pt–Sn alloy phases and coke mobility over Pt–Sn/Al2O3and Pt–Sn/ZnAl2O4catalysts for propane dehydrogenation. Appl. Catal. A Gen. 2011, 400, 25–33. [Google Scholar] [CrossRef]
- Seo, H.; Kwon, J.; Gi, U.; Park, G.; Yoo, Y.; Lee, J.; Chang, H.; Kyu, I. Direct dehydrogenation of n-butane over Pt/Sn/M/γ-Al2O3 catalysts: Effect of third metal (M) addition. CATCOM 2014, 47, 22–27. [Google Scholar] [CrossRef]
- Iglesias-Juez, A.; Beale, A.M.; Maaijen, K.; Weng, T.C.; Glatzel, P.; Weckhuysen, B.M. A combined in situ time-resolved UV-Vis, Raman and high-energy resolution X-ray absorption spectroscopy study on the deactivation behavior of Pt and PtSn propane dehydrogenation catalysts under industrial reaction conditions. J. Catal. 2010, 276, 268–279. [Google Scholar] [CrossRef]
- Lee, H.; Kim, W.I.; Jung, K.D.; Koh, H. Effect of Cu promoter and alumina phases on Pt/Al2O3 for propane dehydrogenation. Korean J. Chem. Eng. 2017, 34, 1337–1345. [Google Scholar] [CrossRef]
- Shan, Y.; Sui, Z.; Zhu, Y.; Chen, D.; Zhou, X. Effect of steam addition on the structure and activity of Pt–Sn catalysts in propane dehydrogenation. Chem. Eng. J. 2015, 278, 240–248. [Google Scholar] [CrossRef]
- Hauser, A.W.; Gomes, J.; Bajdich, M.; Head-Gordon, M.; Bell, A.T. Subnanometer-sized Pt/Sn alloy cluster catalysts for the dehydrogenation of linear alkanes. Phys. Chem. Chem. Phys. 2013, 15, 20727–20734. [Google Scholar] [CrossRef]
- Zhu, H.; Anjum, D.H.; Wang, Q.; Abou-Hamad, E.; Emsley, L.; Dong, H.; Laveille, P.; Li, L.; Samal, A.K.; Basset, J. Sn surface-enriched Pt – Sn bimetallic nanoparticles as a selective and stable catalyst for propane dehydrogenation. J. Catal. 2014, 320, 52–62. [Google Scholar] [CrossRef]
- Deng, L.; Shishido, T.; Teramura, K.; Tanaka, T. Effect of reduction method on the activity of Pt–Sn/SiO2 for dehydrogenation of propane. Catal. Today 2014, 232, 33–39. [Google Scholar] [CrossRef]
- Pham, H.N.; Anderson, A.E.; Johnson, R.L.; Schwartz, T.J.; O’Neill, B.J.; Duan, P.; Schmidt-Rohr, K.; Dumesic, J.A.; Datye, A.K. Carbon Overcoating of Supported Metal Catalysts for Improved Hydrothermal Stability. ACS Catal. 2015, 5, 4546–4555. [Google Scholar] [CrossRef]
- Bhasin, M.M.; McCain, J.H.; Vora, B.V.; Imai, T.; Pujadó, P.R. Dehydrogenation and oxydehydrogenation of paraffins to olefins. Appl. Catal. A Gen. 2001, 221, 397–419. [Google Scholar] [CrossRef]
- Larese, C.; Campos-Martin, J.M.; Calvino, J.J.; Blanco, G.; Fierro, J.L.G.; Kang, Z.C. Alumina- and Alumina–Zirconia-Supported PtSn Bimetallics: Microstructure and Performance for the n-Butane ODH Reaction. J. Catal. 2002, 208, 467–478. [Google Scholar] [CrossRef]
- Zhang, Y.; Zhou, Y.; Yang, K.; Li, Y.; Wang, Y.; Xu, Y.; Wu, P. Effect of hydrothermal treatment on catalytic properties of PtSnNa/ZSM-5 catalyst for propane dehydrogenation. Microporous Mesoporous Mater. 2006, 96, 245–254. [Google Scholar] [CrossRef]
- Huang, L.; Xu, B.; Yang, L.; Fan, Y. Propane dehydrogenation over the PtSn catalyst supported on alumina-modified SBA-15. Catal. Commun. 2008, 9, 2593–2597. [Google Scholar] [CrossRef]
- Del Angel, G.; Bonilla, A.; Peña, Y.; Navarrete, J.; Fierro, J.L.G.; Acosta, D.R. Effect of lanthanum on the catalytic properties of PtSn/γ-Al2O3 bimetallic catalysts prepared by successive impregnation and controlled surface reaction. J. Catal. 2003, 219, 63–73. [Google Scholar] [CrossRef]
- Zangeneh, F.T.; Mehrazma, S.; Sahebdelfar, S. The influence of solvent on the performance of Pt–Sn/θ-Al2O3 propane dehydrogenation catalyst prepared by co-impregnation method. Fuel Process. Technol. 2013, 109, 118–123. [Google Scholar] [CrossRef]
- Vu, B.K.; Song, M.B.; Ahn, I.Y.; Suh, Y.W.; Suh, D.J.; Kim, W. Il; Koh, H.L.; Choi, Y.G.; Shin, E.W. Propane dehydrogenation over Pt–Sn/Rare-earth-doped Al2O3: Influence of La, Ce, or Y on the formation and stability of Pt–Sn alloys. Catal. Today 2011, 164, 214–220. [Google Scholar] [CrossRef]
- Kikuchi, I.; Ohshima, M.; Kurokawa, H.; Miura, H. Effect of Sn Addition on n-Butane Dehydrogenation over Alumina-supported Pt Catalysts Prepared by Co-impregnation and Sol-gel Methods. J. Jpn Pet. Inst. 2012, 55, 206–213. [Google Scholar] [CrossRef]
- Praserthdam, P.; Grisdanurak, N.; Yuangsawatdikul, W. Coke formation over Pt–Sn-K/Al2O3 in C3, C5-C8 alkane dehydrogenation. Chem. Eng. J. 2000, 77, 215–219. [Google Scholar] [CrossRef]
- Deng, L.; Miura, H.; Shishido, T.; Hosokawa, S.; Teramura, K.; Tanaka, T. Dehydrogenation of propane over silica-supported platinum-tin catalysts prepared by direct reduction: Effects of tin/platinum ratio and reduction temperature. ChemCatChem 2014, 6, 2680–2691. [Google Scholar] [CrossRef]
- Deng, L.; Miura, H.; Shishido, T.; Wang, Z.; Hosokawa, S.; Teramura, K.; Tanaka, T. Elucidating strong metal-support interactions in Pt–Sn/SiO2catalyst and its consequences for dehydrogenation of lower alkanes. J. Catal. 2018, 365, 277–291. [Google Scholar] [CrossRef]
- Hee Kim, G.; Jung, K.-D.; Kim, W.-I.; Um, B.-H.; Shin, C.-H.; Oh, K.; Lim Koh, H. Effect of oxychlorination treatment on the regeneration of Pt–Sn/Al2O3 catalyst for propane dehydrogenation. Res. Chem. Intermed. 2015, 42. [Google Scholar] [CrossRef]
- Deng, L.; Arakawa, T.; Ohkubo, T.; Miura, H.; Shishido, T.; Hosokawa, S.; Teramura, K.; Tanaka, T. Highly Active and Stable Pt−Sn/SBA-15 Catalyst Prepared by Direct Reduction for Ethylbenzene Dehydrogenation: E ff ects of Sn Addition. Ind. Eng. Chem. Res. 2017, 56, 7160–7172. [Google Scholar] [CrossRef]
- Arteaga, G.J.; Anderson, J.A.; Becker, S.M.; Rochester, C.H. Influence of oxychlorination treatment on the surface and bulk properties of a Pt–Sn/Al2O3 catalyst. J. Mol. Catal. A Chem. 1999, 145, 183–201. [Google Scholar] [CrossRef]
Figure 1.
Propane conversion over Pt–Sn/Al2O3. Reaction conditions: catalyst weight, 0.1 g; reaction temperature, 600 °C; and flow rate, H2:C3H8 = 32:32 (mL/min).
Figure 1.
Propane conversion over Pt–Sn/Al2O3. Reaction conditions: catalyst weight, 0.1 g; reaction temperature, 600 °C; and flow rate, H2:C3H8 = 32:32 (mL/min).
Figure 2.
Propylene selectivity of Pt–Sn/Al2O3. Reaction conditions: catalyst weight, 0.1 g; reaction temperature, 600 °C; and flow rate, H2:C3H8 = 32:32 (mL/min).
Figure 2.
Propylene selectivity of Pt–Sn/Al2O3. Reaction conditions: catalyst weight, 0.1 g; reaction temperature, 600 °C; and flow rate, H2:C3H8 = 32:32 (mL/min).
Figure 3.
XRD patterns of Pt–Sn/Al2O3 catalysts after catalyst preparation.
Figure 4.
XRD patterns of Pt–Sn/Al2O3 catalysts after pre-reduction at 600 °C for 1 h under a hydrogen atmosphere.
Figure 4.
XRD patterns of Pt–Sn/Al2O3 catalysts after pre-reduction at 600 °C for 1 h under a hydrogen atmosphere.
Figure 5.
TEM images of (a) SR450, (b) SR550, (c) SR900, and (d) Cal600.
Figure 6.
EDS analysis of (a,b) SR550 and (c,d) Cal600.
Figure 7.
DTA curves of the Pt–Sn/Al2O3 catalysts. Inflection points of SR450 were observed at 417.62 and 494.38 °C, SR500 = 454.29 and 492.97 °C, SR550 = 439.61 and 482.68 °C, SR600 = 429.71 and 503.27 °C, and Cal600 = 450.16 °C.
Figure 7.
DTA curves of the Pt–Sn/Al2O3 catalysts. Inflection points of SR450 were observed at 417.62 and 494.38 °C, SR500 = 454.29 and 492.97 °C, SR550 = 439.61 and 482.68 °C, SR600 = 429.71 and 503.27 °C, and Cal600 = 450.16 °C.
Figure 8.
XPS Pt 4f spectra of (a) SR550, (b) Cal 600 and Sn 3d spectra of (c) SR550, and (d) Cal 600.
Figure 8.
XPS Pt 4f spectra of (a) SR550, (b) Cal 600 and Sn 3d spectra of (c) SR550, and (d) Cal 600.

Figure 9.
XPS Ar sputter profile Pt 4d spectra of (a) SR550 6s, (b) SR550 18s, (c) Cal600 6s, and (d) Cal600 18s (B.E. = binding energy).
Figure 9.
XPS Ar sputter profile Pt 4d spectra of (a) SR550 6s, (b) SR550 18s, (c) Cal600 6s, and (d) Cal600 18s (B.E. = binding energy).
Figure 10.
Hypothetical models of dispersed metals on Al2O3 support. (a) Conceptual metal dispersion after direct-reduction for SR550 catalyst. (b) Conceptual metal dispersion for Cal600 catalyst.
Figure 10.
Hypothetical models of dispersed metals on Al2O3 support. (a) Conceptual metal dispersion after direct-reduction for SR550 catalyst. (b) Conceptual metal dispersion for Cal600 catalyst.

Table 1.
Amount of coke and XRD peak ratios in the Pt3Sn and PtSn alloys after catalyst preparation, direct reduction, and PDH reaction.
Table 1.
Amount of coke and XRD peak ratios in the Pt3Sn and PtSn alloys after catalyst preparation, direct reduction, and PDH reaction.
| Catalyst | XRD (IPt3Sn/IPtSn) After Preparation | XRD (IPt3Sn/IPtSn) After Reduction | XRD (IPt3Sn/IPtSn) After Reaction | Coke (wt.%) |
|---|---|---|---|---|
| SR450 | 9.15 | 1.08 | 1.58 | 5.85 |
| SR500 | 5.16 | 1.55 | 1.58 | 7.86 |
| SR550 | 4.12 | 7.79 | 2.33 | 8.60 |
| SR600 | 6.97 | 2.48 | 3.21 | 7.04 |
| Cal600 | 1.62 | 1.63 | 1.54 | 4.00 |
© 2019 by the authors. Licensee MDPI, Basel, Switzerland. This article is an open access article distributed under the terms and conditions of the Creative Commons Attribution (CC BY) license (http://creativecommons.org/licenses/by/4.0/).
Share and Cite
MDPI and ACS Style
Jung, J.-W.; Kim, W.-I.; Kim, J.-R.; Oh, K.; Koh, H.L. Effect of Direct Reduction Treatment on Pt–Sn/Al2O3 Catalyst for Propane Dehydrogenation. Catalysts 2019, 9, 446. https://doi.org/10.3390/catal9050446
AMA Style
Jung J-W, Kim W-I, Kim J-R, Oh K, Koh HL. Effect of Direct Reduction Treatment on Pt–Sn/Al2O3 Catalyst for Propane Dehydrogenation. Catalysts. 2019; 9(5):446. https://doi.org/10.3390/catal9050446
Chicago/Turabian StyleJung, Jae-Won, Won-Il Kim, Jeong-Rang Kim, Kyeongseok Oh, and Hyoung Lim Koh. 2019. "Effect of Direct Reduction Treatment on Pt–Sn/Al2O3 Catalyst for Propane Dehydrogenation" Catalysts 9, no. 5: 446. https://doi.org/10.3390/catal9050446
Note that from the first issue of 2016, this journal uses article numbers instead of page numbers. See further details here.