Article

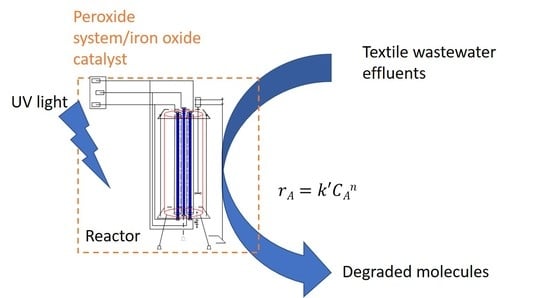
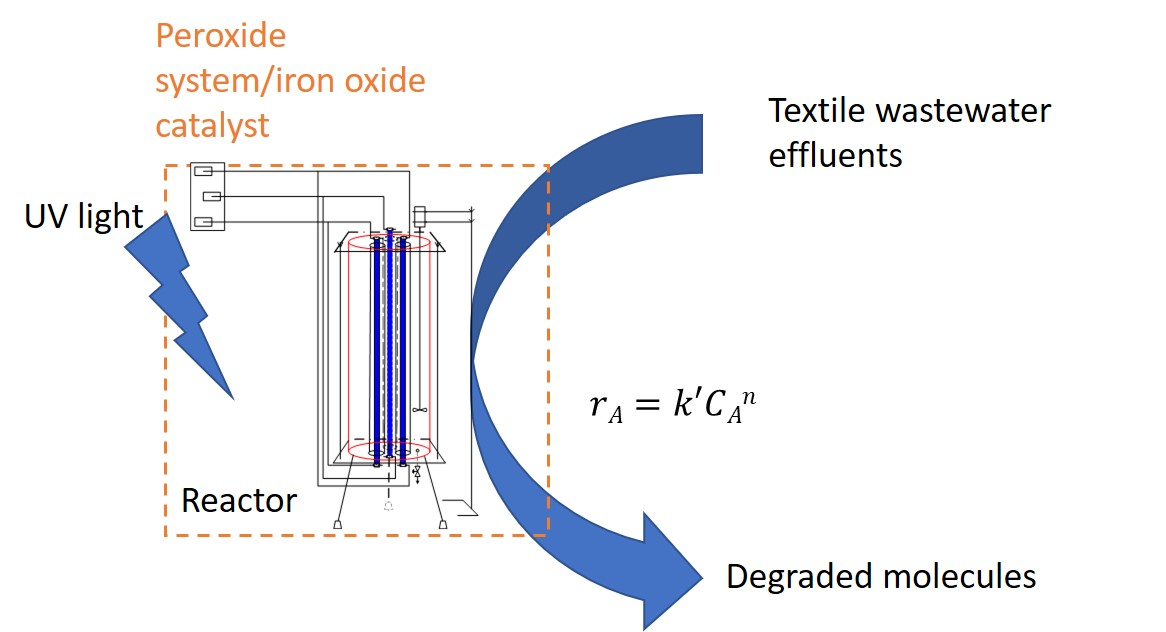
Catalytic Degradation of Textile Wastewater Effluent by Peroxide Oxidation Assisted by UV Light Irradiation

Department of Chemical Engineering, Faculty of Engineering, Universitas Gadjah Mada, Jl Grafika No 2, Yogyakarta 55281, Indonesia
*
Author to whom correspondence should be addressed.
Catalysts 2019, 9(6), 509; https://doi.org/10.3390/catal9060509
Submission received: 30 April 2019 / Revised: 30 May 2019 / Accepted: 30 May 2019 / Published: 4 June 2019
(This article belongs to the Special Issue Trends in Catalytic Wet Peroxide Oxidation Processes)

Abstract

:
Textile industries produce a complex wastewater which is difficult to be treated. In this work, a catalytic degradation of wastewater effluent composed of sulphur black coloring agent discharged by industry was studied. UV lamp power, peroxide concentration, pH, and iron oxide catalyst were varied to determine the best conditions for oxidative treatment. Kinetic parameters were evaluated based on the reaction model proposed. In the absence of iron oxide catalyst, chemical oxygen demand (COD) and biological oxygen demand (BOD) degradation of up to 80% and 75%, respectively, were observed as resulting from using an H2O2 concentration of 0.61 moles/L, UV lamp power of 30 watts, and pH of 6. When using an iron oxide catalyst combined with UV light irradiation, the degradation rate could be increased significantly, while similar final COD and BOD degradation percentages resulted. It is found that the reaction rate order was shifted from first order to second order when using an H2O2/UV/Fe2O3 system. The results could be an alternative for treating textile industry wastewater, and the parameters obtained can be used for equipment scale-up.

Graphical Abstract

1. Introduction

Textile industries produce wastewater which is considered dangerous for the environment. The combined waste from every process and stage can produce solutions with high chemical oxygen demand (COD), biological oxygen demand (BOD), thick color, and a total suspended solids (TSS) parameter which is alkaline [1]. It is reported that ~20% of dyes, which are the main component in wastewater effluent, are released to natural water environments [2,3,4]. Solutions with high COD and BOD can cause a rapid reduction in dissolved oxygen and are toxic to biological life if they are directly discharged into the environment. Furthermore, due to aesthetic concerns, the textile industry could face a serious challenge from the public to treat its dye effluent before releasing it to water bodies.
Traditional physical treatment can be used to treat wastewater effluent, with methods such as adsorption using activated carbon [5], ultrafiltration [6], ion exchange [7], and coagulation [8]. However, these treatments just transfer the pollutant to another phase, hence a further handling is needed. Destructive methods are an alternative approach, i.e., biological treatment using microorganisms and advanced oxidation processes (AOPs). Degradation by microorganism typically requires a large area and volume due to slow rates. Also, it is possible that dyes are adsorbed in the sludge, hence not degraded [9]. AOPs have the potential to be effective and efficient methods, since they can quickly destruct the contaminants, forming other acceptable constituents [10,11,12]. However, when the colorants are complexes, a modification of this process is necessary, like using photo assisted oxidation [13,14,15].
Fenton and photo-Fenton reactions have significant advantages compared to other advanced oxidation processes. Energy utilization is reduced due to the dark usage of cheap reagent hydrogen peroxide (H2O2) in a Fenton reaction. By adding iron, there will be more hydroxyl radical formation when H2O2 is mixed with wastewater following the reaction of Equation (1) [16].
F e 2 + + H 2 O 2 + H + F e 3 + + O H + H 2 O
UV radiation can decompose H2O2 more efficiently and initiate photo-reduction of ferric to ferrous iron. Free solar radiation can be utilized to carry out the photochemical stages of the photo-Fenton reaction so that complete mineralization of organic compounds is possible in a short period of time [17]. The photo-Fenton reaction has been proven to be efficient intreating water contaminated with a variety of organic and biological pollutants and in organic synthesis [18].
In this work, a comprehensive study was performed to obtain the optimal conditions to treat a complex and real textile wastewater effluent based on sulphur black coloring agent using Fenton reaction assisted by UV light irradiation. UV lamp power, peroxide concentration, pH and iron oxide catalyst were adjusted and their effects on the degradation of sulphur black wastewater were studied. Because the photo-Fenton reaction is very complex, reaction models for the reaction rate prediction are based on empirical correlations. The reaction behaviors using only UV and combination of UV and iron oxide catalyst is presented. We demonstrate that with a good combination of different factors, it is possible to treat wastewater quickly and effectively.

2. Results and Discussion

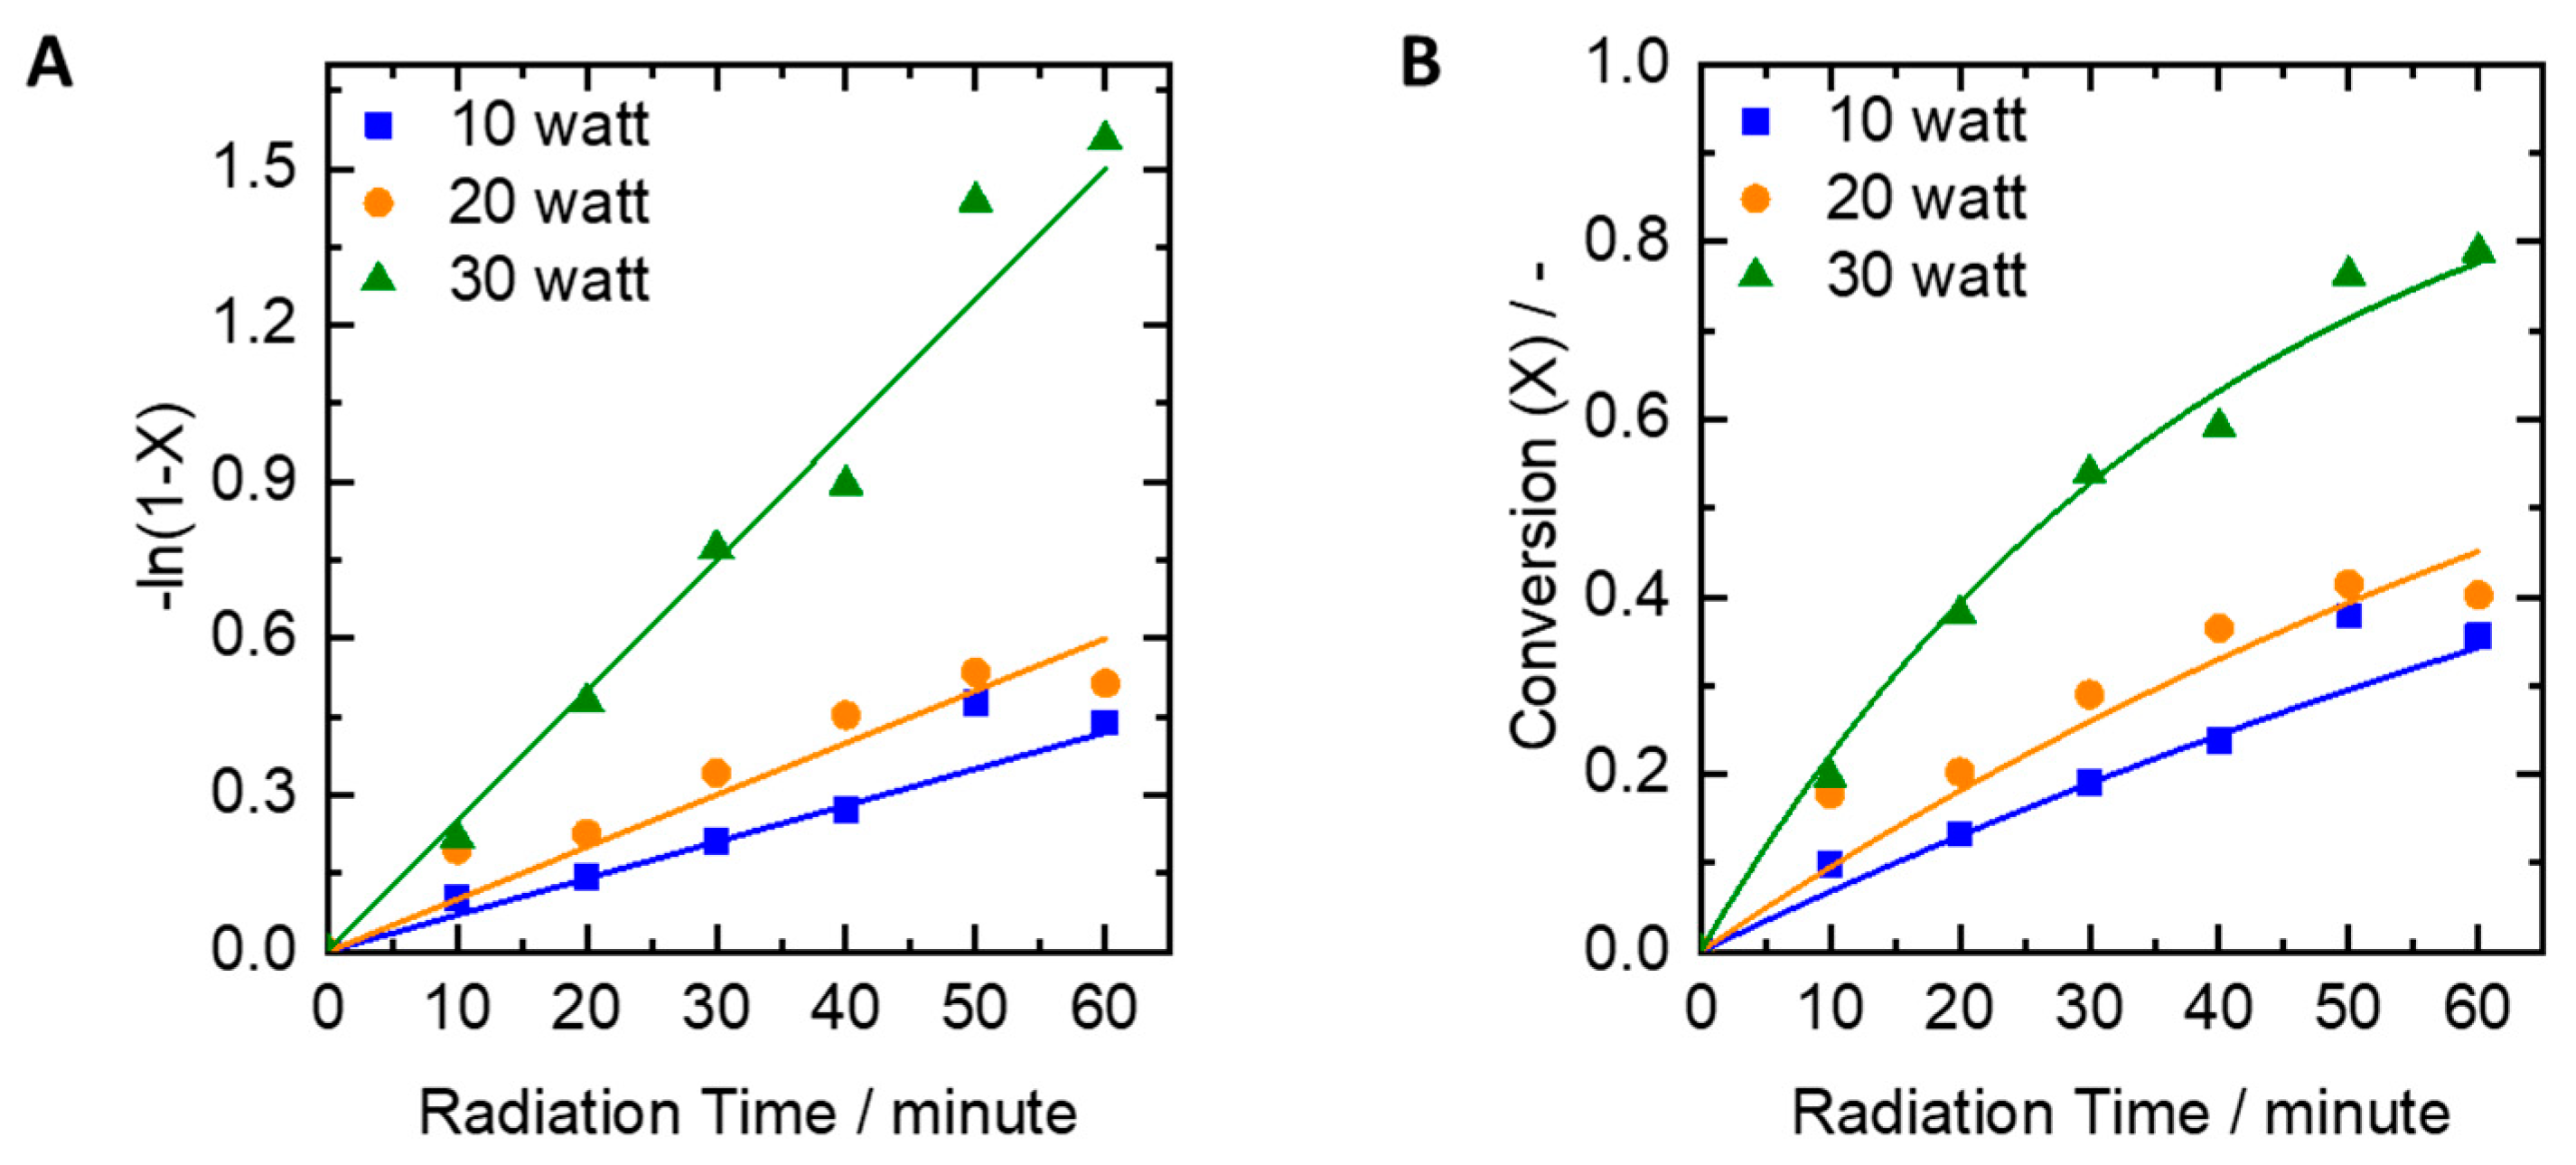
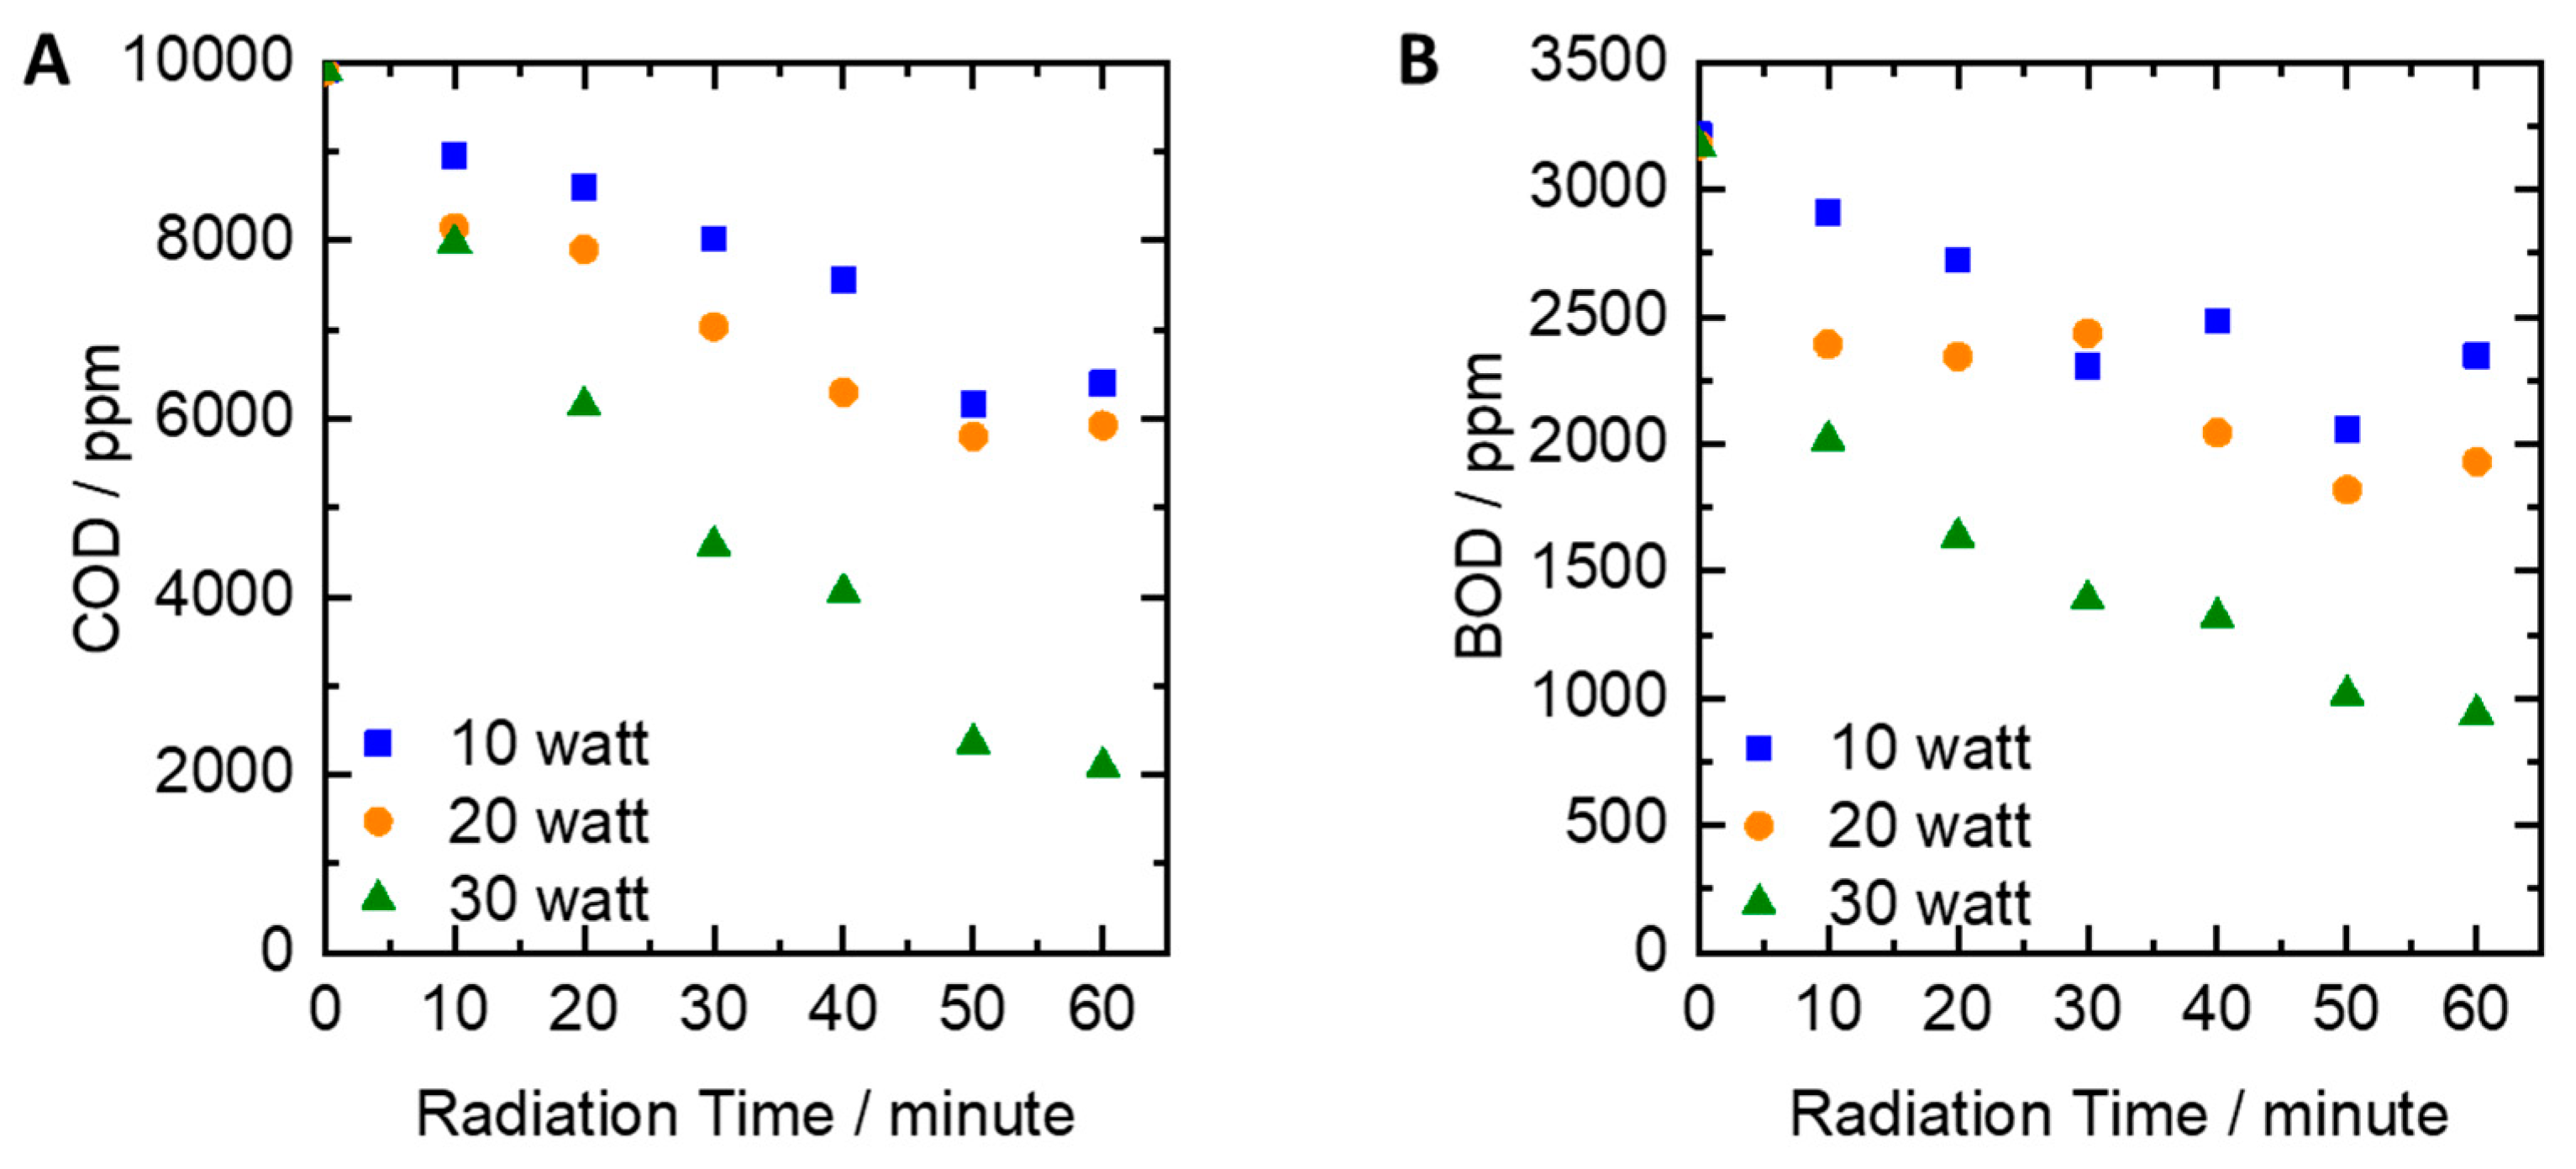
2.1. Influence of UV Lamp Power on the Dye Effluent Degradation

UV lamp power is one of the factors that influences textile wastewater degradation. The lamp power was varied to 10, 20, and 30 watts. Figure 1 shows that with the usage of stronger UV lamp power, the degradation of textile wastewater will be greater, as can be seen from COD (Figure 1a) and BOD (Figure 1b) values. That is because the stronger the UV lamp power is, the faster the decomposition rate of H2O2 to *OH radical will be. However, the increase of degradation seems not to be linear with increasing lamp power. There is only a slight change of degradation rates of COD and BOD with UV lamp powers of 10 and 20 watts. There is a deviation, that the BOD degradation rate at 30 min at 20 watts power was lower than the rate measured at 10 watts power. This is likely due to the limitations of measurement accuracy. When the UV lamp power was 30 watts, the degradation rates of COD and BOD were more powerful than those of 10 and 20 watts as shown by a strong decrease of COD and BOD values.
The influence of the research variable with the performance of oxidation reaction can be depicted from the reaction rate constant. The constant value of the reaction rate is the slope of the graph between −ln(1 − x) and reaction time. The relation between −ln(1 − x) and reaction time is shown in Figure 2a. The values of the constants used are summarized in Table 1. The higher the power of the UV lamp, the greater the value of the reaction rate constant. This can be seen from the UV lamp power of 30 watts, the reaction rate constant is 0.025 min−1. UV radiation has photonic energy of sufficient strength to break the chemical bonds. Absorption of a photon provides the energy required to force electrons into higher energy states. Upon absorbing sufficient energy, electrons may be freed from an atom. Some of this released energy becomes heat, fluorescence, or activating light by chemicals that can lead to a reaction, which does not exist in lightless media.
The correlation between lamp power with k’ value reviewed from COD degradation can be seen in Table 1. The greater the UV lamp power, the faster the reaction rate. This is because the UV lamp power of 30 watts can decompose and change hydrogen peroxide to hydroxyl radical optimally. This is marked by a 78.15% decrease of COD and a 70.45% decrease of BOD, with the k’ value of 0.025 min−1.

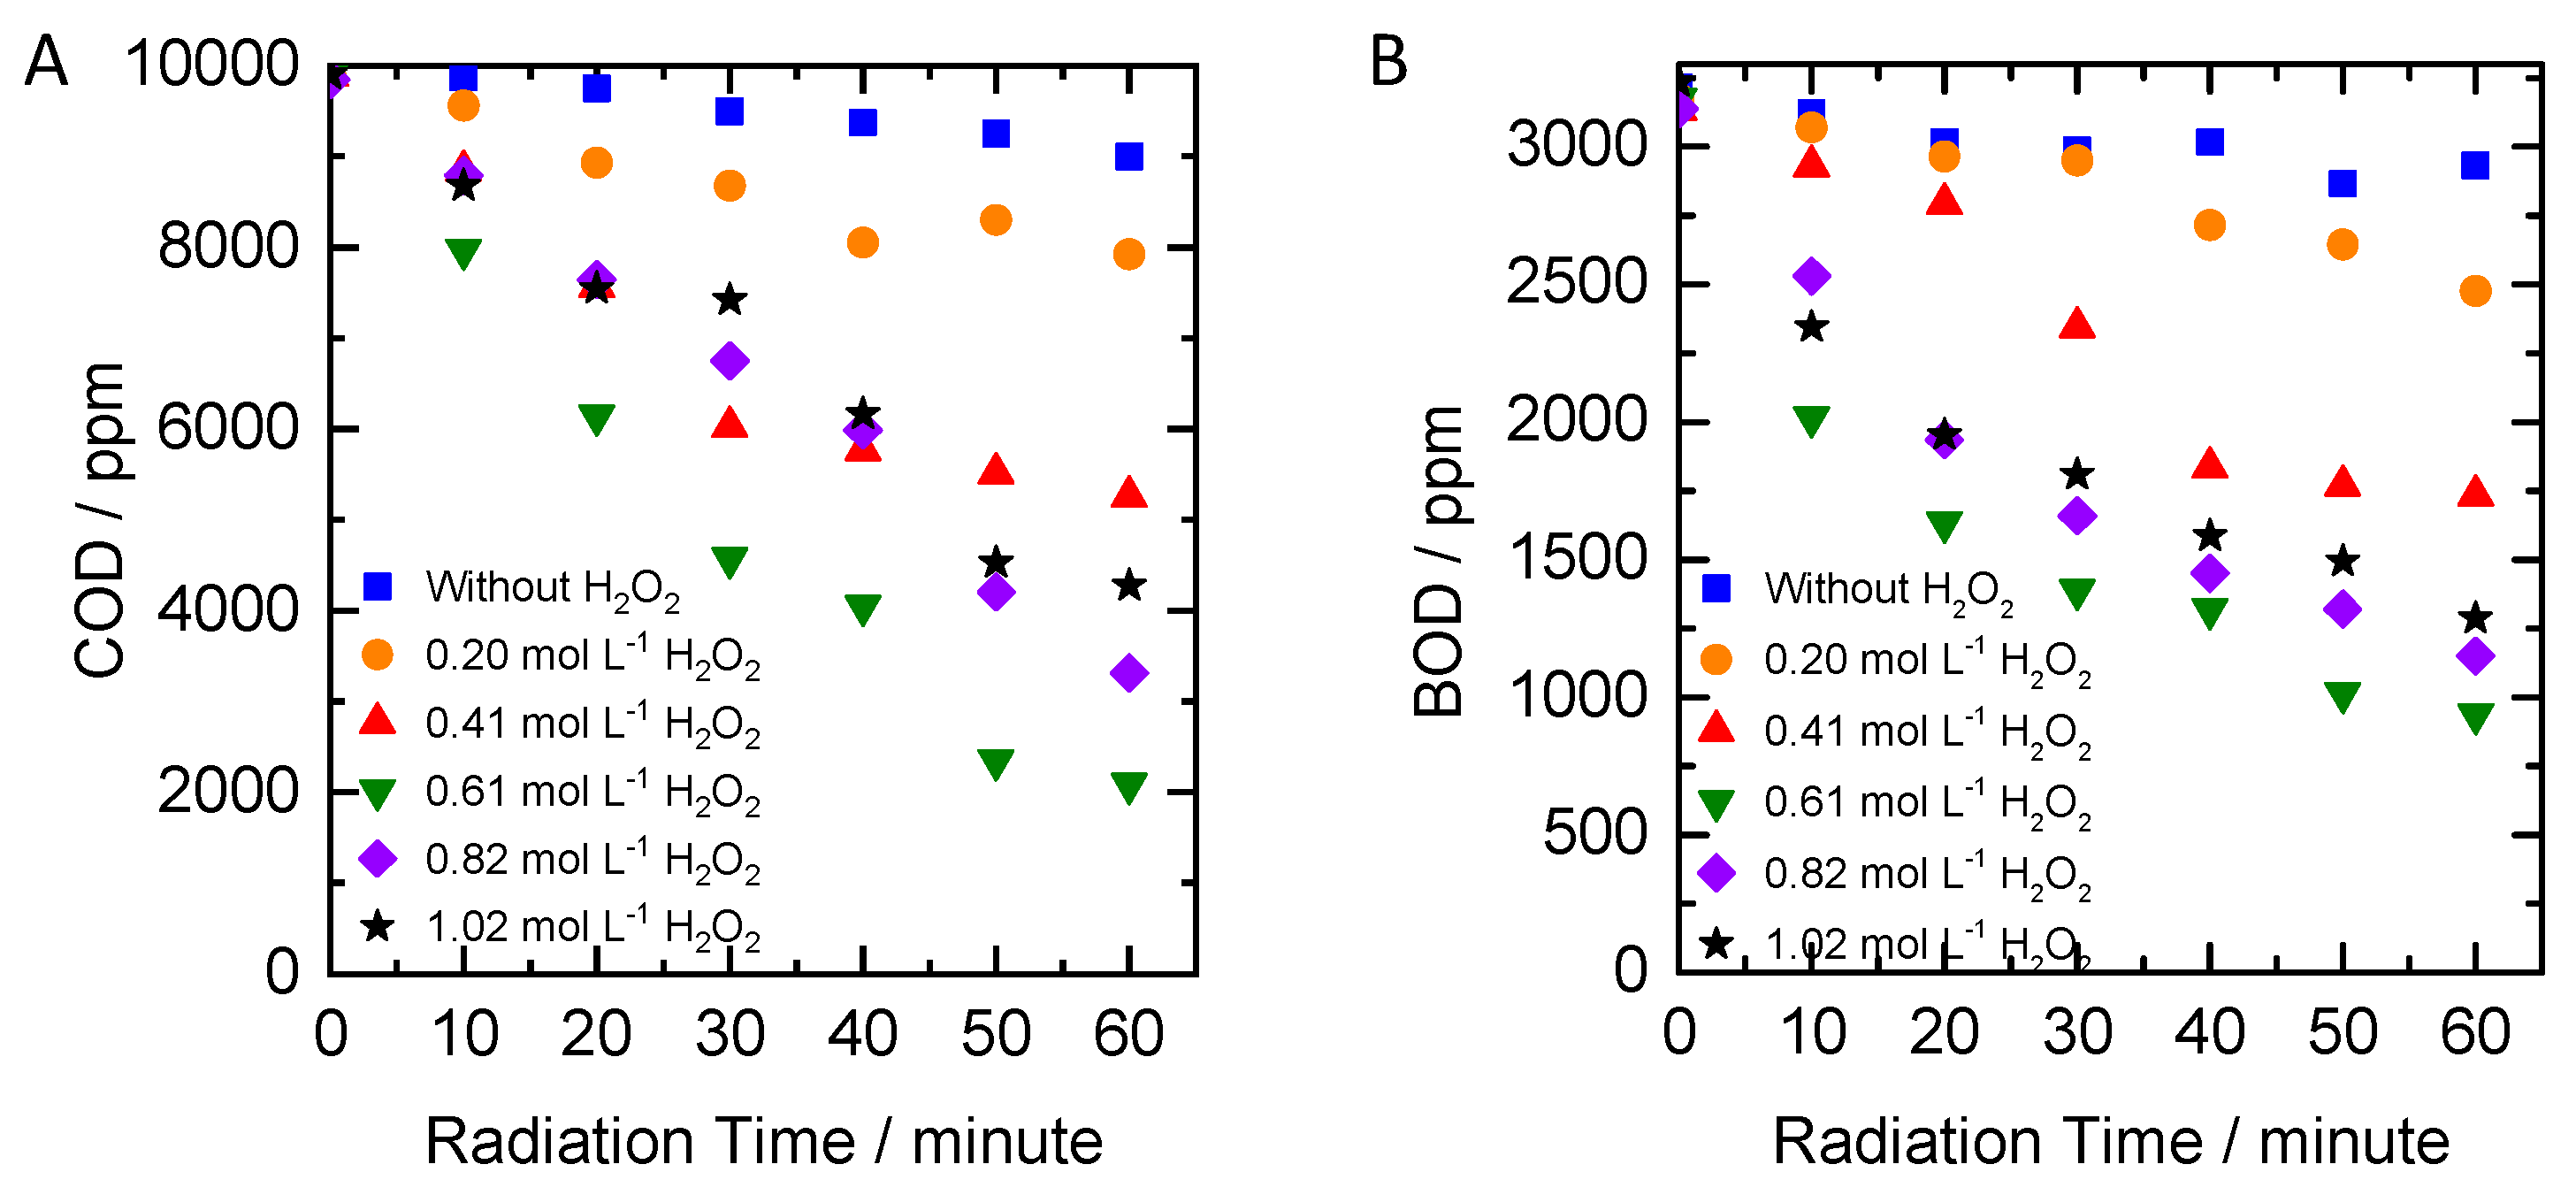
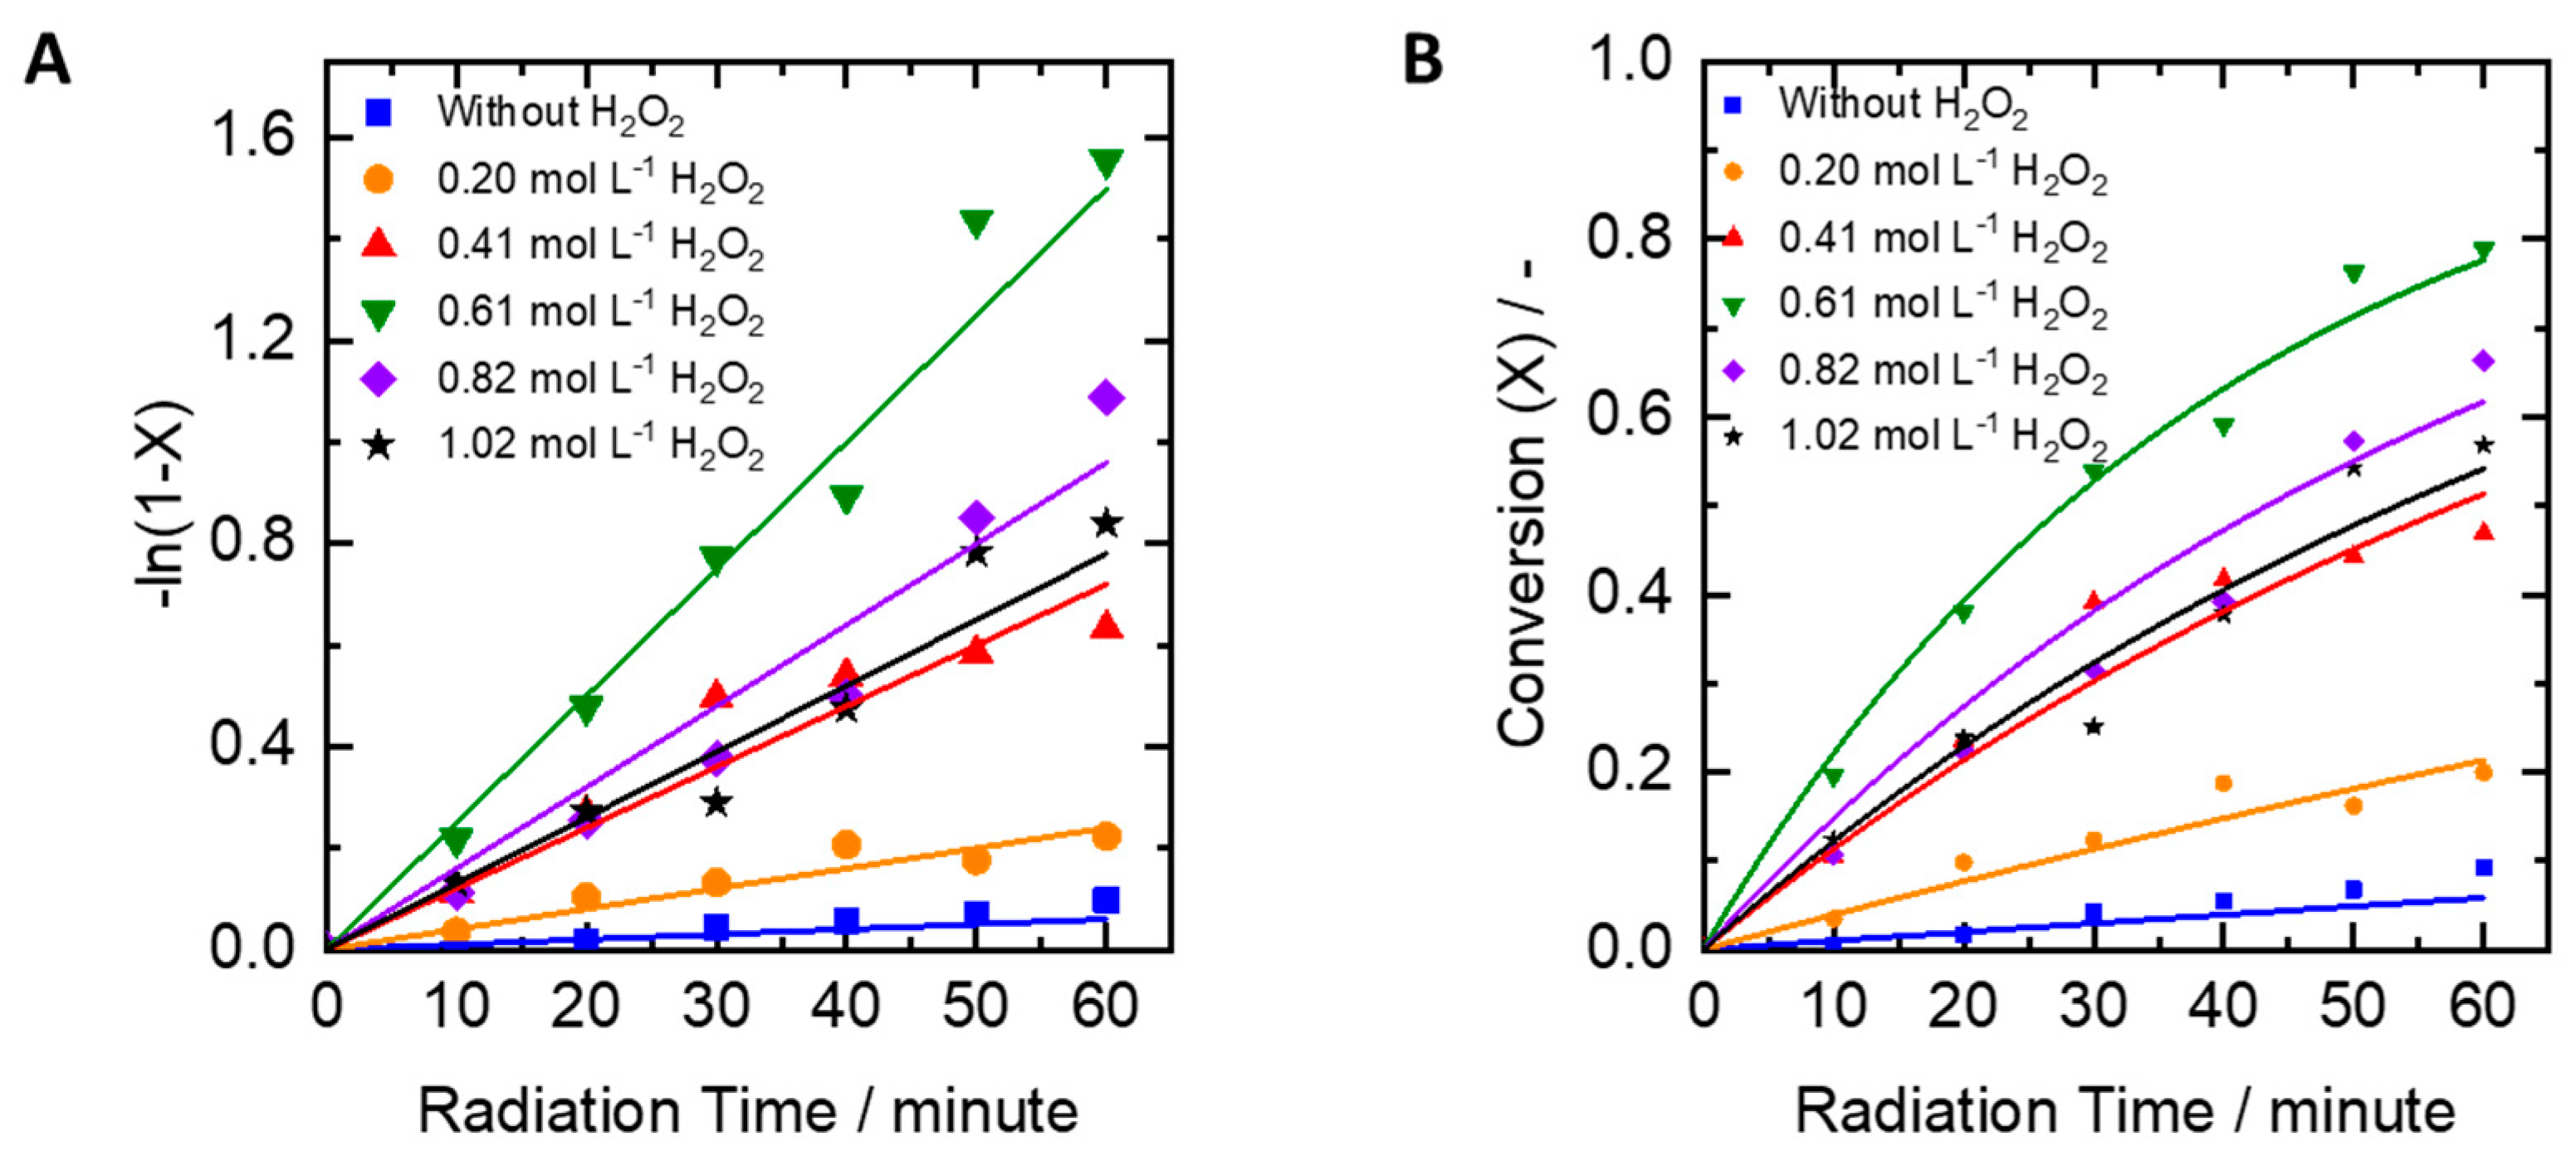
2.2. Influence of Peroxide Concentration

Figure 3a,b depicts the correlation between radiation time and the degradation of COD and BOD. It is meant to find the optimum concentration of H2O2 needed to degrade textile wastewater with the COD parameter. Without H2O2, it is shown that there is no degradation because there is no hydroxyl radical formed without addition of hydrogen peroxide. But when H2O2 is added with a concentration of 0.20 moles/L and 0.41 moles/L, there are some changes in the degradation, by about 19.97% and 46.85% in 60 min, respectively. When the concentration of H2O2 added was increased to 0.61 moles/L, there was a remarkable change of degradation that reached 78.91% in 60 min. Addition of higher concentrations of H2O2 (0.82 moles/L and 1.02 moles/L) resulted in the degradation efficiency becoming less than before, (66.35% and 56.83%, respectively).
When the addition of H2O2 exceeded a concentration of 0.61 moles/L, it did not give more degradation efficiency. On the contrary, it resulted in lower efficiency, which made the degradation percentage lower too. This is because an excessive amount of *OH can react with H2O2 to produce *HO2 which has a weaker ability to degrade organic compounds compared to hydroxyl radicals. Formation of *HO2 reduces the amount of hydroxyl radical that is produced from photolysis reaction of H2O2 and UV light, where the *OH radical formed will react with H2O2 according to Equation (2) [14].
O H + H 2 O 2 H O 2 + H 2 O
By the occurrence of this reaction, the hydroxyl radical produced is not proportional with the addition of H2O2 concentration. Therefore, it is understandable that the addition of higher H2O2 concentrations does not give a significant change of degradation percentage.
From Figure 4a, the reaction rate constant value increased with the increase of H2O2 concentration, which is because the amount of hydroxyl radical formed also increased as an oxidation agent. However, when the concentration of H2O2 exceeded 0.61 moles/L, the reaction rate constant decreased. As mentioned before, this is because an excessive amount of H2O2 concentration will form hydroperoxyl radicals (*HO2) which are less reactive compared to hydroxyl radicals and result in a decrease of its reaction rate or its oxidation rate. The values of the reaction rate constant can be seen in Table 2 and with the reaction constraints, the data are well fitted with reaction model (Figure 4b). It can be concluded from the degradation of COD and BOD that the optimum reaction rate constant is 0.0250 min−1.

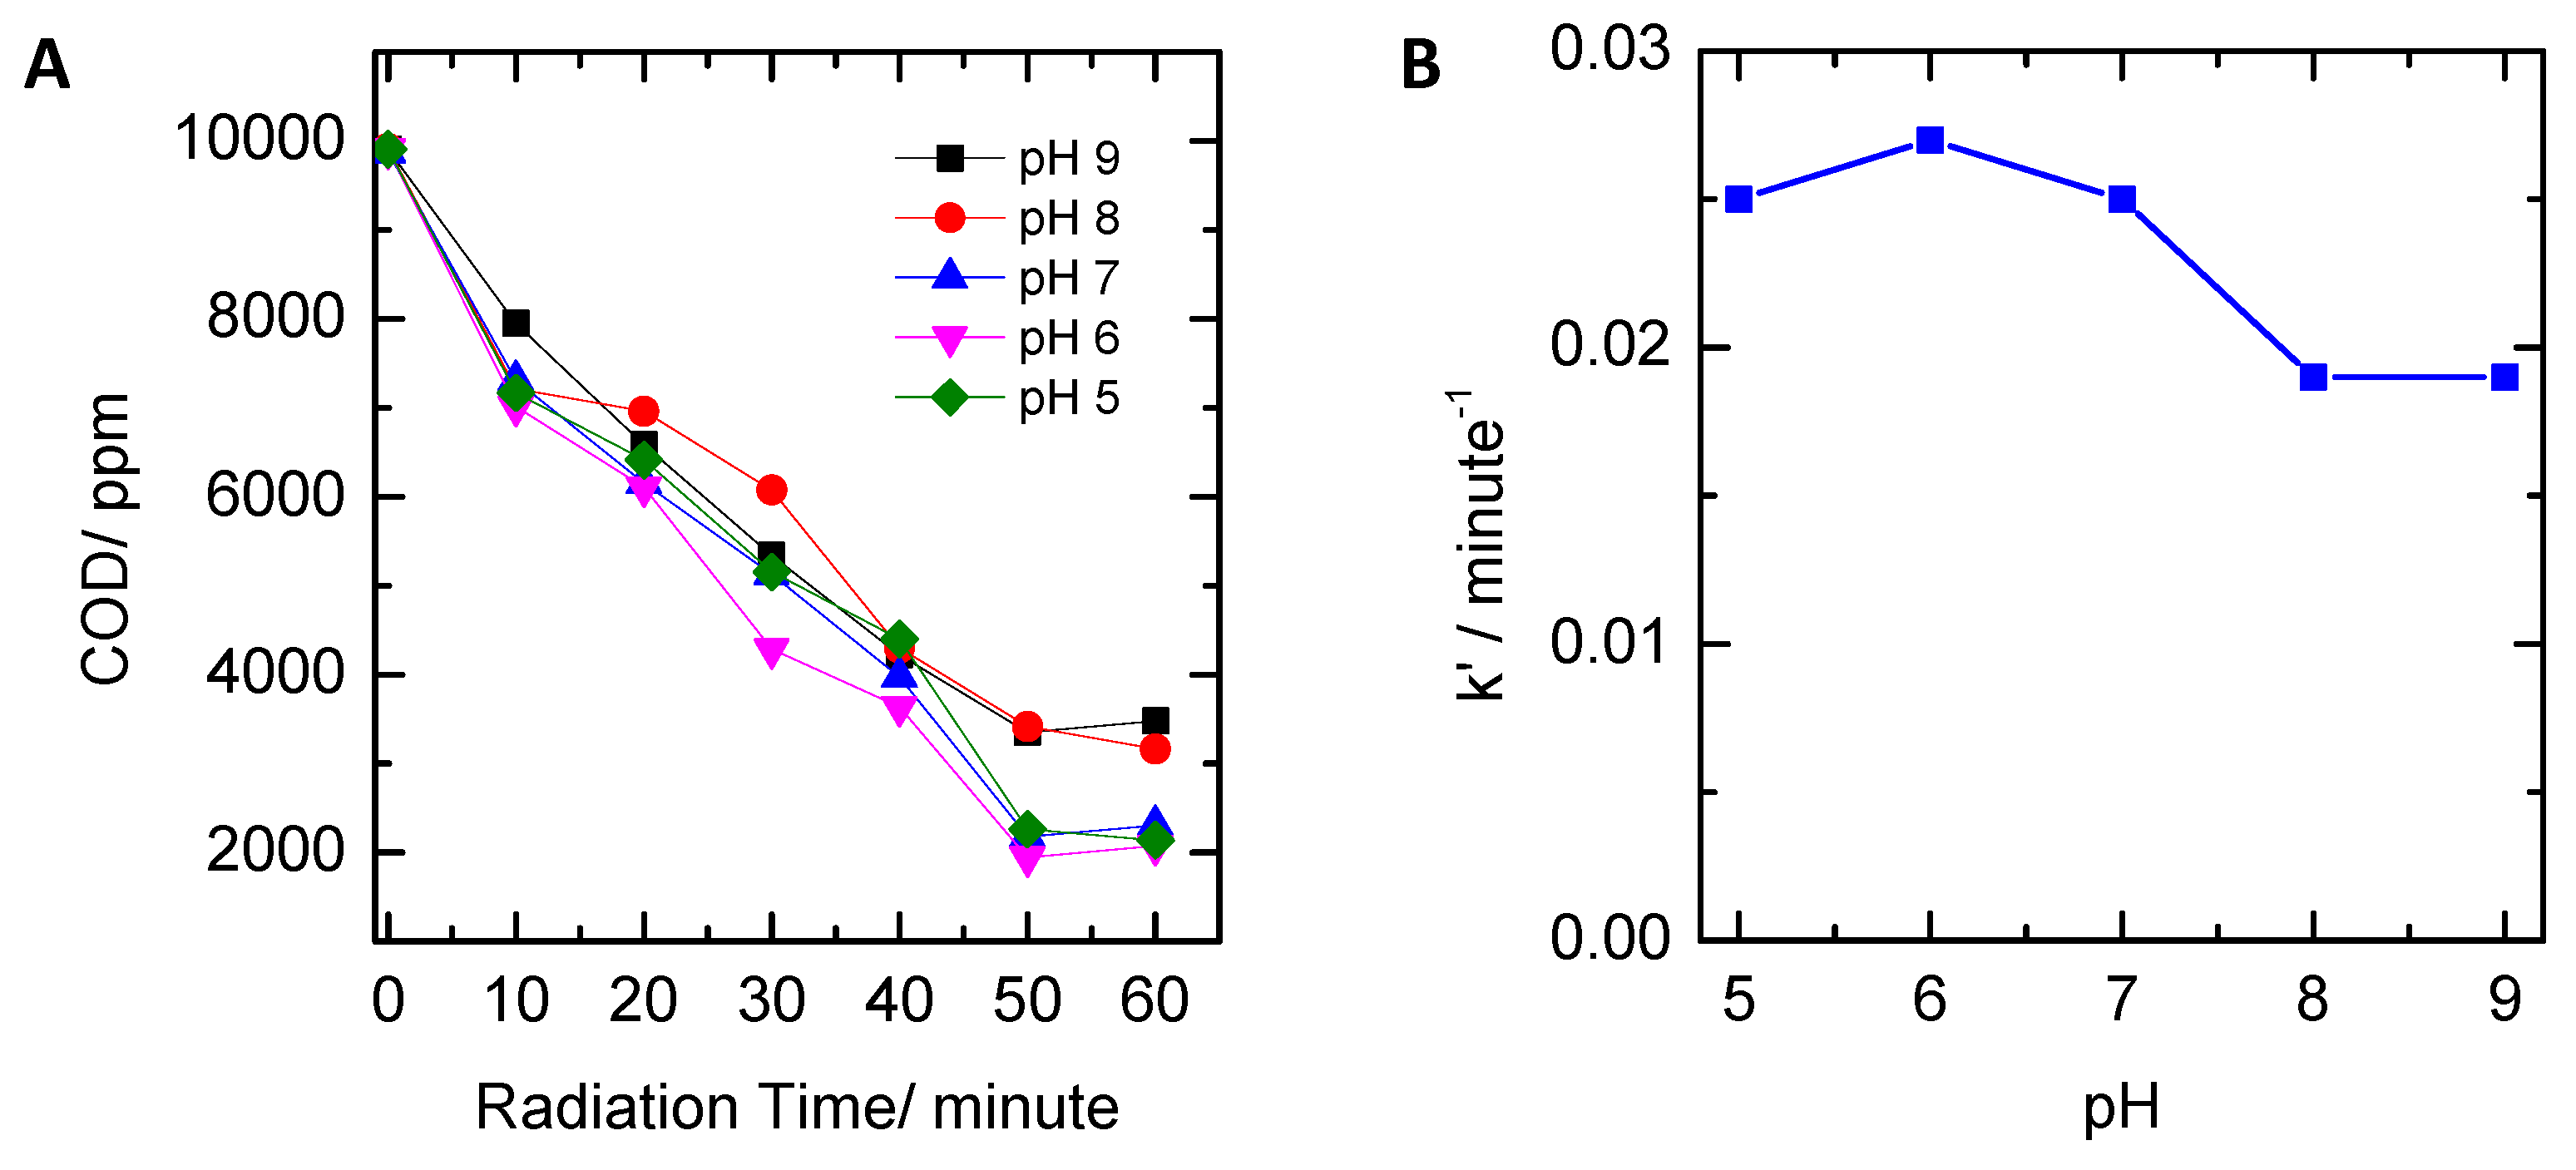
2.3. Influence of pH

To examine the effect of pH, reaction experiments were carried out in different pH levels but at a fixed concentration of H2O2 (0.61 moles/L) and lamp power (30 watts). Figure 5a shows degradation of COD over the reaction time. The results display that acidic pH is more favorable for dye degradation. As described in the literature [19], at higher pH (more OH) it is possible that hydroxyl reacts with peroxide to produce water and oxygen, hence finally, it will reduce the production of hydroxyl radicals. The reaction rate constant was evaluated based on the experimental data (see Figure 5b). In the acidic and basic regions, the values of k’ were ~0.0250 min−1 and ~0.020 min−1, respectively.

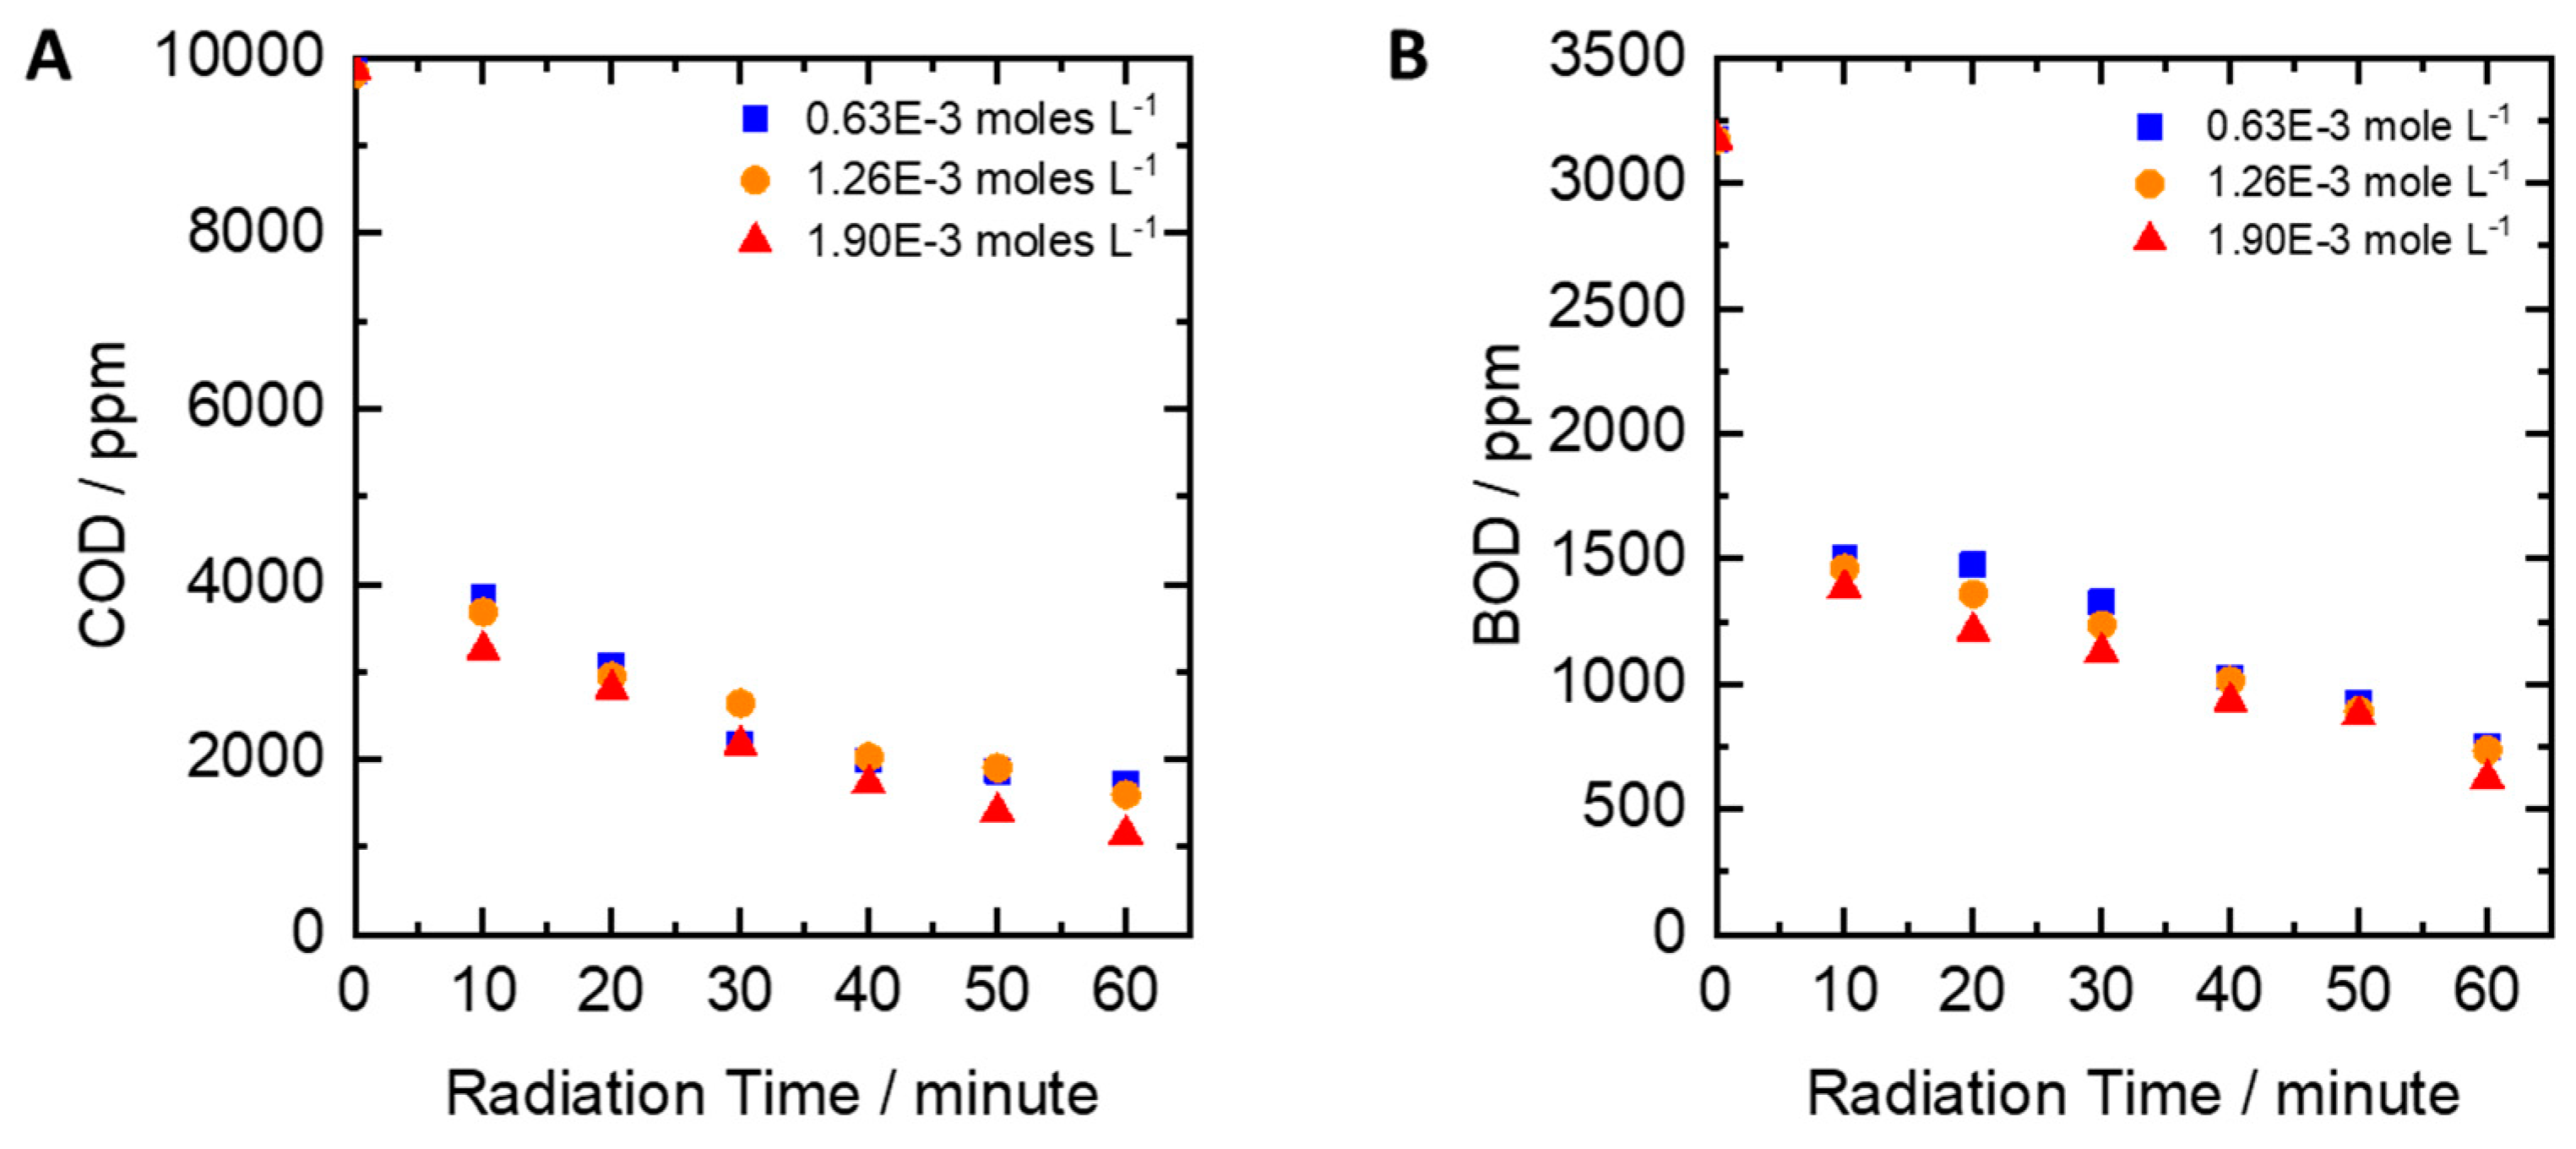
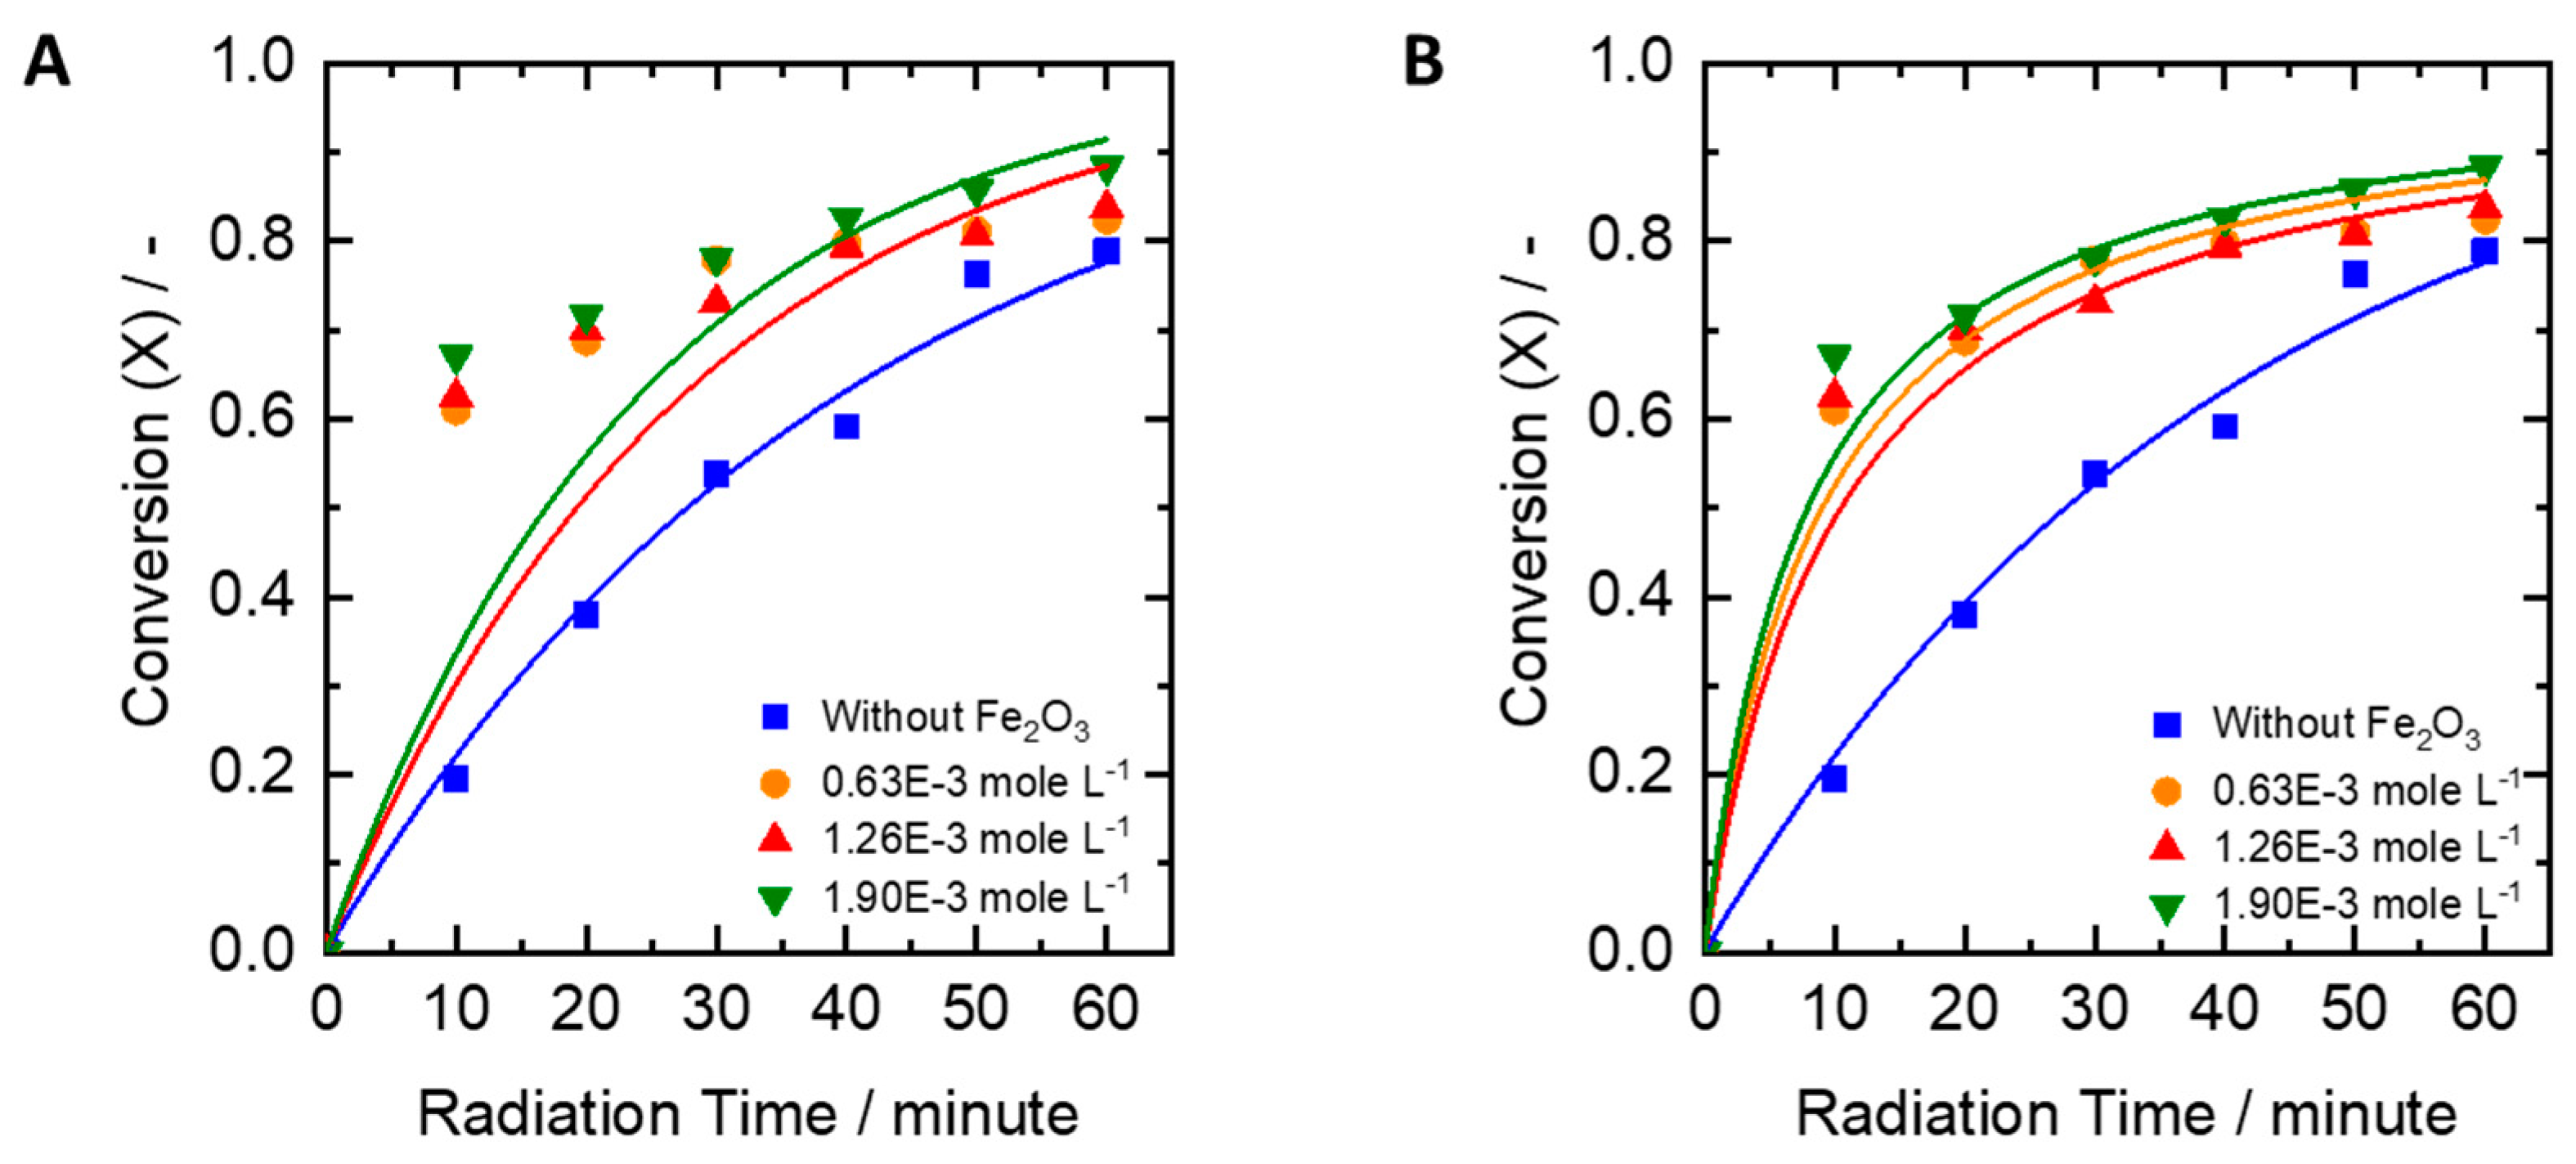
2.4. Influence of Iron Oxide Catalyst

Finally, the oxide catalyst was added to the reaction system to further promote the degradation of wastewater. The UV lamp power, H2O2 concentration, and pH were set to the optimal values of 30 watts, 0.61 moles/L and pH 6, respectively. As shown in Figure 6a,b the addition of Fe2O3 made the degradation of textile wastewater faster. The greater the concentration of Fe2O3 added, the greater was the degradation of COD and BOD. This is because Fe2O3 is functioning as a catalyst which able to decompose H2O2 to hydroxyl radicals, and it can further react with the organic compounds in the textile wastewater [20]. According to Koprivana and Kusic, the minimal concentration of Fe2+ or Fe3+ required for the Fenton reaction is in the range 3–15 mg/L (0.05–0.3 mM) [21]. Hence, the concentration of catalyst in this work is enough to decompose pollutant in wastewater.
From the data observed, it is likely that, the reaction order changes with the addition of Fe2O3 catalyst. The data were fitted with reaction order one (Figure 7a) and order two (Figure 7b). It can be seen that the order two reaction is more precise to be used in this catalytic reaction. The change of the reaction order also showed that the reaction speed was increased by adding Fe2O3 catalyst to decompose H2O2 to hydroxyl radicals. The comparison of the values of the reaction rate constants between order one and order two can be seen in Table 3.

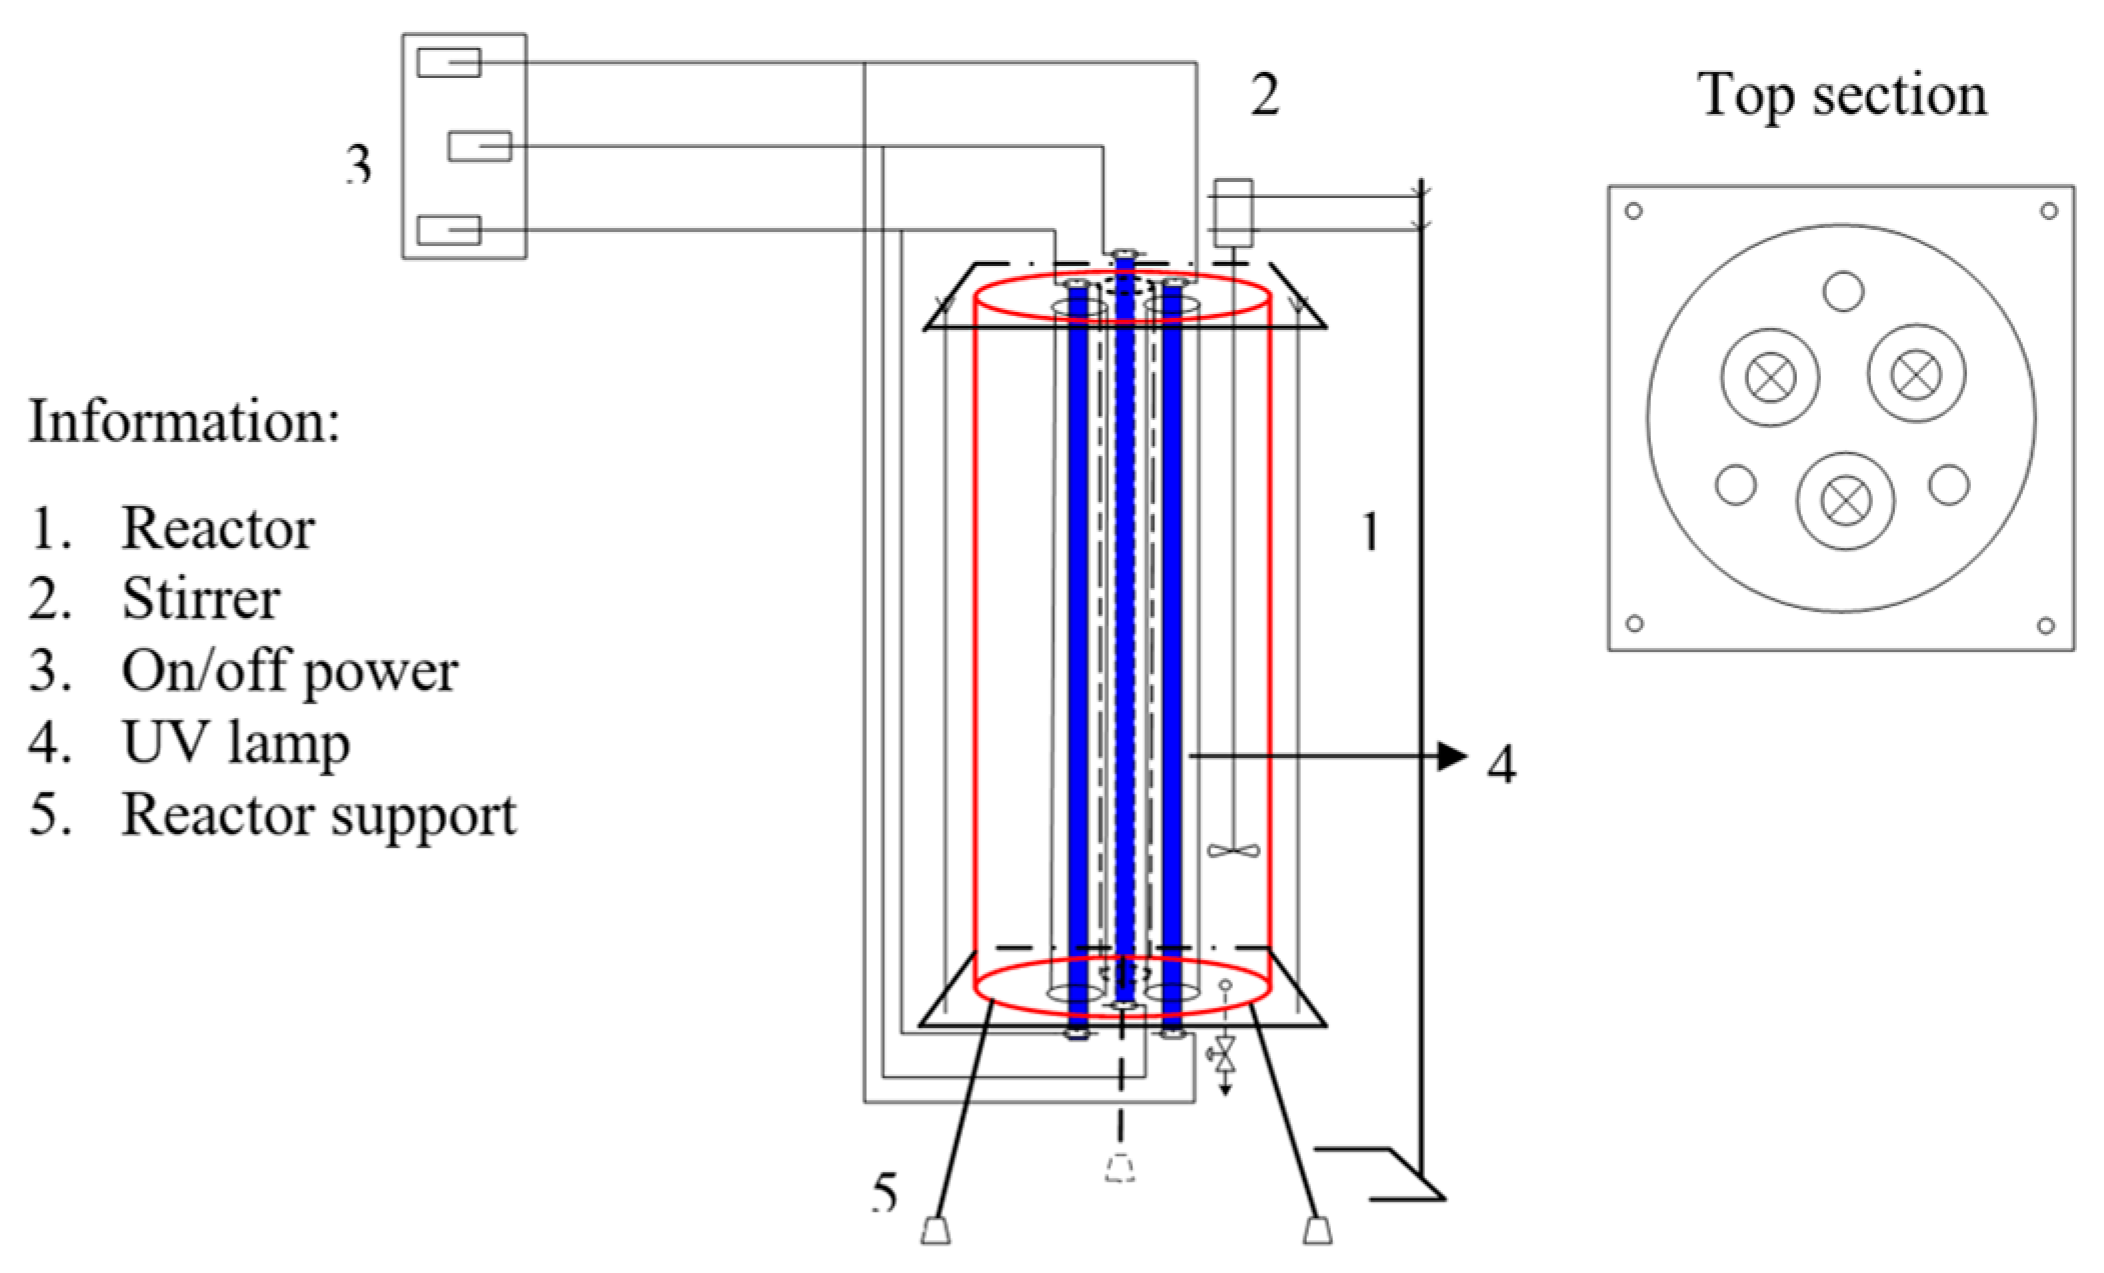
3. Materials and Methods

3.1. Wastewater-Effluent Characteristics

Wastewater was obtained from textile industry located in Bandung, Indonesia. The sulphuric coloring agent was the main component. Before given treatment, the initial conditions of the waste were measured including COD, BOD, color, and pH parameters. The parameter measurement results can be seen in Table 4.

3.2. Fenton Reactions

Up to 1000 mL of wastewater was placed in the reactor (shown in Figure 8) and then peroxide was added. The reaction was started when the UV lamp (254 nm) and stirrer were turned on. Samples were taken (as much as 50 mL) with radiation time 0, 10, 20, 30, 40, 50, and 60 min to analyze the COD and BOD. The experimental set-up and reaction conditions were based on reports of [22,23]. Variations of conditions were performed to evaluate the effects of reaction condition to degradation of dyes as follows.
(i)
Hydrogen peroxide (H2O2) concentration variation: concentrations of hydrogen peroxide were set to 0.20; 0.41; 0.61; 0.82; and 1.02 moles/L while UV lamp was set to 30 watts;
(ii)
Variation of UV lamp power: the UV lamp power was set to 10, 20, and 30 watts while peroxide concentration employed was 0.61 moles/L;
(iii)
Variation of pH: pH was changed in the range of 5–9, while peroxide concentration employed was 0.61 moles/L and UV lamp power was 30 watts. pH was measured using a pH meter (Hanna Instruments, USA);
(iv)
The effect of the reaction with Fe2O3 catalyst (phase: α-Fe2O3, particle size <5 µm, pro-analysis, from Merck, Germany): pH, peroxide concentration, and UV lamp power were set to 6, 0.61 moles/L, and 30 watts, respectively. Iron (III) oxide was added at the concentrations of 0.00063 moles/L, 0.00126 moles/L, and 0.00190 moles/L.

3.3. Sample Analyses

3.3.1. Determination of COD Values

The H2SO4 pro-COD was prepared by dissolving 1 g of AgSO4 with 100 mL of H2SO4 98%. Ferrous ammonium sulfate (FAS) 0.1 N was made by solving 39 g of (NH4)2SO4.6H2O with 20 mL of H2SO4 98% and then distilled water was added until the volume was 1 L. The ferroin indicator was prepared by dissolving 1.485 g of phenanthroline monohydrate and 0.695 g FeSO4.7H2O with distilled water until the volume was 100 mL. Two screw cap tubes were provided, one was filled with 2 mL of distilled water and the other was filled with the sample. After adding 40 mg of HgSO4, 3 mL of H2SO4 pro COD, and 1 mL of K2Cr2O7 0.25 N to the sample, it was then heated in the COD reactor for 2 h. After that, the sample was cooled down until room temperature, moved to a 100 mL Erlenmeyer flask, and three drops of ferroin indicator were added. The sample was titrated with FAS 0.1 N until an equivalent point or until the color changed to reddish brown. The volume of FAS needed was recorded.
The COD value was calculated by Equations (3) and (4).
N o r m a l i t y = m L K 2 C r 2 O 7 × 0.1 N m L F A S   n e e d e d
C O D = ( V b l a n k   t i t r a t i o n V s a m p l e   t i t r a t i o n ) × ( N F A S ) × ( 8000 ) × ( Dilution   Factor ) 2

3.3.2. Determination of BOD Values

As much as 25 mL of sample which had been incubated with Sanyo MIR-153 incubator was tested to get the initial BOD values and the pH was measured (about 6.5–7.5). If the pH was higher or lower, neutralization was performed. The temperature was set to be about 20 ± 1 °C, after the temperature was reached, as much as 40 mL of samples were put into BOD bottles with a magnetic stirrer and added with 100 mL of distilled water. Then the bottle was placed in the BOD unit, a seal was installed that had been given two drops of KOH 40%, and a cap was used to close the bottle. The BOD unit was connected to an electric current, and the motor was turned on. The screw cap of the pressure meter and the cap of the sample bottle were loosened up until about 30 min to get the temperature to 20 °C. After the temperature was reached, the screw cap of the temperature meter and the sample bottle’s cap were fastened. The mercury column was adjusted at zero points and the measurement time was started. The BOD values were determined on day five and entered in the datasheet.
The BOD was calculated by Equation (5).
B O D b = B O D a × n
BODa = readable value, mg/L
BODb = actual BOD, mg/L
n = dilution factor.

3.4. Kinetic Models

The oxidation reaction with hydrogen peroxide was performed through three steps: (i) degradation reaction of hydrogen peroxide to hydroxyl free radicals with UV ray; (ii) reaction between COD and hydroxyl free radical; and (iii) degradation of COD* to other molecules as described in Equations (6)–(8) [11].
H 2 O 2 U V O H
O H + C O D C O D + H 2 O
C O D + O 2 / H + C O 2 + H 2 O
The degradation reaction of hydrogen peroxide with UV ray is fast, so the determining reaction is the reaction between COD with hydroxyl radicals (Equation (7)). The reaction between COD and *OH is a one-way reaction. The reaction model is shown in Equation (9).
( r C O D ) = k ( C C O D ) α ( C O H ) β
With:
  • rCOD = Oxidation of COD reaction rate, (mg/L.minute)
  • K = Reaction rate constant, mg/(L.minute)/(mg/L)α+ β
  • CCOD = COD concentration, (mg/L)
  • C*OH = Hydroxy radical concentration, (mg/L)
  • α = COD concentration order reaction
  • β = Hydroxy ion concentration order reaction
By making excessive hydroxyl radicals relatively unchanged during the reaction, Equation (9) becomes Equation (10).
( r C O D ) = k ( C C O D ) α
where k’ is defined as Equation (11).
k = k ( C O H ) β k ( C O H 0 ) β
For order one reaction, or α = 1, Equation (10) becomes Equation (12).
( r C O D ) = k ( C C O D )
where, −rCOD = Oxidation of COD reaction rate, (mg/L.minute);
k’ = Reaction rate constant with C*OH relatively constant, (min−1);
CCOD = COD concentration, (mg/L).
Using mass balance and integration, we obtain Equation (13):
ln ( C C O D i C C O D 0 ) = k t
By defining conversion, x, as Equation (14):
x = C C O D 0 C C O D i C C O D 0 ,
Equation (14) is inserted to Equation (13), hence:
ln ( 1 x ) = k t
For order one reaction or α = 2, Equation (10) becomes Equation (16):
( r C O D ) = k ( C C O D ) 2
Using mass balance and integration, Equation (16) becomes Equation (17):
C C O D i = C C O D 0 1 + k t C C O D 0
where, t = oxidation time, (minute) and k’ = kinetics constant, (L.mg−1 min−1).

4. Conclusions

An oxidative method assisted by UV light irradiation was carried out to treat textile wastewater based sulphur coloring agent. It was found that the optimal conditions without iron oxide addition were an H2O2 concentration of 0.61 moles/L, UV lamp power of 30 watts, and pH 6; from which COD and BOD degradations of up to 80% and 75% (respectively) resulted. In this condition, the reaction rate followed a first order reaction with k’ of 0.0250 min−1. The addition of Fe2O3 could increase degradation rate significantly, while similar COD and BOD degradation percentages were obtained. When Fe2O3 was present, the reaction followed a second order reaction model.

Author Contributions

Conceptualization, S.S., A.P.; methodology, S.S., A.P., P.P., I.B.T.; investigation, P.P., I.B.T.; writing—original draft preparation, S.S.; writing—review and editing, T.A.; visualization, W.T.L.; supervision, S.S.

Funding

The APC was funded by Publisher and Publication Board of Universitas Gadjah Mada.

Acknowledgments

In this section you can acknowledge any support given which is not covered by the author contribution or funding sections. This may include administrative and technical support, or donations in kind (e.g., materials used for experiments).

Conflicts of Interest

The authors declare no conflict of interest.

References

  1. Doble, M.; Kumar, A. Biotreatment of Industrial Effluents; Elsevier Science: Amsterdam, Netherlands, 2005; ISBN 9780080456218. [Google Scholar]
  2. Zollinger, H. Color Chemistry: Syntheses, Properties, and Applications of Organic Dyes and Pigments; Wiley: Hoboken, NJ, USA, 2003; ISBN 9783906390239. [Google Scholar]
  3. Weber, E.J.; Stickney, V.C. Hydrolysis kinetics of Reactive Blue 19-Vinyl Sulfone. Water Res. 1993, 27, 63–67. [Google Scholar] [CrossRef]
  4. Babaei, A.A.; Kakavandi, B.; Rafiee, M.; Kalantarhormizi, F.; Purkaram, I.; Ahmadi, E.; Esmaeili, S. Comparative treatment of textile wastewater by adsorption, Fenton, UV-Fenton and US-Fenton using magnetic nanoparticles-functionalized carbon (MNPs@C). J. Ind. Eng. Chem. 2017, 56, 163–174. [Google Scholar] [CrossRef]
  5. Ariyanto, T.; Kurniasari, M.; Laksmana, W.T.; Prasetyo, I. Pore size control of polymer-derived carbon adsorbent and its application for dye removal. Int. J. Environ. Sci. Technol. 2018. [Google Scholar] [CrossRef]
  6. Lin, J.; Ye, W.; Baltaru, M.C.; Tang, Y.P.; Bernstein, N.J.; Gao, P.; Balta, S.; Vlad, M.; Volodin, A.; Sotto, A.; et al. Tight ultrafiltration membranes for enhanced separation of dyes and Na2SO4 during textile wastewater treatment. J. Membr. Sci. 2016, 514, 217–228. [Google Scholar] [CrossRef]
  7. Hassan, M.M.; Carr, C.M. A critical review on recent advancements of the removal of reactive dyes from dyehouse effluent by ion-exchange adsorbents. Chemosphere 2018, 209, 201–219. [Google Scholar] [CrossRef] [PubMed]
  8. Merzouk, B.; Gourich, B.; Sekki, A.; Madani, K.; Vial, C.; Barkaoui, M. Studies on the decolorization of textile dye wastewater by continuous electrocoagulation process. Chem. Eng. J. 2009, 149, 207–214. [Google Scholar] [CrossRef]
  9. Hu, T.-L. Removal of reactive dyes from aqueous solution by different bacterial genera. Water Sci. Technol. 1996, 34, 89–95. [Google Scholar]
  10. Martins, A.F. Advanced oxidation processes applied to effluent streams from an agrochemical industry. Pure Appl. Chem. 1998, 70, 2271–2279. [Google Scholar] [CrossRef] [Green Version]
  11. Munter, R. Advanced oxidation processes current status and prospect. Proc. Est. Acad. Sci. Chem 2001, 50, 59–80. [Google Scholar]
  12. Munoz, M.; Mora, F.J.; de Pedro, Z.M.; Alvarez-Torrellas, S.; Casas, J.A.; Rodriguez, J.J. Application of CWPO to the treatment of pharmaceutical emerging pollutants in different water matrices with a ferromagnetic catalyst. J. Hazard. Mater. 2017, 331, 45–54. [Google Scholar] [CrossRef] [PubMed]
  13. Ajmal, A.; Majeed, I.; Malik, R.N.; Idriss, H.; Nadeem, M.A. Principles and mechanisms of photocatalytic dye degradation on TiO2 based photocatalysts: A comparative overview. RSC Adv. 2014, 4, 37003–37026. [Google Scholar] [CrossRef]
  14. Schrank, S.G.; dos Santos, J.N.R.; Souza, D.S.; Souza, E.E.S. Decolourisation effects of Vat Green 01 textile dye and textile wastewater using H2O2/UV process. J. Photochem. Photobiol. A Chem. 2007, 186, 125–129. [Google Scholar] [CrossRef]
  15. Wang, Q.; Pang, W.; Mao, Y.; Sun, Q.; Zhang, P.; Ke, Q.; Yu, H.; Dai, C.; Zhao, M. Study of the degradation of trimethoprim using photo-Fenton oxidation technology. Water (Switzerland) 2019, 11, 207. [Google Scholar] [CrossRef]
  16. Vorontsov, A.V. Advancing Fenton and photo-Fenton water treatment through the catalyst design. J. Hazard. Mater. 2019, 372, 103–112. [Google Scholar] [CrossRef] [PubMed]
  17. Wang, J.L.; Xu, L.J. Advanced oxidation processes for wastewater treatment: Formation of hydroxyl radical and application. Crit. Rev. Environ. Sci. Technol. 2012, 42, 251–325. [Google Scholar] [CrossRef]
  18. Babuponnusami, A.; Muthukumar, K. A review on Fenton and improvements to the Fenton process for wastewater treatment. J. Environ. Chem. Eng. 2014, 3, 557–572. [Google Scholar] [CrossRef]
  19. Shu, H.Y.; Hunag, C.R.; Chang, M.C. Decolorization of mono-azo dyes in wastewater by advanced oxidation process: a case study of acid red 1 and acid yellow 23. Chemosphere 1994, 29, 2597–2607. [Google Scholar] [CrossRef]
  20. Amelia, S.; Sediawan, W.B.; Prasetyo, I.; Munoz, M.; Ariyanto, T. Role of the pore structure of Fe/C catalysts on heterogeneous Fenton oxidation. J. Environ. Chem. Eng. 2019, 102921. (In Press) [Google Scholar] [CrossRef]
  21. Natalija Koprivance, H.K. AOP as an effective tool for the mineralization of hazardous organic pollutants in colored wastewater; chemical and photochemical processes. In Hazardous Materials and Wastewater: Treatment, Removal and Analysis; Lewinsky, A.A., Ed.; Nova Science Publishers Inc.: New York, NY, USA, 2007; pp. 149–199. ISBN 1-60021-257-3. [Google Scholar]
  22. Tanyong, I.B. Penurunan kadar chemical oxygen demand limbah rhodamin B. Bachelor Thesis, Universitas Gadjah Mada, Yogyakarya, Indonesia, 31 January 2012. [Google Scholar]
  23. Paesal, P. Studi degradasi limbah cair industri tekstil dengan menggunakan metode proses oksidasi lanjut. Master’s Thesis, Universitas Gadjah Mada, Yogyakarta, Indonesia, 22 August 2008. [Google Scholar]
Figure 1. (A) Chemical oxygen demand (COD) and (B) biological oxygen demand (BOD) degradations of textile wastewater as functions of UV lamp power and irradiation time.
Catalysts 09 00509 g001
Figure 2. (A) Correlation of −ln(1 − x) and reaction time in UV lamp power variation. (B) Data fitted with a reaction model in the case of UV lamp power variation. Concentration of peroxide: 0.61 moles/L solution, pH 9.
Catalysts 09 00509 g002
Figure 3. (A) COD and (B) BOD degradation of textile wastewater with concentration of hydrogen peroxide variation.
Catalysts 09 00509 g003
Figure 4. (A) Correlation of −ln(1 − x) and reaction time in concentration of hydrogen peroxide variation. (B) Data fitted with reaction model in the case of peroxide variation. UV lamp power: 30 watts.
Catalysts 09 00509 g004
Figure 5. (A) Effects of pH in the degradation of COD and (B) reaction rate constant evaluated from experiment when varying pH of solutions.
Catalysts 09 00509 g005
Figure 6. (A) COD and (B) BOD degradation of textile wastewater with concentration of iron (III) oxide catalyst variation. Conditions: pH 6, 0.61 moles/L concentration of H2O2, and 30-watt lamp power.
Catalysts 09 00509 g006
Figure 7. Fitting conversion data with reaction model order one (A) and order two (B). Conditions: pH 6, 0.61 moles/L concentration of H2O2, and 30-watt lamp power.
Catalysts 09 00509 g007
Figure 8. Scheme of reactor to perform textile wastewater degradation by peroxide oxidation assisted by UV light irradiation. Reactor dimensions: 32 cm length, 9 cm diameter, and 1.2 L capacity. Intensity of UV light: 35 watt/m2.
Catalysts 09 00509 g008
Table 1. Kinetic parameters as a function of UV lamp power variation.
UV Lamp Power, wattk’, min−1
100.0070
200.0100
300.0250
Table 2. Kinetic parameters of hydrogen peroxide concentration variation.
Hydrogen Peroxide Concentration, moles/Lk’, min−1
00.0010
0.20.0040
0.410.0120
0.610.0250
0.820.0160
1.020.0130
Table 3. Kinetic parameter of iron (III) oxide concentration variation.
Iron (III) Oxide Concentration, moles/LFirst Order
k’, min−1
Second Order
k’, L. (mg·min)−1
6 × 10−40.02541.12 × 10−5
1 × 10−30.02559.71 × 10−6
2 × 10−30.04101.28 × 10−5
Table 4. Initial characteristics of sulphuric coloring agent of the textile industry.
No.ParameterValue
1Color (TCU)47,000
2COD (mg/L)9906
3BOD5 (mg/L)3175
4pH9

